SANDIA REPORT SAND2005-3173 Unlimited Release Printed June 2005 Mechanical Properties of Thermal Protection System Materials Moo Y. Lee, John H. Hofer, David R. Bronowski and Robert D. Hardy Prepared by Sandia National Laboratories Albuquerque, New Mexico 87185 Sandia is a multiprogram laboratory operated by Sandia Corporation, a Lockheed Martin Company, for the United States Department of Energy’s National Nuclear Security Administration under Contract DE-AC04-94AL85000. Approved for public release; further dissemination unlimited
Transcript
SANDIA REPORT
SAND2005-3173 Unlimited Release Printed June 2005 Mechanical Properties of Thermal Protection System Materials Moo Y. Lee, John H. Hofer, David R. Bronowski and Robert D. Hardy Prepared by Sandia National Laboratories Albuquerque, New Mexico 87185 Sandia is a multiprogram laboratory operated by Sandia Corporation, a Lockheed Martin Company, for the United States Department of Energy’s National Nuclear Security Administration under Contract DE-AC04-94AL85000. Approved for public release; further dissemination unlimited
Issued by Sandia National Laboratories, operated for the United States Department of Energy by Sandia Corporation.
NOTICE: This report was prepared as an account of work sponsored by an agency of the United States Government. Neither the United States Government, nor any agency thereof, nor any of their employees, nor any of their contractors, subcontractors, or their employees, make any warranty, express or implied, or assume any legal liability or responsibility for the accuracy, completeness, or usefulness of any information, apparatus, product, or process disclosed, or represent that its use would not infringe privately owned rights. Reference herein to any specific commercial product, process, or service by trade name, trademark, manufacturer, or otherwise, does not necessarily constitute or imply its endorsement, recommendation, or favoring by the United States Government, any agency thereof, or any of their contractors or subcontractors. The views and opinions expressed herein do not necessarily state or reflect those of the United States Government, any agency thereof, or any of their contractors.
Printed in the United States of America. This report has been reproduced directly from the best available copy. Available to DOE and DOE contractors from
U.S. Department of Energy Office of Scientific and Technical Information P.O. Box 62 Oak Ridge, TN 37831 Telephone: (865) 576-8401 Facsimile: (865) 576-5728 E-Mail: [email protected] ordering: http://www.doe.gov/bridge
Available to the public from
U.S. Department of Commerce National Technical Information Service 5285 Port Royal Rd. Springfield, VA 22161 Telephone: (800) 553-6847 Facsimile: (703) 605-6900 E-Mail: [email protected] order: http://www.ntis.gov/help/ordermethods.asp?loc=7-4-0#online
SAND 2005-3173 Unlimited Release Printed June 2005
Mechanical Properties of Thermal
Protection System Materials
Moo Y. Lee, John H. Hofer, David R. Bronowski and Robert D. Hardy
Geomechanics Department Sandia National Laboratories
P.O. Box 5800 Albuquerque, NM 87185-0751
ABSTRACT
An experimental study was conducted to measure the mechanical properties of the Thermal Protection System (TPS) materials used for the Space Shuttle. Three types of TPS materials (LI-900, LI-2200, and FRCI-12) were tested in “in-plane” and “out-of-plane” orientations. Four types of quasi-static mechanical tests (uniaxial tension, uniaxial compression, uniaxial strain, and shear) were performed under low (10-4 to 10-3/s) and intermediate (1 to 10/s) strain rate conditions. In addition, split Hopkinson pressure bar tests were conducted to obtain the strength of the materials under a relatively higher strain rate (~102 to 103/s) condition. In general, TPS materials have higher strength and higher Young’s modulus when tested in “in-plane” than in “through-the-thickness” orientation under compressive (unconfined and confined) and tensile stress conditions. In both stress conditions, the strength of the material increases as the strain rate increases. The rate of increase in LI-900 is relatively small compared to those for the other two TPS materials tested in this study. But, the Young’s modulus appears to be insensitive to the different strain rates applied. The FRCI-12 material, designed to replace the heavier LI-2200, showed higher strengths under tensile and shear stress conditions. But, under a compressive stress condition, LI-2200 showed higher strength than FRCI-12. As far as the modulus is concerned, LI-2200 has higher Young’s modulus both in compression and in tension. The shear modulus of FRCI-12 and LI-2200 fell in the same range.
3
ACKNOWLEDGEMENTS The authors appreciate the support of Paul Parker, Joel Slenk, and Jeremy Brand of the Boeing Company for providing us valuable information on the properties of the TPS materials. The authors also thank Larry Costin and Tom Pfeifle for their managerial support.
4
Table of Contents 1. Introduction...................................................................................................................................9 2. Uniaxial Tension Test (Quasi-static and Intermediate Strain Rates)............................................10
3. Uniaxial Compression Test (Quasi-static and Intermediate Strain Rates)....................................16
4. Shear Test (Quasi-static and intermediate Strain Rates)...............................................................21 5. Uniaxial Strain Compression Test (Quasi-static Strain Rate).......................................................27 6. Dynamic Strain Rate Compression Testing using the Split Hopkinson Pressure Bar..................31 7. Summary and Conclusions ...........................................................................................................36 References..........................................................................................................................................37 Appendix A........................................................................................................................................38 Summary of Uniaxial Tension and Compression Test Results Appendix B ........................................................................................................................................42 Summary of Shear Test Results Appendix C ........................................................................................................................................46 Summary of Uniaxial Strain Compression (or “Compression-in-a-box”) Test Results Appendix D........................................................................................................................................48 Summary of Split Hopkinson Pressure Bar Test Results Appendix E ........................................................................................................................................52 Effects of Strain Rates on the Strength and the Young’s Modulus of the TPS Materials
5
Figures Figure 1. Schematic of the tension test specimen provided by Boeing (All dimensions are in
inches.) ...............................................................................................................................11 Figure 2. Typical uniaxial tension test set-up with pivoting universal joints connected to both
ends of the end-caps...........................................................................................................12 Figure 3. An LVDT directly mounted on the side of the specimen to measure the axial
displacement of the specimen. Two LVDTs (an LVDT is on opposite side of the specimen) are aligned in parallel with the loading axis using the “V-groove” of the base plates. .......................................................................................................................12
Figure 4. A tensile failure surface of the specimen perpendicular to the loading axis. Also shown
are two cores of the LVDTs mounted on the specimen along the loading axis.................13 Figure 5. Stress-strain plots obtained during the uniaxial tension test for the FRCI-12-IP3-Q
specimen. The axial stress is plotted against the axial (εa) strains obtained from LVDT-1, LVDT-2, and the average of those two results. ...........................................................13
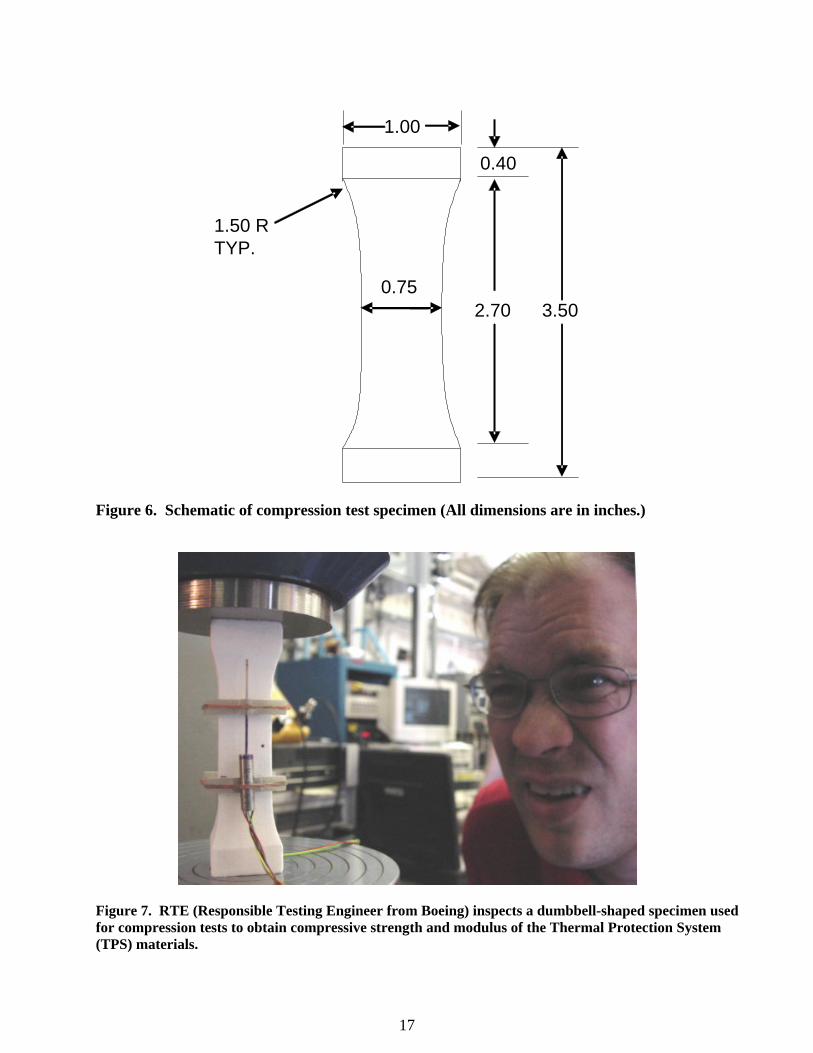
Figure 6. Schematic of compression test specimen (All dimensions are in inches.) ........................17 Figure 7. A dumbbell-shaped specimen used for compression tests to obtain compressive
strength and modulus of the Thermal Protection System (TPS) materials .......................17 Figure 8. Two LVDTs mounted on the specimen during uniaxial compression testing. ..................18 Figure 9. Stress-strain plot obtained during the unconfined uniaxial compression test for the LI-
2200-CIP2-Q specimen. The axial stress (σa) is plotted against axial (εa) strains............18 Figure 10. Schematic of the shear test specimen (All dimensions are in inches.) ............................22 Figure 11. Orientations of “weak-plane” and “strong-plane” with respect to “in-plane” and
“through-the-thickness”.. .................................................................................................22 Figure 12. Typical shear test set-up with two pivoting shear fixtures and two LVDTs measuring
relative displacement of shear blocks. .............................................................................23 Figure 13. An LVDT mounted on the aluminum blocks to measure the relative shear
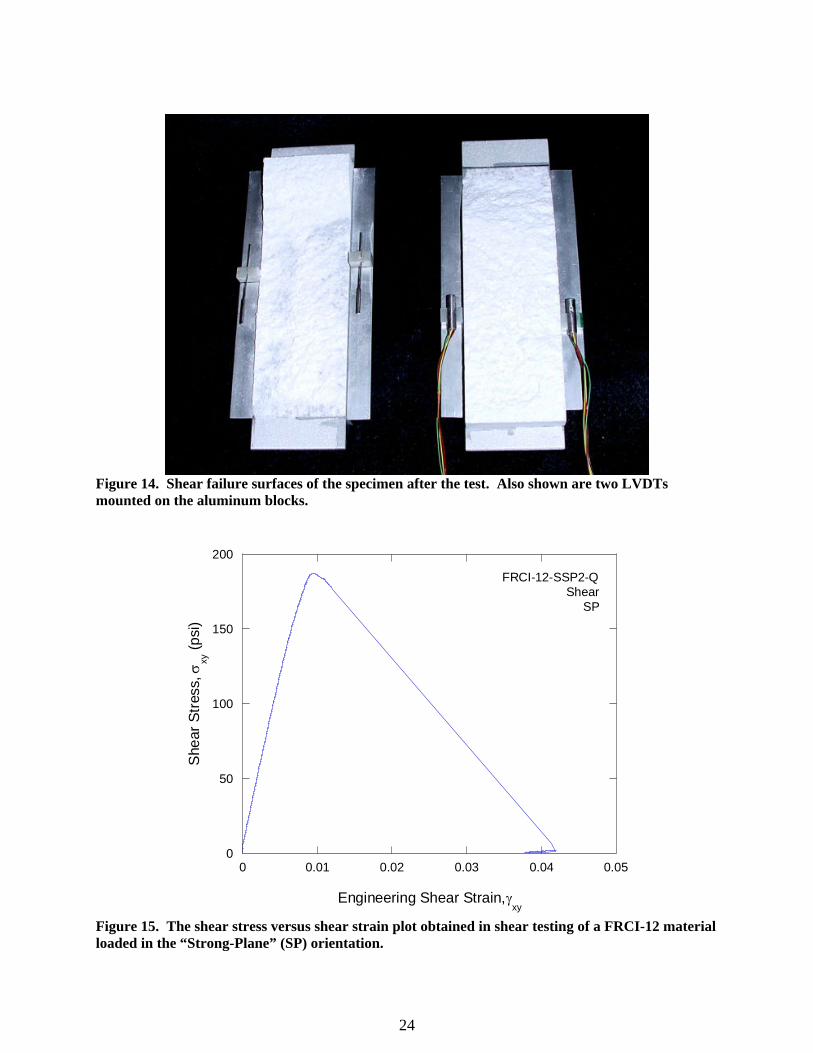
displacement of the specimen along the shearing direction.............................................23 Figure 14. Shear failure surfaces of the specimen after the test. Also shown are two LVDTs
mounted on the aluminum blocks.. ..................................................................................24 Figure 15. The shear stress versus shear strain plot obtained in shear testing of a FRCI-12 ..........24
6
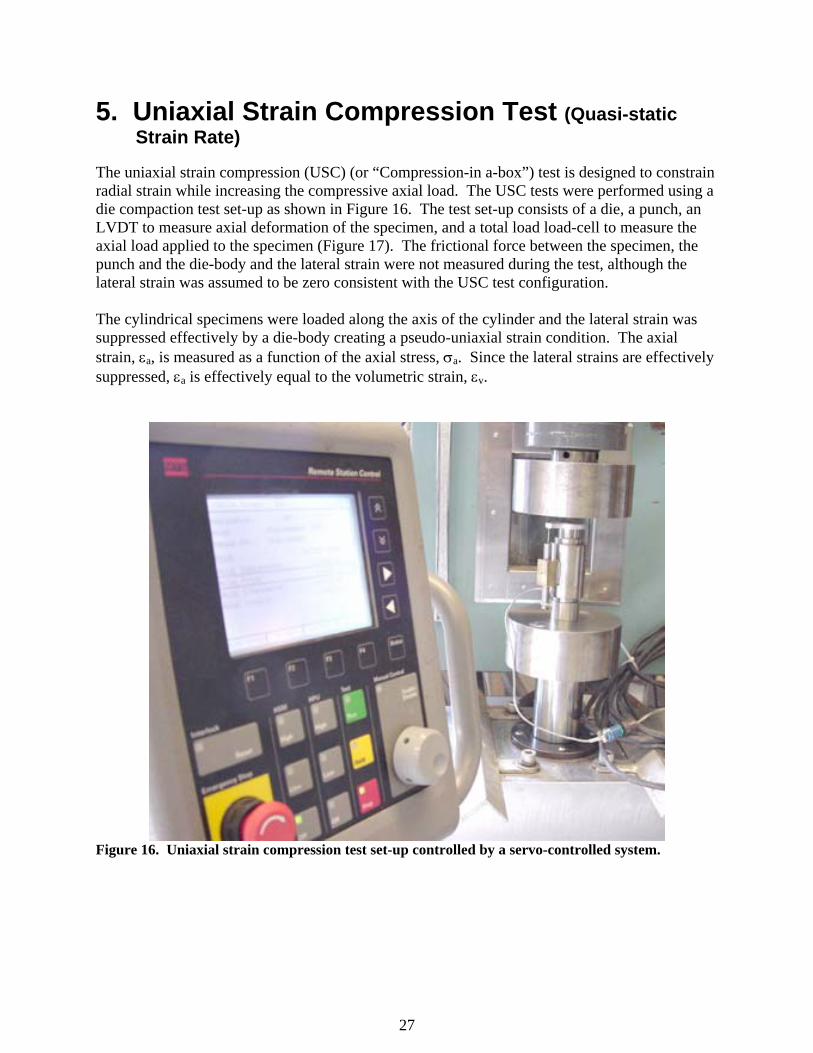
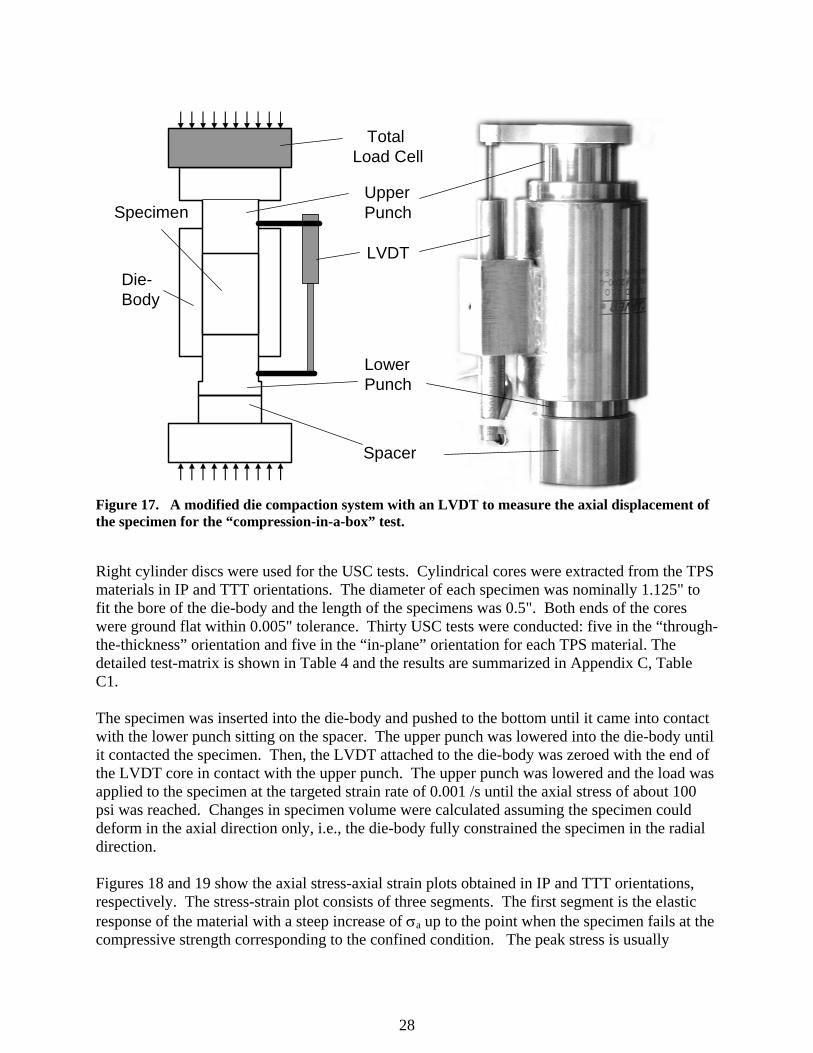
Figure 16. Uniaxial strain compression test set-up controlled by a servo-controlled system...........27 Figure 17. A modified die compaction system with an LVDT to measure the axial displacement
of the specimen for the “compression-in-a-box” test material loaded in the “Strong Plane” (SP) orientation. ...................................................................................................28
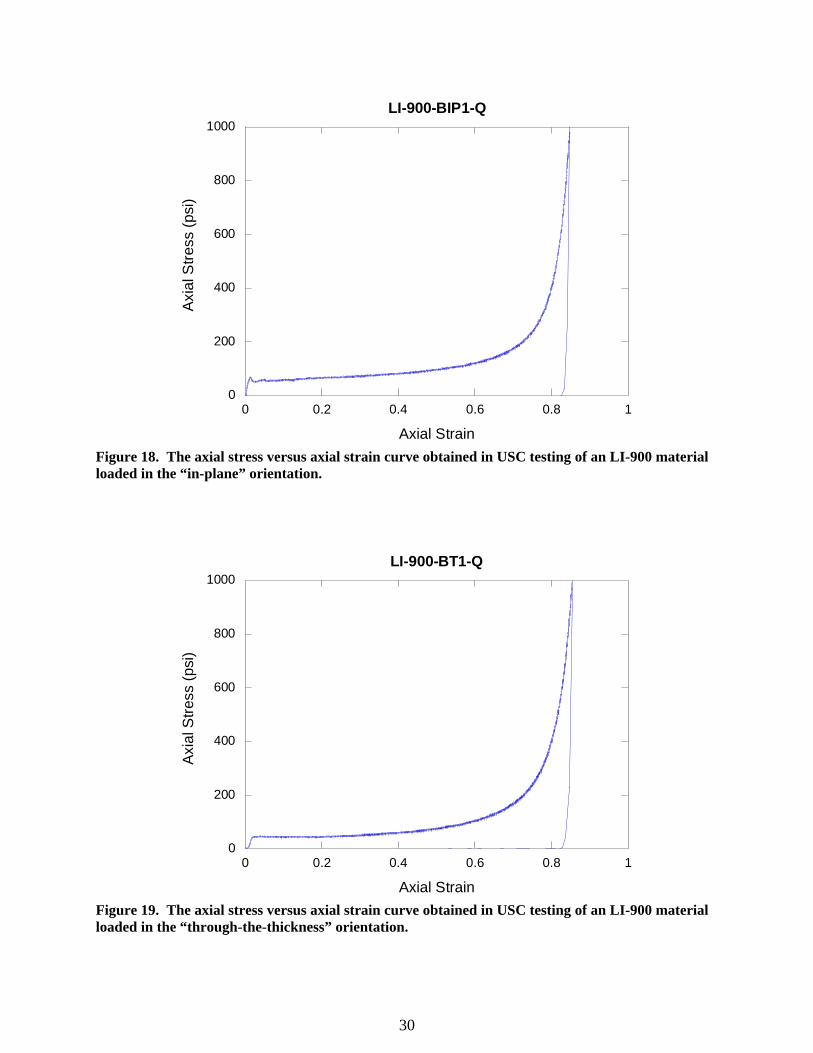
Figure 18. The axial stress versus axial strain curve obtained in USC testing of an LI-900
material loaded in the “in-plane” orientation...................................................................30 Figure 19. The axial stress versus axial strain curve obtained in USC testing of an LI-900
material loaded in the “through-the-thickness” orientation. ............................................30 Figure 20. Split Hopkinson pressure bar set-up with a calibrating load cell. ...................................31 Figure 21. Split Hopkinson pressure bar set-up with a lateral confinement ring installed over the
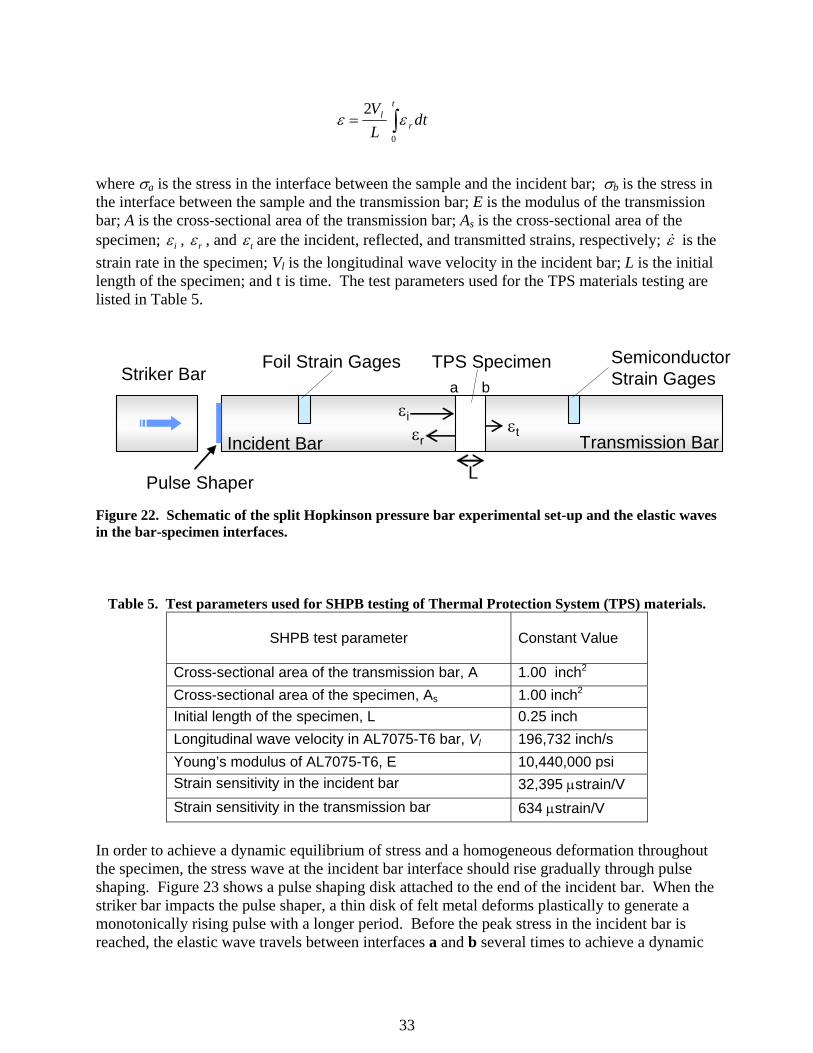
specimen. .........................................................................................................................32 Figure 22. Schematic of the split Hopkinson pressure bar experimental set-up and the elastic
waves in the bar-specimen interfaces. .............................................................................33 Figure 23. A pulse shaper disk made out of a felt metal attached to the end of the incident bar of
the split Hopkinson pressure bar where the striker bar impacts the incident bar. ...........34 Figure 24. Typical record obtained during SHPB testing of an LI-2200 specimen. ........................35 Figure 25. Typical stress – strain and strain rate-strain plots obtained during SHPB testing of an
LI-2200 specimen. ...........................................................................................................35 Figure E1. Effects of strain rates on the strength of the TPS materials under compression (x:
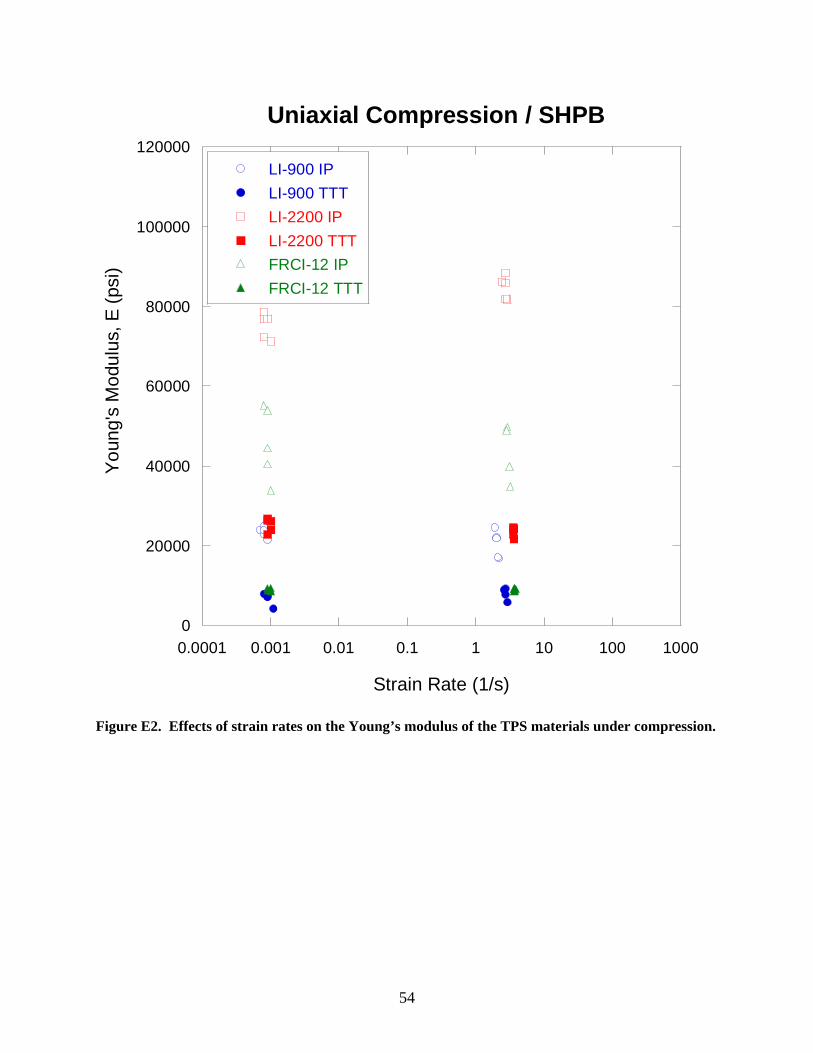
strain rate and y: compressive strength in regression equations).....................................53 Figure E2. Effects of strain rates on the Young’s modulus of the TPS materials under
compression. ....................................................................................................................54 Figure E3. Effects of strain rates on the tensile strength of the TPS materials (x: strain rate and
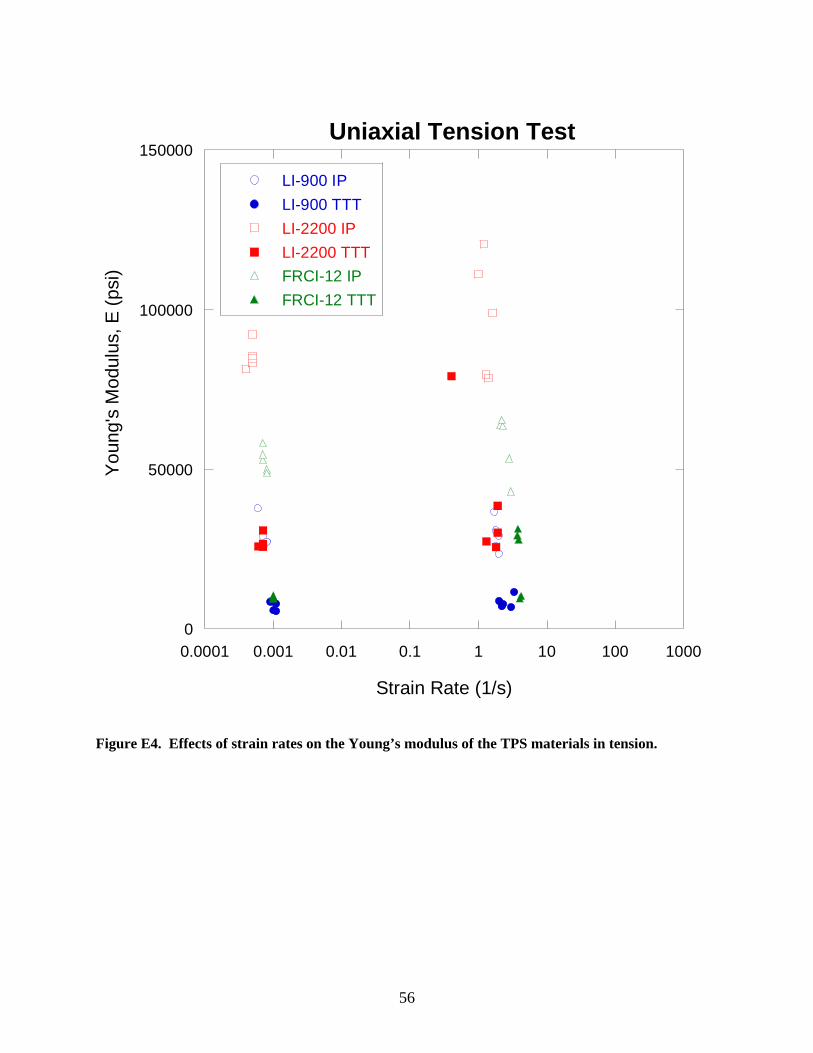
y: -tensile strength in regression equations).....................................................................55 Figure E4. Effects of strain rates on the Young’s modulus of the TPS materials in tension............56 Figure E5. Effects of strain rates on the compression strength of the TPS materials under a
confined (or uniaxial strain) condition (x: strain rate and y: compressive strength in regression equations). ......................................................................................................57
Figure E6. Effects of strain rates on the shear strength of the TPS materials...................................58 Figure E7. Effects of strain rates on the shear modulus of the TPS materials..................................59
7
Tables Table 1. Uniaxial tension test matrix for the Thermal Protection System (TPS) Materials. .........14
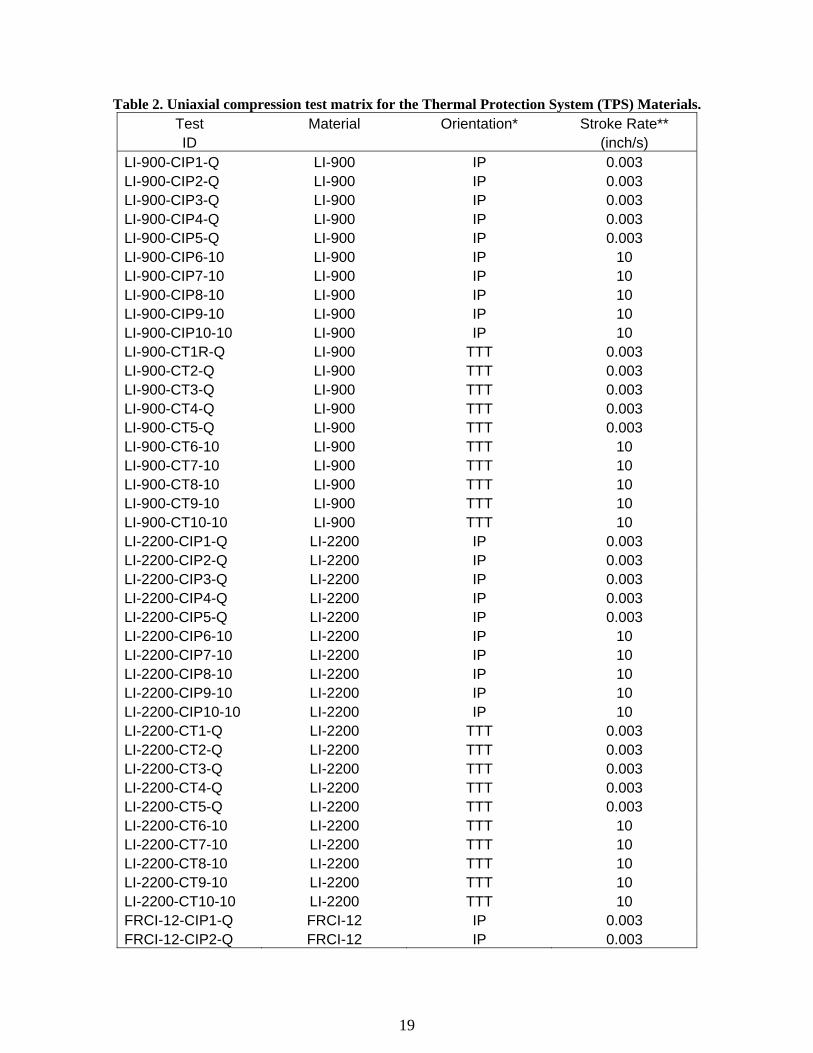
Table 2. Uniaxial compression test matrix for the Thermal Protection System (TPS) Materials..19
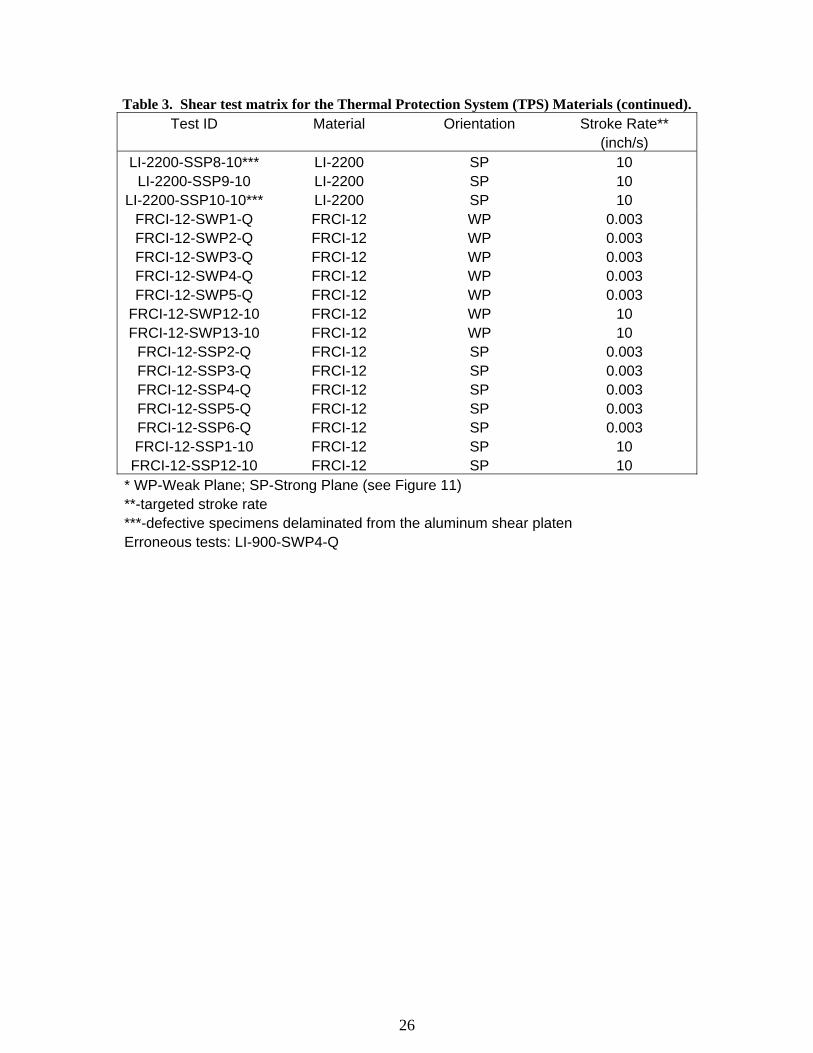
Table 3. Shear test matrix for the Thermal Protection System (TPS) Materials. ..........................25
Table 4. Compression-in-a-box test matrix for the Thermal Protection System (TPS) Materials.29
Table 5. Test parameters used for SHPB testing of the Thermal Protection System (TPS) materials...........................................................................................................................33
Table A1. Summary of uniaxial compression and tension tests for LI-900. ....................................39
Table A2. Summary of uniaxial compression and tension tests for LI-2200. ..................................40
Table A3. Summary of uniaxial compression and tension tests for FRCI-12. .................................41
Table B1. Summary of shear test results for LI-900 ........................................................................43
Table B2. Summary of shear test results for LI-2200 ......................................................................44
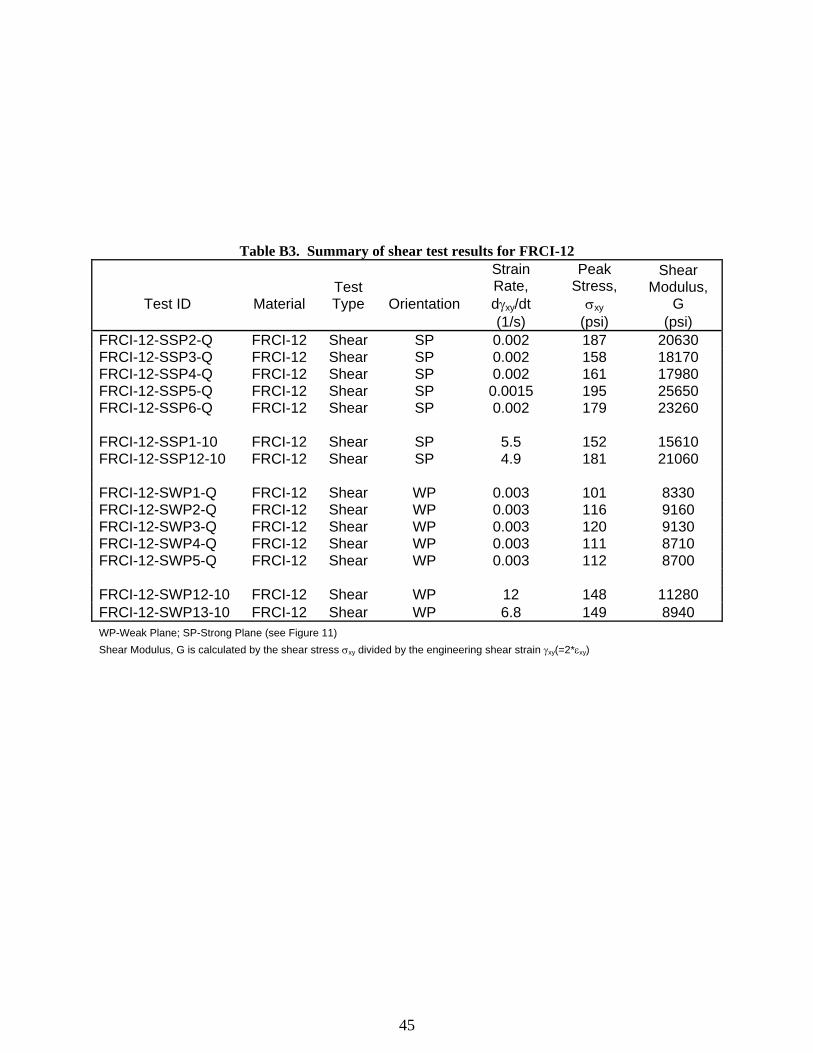
Table B3. Summary of shear test results for FRCI-12 .....................................................................45
Table C1. Summary of uniaxial strain compression (or “Compression-in-a-box”) tests for the Thermal Protection System (TPS) materials ...................................................................47
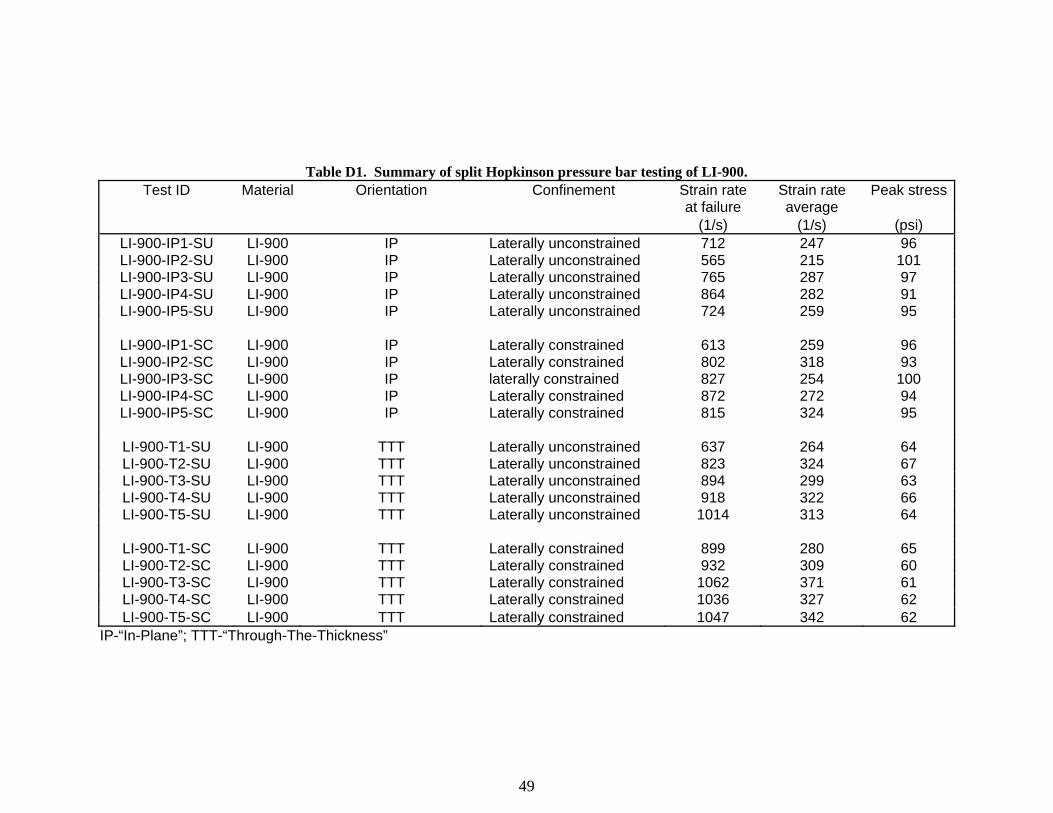
Table D1. Summary of split Hopkinson pressure bar testing of LI-900...........................................49
Table D2. Summary of split Hopkinson pressure bar testing of LI-2200.........................................50
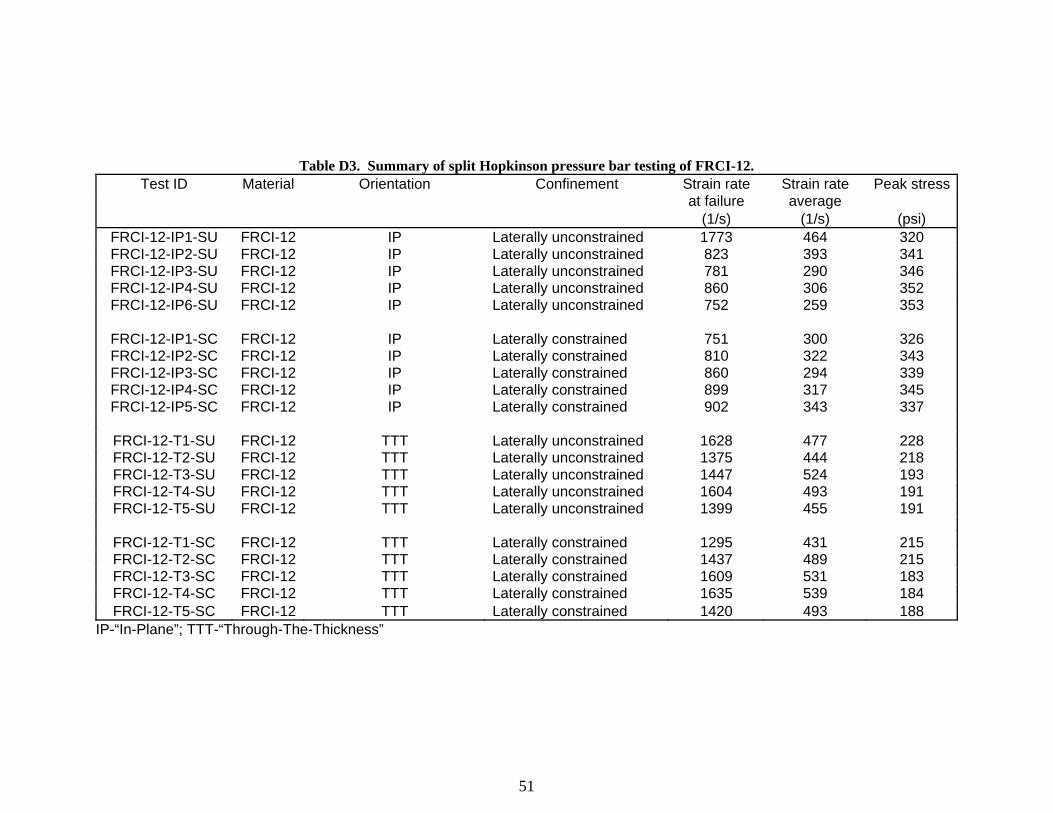
Table D3. Summary of split Hopkinson pressure bar testing of FRCI-12........................................51
8
1. Introduction NASA is currently studying the performance of the Thermal Protection System (TPS) materials in support of detailed TPS model development for the Orbiter Return to Flight Effort. This report describes an experimental study that has been completed to develop constitutive relationships for LI-900, LI-2200, and FRCI-12 tiles under different mechanical loading conditions.
The High-temperature Reusable Surface Insulation (or HRSI) tiles consist of a low-density, high-purity silica 99.8 % amorphous fiber insulation coated with a mixture of powdered tetrasilicide and borosilicate glass with a liquid carrier. The operating temperature of HRSI ranges from 1,200 to 2,300°F. Depending on the heat loading encountered during the re-entry of the orbiter into the atmosphere, the thickness of the tiles varies from one to five inches. There are also two different densities of HRSI tiles along with different thicknesses. The high-density LI-2200 (22-pcf) tiles are used in the areas such as the nose, main landing gears, external tank, and others susceptible to high heat loading. The low-density LI-900 (9-pcf) tiles are used in the areas subjected to low heat loading. The FRCI-12 tiles are made from the mixture of AB312 (alumina-borosilicate fiber) and the pure silica tile slurry. The FRCI-12 tiles are used to replace the LI-2200 tiles. The FRCI-12 tiles are designed to provide improved strength and resistance to the coating’s sensitivity cracking with a relatively lower density of 12-pcf compared to LI-2200 (NASA, 1988).
The objective of this laboratory testing program was to obtain mechanical properties of the HRSI tiles under quasi-static loading conditions so that the impact modeling effort could develop and test its models and codes using realistic parameters obtained from different tile materials under various loading conditions. The experimental programs were designed to provide the fundamental parameters necessary for the simulations and analyses of the impact of foreign objects such as foam into the HRSI tiles as well as to give insight into the failure phenomena of the TPS materials. The three types of TPS materials were tested in “In-Plane (IP)” and “Through-The-Thickness (TTT)” orientations. Four types of quasi-static mechanical tests (uniaxial tension, uniaxial compression, uniaxial strain, and shear) were performed under low (10-4 to 10-3/s) and intermediate (1 to 10 /s) strain rate conditions. In addition, the split Hopkinson pressure bar test were conducted to obtain the strength of the materials under a dynamic (~102 to 103/s) condition. For each TPS material, the mechanical properties of the material are obtained and the results are presented as functions of loading type, loading orientation, and applied strain rate.
9
2. Uniaxial Tension Test (Quasi-static and Intermediate Strain Rates)
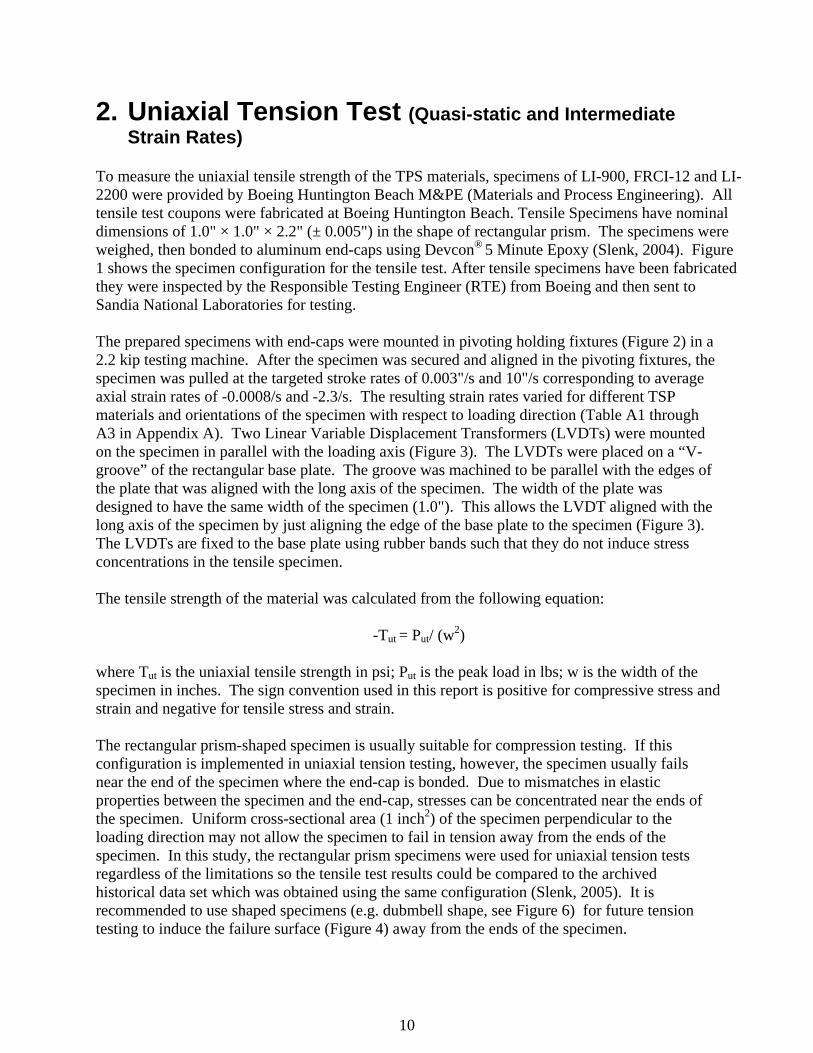
To measure the uniaxial tensile strength of the TPS materials, specimens of LI-900, FRCI-12 and LI-2200 were provided by Boeing Huntington Beach M&PE (Materials and Process Engineering). All tensile test coupons were fabricated at Boeing Huntington Beach. Tensile Specimens have nominal dimensions of 1.0" × 1.0" × 2.2" (± 0.005") in the shape of rectangular prism. The specimens were weighed, then bonded to aluminum end-caps using Devcon® 5 Minute Epoxy (Slenk, 2004). Figure 1 shows the specimen configuration for the tensile test. After tensile specimens have been fabricated they were inspected by the Responsible Testing Engineer (RTE) from Boeing and then sent to Sandia National Laboratories for testing. The prepared specimens with end-caps were mounted in pivoting holding fixtures (Figure 2) in a 2.2 kip testing machine. After the specimen was secured and aligned in the pivoting fixtures, the specimen was pulled at the targeted stroke rates of 0.003"/s and 10"/s corresponding to average axial strain rates of -0.0008/s and -2.3/s. The resulting strain rates varied for different TSP materials and orientations of the specimen with respect to loading direction (Table A1 through A3 in Appendix A). Two Linear Variable Displacement Transformers (LVDTs) were mounted on the specimen in parallel with the loading axis (Figure 3). The LVDTs were placed on a “V-groove” of the rectangular base plate. The groove was machined to be parallel with the edges of the plate that was aligned with the long axis of the specimen. The width of the plate was designed to have the same width of the specimen (1.0"). This allows the LVDT aligned with the long axis of the specimen by just aligning the edge of the base plate to the specimen (Figure 3). The LVDTs are fixed to the base plate using rubber bands such that they do not induce stress concentrations in the tensile specimen. The tensile strength of the material was calculated from the following equation:
-Tut = Put/ (w2) where Tut is the uniaxial tensile strength in psi; Put is the peak load in lbs; w is the width of the specimen in inches. The sign convention used in this report is positive for compressive stress and strain and negative for tensile stress and strain. The rectangular prism-shaped specimen is usually suitable for compression testing. If this configuration is implemented in uniaxial tension testing, however, the specimen usually fails near the end of the specimen where the end-cap is bonded. Due to mismatches in elastic properties between the specimen and the end-cap, stresses can be concentrated near the ends of the specimen. Uniform cross-sectional area (1 inch2) of the specimen perpendicular to the loading direction may not allow the specimen to fail in tension away from the ends of the specimen. In this study, the rectangular prism specimens were used for uniaxial tension tests regardless of the limitations so the tensile test results could be compared to the archived historical data set which was obtained using the same configuration (Slenk, 2005). It is recommended to use shaped specimens (e.g. dubmbell shape, see Figure 6) for future tension testing to induce the failure surface (Figure 4) away from the ends of the specimen.
10
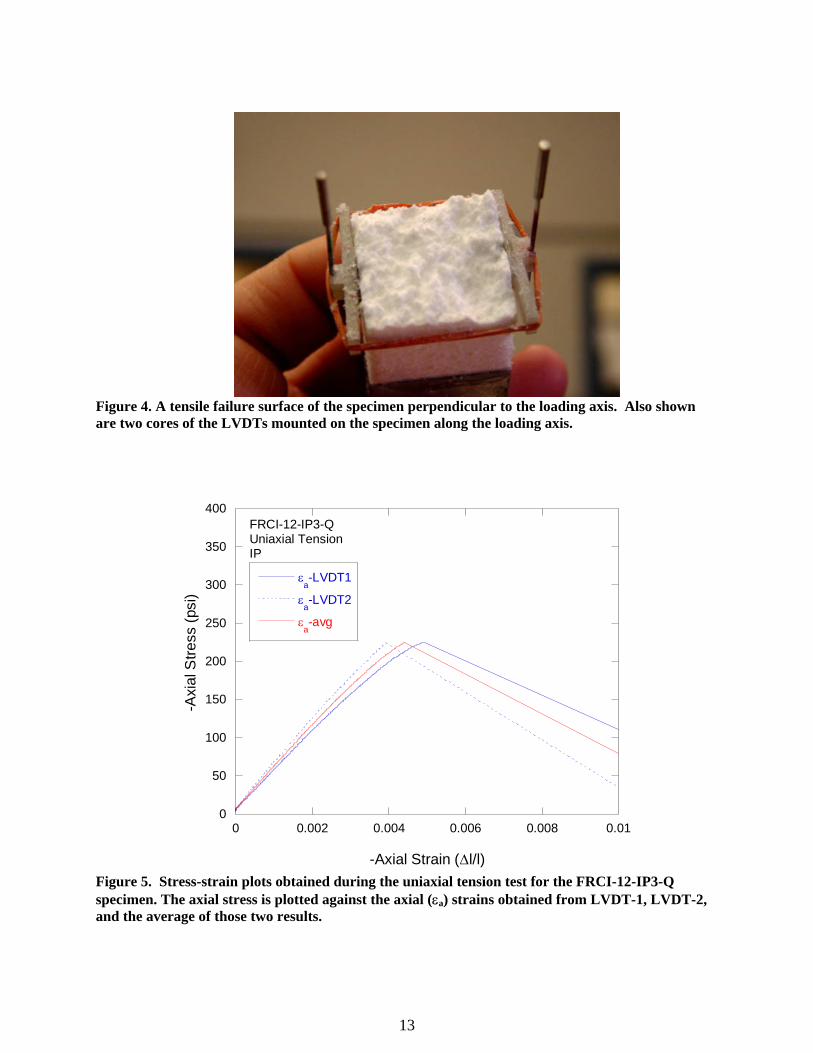
Figure 5 shows a uniaxial tension test record for a FRCI-12 sample tested at a quasi-static strain rate of -0.0007/s. The test record consists of axial stress vs. axial strain plots (LVDT-1, LVDT-2, and the average of those two shown as εa-avg). The tensile strength of the material is obtained from the peak stress and Young’s modulus is calculated from the slope of the ascending portion of the stress-strain curve. Table 1 shows the test matrix for the uniaxial tension tests. Tables A1 through A3, in Appendix A, summarize the results from the uniaxial tension tests conducted for three TPS materials in two orthogonal orientations at two different strain rates.
+
1.00
0.50
1.25
3.45
4.20
4.70
Loading Block
Loading Block
TPSTileMaterial
0.25 Diameter
Figure 1. Schematic of the tension test specimen provided by Boeing (All dimensions are in inches.)
11
Figure 2. Typical uniaxial tension test set-up with pivoting universal joints connected to both ends of the end-caps.
Figure 3. An LVDT directly mounted on the side of the specimen to measure the axial displacement of the specimen. Two LVDTs (an LVDT is on opposite side of the specimen) are aligned in parallel with the loading axis using the “V-groove” of the base plates.
12
Figure 4. A tensile failure surface of the specimen perpendicular to the loading axis. Also shown are two cores of the LVDTs mounted on the specimen along the loading axis.
0
50
100
150
200
250
300
350
400
0 0.002 0.004 0.006 0.008 0.01
εa-LVDT1
εa-LVDT2
εa-avg
-Axi
al S
tress
(psi
)
-Axial Strain (∆l/l)
FRCI-12-IP3-QUniaxial TensionIP
Figure 5. Stress-strain plots obtained during the uniaxial tension test for the FRCI-12-IP3-Q specimen. The axial stress is plotted against the axial (εa) strains obtained from LVDT-1, LVDT-2, and the average of those two results.
13
Table 1. Uniaxial tension test matrix for the Thermal Protection System (TPS) Materials. Test Material Orientation* Stroke Rate** ID (inch/s)
LI-900-IP1-Q LI-900 IP 0.003 LI-900-IP2-Q LI-900 IP 0.003 LI-900-IP3-Q LI-900 IP 0.003 LI-900-IP4-Q LI-900 IP 0.003 LI-900-IP5-Q LI-900 IP 0.003 LI-900-IP7-10 LI-900 IP 10 LI-900-IP8-10 LI-900 IP 10 LI-900-IP9-10 LI-900 IP 10 LI-900-IP10-10 LI-900 IP 10 LI-900-IP12-10 LI-900 IP 10 LI-900-T1-Q LI-900 TTT 0.003 LI-900-T2-Q LI-900 TTT 0.003 LI-900-T3-Q LI-900 TTT 0.003 LI-900-T4-Q LI-900 TTT 0.003 LI-900-T5-Q LI-900 TTT 0.003 LI-900-T7-10 LI-900 TTT 10 LI-900-T8-10 LI-900 TTT 10 LI-900-T9-10 LI-900 TTT 10 LI-900-T10-10 LI-900 TTT 10 LI-900-T11-10 LI-900 TTT 10 LI-2200-IP1-Q LI-2200 IP 0.003 LI-2200-IP3-Q LI-2200 IP 0.003 LI-2200-IP4-Q LI-2200 IP 0.003 LI-2200-IP11-Q LI-2200 IP 0.003 LI-2200-IP12-Q LI-2200 IP 0.003 LI-2200-IP6-10 LI-2200 IP 10 LI-2200-IP7-10 LI-2200 IP 10 LI-2200-IP8-10 LI-2200 IP 10 LI-2200-IP9-10 LI-2200 IP 10 LI-2200-IP10-10 LI-2200 IP 10 LI-2200-T1-Q LI-2200 TTT 0.003 LI-2200-T2-Q LI-2200 TTT 0.003 LI-2200-T3-Q LI-2200 TTT 0.003 LI-2200-T4-Q LI-2200 TTT 0.003 LI-2200-T5-Q LI-2200 TTT 0.003 LI-2200-T7-10 LI-2200 TTT 10 LI-2200-T8-10 LI-2200 TTT 10 LI-2200-T9-10 LI-2200 TTT 10 LI-2200-T10-10 LI-2200 TTT 10 LI-2200-T13-10 LI-2200 TTT 10 FRCI-12-IP2-Q FRCI-12 IP 0.003 FRCI-12-IP3-Q FRCI-12 IP 0.003
14
Table 1. Uniaxial tension test matrix for the Thermal Protection System (TPS) Materials (continued).
Test Material Orientation* Stroke Rate** ID (inch/s)
FRCI-12-IP4-Q FRCI-12 IP 0.003 FRCI-12-IP5-Q FRCI-12 IP 0.003 FRCI-12-IP11-Q FRCI-12 IP 0.003 FRCI-12-IP6-10 FRCI-12 IP 10 FRCI-12-IP7-10 FRCI-12 IP 10 FRCI-12-IP8-10 FRCI-12 IP 10 FRCI-12-IP9-10 FRCI-12 IP 10 FRCI-12-IP10-10 FRCI-12 IP 10 FRCI-12-T1-Q FRCI-12 TTT 0.003 FRCI-12-T2-Q FRCI-12 TTT 0.003 FRCI-12-T3-Q FRCI-12 TTT 0.003 FRCI-12-T4-Q FRCI-12 TTT 0.003 FRCI-12-T5-Q FRCI-12 TTT 0.003 FRCI-12-T6-10 FRCI-12 TTT 10 FRCI-12-T7-10 FRCI-12 TTT 10 FRCI-12-T8-10 FRCI-12 TTT 10 FRCI-12-T9-10 FRCI-12 TTT 10 FRCI-12-T10-10 FRCI-12 TTT 10
* IP- “In-Plane”; TTT-“Through-The-Thickness” ** The resulting axial strain rates for each test can be found in Tables A1 through A3 in
Appendix A.
15
3. Uniaxial Compression Test (Quasi-static and Intermediate Strain Rates)
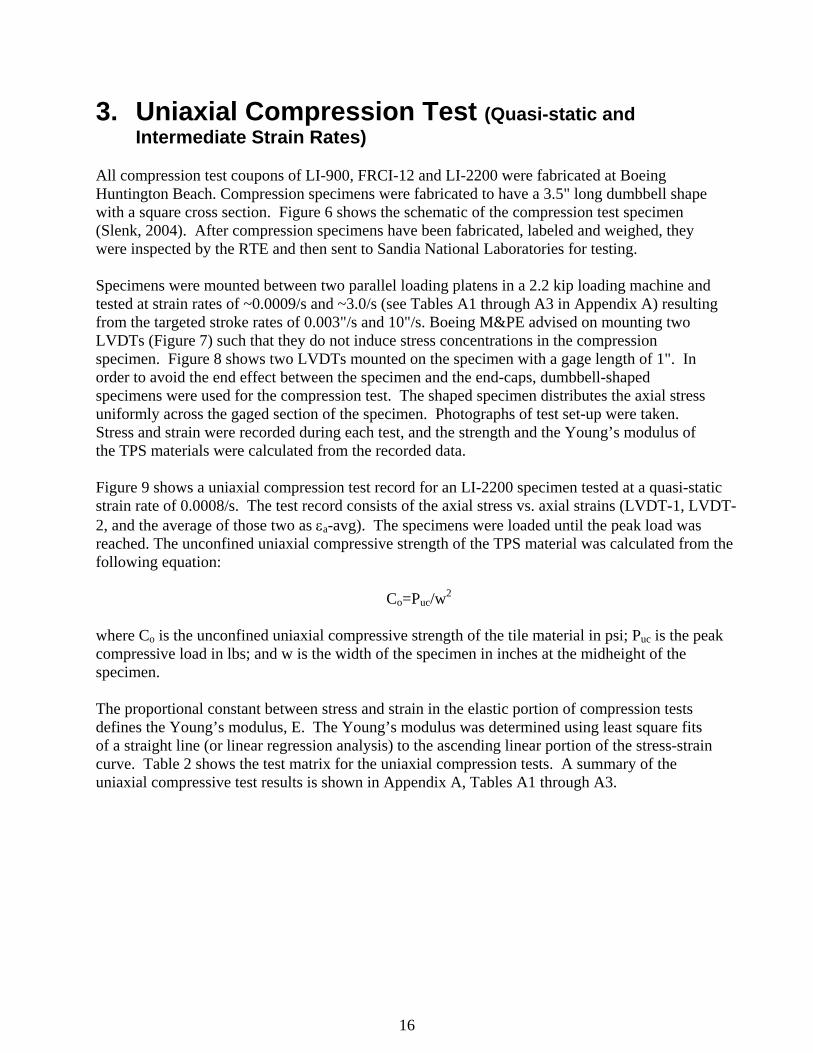
All compression test coupons of LI-900, FRCI-12 and LI-2200 were fabricated at Boeing Huntington Beach. Compression specimens were fabricated to have a 3.5" long dumbbell shape with a square cross section. Figure 6 shows the schematic of the compression test specimen (Slenk, 2004). After compression specimens have been fabricated, labeled and weighed, they were inspected by the RTE and then sent to Sandia National Laboratories for testing. Specimens were mounted between two parallel loading platens in a 2.2 kip loading machine and tested at strain rates of ~0.0009/s and ~3.0/s (see Tables A1 through A3 in Appendix A) resulting from the targeted stroke rates of 0.003"/s and 10"/s. Boeing M&PE advised on mounting two LVDTs (Figure 7) such that they do not induce stress concentrations in the compression specimen. Figure 8 shows two LVDTs mounted on the specimen with a gage length of 1". In order to avoid the end effect between the specimen and the end-caps, dumbbell-shaped specimens were used for the compression test. The shaped specimen distributes the axial stress uniformly across the gaged section of the specimen. Photographs of test set-up were taken. Stress and strain were recorded during each test, and the strength and the Young’s modulus of the TPS materials were calculated from the recorded data. Figure 9 shows a uniaxial compression test record for an LI-2200 specimen tested at a quasi-static strain rate of 0.0008/s. The test record consists of the axial stress vs. axial strains (LVDT-1, LVDT-2, and the average of those two as εa-avg). The specimens were loaded until the peak load was reached. The unconfined uniaxial compressive strength of the TPS material was calculated from the following equation:
Co=Puc/w2
where Co is the unconfined uniaxial compressive strength of the tile material in psi; Puc is the peak compressive load in lbs; and w is the width of the specimen in inches at the midheight of the specimen. The proportional constant between stress and strain in the elastic portion of compression tests defines the Young’s modulus, E. The Young’s modulus was determined using least square fits of a straight line (or linear regression analysis) to the ascending linear portion of the stress-strain curve. Table 2 shows the test matrix for the uniaxial compression tests. A summary of the uniaxial compressive test results is shown in Appendix A, Tables A1 through A3.
16
1.00
Figure 6. Schematic of compression test specimen (All dimensions are in inches.)
Figure 7. RTE (Responsible Testing Engineer from Boeing) inspects a dumbbell-shaped specimen used for compression tests to obtain compressive strength and modulus of the Thermal Protection System (TPS) materials.
0.753.502.70
0.40
1.50 R TYP.
17
Figure 8. Two LVDTs mounted on the specimen during uniaxial compression testing.
0
100
200
300
400
500
0 0.001 0.002 0.003 0.004 0.005
εa-LVDT1
εa-LVDT2
εa-avg
Axia
l Stre
ss (p
si)
Axial Strain (∆l/l)
LI-2200-CIP2-QUniaxial Compression
IP
Figure 9. Stress-strain plots obtained during the unconfined uniaxial compression test for the LI-2200-CIP2-Q specimen. The axial stress (σa) is plotted against axial (εa) strains.
18
Table 2. Uniaxial compression test matrix for the Thermal Protection System (TPS) Materials. Test Material Orientation* Stroke Rate** ID (inch/s)
LI-900-CIP1-Q LI-900 IP 0.003 LI-900-CIP2-Q LI-900 IP 0.003 LI-900-CIP3-Q LI-900 IP 0.003 LI-900-CIP4-Q LI-900 IP 0.003 LI-900-CIP5-Q LI-900 IP 0.003 LI-900-CIP6-10 LI-900 IP 10 LI-900-CIP7-10 LI-900 IP 10 LI-900-CIP8-10 LI-900 IP 10 LI-900-CIP9-10 LI-900 IP 10 LI-900-CIP10-10 LI-900 IP 10 LI-900-CT1R-Q LI-900 TTT 0.003 LI-900-CT2-Q LI-900 TTT 0.003 LI-900-CT3-Q LI-900 TTT 0.003 LI-900-CT4-Q LI-900 TTT 0.003 LI-900-CT5-Q LI-900 TTT 0.003 LI-900-CT6-10 LI-900 TTT 10 LI-900-CT7-10 LI-900 TTT 10 LI-900-CT8-10 LI-900 TTT 10 LI-900-CT9-10 LI-900 TTT 10 LI-900-CT10-10 LI-900 TTT 10 LI-2200-CIP1-Q LI-2200 IP 0.003 LI-2200-CIP2-Q LI-2200 IP 0.003 LI-2200-CIP3-Q LI-2200 IP 0.003 LI-2200-CIP4-Q LI-2200 IP 0.003 LI-2200-CIP5-Q LI-2200 IP 0.003 LI-2200-CIP6-10 LI-2200 IP 10 LI-2200-CIP7-10 LI-2200 IP 10 LI-2200-CIP8-10 LI-2200 IP 10 LI-2200-CIP9-10 LI-2200 IP 10 LI-2200-CIP10-10 LI-2200 IP 10 LI-2200-CT1-Q LI-2200 TTT 0.003 LI-2200-CT2-Q LI-2200 TTT 0.003 LI-2200-CT3-Q LI-2200 TTT 0.003 LI-2200-CT4-Q LI-2200 TTT 0.003 LI-2200-CT5-Q LI-2200 TTT 0.003 LI-2200-CT6-10 LI-2200 TTT 10 LI-2200-CT7-10 LI-2200 TTT 10 LI-2200-CT8-10 LI-2200 TTT 10 LI-2200-CT9-10 LI-2200 TTT 10 LI-2200-CT10-10 LI-2200 TTT 10 FRCI-12-CIP1-Q FRCI-12 IP 0.003 FRCI-12-CIP2-Q FRCI-12 IP 0.003
19
Table 2. Uniaxial compression test matrix for the Thermal Protection System (TPS) Materials (continued).
Test Material Orientation Stroke Rate ID (inch/s)
FRCI-12-CIP3-Q FRCI-12 IP 0.003 FRCI-12-CIP4-Q FRCI-12 IP 0.003 FRCI-12-CIP5-Q FRCI-12 IP 0.003 FRCI-12-CIP6-10 FRCI-12 IP 10 FRCI-12-CIP9-10 FRCI-12 IP 10 FRCI-12-CIP10-10 FRCI-12 IP 10 FRCI-12-CIP13-10 FRCI-12 IP 10 FRCI-12-CT1-Q FRCI-12 TTT 0.003 FRCI-12-CT2-Q FRCI-12 TTT 0.003 FRCI-12-CT3-Q FRCI-12 TTT 0.003 FRCI-12-CT4-Q FRCI-12 TTT 0.003 FRCI-12-CT5-Q FRCI-12 TTT 0.003 FRCI-12-CT6-10 FRCI-12 TTT 10 FRCI-12-CT7-10 FRCI-12 TTT 10 FRCI-12-CT8-10 FRCI-12 TTT 10 FRCI-12-CT9-10 FRCI-12 TTT 10 FRCI-12-CT10-10 FRCI-12 TTT 10
* IP- “In-Plane”; TTT-“Through-The-Thickness” ** The resulting axial strain rates for each test can be found in Tables A1 through A3 in
Appendix A.
20
4. Shear Test (Quasi-static and Intermediate Strain Rates) Boeing Huntington Beach M&PE provided the shear testing specimens of LI-900, FRCI-12 and LI-2200. Shear specimens were cut into 6.0" × 2.0" × 0.5" (± 0.005") rectangular blocks, labeled, weighed and then bonded to aluminum shear blocks using Devcon® 5 Minute Epoxy. Figure 10 shows the schematic of the shear test specimen. After shear specimens have been fabricated, they were inspected by the RTE from Boeing and then sent to Sandia National Laboratories for testing. All shear test coupons were fabricated at Boeing Huntington Beach except for the five LI-900 specimens listed in Appendix B, Table B1. These Sandia prepared specimens replaced the defective LI-900 specimens that had been delaminated from the shear block during testing. Table 3 summarizes the shear test-matrix conducted for the TPS materials in “strong-plane” (SP) and “weak-plane” (WP) orientations at quasi-static (0.003 inch/s) and intermediate (10 inch/s) stroke rates. The SP specimens have the shear failure plane perpendicular to the plane formed by the “in-plane” orientations (Figure 11). In contrast, the WP specimens have the shear failure plane aligned in parallel with the weakness plane formed by the “in-plane” orientations (Figure 11). Two LVDTs were calibrated prior to testing and used as displacement measurement gages. As shown in Figure 12, specimens were mounted in pivoting holding fixtures provided by the Boeing M&PE. The prepared specimen was tested in a 22 kip loading machine following the test-matrix shown in Table 3. As shown in Figures 13 and 14, the LVDTs were mounted to measure the relative displacement of the aluminum shear blocks during testing. Figure 14 also shows a photograph of the failed surfaces exposed after the test. The failure surfaces always show the gouges of the TPS material from shearing. The shear stress is calculated as:
xyσ =wLPs
where xyσ is the shear stress applied to the tile material in psi; Ps is the shear load in lbs; and w and L are the width and the length of the specimen in inches, respectively (wL≡2×6=12 inch2 in this TPS materials testing). The shear strain is calculated as:
xyε =2xyγ
where xyε is the shear strain, xyγ is the engineering (or total) measured as the relative displacement of the block along the shear load divided by the thickness of the specimen. The shear stress vs. engineering shear strain plot was recorded during testing (Figure 15). The ultimate shear stress at failure of the specimen was obtained as the peak stress and the shear modulus, G, was calculated as follows:
21
xy
xyGγσ
=
The shear modulus is obtained from the slope of the ascending linear portion of the shear stress vs. engineering shear strain plot. The results are summarized in Appendix B, Table B1 through B3.
k Figure 10. Schematic of the shear te
Strong-Plane (S
Figure 11. Orientations of “weak-p“through-the-thickness”.
Aluminum Shear Bloc
A
TP
st sp
P) s
lane
6.00
luminum Shear Block
S Tile Material
t
ecimen (All dimensions are in inches.)
Weak-Plane (WP) specimen
pecimen
In-Plan
e
In-Plane
Thro
ugh-
The-
Thic
knes
s
” and “strong-plane” with respect to “in-plane” and
22
0.5
0.25 load block offse
Figure 12. Typical shear test set-up with two pivoting shear fixtures and two LVDTs measuring relative displacement of shear blocks along the shearing direction.
Figure 13. An LVDT mounted on the aluminum blocks to measure the relative shear displacement of the specimen.
23
Figure 14. Shear failure surfaces of the specimen after the test. Also shown are two LVDTs mounted on the aluminum blocks.
Figure 15. The shear str g of a FRCI-12 material loaded in the
ess versus shear strain plot obtained in shear testin
“Strong-Plane” (SP) orientation.
0
50
100
150
0 0.01 0.02 0.03 0.04 0.05
She
ar S
tress
, σxy
(psi
)
Engineering Shear Strain, γxy
FRCI-12-SSP2-QShear
SP
200
24
Table 3. Shear test matrix for the Thermal Protection System (TPS) Materials. Test ID Material Orientation* Stroke Rate**
ns delaminated from the aluminum shear platen 0-SWP
***-defective specimeErroneous tests: LI-90 4-Q
26
5. Strain Rate)
The u ssion (U “Compression- box”) test is designed to constrain radia g the c ve axial load. The USC tests were performed using a die c s show re 16. The test set-up consists of a die, a punch, an LVDT format specimen, and a total load load-cell ure the axial pecimen (Figure 17). The frictional force between the specimen, the punch and the die-body and the lateral strain were not measured during the test, although the latera to be zero consistent with the U st configuration The were lo g the axis of the cylinder and the lateral strain was supp die-bo g a pseudo-un l strain condition. The axial strain, functio ial stress, σa. Since the lateral strai ffectively suppre l umetric strain,
Uniaxial Strain Compression Test (Quasi-static
n reiaxial strain comp SC) (or in a-l strain while increasino a
ompressimpaction test set-up to measure axial de
n in Figuion of the to meas
load applied to the s
l strain was assumed SC te .
cylindrical specimens aded alonressed effectively by a dy creatin iaxiaε , is measured as aa
ssed, ε is effectively equan of the ax ns are e
a to the vol ε . v
Figure 16. Uniaxial strain compression test set-up controlled by a servo-controlled system.
27
UpperPunchSpecimen
LVDT
Total Load Cell
Spacer
Die-Body
LowerPunch
Figure 17. A modified die compaction system with an LVDT to measure the axial displacement of the specimen for the “compression-in-a-box” test. Right cylinder discs were used for the USC tests. Cylindrical cores were extracted from the TPS materials in IP and TTT orientations. The diameter of each specimen was nominally 1.125" to fit the bore of the die-body and the length of the specimens was 0.5". Both ends of the cores were ground flat within 0.005" tolerance. Thirty USC tests were conducted: five in the “through-the-thickness” orientation and five in the “in-plane” orientation for each TPS material. The detailed test-matrix is shown in Table 4 and the results are summarized in Appendix C, Table C1. The specimen was inserted into the die-body and pushed to the bottom until it came into contact with the lower punch sitting on the spacer. The upper punch was lowered into the die-body until it contacted the specimen. Then, the LVDT attached to the die-body was zeroed with the end of the LVDT core in contact with the upper punch. The upper punch was lowered and the load was applied to the specimen at the targeted strain rate of 0.001 /s until the axial stress of about 100 psi was reached. Changes in specimen volume were calculated assuming the specimen could deform in the axial direction only, i.e., the die-body fully constrained the specimen in the radial
igures 18 and 19 show the axial stress-axial strain plots obtained in IP and TTT orientations, respectively. The stress-strain plot consists of three segments. The first segment is the elastic response of the material with a steep increase of σa up to the point when the specimen fails at the compressive strength corresponding to the confined condition. The peak stress is usually
direction. F
28
accompanied by a small stress drop (Figure 18) that may indicate a formation of compaction bands, a common phenomenon in porous materials (Olsson, 1999). The stress drop is conspicuous in specimens tested in the IP orientation. The next segment is crush, where the localized failure propagates throughout the specimen converting the intact material into compacted material with layers of compaction bands. This segment is characterized by an increase of εa up to about 0.7 without increasing the applied stress significantly. The last segment is the compaction of the material into a voidless state characterized by a rapid increase in the applied axial stress without significantly increasing εa.
Table 4. Compression-in-a-box test matrix for the Thermal Protection System (TPS) Materials. Test ID Material Orientation* Strain Rate**
(1/s) LI-900-BIP1-Q LI-900 IP 0.001 LI-900-BIP2-Q LI-900 IP 0.001 LI-900-BIP3-Q LI-900 IP 0.001 LI-900-BIP4-Q LI-900 IP 0.001 LI-900-BIP5-Q LI-900 IP 0.001 LI-900-BT1-Q LI-900 TTT 0.001 LI-900-BT2-Q LI-900 TTT 0.001 LI-900-BT3-Q LI-900 TTT 0.001 LI-900-BT4-Q LI-900 TTT 0.001 LI-900-BT5-Q LI-900 TTT 0.001
LI-2200-BIP1-Q LI-2200 IP 0.001 LI-2200-BIP2-Q LI-2200 IP 0.001 LI-2200-BIP3-Q LI-2200 IP 0.001 LI-2200-BIP4-Q LI-2200 IP 0.001 LI-2200-BIP6-Q LI-2200 IP 0.001 LI-2200-BT1-Q LI-2200 TTT 0.001 LI-2200-BT2-Q LI-2200 TTT 0.001 LI-2200-BT3-Q LI-2200 TTT 0.001 LI-2200-BT4-Q LI-2200 TTT 0.001 LI-2200-BT5-Q LI-2200 TTT 0.001
FRCI-12-BIP1-Q FRCI-12 IP 0.001 FRCI-12-BIP2-Q FRCI-12 IP 0.001 FRCI-12-BIP3-Q FRCI-12 IP 0.001 FRCI-12-BIP4-Q FRCI-12 IP 0.001 FRCI-12-BIP5-Q FRCI-12 IP 0.001 FRCI-12-BT1-Q FRCI-12 TTT 0.001 FRCI-12-BT2-Q FRCI-12 TTT 0.001 FRCI-12-BT3-Q FRCI-12 TTT 0.001 FRCI-12-BT4-Q FRCI-12 TTT 0.001 FRCI-12-BT5-Q FRCI-12 TTT 0.001
*-IP - “In-Plane”; TTT - “Through-The-thickness” ** - targeted strain rate. LI-2200-BIP5-Q test was aborted due to a disconnection in the LVDT.
29
600
800
1000LI-900-BIP1-Q
ss (p
si)
400ial S
0
200
0 0 0.4 0.8 1
Ax
tre
Axial Str Figure 18. The axial stress versus axial strain curve obtained in USC testing I-900 material loaded in the ntation.
.2 0.6
ain of an L
“in-plane” orie
200
400
600 (ps
800
1000
00.4 0.60 0.2 0.8 1
LI-900-BT
Figure 19. The axial stress versus axial strain curve obtained in USC testing of an LI-900 material loaded in the “through-the-thickness” orientation.
1-Q
Axi
al S
tress
i)
Axial Strain
30
6. Split Hopkinson Pressure Bar Test (Dynamic Strain Rate)
To investigate the dynamic behavior of the TPS materials under unconfined and confined uniaxial compressive stress conditions, the Split Hopkinson Pressure Bar (SHPB or Kolsky bar) was used (Kolsky, 1949). Figure 20 show the SHPB set-up with a calibrating load cell and a data acquisition system. The SHPB set-up consists of a striker bar, an incident bar and a transmission bar made from an aluminum alloy, AL7075-T6. In addition, a titanium confinement ring was placed over the specimen when the confined SHPB testing was conducted (Figure 21). The incident and the transmission bars were instrumented with strain gages to capture elastic waves generated by the striker bar colliding with the incident bar. Foil type strain gages were used in the incident bar and semiconductor strain gages were used in the transmission bar. Use of semiconductor strain gages allows us to record the acoustic wave transmitted to the transmission bar due to low acoustic impedance of the TPS materials. The semiconductor strain gages were calibrated using a load cell mounted in place of the specimen (Figure 20).
iker bar was launched by compressed air. An oscilloscopic ata acquisition system simultaneously captured the wavelets in the incident and the transmission ars at a rate of 2.5×10⁶ sample/s per channel.
A disk-shaped specimen (1.00" in diameter and 0.25" in length) was placed between the incident and the transmission bars and the strdb
Figure 20. Split Hopkinson pressure bar set-up with a calibrating load cell.
31
igure 2specimen.
travels thspecime
terface, ecimen
F 1. Split Hopkinson pressure bar set-up with a lateral confinement ring installed over the
When the striker bar impacts the incident bar, an elastic wave is generated and travels through the incident bar. When the elastic wave reached the interface (interface a in Figure 22) between the incident bar and the specimen, a fraction of the wave is reflected back into the incident bar due to the impedance mismatch between the sample and the bar. The remainder of the wave
rough the specimen and reaches the interface (interface b in Figure 22) between the n and the transmission bar. Based on one dimensional theory of elastic wave
propagation in a bar and the continuity of displacement and stress equilibrium at the inthe following equations can be derived to describe stress, strain and strain rate in the sp(Kolsky, 1949):
)( ris
a AAE εεσ +=
)( ts
b AAE εσ =
rl
LV
εε2
−=&
32
td L 0
σa is the stress in the interface between the sample and the incident bar; σb is the streace between the sample and the transmission bar; E is the modulus of the transm
is the cross-sectional area of the transmission bar; As is the cross-sectional area of the n;
V t
rl ∫=
2εε
where ss in the interf ission bar; Aspecime iε , rε , and tε are the incident, reflected, and transmitted strains, respectively; ε& is the strain rate in the specimen; Vl is the longitudinal wave velocity in the incident bar; L is the initial length of the specimen; and t is time. The test parameters used for the TPS materials testing are listed in Table 5.
Striker BarTPS SpecimenFoil Strain Gages
Pulse Shaper
a b
L
εiεr
εtTransmission BarIncident Bar
Semiconductor Strain Gages
Figure 22. Schematic of the split Hopkinson pressure bar experimental set-up and the elastic waves
the bar-specimen interfaces.
.
in
Table 5. Test parameters used for SHPB testing of Thermal Protection System (TPS) materials
SHPB test parameter
Constant Value
Cross-sectional area of the transmission bar, A 1.00 inch2
Cross-sectional area of the specimen, As 1.00 inch2
Initial length of the specimen, L 0.25 inch Longitudinal wave velocity in AL7075-T6 bar, Vl 196,732 inch/s Young’s modulus of AL7075-T6, E 10,440,000 psi Strain sensitivity in the incident bar 32,395 µstrain/V Strain sensitivity in the transmission bar 634 µstrain/V
In order to achieve a dynamic equilibrium of stress athe specimen, the stress wave at the incident bar interface shoshaping. Figure 23 shows a pulse shaping disk attached to the end of the incident bar. When the stri r bar impacts the pulse shaper, a thin disk of fmonotonically rising pulse with a longer period. Before the peak stress in the incident bar is reached, the elastic wave travels between interfaces a and b several times to achieve a dynamic
nd a homogeneous deformation throughout uld rise gradually through pulse
ke elt metal deforms plastically to generate a
33
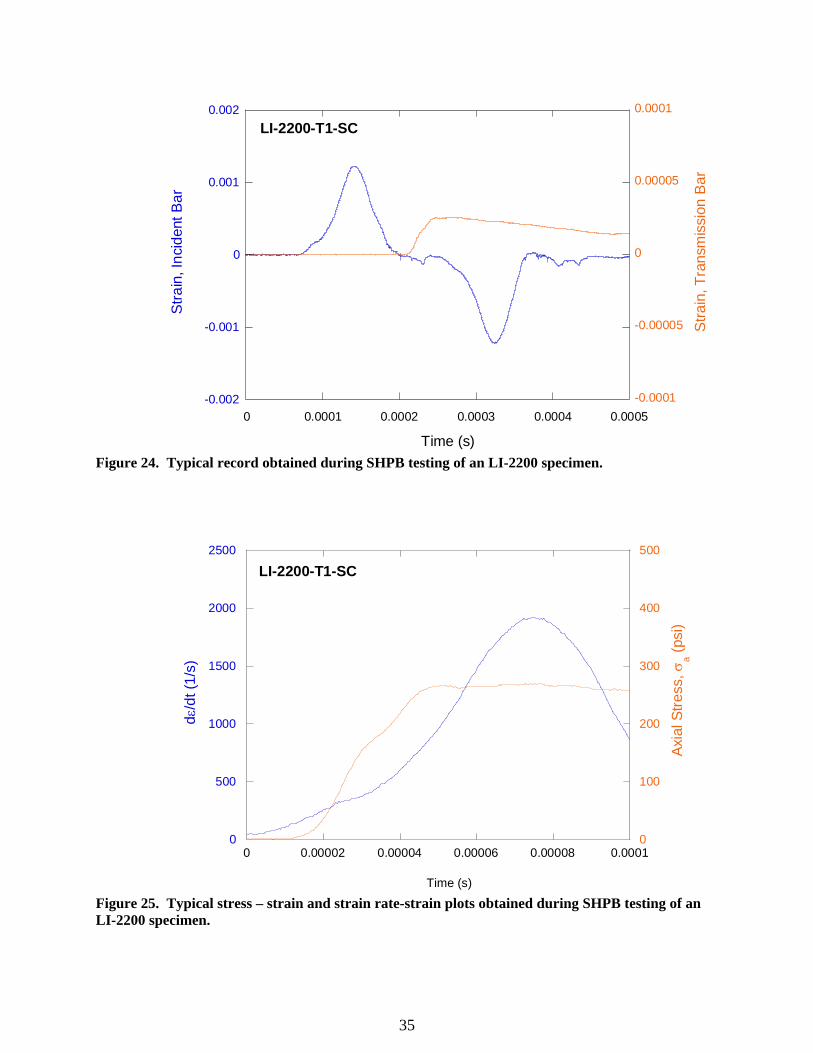
equilibrium of stress and a homogeneous deformation in the specimen. Figure 24 shows a typical record from SHPB testing of a TPS specimenincident wave,
. Shown are the strain gage records for the iε reflected wave, rε and the transmitted wave, tε . Based on the SHPB equations
sted above, stress and strain rate of the specimen under dynamic loading can be calculated with
dix
lirespect to strain (Figure 25). From the stress-strain plot, the peak stress was obtained to estimate the strength of the TPS material. The strain rate for the peak stress can be picked from the same plot (Figure 25). The results of SHPB testing of the TPS materials are summarized in AppenD, Tables D1 through D3.
Figure 23. A elt metal attached to the end of the incident bar of the split Hop s the
pulse shaper disk made out of a fkinson pressure bar where the striker bar impact incident bar.
34
Figure 24. Typical record obtained during SHPB testing of an LI-2200 specimen.
0
500
1000dε/d
l Stre
1500
2000
2500
0
100
200
300
400
500
0 0.00002 0.00004 0.00006 0.00008 0.0001
LI-2200-T1-SC
t (1/
s)
Axia
ss, σ
a (psi
)
Time (s) Figure 25. Typical stress – strain and strain rate-strain plots obtained during SHPB testing of an LI-2200 specimen.
-0.002
-0.001
0
-0.0001
-0.00005
0
0 0.0001 0.0002 0.0003 0.0004 0.0005
Stra
in, I
n
Stra
in, T
rans
mi
Time (s)
0.001
0.002
0.00005
0.0001
LI-2200-T1-SC
cide
nt B
ar
ssio
n B
ar
35
7. Summary and Conclusions
An experimental study was conducted to measure the mechanical properties of the Thermal ystem (TPS) materials used for the Space Shuttle. Three types of TPS materials (LI-
900, LI-2200, and FRCI-12) were tested in “in-plane” and “out-of-plane” orientations. Four quasi-static mechanical tests (uniaxial tension, uniaxial compression, uniaxial strain, and
re performed under low (10-4 to 10-3/s) and intermediate (1 to 10/s) strain rate conditions. In addition, split Hopkinson pressure bar tests were conducted to obtain the strength
terials under a relatively higher strain rate (~102 to 103/s) condition. For each TPS terial the results are presented in Appendices A through E as functions of loading type,
loading orientation, and applied strain rate
arative trends and values of strength, Young’s modulus, and shear modulus under different strain rates are presented in Appendix E in graphical form. In general, TPS materials have higher strength and higher Young’s modulus when tested in “in-plane” compared to “through-the-thickness” orientations under compressive (unconfined and confined) and tensile stress conditions. In both stress conditions, the strength of the material increases as the strain rate increases. The rate of increase in LI-900 is relatively small compared to those for the other
Protection S
types ofshear) we
of the mama
The comp
aterials tested in this study. But, the Young’s modulus appears to be insensitive to the
he FRCI-12 material, designed to replace the heavier LI-2200, showed higher strengths under nsile and shear stress conditions. But, under a compressive stress condition, LI-2200 showed igher strength than FRCI-12. As far as the modulus is concerned, LI-2200 has higher Young’s
modulus both in compression and in tension. The shear modulus of FRCI-12 and LI-2200 fell in the same range.
two TPS mdifferent strain rates applied. Tteh
36
References Kolsky, H., An Investigation of the Mechanical Properties of Materials at Very High Rates oStrain, Proc. Roy. Phys. Soc., B62, 676-700, 1949. NASA, NSTS (National Space Transportation System) Shuttle Reference Manual, 1988. Olsson, W. A., Theoretical and experimental investigation of compaction band in porous rock, J.Geophys. Res., 104, 7219-7228, 1999. Slenk J., Dynamic Properties Testing Of TP
f
S Materials Tested at Sandia National Laboratories, etailed Test Plan, Boeing Thermal Management Systems Material & Process Engineering D
y = 92.849 + 2.4916log(x) R= 0.436 y = 60.896 + 2.4371log(x) R= 0.83173 y = 375.07 + 19.078log(x) R= 0.86236 y = 215 + 8.2021log(x) R= 0.7392 y = 299.45 + 16.058log(x) R= 0.8995 y = 174.46 + 10.523log(x) R= 0.90089
Com
pres
sive
Stre
ngth
(psi
)
Strain Rate (1/s)
Uniaxial Compression / SHPB
Figure E1. Effects of strain rates on the strength of the TPS materials under compression (x: strain rate and y: compressive strength in regression equations).
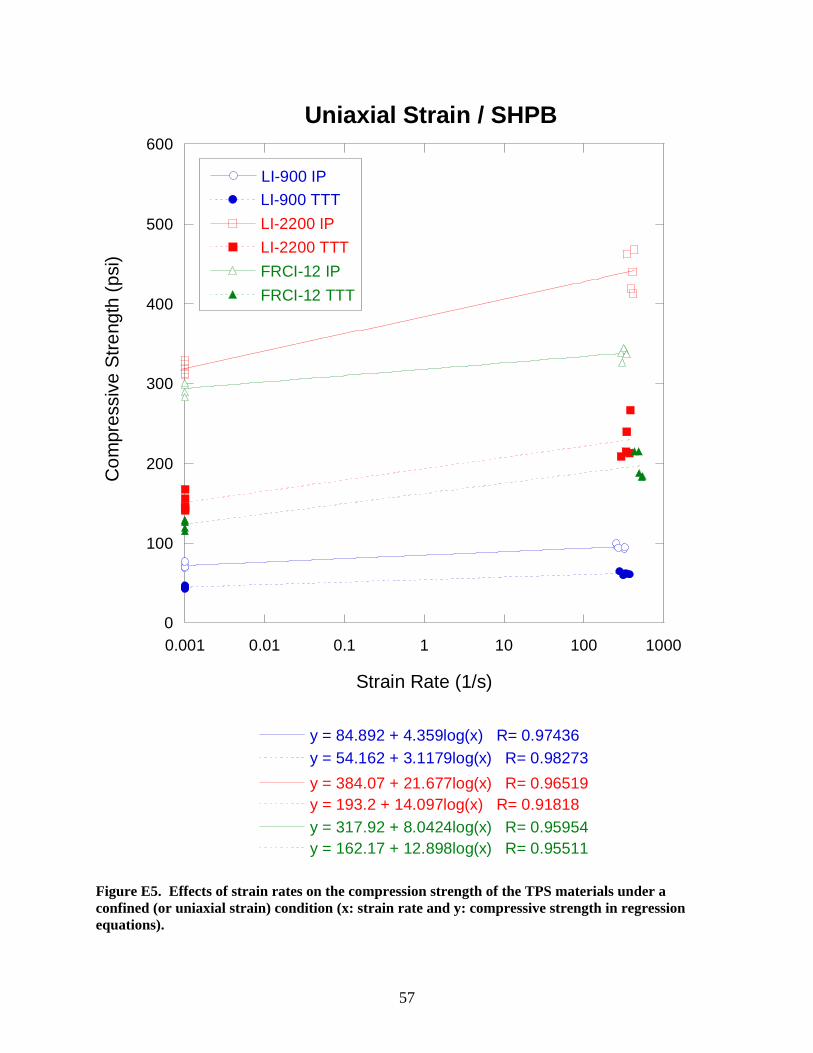
y = 84.892 + 4.359log(x) R= 0.97436 y = 54.162 + 3.1179log(x) R= 0.98273 y = 384.07 + 21.677log(x) R= 0.96519 y = 193.2 + 14.097log(x) R= 0.91818 y = 317.92 + 8.0424log(x) R= 0.95954 y = 162.17 + 12.898log(x) R= 0.95511
Com
pres
sive
Stre
ngth
(psi
)
Strain Rate (1/s)
Uniaxial Strain / SHPB
Figure E5. Effects of strain rates on the compression strength of the TPS materials under a confined (or uniaxial strain) condition (x: strain rate and y: compressive strength in regression equations).
57
0
50
100
150
200
0.001 0.01 0.1 1 10
LI-900 IP
LI-900 TTT
LI-2200 IP
LI-2200 TTT
FRCI-12 IP
FRCI-12 TTT
Shea
r Stre
ngth
, γxy
(psi
)
Strain Rate, dγxy
/dt (1/s)
Shear Test
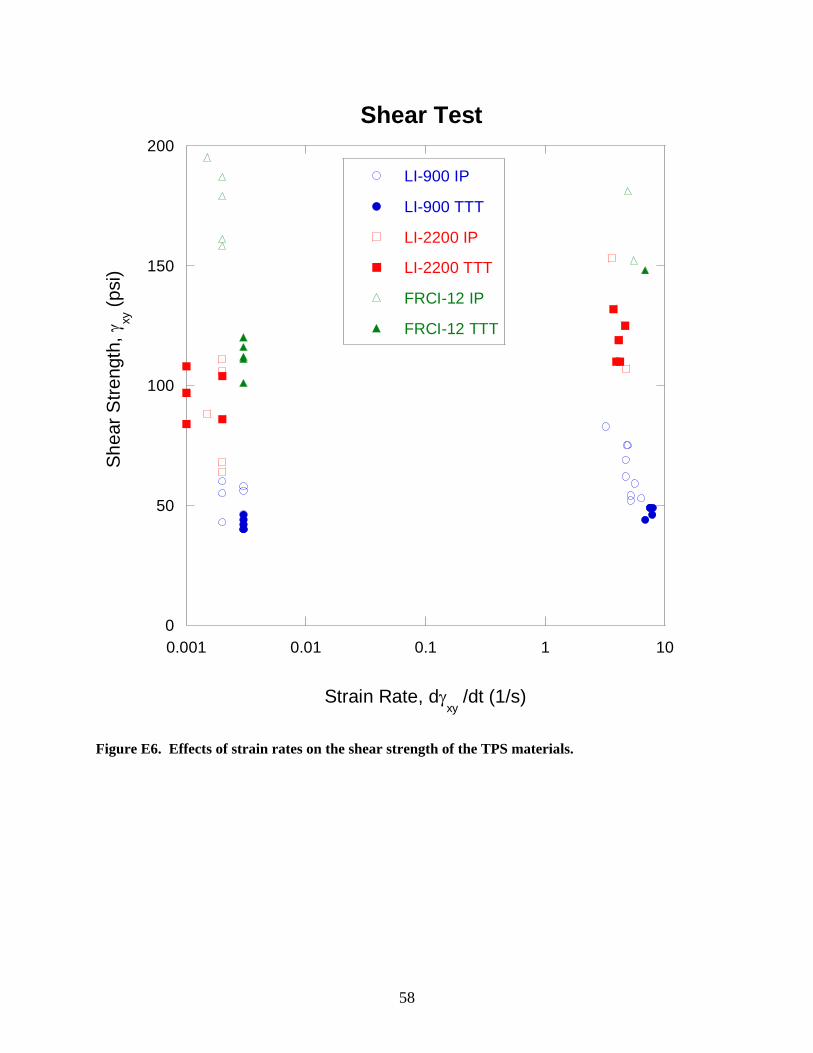
Figure E6. Effects of strain rates on the shear strength of the TPS materials.
58
0
5000
10000
15000
20000
25000
30000
0.001 0.01 0.1 1 10
LI-900 IP
LI-900 TTT
LI-2200 IP
LI-2200 TTT
FRCI-12 IP
FRCI-12 TTT
Shea
r Mod
ulus
, G (p
si)
Strain Rate, dγxy
/dt (1/s)
Shear Test
Figure E7. Effects of strain rates on the shear modulus of the TPS materials.
59
DISTRIBUTION Sandia National Laboratories P.O. Box 5800 Albuquerque, NM 87185 1 MS 0372 K. W. Gwinn, 9126 1 MS 0701 P. J. Davies, 6100 1 MS 0751 L. S. Costin 1 MS 0701 J. A. Merson, 6110 5 MS 0751 M. Y. Lee, 6117 1 MS 0751 T. W. Pfeifle, 6117 1 MS 1031 R. D. Hardy, 6117 1 MS 1031 D. R. Bronowski, 6117 1 MS 1031 J. H. Hofer, 6117 1 MS 0731 823/Library, 6850 2 MS 0899 Technical Library, 9616 1 MS 9018 Central Tech. Files, 8945-1 NASA Johnson Space Center Mail Code ES3 Building 13, Room 131 2101 NASA Parkway Houston, Texas 77058 [email protected] John Kowal The Boeing Company 13100 Space Center Blvd MC HB6-30 Houston, TX 77059-3556 Paul Parker eremy Brand
Jeremy Brand [email protected] PO Box 21233 MC721Z-K085 Kennedy Space Center, Fl 32815-0233 Dan Bell [email protected] 5301 Bolsa Ave. MC H021-F120 Huntington Beach, CA 92647-2099 Joel Slenk [email protected]