This is an Open Access article distributed under the terms of the Creative Commons Attribution License (http://creativecommons.org/licenses/by/4.0/), which permits unrestricted use, distribution, and reproduction in any medium, provided the original author and source are credited.
MECHANICAL PROPERTIES OF THIN SURFACE TREATMENT FOR PAVEMENT MAINTENANCE
1, 2, 3Dept of Civil Engineering, National Cheng Kung University, Tainan 70101, Taiwan
Received 26 February 2018; accepted 1 April 2019
Abstract. Specification tests for thin surface treatment are mainly simulated or empirical; without considering fundamental mechanical or rheological properties of the material. Thus, it is difficult to incorporate the test results into mechanical-based pavement design analysis. A series of test methods, which quantify performance-related mechanical properties of thin surface treatment employed in pavement maintenance and pavement preservation is thus needed. The objective of this study is to investigate the performance-related mechanical properties of thin surface treatment materials for pavement maintenance and preservation. The Micro-Surfacing Mat and Precast Rubber Asphalt Mat were used in this study. The Finite Element Model result indicated that the Modified Leutner Shear Test adequate to evaluate the direct shear strength of the thin surface treatment. The results show that the sensitivity loading frequency and the temperature susceptibility of the Precast Rubber Asphalt Mat were reduced by Rubber Modified Asphalt content. The Precast Rubber Asphalt Mat has greater interfacial shear strength as well as shear stiffness compared to those of Micro-Surfacing Mat. The tack coat application rate is crucial for the interfacial shear strength of Precast Rubber Asphalt Mat. This research found that shear stress and the displacement rate are positively related to the interfacial shear strength and shear stiffness. The interfacial shear strength and shear stiffness are negatively related to testing temperature. The Micro-Surfacing Mat had
After 40 years of the steady growth of the roadway network in Taiwan, the focus has been switched from road construction to the maintenance of existing pavement infrastructure. Cost-effective road maintenance to keep smooth road is thus a key issue. Pavement preservation, which is conducted in the early stages of pavement service life costs 50−60% less than pavement rehabilitation. Pavement preservation activities usually involve the deposition of thin layers (8−15 mm) to the existing pavement surface.
A National Cooperative Highway Research Program (NCHRP) study showed that the standard failure mode of such thin pavement surface treatments includes reflected cracking, streaking, ravelling, delamination, and bleeding (Gransberg, 2010). The reflected crack and streaking are mainly related to the existing pavement condition and quality. In the other hand, ravelling (loss of surface aggregate), delamination, and bleeding are more related to material design and construction quality. Ravelling of thin surface treatment (TST) due to number of reasons including insufficient asphalt quantity to hold the larger aggregate embedded in the mix, high application rate resulting in too thin layer to hold larger aggregates, lack of fines to fill voids between larger aggregates in the mix, and insufficient curing of mix (ISSA A143-2004:2010 Recommended Performance Guidelines for Micro Surfacing). Delamination is due to bonding failure between TST and substrate surface, which is due to improper preparation of subsurface or too quickly breaking of the emulsion that results in a broken mix being placed on the surface will unbound (Austroads, 2003a, 2003b; ISSA A143-2004:2010; Smith & Beatty, 1999; Xu & Rosakis, 2002a, 2002b, 2003). Lastly, bleeding occurs when asphalt binder fills the aggregate voids during hot water and then expands onto the pavement surface. Thus asphalt binder accumulates on the pavement surface over time.
The tests for TST generally divided into direct and indirect test methods. The direct methods usually applied simulated tyre loading/ rolling to the TST specimen and measure the amount of aggregate lost from the sample. Typical direct test method such as Wet Track Abrasion Test (WTAT) as specified in ISSA TB 100 Laboratory
138
THE BALTIC JOURNAL OF ROAD
AND BRIDGE ENGINEERING
2 0 1 9/1 4 (2 )
Test Method for Wet Track Abrasion of Slurry Surfacing Systems requires submerging TST specimen in water for one hour and six days before the specimen testing under repeated rolling force. Kim & Jones (2015) used modified sweep tester (ASTM D7000-04:2004 Standard Test Method for Sweep Test of Bituminous Emulsion Surface Treatment Samples) with a stiff-bristled brush to gently sweep the surface of the aggregate as the brush rotates about the centre of the sample to evaluate the aggregate retention for different chip seal samples. Tredrea (2008) used a modified wheel-tracking test apparatus with a skewed test wheel to evaluate the amount of material loss of TST in Australia. Some researchers used Vialit test, or modified Vialit test, which involves dropping steel ball to the surface of TST and measure the aggregate lost quantity to correlate with TST field performance (Stroup-Gardiner, Newcomb, Epps, & Paulsen, 1990; Yazgan & Senadheera, 2004). Another test developed by LCPC in France utilising tribometer, which is imposed the cyclic vertical and horizontal loading combination on the pavement surface to simulate pavement surface degradation in terms of loss of aggregate.
On the other hand, the indirect methods measure the aggregate embedment depth because the value is strongly correlated to the aggregate loss, bleeding, and skid resistance of TST. Indirect tests divided into qualitative and quantitative methods. The qualitative tests such as sand patch test, sand circle test, and wallpaper size test measure the weight change of standard sand or diameter change of the dispersed sand or wallpaper to correlate to mean profile depth (MPD) (Lu & Bruce, 2006; Page, Patrick, & Dongol, 1998; Pierce & Kebede, 2015). Hegarty (2008) proposed a carpet tile test to measure, calibrate and properly maintain both aggregate and emulsion application rates using the rate-of-spread box to check both binders and spread aggregate rates quickly in the field. Thus, the optimal rate of spread for a particular source and size of aggregate determined using the box measurement to give adequate coverage without unnecessary aggregate excess; then this information transferred and used for the same source and size of aggregate in actual construction. The quantitative tests such as digital imaging test and laser profiler test used to analyse formal texture variations, grinding techniques and particular surface characteristics (Cackler, Ferragut, Harrington, Rasmussen, & Wiegand, 2006; Hanson & Prowell, 2004; Pidwerbesky, Waters, Gransberg, & Stemprok, 2006).
It was found that both direct and indirect test methods for pavement TST are mainly focused on empirical correlation to the aggregate lost performance. None of the tests based on fundamental mechanical or rheological properties of the material. Thus, it is difficult to incorporate the test results into mechanical-based pavement analysis. The objective
Mechanical Properties of Thin Surface Treatment for Pavement Maintenance
of this study is to investigate the performance-related mechanical properties of TST materials for pavement maintenance and preservation. Two types of TST materials, namely Micro-Surfacing Mat (MSM) and Precast Rubber Asphalt Mat (PRAM), were used in this study. The interfacial adhesion and dynamic cohesion properties of the TST were characterised. The obtained mechanical parameters are appropriately used in mechanical pavement analysis.
1. Material and methods
Two TST materials were used in this study. One is the MSM, and the other is the PRAM. The following section describes the material and sample preparation processes used in this study.
1.1. Micro-Surfacing Mat
The MSM used in this study was prepared according to the ISSA A143-2004:2010. First, asphalt binder with a viscosity grade of AC-20 was emulsified and modified and blended with styrene-butadiene rubber (SBR) and water to form an asphalt emulsion. The job mix formula of MSM is shown in Table 1. The aggregate gradation used for the MSM was prepared by ASTM C136-06:2006 Standard Test Method for Sieve Analysis of Fine and Coarse Aggregates, Type II.
Table 1. Job mix formula of Micro-Surfacing Mat
Micro-SurfacingMat
Material Asphalt Emulsion Aggregate Mineral Filler Water
grams 100 10 5 1
% 86.2 8.62 4.31 0.86
1.2. Precast Rubber Asphalt Mat
The functionally graded PRAM was composed of asphalt binder with a viscosity grade of AC-10, crumb tire rubber, and aggregate. First, the asphalt binder was blended with crumb rubber particles to form a rich binder layer. Then, rubber-modified asphalt (RA) was mixed with single-size aggregate and placed on top of the first layer. Finally, the mat was pneumatically compacted and cooled to room temperature. The job mix formula of the PRAM is shown in Table 2. The particle size of crumb rubber was between No. 4 and No. 30 sieve. For the aggregate, the single-size aggregate retained on No. 30 sieve was used.
140
THE BALTIC JOURNAL OF ROAD
AND BRIDGE ENGINEERING
2 0 1 9/1 4 (2 )
1.3. Experimental methods
Figure 1 shows the experimental plan for this study. Three types of performance-related mechanical property of TST materials comprise binder rheological property, mixture interfacial adhesion property, and bulk cohesive property were identified, including the G* and tan (δ) of the asphalt binder, shear adhesion bonding at the interface of TST and existing pavement, and the dynamic direct shear modulus and tan (δ) of the TST. In addition, the stress and strain distribution of the dynamic direct shear modulus test was verified using Finite Element Model (FEM). The Modified Leutner Shear Test (MLST) specimens of 10 cm diameters and 1 cm in thickness modelled using 3D finite element approach. A uniform shear force was applied to one of the specimen
Table 2. Job mix formula of Precast Rubber Asphalt Mat
Precast Rubber Asphalt Mat
Material Asphalt Binder Crumb Tire Rubber Aggregate
Mechanical Properties of Thin Surface Treatment for Pavement Maintenance
interfaces, while the other interface was fixed. The vertical displacement of the specimens was controlled under 5 mm. The specimens were simulated as an elastic material. Table 3 shows the input parameters of material properties for FEM.
1.4. Binder rheological properties
The binder here refers to the RA for PRAM and the latex-modified Emulsified Asphalt Residual (EAR) for the MSM. The rheological properties of each binder were measured using a TA AR1500ex rheometer. The frequency sweep test was performed in the temperature range of 20 °C to 70 °C, with 6 °C intervals, to measure G* and tan (δ) of the binder.
The adhesion at the interface between the TST and the underlying asphalt layer is an important feature that influences the durability of the surface layer. In this study, the shear adhesion test was performed to evaluate interfacial shear adhesion properties (Yang & Liu, 2017). The Leutner shear test was developed in Germany in the late 1970s as a simple method to evaluate the interface bonding strength between two asphalt layers using direct shear approach (Collop, Sutanto, Airey, & Elliott, 2009; Collop, Thom, & Sangiorgi, 2003). The test is performed on 100-mm-diameter cores with two layers taken either from the field pavement or prepared in the laboratory.
Four specimens of PRAM and MSM were prepared in the test. One specimen was used for a pilot test to determine the loading range at each temperature and frequency, and the rest three specimens were used for investigating interfacial strength of TST with materials. Since the thickness of the MSM and PRAM was only 10 mm, which is too thin to place in the original Leutner shear test setup. Therefore, the Leutner shear test fixture was modified to extend the height of the TST specimen by glueing the steel cylinders to the TST material.
Table 3 Input material properties of Finite Element Model
Parameter Micro-Surfacing Mat
Normal stress, kPa 690
Shear force, N 385 000
Young modulus, kPa 25 119
Poisson ratio 0.35
142
THE BALTIC JOURNAL OF ROAD
AND BRIDGE ENGINEERING
2 0 1 9/1 4 (2 )
Also, an adjustable pneumatic pressure was applied to the specimen to simulate tire contact pressures to the TST. Figure 2 shows the sample preparation and test setup for the MLST. First, the 100 mm diameter cores were taken from a laboratory-prepared asphalt concrete slab,
a) slab compactor for asphalt mixture b) sample preparation for Precast Rubber Asphalt Mat
c) sample preparation for Micro-Surfacing Mat
d) test setup for Modified Leutner Shear Test
Figure 2. The sample preparation and test setup for the Modified Leutner Shear Test
Mechanical Properties of Thin Surface Treatment for Pavement Maintenance
as shown in Figure 2a. For the PRAM, the sample was first cored from a PRAM, and a tack coat was applied to the PRAM specimen and glue to the asphalt concrete core (Figure 2b). For the MSM, a steel ring with an inner diameter of 100 mm was placed on top of the asphalt concrete core, and then the MSM was poured into the steel ring mould and allowed it to cure (Figure 2c). Figure 2d shows the setup of the modified Leutner test. A steel cylinder with a 100 mm diameter and 34 mm thickness was glued onto the surface of the TST material with Gorilla glue. Xiao (2013) suggested keeping the specimen upside down during the preparation process until the glue cured to prevent liquid glue penetrating the TST layer. The fixture was then placed in an environmental chamber with vertical loading applied by the MTS 858 servohydraulic testing system and a lateral force, to simulate tire contact, applied by a pneumatic pump. The displacement-controlled mode (constant displacement rate) was used in the shear tests to measure the adhesion at the interface between the thin layer and the underlying asphalt concrete. The test variables were temperature (10 °C, 25 °C, 60 °C), applied shear stress (103.5 kPa, 345 kPa, 690 kPa), and shear rate (2.5 mm/min, 5 mm/min, 10 mm/ min). In addition, since a tack coat was applied to glue the PRAM and the underlying asphalt concrete, five tack coat application rates (0.05 kg/ m2, 0.15 kg/m2, 0.25 kg/m2, 0.35 kg/m2, 0.45 kg/m2) were chosen for PRAM to determine the optimal tack coat application rate. The results were used to calculate the direct shear strength (DSS) and shear stiffness as follows, respectively (Eqs. (1) and (2)).
=4
2
=
, (1)
where DSS − direct shear strength, MPa; P − the maximum force, N; D − specimen diameter, mm.
=4
2
=
(Hoogenboom & Spaan, 2005), (2)
where GAs − shear stiffness, kPa/mm; V − shear stress, kPa; γ − shear deformation, mm.
The bulk cohesive property of the TST layer is an important parameter when incorporating into a mechanical analysis. Typically, the bulk cohesive property of asphalt concrete obtained using a dynamic modulus test, where a 150 mm tall and 100 mm diameter cylindrical specimen is subjected to cyclic sinusoidal loading at
144
THE BALTIC JOURNAL OF ROAD
AND BRIDGE ENGINEERING
2 0 1 9/1 4 (2 )
various frequencies and temperatures. However, such a test is inapplicable for TST materials, where the thickness is only 10 mm. The internal stress-strain behaviour in TST materials is very different from the conventional asphalt concrete. Therefore, the Leutner shear test was further modified. The TST was sandwiched between two steel cylinders, so the TST material adequate placed in the centre without subjecting it to any external force or constraints, as shown in Figure 3b. The fixture (Figure 3a) was then placed in an environmental chamber, with vertical loading applied by the MTS 858 servohydraulic testing system and lateral pressure of 690 kPa applied to simulate vehicle tire contact stress. The contact pressure between the tire and TST materials is set as 690 kPa determined by an area of the tire footprint. A servohydraulic driven vertical loading of 3–10 kN applied to simulate heavy truck with slow speed. Here, instead of applying the uniaxial monotonic load to the specimen, displacement-controlled cyclic sinusoidal loading with a strain amplitude of 50 µm
Figure 3. Dynamic direct shear test
a) mould assembly
b) schematic of the test setup c) mode of loading on thin surface treatment
Mechanical Properties of Thin Surface Treatment for Pavement Maintenance
was used, and the delayed load response was recorded. It is assumed that the gorilla glue adhered the steel cylinder and the TST layer completely and the force applied on the steel cylinder was wholly transferred to the TST layer. Losa & Natale (2012) and Mollenhauer, Wistuba, & Rabe (2009) have investigated the pulse spectrum of the strain induced by a traffic load. When a load moves over the pavement at a constant loading speed and temperature, the pavement exhibits a particular strain pulse frequency spectrum. Losa & Natale (2012) investigated the representative loading frequency to calculate the stiffness modulus of pavement layers for equivalent linear elastic structural analysis. The viscoelasticity of pavements with various design parameters was analysed using the ViscoRoute software, and the stiffness modulus and the corresponding loading frequency were then back-calculated by minimising the residuals between linear elastic and viscoelastic peak strains. The representative frequencies in the x, y, and z directions were related to important variables including the loading speed, half-length and half-width of the rectangular tire footprint, AC temperature, and depth of the investigation point (Losa & Natale, 2012; Mollenhauer, Wistuba, & Rabe, 2009). Therefore, uniform shear stress was applied on the surface of the TST layer along with the vehicle travelling direction. The test was performed from 30 °C to 60 °C with 15 °C intervals. At each temperature, four loading frequencies, namely 10 Hz, 5 Hz, 1 Hz, and 0.1 Hz, were applied; the number of loading cycles corresponding to each frequency was 200, 100, 20, and 15 cycles, respectively. A rest period of 2 min between frequency runs was used. The analysis of test results is similar to the dynamic modulus test. The applied sinusoidal strain and response stress are shown in Eqs (3) and (4). Thus, the G* on the x plane along the y-direction calculated as Eq. (5).
= = 0 sin ,
τ = = τ0 sin ( − δ)
∗
= =0
0
(cos δ + sin ϕ)
, (3)
= = 0 sin ,
τ = = τ0 sin ( − δ)
∗
= =0
0
(cos δ + sin ϕ)
(4)
where γ, γ0 − shear strain, maximum shear strain; τ, τ0 − shear stress, maximum shear stress; δ − phase angle; ω − angular frequency; t − time; Pxy − force applied on the x plane toward the y-direction; A − shear area,
= = 0 sin ,
τ = = τ0 sin ( − δ)
∗
= =0
0
(cos δ + sin ϕ)
(5)
where
= = 0 sin ,
τ = = τ0 sin ( − δ)
∗
= =0
0
(cos δ + sin ϕ)
− dynamic shear modulus on the x plane along the y-direction; i − imaginary unit.
146
THE BALTIC JOURNAL OF ROAD
AND BRIDGE ENGINEERING
2 0 1 9/1 4 (2 )
2. Results and Discussions
2.1. Binder rheological properties
Figure 4 shows the G* the master curve for AC-10, RA, AC-20 and EAR at reference temperature 30 °C. In Figure 4, it observed that the addition of crumb rubber flattens the G* curves of RA. Meanwhile, although EAR includes latex polymer, the G* of EAR almost coincides to AC-10 and AC-20. On the other hand, the results show that the G* of RA higher than EAR, AC-10, and AC-20 at a low reduced frequency and almost coincide at the high reduced frequency. The high G* of RA at low reduced frequency means the RA stiffer than EAR, AC-10, and AC-20, thus good resist deformation than EAR, AC-10, and AC-20. The application of Rubber-Modified Asphalt reduces the sensitivity loading frequency of the G* value compare to the EAR, AC-10, and AC-20.
Figure 5 show tan (δ) curves master curve for AC-10, RA, AC-20, and EAR at reference temperature 30 °C. Figure 5 perform that the RA remains relatively constant at zero over the testing frequency. Hence, the RA materials behaviour elastically regardless of the change of loading frequency. On the other hand, the tan (δ) values of AC-10 and AC-20 higher than EAR and RA with the increase of reduced frequency.
Figure 4. G* master curve of four different binder
Mechanical Properties of Thin Surface Treatment for Pavement Maintenance
Consequently, the AC-10 and AC-20 exhibit more viscous component over the test frequency.
Moreover, it is as expected that the addition of latex or rubber into the original binder effectively decrease the tan (δ) values, which contribute to better performance. The constant tan (δ) the curve of RA also implies to the low-temperature susceptibility of the PRAM.
2.2. Finite Element Model analysis
The FEM was used to simulate the stress and strain distribution of the TST specimen under the MLST. The uniform shear force of 3.85⋅105 N applied in the simulation of 1 cm specimen thickness. Figures 6a and 6b show a meshing model and loading model of the specimen in the Abaqus FEM simulation, respectively. Then, Figure 6c perform the stresses tensor distribution in the specimen test area base on the input model in Figures 6a and 6b, respectively. Furthermore, Figure 6d exhibit the response of stresses tensor, which is increases at the beginning, slightly uniform at the middle, and decreases at the end along the middle of the specimen test area in y–z direction. Thus, the MLST reliable to investigate the direct shear modulus of the TST.
Figure 5. tan (δ) master curve of four different binder
0.0
1.0
2.0
3.0
4.0
5.0
6.0
7.0
8.0
–6.0 –4.0 –2.0 0.0 2.0 4.0
log
G*
, Pa
log reduced frequency, Hz
Emulsi�ied Asphalt Residual
Rubber-Modi�ied Asphalt
AC-10
AC-20
–0.5
0.0
0.5
1.0
1.5
2.0
–3.0 –2.5 –2.0 –1.5 –1.0 –0.5 0.0
log
ta
n (δ
)
log reduced frequency, Hz
Emulsi�ied Asphalt Residual
Rubber-Modi�ied Asphalt
AC-10
AC-20
148
THE BALTIC JOURNAL OF ROAD
AND BRIDGE ENGINEERING
2 0 1 9/1 4 (2 )
c) stress tensor distribution
d) stress distribution along the middle of the specimen in a y – z direction
a) specimen meshing b) specimen loading
Figure 6. FEM simulation for Modified Leutner Shear Test
2.3.1. Tack coat application rate for Precast Rubber Asphalt MatThe interfacial adhesion property subject to five tack coat
application rates (0.05 kg/m2, 0.15 kg/m2, 0.25 kg/m2, 0.35 kg/m2, 0.45 kg/m2) was investigated. The test was performed at 25 °C with a normal stress of 690 kPa and a shear rate of 5 mm/min, as shown in Figure 7. The peak of the interfacial shear strength of PRAM occurs at a tack coat application rate of 0.15 kg/m2. Specimens with high or low tack coat application rate of 0.15 kg/m2 show low shear strength. It is expected that too little tack coat generates inadequate bonding between layers and too much tack coat lubricate the interface and slip between layers. It is widely known that failure of the interface of the pavement layer generates in slippage failure in the surface of the pavement. Such failure is even critical in the context of TST due to high shear stress in the interlayer.
2.3.2. Effect of normal stressFigure 8 shows the interfacial shear strength and shear stiffness of
PRAM and the MSM under various shear stresses under a displacement rate of 5 mm/min at 25 °C. As expected, both shear strength and shear stiffness increase with increasing normal stress. The phenomenon due to high shear stress results in high friction between the TST and the underlying asphalt concrete. It is worth noting that the shear strength and shear stiffness of PRAM are higher than those of the MSM, although both tack coat and MS are emulsion based system. The high shear strength and shear stiffness of PRAM due to rubber content and tack coat application rate in PRAM specimen.
Figure 7. Interfacial shear strength versus tack coat application rate for Precast Rubber Asphalt Mat
0
45
90
135
180
0.05 0.15 0.25 0.35 0.45
Sh
ea
r st
ren
gth
, kP
a
Application rate, kg/m2
0
45
90
135
180
690 345 103.5
Sh
ea
r st
ren
gth
, kP
a
Normal stress, kPa
Precast Rubber Asphalt Mat
Micro-Surfacing Mat
150
THE BALTIC JOURNAL OF ROAD
AND BRIDGE ENGINEERING
2 0 1 9/1 4 (2 )
2.3.3. Effect of shear rateFigure 9 shows the interfacial shear strength and shear stiffness
of PRAM and the MSM at various shear rates at 25 °C under normal stress of 690 kPa. Both the interfacial shear strength and shear stiffness of PRAM and the MSM increase with increasing displacement rate. The phenomenon due to increasing displacement rate, within a given amount of time, more contact areas are forced to slip and fracture, requiring more energy. In general, the PRAM has higher
0
45
90
135
180
0.05 0.15 0.25 0.35 0.45
Sh
ea
r st
ren
gth
, kP
a
Application rate, kg/m2
0
45
90
135
180
690 345 103.5
Sh
ea
r st
ren
gth
, kP
a
Normal stress, kPa
Precast Rubber Asphalt Mat
Micro-Surfacing Mat
a) interfacial shear strength
b) shear stiffness
Figure 8. Shear strength and stiffness under various normal stresses
Mechanical Properties of Thin Surface Treatment for Pavement Maintenance
shear strength and shear stiffness than those of the MSM except at a displacement rate of 10 mm/min, where MSM has a slightly high shear stiffness. The results showed that the PRAM had better resists shear load than the MSM. The phenomenon due to the applied tack coat for the PRAM specimen whereas, in the MSM, the slurry was directly poured onto the asphalt concrete substrate.
Figure 9. Shear strength and stiffness under various shear rate
0.0
17.5
35.0
52.5
70.0
10 5 2.5
Sh
ea
r st
iffn
ess
, kP
a/
mm
Shear rate, mm/min
0
45
90
135
180
10 25 60
Sh
ea
r st
ress
, kP
a
Temperature, ℃
Precast Rubber Asphalt Mat
Micro-Surfacing Mat
Precast Rubber Asphalt Mat
Micro-Surfacing Mat
0
10
20
30
40
690 345 103.5
Sh
ea
r st
iffn
ess
, kP
a/
mm
Normal stress, kPa
0
45
90
135
180
10 5 2.5
Sh
ea
r st
ren
gth
, kP
a
Shear rate, mm/min
Precast Rubber Asphalt Mat
Micro-Surfacing Mat
Precast Rubber Asphalt Mat
Micro-Surfacing Mat
a) interfacial shear strength
b) shear stiffness
152
THE BALTIC JOURNAL OF ROAD
AND BRIDGE ENGINEERING
2 0 1 9/1 4 (2 )
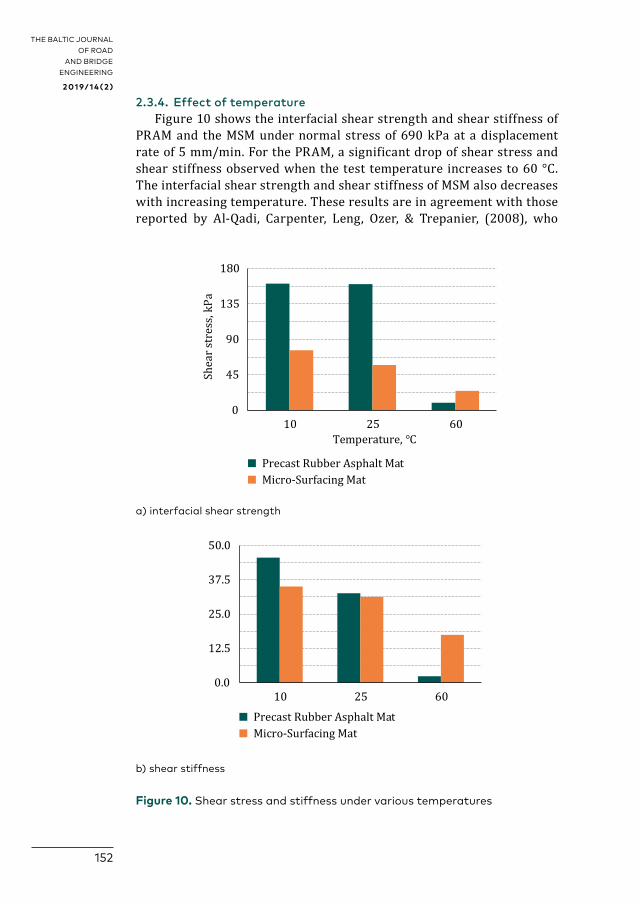
2.3.4. Effect of temperatureFigure 10 shows the interfacial shear strength and shear stiffness of
PRAM and the MSM under normal stress of 690 kPa at a displacement rate of 5 mm/min. For the PRAM, a significant drop of shear stress and shear stiffness observed when the test temperature increases to 60 °C. The interfacial shear strength and shear stiffness of MSM also decreases with increasing temperature. These results are in agreement with those reported by Al-Qadi, Carpenter, Leng, Ozer, & Trepanier, (2008), who
0.0
17.5
35.0
52.5
70.0
10 5 2.5
Sh
ea
r st
iffn
ess
, kP
a/
mm
Shear rate, mm/min
0
45
90
135
180
10 25 60
Sh
ea
r st
ress
, kP
a
Temperature, ℃
Precast Rubber Asphalt Mat
Micro-Surfacing Mat
Precast Rubber Asphalt Mat
Micro-Surfacing Mat
Figure 10. Shear stress and stiffness under various temperatures
Mechanical Properties of Thin Surface Treatment for Pavement Maintenance
reported that at given values of normal stress and displacement rate, the interfacial shear strength and shear stiffness decrease with increasing temperature. The phenomenon is mainly due to the viscosity of the tack coat decreasing when the temperature increases. Therefore, the tack coat acts as a lubricant instead of providing bonding between layers.
The bulk property of the thin layer was investigated using the MLST. The test conditions were analogous to ASTM D3497-79:2003 Standard Test Method for Dynamic Modulus of Asphalt Concrete and AASHTO T 342-11:2015 Standard Method of Test for Determining Dynamic Modulus of Hot Mix Asphalt (HMA) to measure the G* and tan (δ) of the TST material. The G* and tan (δ) were calculated by Eqs. (3)−(5). The master curve created to measure the influence of temperature and rate of loading on the viscoelastic material. A reference temperature of 30 °C was used to generate the master curve. Figure 11 shows the comparison of the master curve of G* and tan (δ) for PRAM and the MSM. In general, the G* increases, while the tan (δ) decreases. The results showed that the G* of MSM is higher than PRAM at all frequencies. The high G* value of MSM indicates that the MSM has stiffer than PRAM (able to resist deformation). The MSM also has a tan (δ) slightly higher than PRAM, so the MSM more viscous material than PRAM. This mainly due to the rubber particle component in the PRAM, which gives more ductile behaviour compare to latex modified
Figure 11. Master curve G* and tan (δ) of two different thin surface treatment
–1.5
–1.0
–0.5
0.0
2.5
3.5
4.5
5.5
–5.0 –4.0 –3.0 –2.0 –1.0 0.0 1.0 2.0
log
ta
n (
δ)
log
G*, k
Pa
log reduced frequency, Hz
G* Micro-Surfacing Mat
G* Precast Rubber Asphalt Mat
tan (δ) Micro-Surfacing Mat
tan (δ) Precast Rubber Asphalt Mat
0
50
100
150
200
30 40 50 60
G*/
sin
δ, k
Pa
Temperature, °C
Precast Rubber Asphalt Mat
Micro-Surfacing Mat
154
THE BALTIC JOURNAL OF ROAD
AND BRIDGE ENGINEERING
2 0 1 9/1 4 (2 )
MSM. Also, the slope of the MSM master curve of G* is lower than the PRAM. This implies that MSM has a lower sensitivity to the change of the loading frequency (service temperature) than PRAM.
Performance parameters corresponding to G*/sin δ at 1.59 Hz were used plotted rutting phenomenon. Figure. 12 display G*/sin δ versus temperature of MSM and PRAM. The high G*/sin δ values correlate with high rutting resistance. The results reveal that the MSM has higher G*/ sin δ values than PRAM. Hence, MSM has higher rutting resistance than PRAM because of using the different binder and aggregate composition. MSM uses the high-performance grade of a binder with combination aggregate and mineral filler, while PRAM uses the low-performance grade of a binder with aggregate and crumb tire rubber.
Conclusions
This study characterised the performance-related mechanical properties of thin surface treatment materials. The binder rheology and thin surface treatment adhesive and cohesive properties were investigated. The following conclusions were obtained.
1. In general, Precast Rubber Asphalt Mat has greater interfacial shear strength and shear stiffness compared to those of the Micro-Surfacing Mat.
2. The application of Rubber-Modified Asphalt reduces the sensitivity loading frequency and the temperature susceptibility of the Precast Rubber Asphalt Mat.
Figure 12. G*/sin δ of Micro-Surfacing Mat and Precast Rubber Asphalt Mat
Mechanical Properties of Thin Surface Treatment for Pavement Maintenance
3. The Finite Element Model result indicated that the Modified Leutner Shear Test reliable to evaluate the direct shear strength of the thin surface treatment. Furthermore, the Modified Leutner Shear Test results reliable to predict the rutting thin surface treatment phenomenon using G*/sin δ value.
4. The tack coat application rate is crucial to the interfacial shear strength of Precast Rubber Asphalt Mat. In this study, the optimal tack coat application rate (applied before the implantation of Precast Rubber Asphalt Mat) is 0.15 kg/m2.
5. From the direct shear test, the normal stress and displacement rate are positively related to the interfacial shear strength and shear stiffness. The interfacial shear strength and shear stiffness are negatively related to the test temperature.
6. Micro-Surfacing Mat had a high shear direct modulus, low loading frequency sensitivity, and better rutting resistance than Precast Rubber Asphalt Mat.
REFERENCES
AASHTO T 342-11:2015 Standard Method of Test for Determining Dynamic Modulus of Hot Mix Asphalt (HMA)
Al-Qadi, I. L., Carpenter, S. H., Leng, Z., Ozer, H., & Trepanier, J. (2008). Tack coat optimisation for HMA overlays: Laboratory testing. Illinois Center for Transportation.
ASTM C136-06:2006 Standard Test Method for Sieve Analysis of Fine and Coarse Aggregates
ASTM D3497-79:2003 Standard Test Method for Dynamic Modulus of Asphalt Concrete
ASTM D7000-04:2004 Standard Test Method for Sweep Test of Bituminous Emulsion Surface Treatment Samples
Austroads (2003a). Sprayed Sealing Guide, 18 pp.Austroads (2003b). Guidelines, and Specification for Bituminous Slurry Surfacing,
Austroads Publication No. AP–T26/03, Sydney, Australia, 51 pp.Cackler, E. T., Ferragut, T., Harrington, D. S., Rasmussen, R. O., & Wiegand, P.
(2006). Evaluation of US and European concrete pavement noise reduction methods.
Collop, A. C., Sutanto, M. H., Airey, G. D., & Elliott, R. C. (2009). Shear bond strength between asphalt layers for laboratory prepared samples and field cores. Construction and Building Materials, 23(6), 2251-2258. https://doi.org/10.1016/j.conbuildmat.2008.11.017
Collop, A. C., Thom, N. H., & Sangiorgi, C. (2003, November). Assessment of bond condition using the Leutner shear test. In Proceedings of the Institution of Civil Engineers-Transport (Vol. 156, No. 4, pp. 211-217). Thomas Telford Ltd. https://doi.org/10.1680/tran.2003.156.4.211
2 0 1 9/1 4 (2 )Gransberg, D. D. (2010). Microsurfacing-A Synthesis of Highway Practice.
National Cooperative Highway Research Program (NCHRP), 411.Hanson, D. I., & Prowell, B. D. (2004). Evaluation of circular texture meter for
measuring surface texture of pavements (No. NCAT Report 04-05). The Center for Asphalt Technology (NCAT).
Hegarty, E. (2008, July). IAT guidelines for surface dressing in Ireland. In International Sprayed Sealing Conference, 1st, 2008, Adelaide, South Australia, Australia.
Hoogenboom, P. C. J., & Spaan, R. (2005, January). Shear stiffness and maximum shear stress of tubular members. In The Fifteenth International Offshore and Polar Engineering Conference. International Society of Offshore and Polar Engineers.
ISSA A143-2004:2010 Recommended Performance Guidelines for Micro SurfacingISSA TB 100:2018 Laboratory Test Method for Wet Track Abrasion of Slurry
Surfacing SystemsKim, Y. R. & Jones, E. L. (2015). Development of a Testing System for Asphalt
Surface Treatments. Final Report No. FHWA/NC/2009-01, Dept of Civil, Construction, & Environmental Engineering North Carolina State University with NC Dept of Transportation Research and Analysis Group.
Losa, M., & Di Natale, A. (2012). Evaluation of representative loading frequency for linear elastic analysis of asphalt pavements. Transportation Research Record, 2305(1), 150-161. https://doi.org/10.3141/2305-16
Lu, Q., & Steven, B. (2006). Friction Testing of Pavement Preservation Treatments: Literature Review. Project Report, Friction Testing of Pavement Preservation Treatments as part of Maintenance Task Order FY06/07, California Dept of Transportation Division of Research and Innovation and Division of Maintenance Office of Pavement Preservation.
Mollenhauer, K., Wistuba, M., & Rabe, R. (2009). Loading frequency and fatigue: In situ conditions & impact on test results. University of Minho, Portugal.
Page, S. J., Patrick, J. E. & Dongol, D. M. S. (1998). Alternative to Sand Circle Test for Measuring Texture Depth. Report No. 110, Transfund New Zealand Research, Transfund New Zealand.
Pidwerbesky, B. D., Waters, J. C., Gransberg, D. D., & Stemprok, R. (2006). Road surface texture measurement using digital image processing and information theory.
Pierce, L. M., & Kebede, N. (2015). Chip seal performance measures: best practices (No. WA-RD 841.1). Washington (State). Dept. of Transportation.
Smith, R. E., & Beatty, C. K. (1999). Microsurfacing usage guidelines. Transportation Research Record, 1680(1), 13-17. https://doi.org/10.3141/1680-02
Stroup-Gardiner, M., Newcomb, D. E., Epps, J. A., & Paulsen, G. L. (1990). Laboratory Test Methods and Field Correlations for Predicting the Performance of Chip Seals. In Asphalt Emulsions. ASTM International. https://doi.org/10.1520/STP23507S
Tredrea, P. (2008). Development of laboratory measures to assess surfacings used in high stress applications (No. AP-T105/08).
Mechanical Properties of Thin Surface Treatment for Pavement Maintenance
Xiao, Y. (2013). Towards a performance evaluation method for durable and sustainable thin surfacings. https://doi.org/10.4233/uuid:eccb2deb-b329-4c7c-abf0-9250af716422
Xu, L. R., & Rosakis, A. J. (2002a). Impact failure characteristics in sandwich structures: part I: basic failure mode selection. International Journal of Solids and Structures, 39(16), 4215-4235. https://doi.org/10.1016/S0020-7683(02)00245-7
Xu, L. R., & Rosakis, A. J. (2002b). Impact failure characteristics in sandwich structures. Part II: Effects of impact speed and interfacial strength. International Journal of Solids and Structures, 39(16), 4237-4248. https://doi.org/10.1016/S0020-7683(02)00246-9
Xu, L. R., & Rosakis, A. J. (2003). An experimental study of impact-induced failure events in homogeneous layered materials using dynamic photoelasticity and high-speed photography. Optics and Lasers in Engineering, 40(4), 263-288. https://doi.org/10.1016/S0143-8166(02)00093-3
Yang, S.H., & Liu, G.W. (2017). Using Packing Theory to Improve Micro-Surfacing Mix Design Procedure and Evaluating Its Long Term Performance. In Transportation Research Board 96th Annual Meeting Compendium of Papers, Washington, DC, 8-12 January 2017. 370, 1-16. http://amonline.trb.org/
Yazgan, B., & Senadheera, S. (2004). A New Testing Protocol for Sal Coat (Chip Seal) Material Selection. In Transportation Research Board, TRB 2004 Annual Meeting CD-Rom.