MECHANICAL TESTING OF ADVANCED
COATING SYSTEM
VOLUME 1
By
T. A. Cruse
A. Nagy
C. F. Popelar
FINAL REPORT
SwRI Project No. 06-1778-001
Cooperative Agreement No. NCC 3-89
Prepared for
National Aeronautics and Space AdministrationLewis Research Center
Cleveland, Ohio
June 1990
- _ _" , ..... !) /:
C':CL. _ _.C
SOUTHWEST
SAN ANTONIO
WASHINGTON, DC
RESEARCH INSTITUTE
HOUSTON DETROIT
DALLAS/FT. WORTH
https://ntrs.nasa.gov/search.jsp?R=19910004221 2018-08-23T18:46:36+00:00Z
MECHANICAL TESTING OF ADVANCED
COATING SYSTEM
VOLUME 1
By
T. A. Cruse
A. Nagy
C. F. Popelar
FINAL REPORT
SwRI Project No. 06-1778-001
Cooperative Agreement No. NCC 3-89
Prepared for
National Aeronautics and Space AdministrationLewis Research Center
Cleveland, Ohio
June 1990
APPROVED: _
Ulric S. Lindholm, Vice President
Engineering and Materials Sciences
TABLE OF CONTENTS
3
4
5
6
7
8
9
10
List of Tables
List of Figures
Acknowledgments
EBPVD Coating Constitutive Tests
2.1 Specimen Design
2.2 Test Setup
2.2.1
2.2.2
2.2.3
2.2.4
Compression Setup
Tension SetupTest Matrix
Correlation of the Strain Measurements
2.3 Data Reduction
2.3.1
2.3.2
2.3.3
2.3.4
Composite Specimen ModelData Reduction Procedure
Compression Data
Tension Data
2.4 Data Interpretation
2.4.1 Compression Data2.4.2 Tension Data
2.4.3 Creep Data
References
EBPVD Tables and Figures
Appendix A: Elastic Bimaterial Model
Appendix B: Failed Specimen Photographs
Appendix C: Computer Plots of Compression Tests
Appendix D: Computer Plots of Tension Tests
Appendix E: Computer Plots of Creep Tests
Appendix F: MS-DOS ASCII Data Files (Floppy Disks)
e.ag °°,
Ul
iv
1
2
2
2
2
3
3
4
4
4
7
8
8
8
8
10
12
13
14
5O
54
66
87
103
107
TBC-FIN1.DOC -ii-
LIST OF TABLES
Table
I
IT
HI
IV
V
Compression Test Matrix
Tensile Test Matrix
Ceramic Modulus in Compression versus Temperature for Unexposed
and Exposed TBC
Ceramic Modulus in Tension versus Temperature for Unexposed TBC
Creep Rate Data Compression Tests
15
16
17
18
19
TBC-HN1.DOC -iii-
LIST OF FIGURES
1
2
3
4
5
6
7
8
9
10
11
12
13
14
15
16
17
18
19
20
Compression Specimen
Tensile Specimen
Biaxial Transducer
Compression Test Setup
Tension Test Setup
Schematic Compression Test Response
Schematic Tension Test Response
Compression Test Specimen
Schematic of Test Model
Linear Elastic Model Flow Chart
Substrate Modulus vs Temperature as Determined at NASA and SwRI
Deduced Ceramic Response m Compression for Unexposed Specimen18A at 75°F
Deduced Ceramic Response m Compression for Unexposed Specimen 19
at 1400°F
Deduced Ceramic Response m Compression for Unexposed Specimen21D at 1400°F
Deduced Ceramic Response m Compression for Unexposed Specimen 25
at 1800°F
Deduced Ceramic Response m Compression for Unexposed Specimen 26
at 1800°F
Deduced Ceramic Response m Compression for Exposed Specimen 30 at1000°F
Deduced Ceramic Response m Compression for Exposed Specimen 24 at1800°F
Deduced Ceramic Response m Compression for Exposed Specimen 28 at2200°F
Deduced Ceramic Modulus as a Function of the Test Temperature
eae,
20
21
22
23
24
25
25
26
26
27
28
29
30
31
32
33
34
35
36
37
TBC-FtNI.DOC -iv-
LIST OF FIGURES (CONCLUDED)
22
23
24
25
26
27
28
29
30
31
32
Deduced Ceramic Response in Tension for Unexposed Specimen 652801
at 72°F
Deduced Ceramic Response in Tension for Unexposed Specimen 652805at 72°F
Deduced Ceramic Response m Tension for Unexposed Specimen 653502
at 1400°F
Deduced Ceramic Response in Tension for Unexposed Specimen 653602at 1400°F
Deduced Ceramic Response in Tension for Unexposed Specimen 653704at 1600°F
Deduced Ceramic Response in Tension for Unexposed Specimen 653503at 1800°F
Deduced Ceramic Response in Tension for Unexposed Specimen 652802at 1800°F
Deduced Ceramic Response in Tension for Unexposed Specimen 653603
at 2000oF
Deduced Ceramic Response in Tension for Unexposed Specimen 652803at 2200oF
Deduced Ceramic Response in Tension for Unexposed Specimen 653504at 2200°F
Deduced Ceramic Modulus as a Function of the Test Temperature
39
40
41
42
43
44
45
46
47
48
49
TBC-FIN1.DOC -v-
1 Acknowledgments
The authors appreciate the technical support of Dr. Robert A. Miller at NASA Lewis Research
Center, and also that of Pratt & Whitney Aircraft in supplying the test specimens. Mr. David Nissley,
Ms. Sue Manning, and Mr. Keith Sheffler at Pratt & Whimey are acknowledged for their technical
support and interaction on the test matrix.
TBC-F_I.DOC Page -1-
2 EBPVD Coating Constitutive Tests
2.1 Specimen Design
The EB-PVD coating material has ahighly columnar microstructure, and as a result it was expected
to have very low tensile strength. To be able to fabricate the required compression and tensile specimens,
a substrate was required to provide structural integrity for the specimens. Substmte and coating
dimensions were adjusted, based on data previously generated under NASA Contract NAS3-23944 for
plasma sprayed thermal barrier coating, to provide sufficient sensitivity to resolve the projected loads
carried by the EB-PVD coating.
The use of two distinctively different strain transducer systems, for tension and compression
loadings, mandated two vastly different specimen geometries. Compression specimens were of a short
tubular configuration, as shown in Figure 1_, with 0.705 or 0.660-inch inside diameters, 0.022 or
0.045-inch substrate wall thicknesses, and 0.085 or 0.075-inch coating thicknesses, respectively.
Specimen length for all compression specimens was 0.874 inch.
The tensile specimen geometry used in the program is shown in Figure 2. The long, tubular
configuration was required to accommodate internal mounting of the biaxial, capacitive transducer
shown mounted in a cutaway biaxial specimen in Figure 3. Offset of the gage section from the center
of the specimen was necessary to provide appropriate space for the sensing element (body) of the
transducer, as it should not be exposed to elevated temperatures. Substrate wall thickness for all tensile
specimens was in the 0.0050 to 0.0067-inch range with an EB-PVD coating thickness range of 0.050
to 0.105 inch. Although thinner substrates would be desirable, machining and coating practices did not
permit further reduction.
2.2 Test Setup
2.2.1 Compression Setup
Testing of the tubular compression specimens was performed using the setup shown in Figure 4.
The compression load wain consisted of two loading anvil assemblies mounted on the stationary load
cell and the hydraulic actuator shaft of a 22 KIP capacity MTS, servo hydraulic test machine. The
loading anvil assemblies were composed of 1-inch diameter SiC and AD995 rods mounted in tandem
with the SiC rods positioned in the hot zone, at the specimen-anvil interface. The AD995 rods were
supported in water-cooled, flanged collets. Parallelism between the SiC anvil faces was adjusted tobetter than 0.0005 inch.
Heating of the test specimens was accomplished using an Instron Model 3118-008 high
temperature short furnace with a 1.13-inch diameter by 3 1/2-inch long cylindrical working hot zone.
The specimen was sandwiched between the two SiC anvils, and the assembly was centered in the hot
section. Temperature deviation from the nominal within the specimen gage section was measured to
be less than _'F.
Strain measurements were made using an Instron Model 3118-151 capacitive strain transducer
with a working range of 0.080 inch. The transducer employs two, small diameter, alumina reachrods
to transfer the generated displacement to the sensing elements. The reachrods penetrate the high
temperature furnace through small, strategically located ports, creating minimal thermal disturbance.
1Figures and tables are given in Section 4.
TBC-FINI.DOC Page -2-
Contact by the reachrods to the load train was made on the loading anvils immediately next to the
specimen/load anvil interfaces, thereby minimizing measurement of extraneous strains. In addition to
the use of the extensometer, the room temperature tests were instrumented with strain gages to obtain
additional data on coating behavior.
Loading of the specimens took place under appropriate crosshead displacement control, which
produced an average strain rate of 2x10 _ sec 1.
2.2.2 Tension Setup
Testing of the tubular tensile specimens was performed using the test setup shown in Figure 5.
The setup utilized the 22 KIP MTS servo hydraulic test machine used in the compression tests. The
specimens were coupled to the test machine through plug type, pinned, superalloy extension rods, which
in turn were attached to pinned couplings at both ends of the specimen, as shown. Use of the pinned
couplings facilitated final alignment of the specimens.
Heating of the tensile specimens was again accomplished with the Instron high temperature short
furnace used in the compression test setup. The specimen gage section was centered in the hot zone of
the furnace, and the shanks of the specimens extended to the outside of the furnace, where they were
coupled to the extension rods. Additional insulation was provided around the extension rods to reduce
heat loss through the rods and thereby enhance generation of a more uniform temperature profile within
the gage section of the specimen. The maximum observed deviation from the nominal test temperature
within the gage section was + 1 I'F. Water cooling of the upper extension rod at its connection to the
pinned coupling was required to prevent heat conduction to the load cell of the test machine.
Strain measurements were made using a high temperature, biaxial, capacitive strain transducer
developed by SwRI. The transducer consists of two sets of capacitive sensing elements housed in the
body of the transducer. These elements are capable of measuring axial and torsional strains
independently. In these tests the transducer was used in the axial mode only. The transducer is mounted
inside the tubular test specimen with two sets of three mounting arms equipped with knife edge type
contact points, as shown in Figure 3. The arms are internally water cooled, permitting their use at high
temperatures. The arms exert sufficient contact force to support the transducer inside the specimen in
a stable, vertically suspended position. Initial positioning of the supporting knife edge contacts
establishes the starting gage length for strain measurements. The small water cooling lines and the
minim electrical cables of the transducer are routed through appropriately sized holes in the lower
shank of the specimen located above the pinned, extension rods. The biaxial transducer was used on
all tensile test specimens for strain measurements. On two of the tensile specimens, supplemental strain
measurements were made using the reachrod type Instron extensometer utilized in the compression test
setup. In addition, some of the room temperature tests were instrumented with strain gages to obtain
additional information regarding the behavior of the EB-PVD coating. This attempt appeared to be
unsuccessful because of premature debonding and possible localized reinforcing effect of the bonding
agent used in the installation of the strain gages.
2.2.3 Test Matrix
The test program was comprised of 15 compression and 18 tensile tests. All the tests were
conducted at an average strain rate of 2x10 4 sec "1. The test temperature range was between 75 and
2200"F. Identification numbers of the specimens tested, the type of specimen construction, such as
substrate, coated, etc., test modes and test temperatures, and relevant dimensional data for the
compression and tension specimens are summarized in Tables I and II, respectively.
"mC-Fn';r1.OOC Page -3-
As evidenced by the test matrices, baseline (substrate) data, in both compression and tension
modes, were generated for nearly all test temperatures, as permitted by specimen availability. Testing
of the coated specimens was divided between standard, monotonic compression and tension tests and
optional tests. Optional tests covered modulus probing, stress relaxation behavior, creep, and multiple
unloadingand reloadingpaths,asshown inTablesIand II.
2.2.4 Correlation of the Strain Measurements
To verifytheaccuracy ofstrainmeasurements usingthehigh temperatureInstronextensometer,
two of the compression specimens,No. 20 (thinwall substrate),and No. 18 (thinwall coated),were
instmrnentedwith foiltype straingages ina halfbridgeconfiguration.Straindataobtainedwith the
two measurement methods on the substratespecimen were ingood agreement. The coatedspecimen
exhibiteda slightlydivergingtrenduntilthe substratereached plasticvalues. Subsequent readings
trackedingood agreement.
During performance of the tensile tests, attempts were made to measure the relative strain behavior
of the substrate and the EB-PVD coating. Two tensile specimens, 652801 and 652805, were instrumented
with foil type strain gages. On specimen 653801, the swain gages were mounted with a light coat of
M-Bond 200 adhesive. The strain gages prematurely debonded during the test, and no useful data wereobtained.
On specimen 652805, the intended sites for the strain gages were prepared by filling the voids
between the columnar structure of the coating with AE-10 bonding agent until an even area was
established for gage mounting. The strain gages were again mounted with M-Bond 200. Relatively
early debonding was again observed during the loading process.
Strain values generated by the strain gages were approximately a factor of two lower than those
obtained by the extensometers. This difference in amplitudes may imply a localized reinforcing effect
by the additional bonding agent applied.
A custom built "spider" like clip gage was also mounted on the coated surface of the specimen.
This extensometer was selected over the high temperature Instron extensometer used on the compression
specimens because of its ability to measure larger strains. Readings between the biaxial extensometer,
mounted on the substrate, and the "spider" gage were in good agreement below the 0.005 in/in strain
amplitude. At approximately 0.005 in/in strain amplitude, the clip gage trace shows a sudden change
in continuity, implying a possible partial debonding of the coating.
The high temperature Instron extensometer was used on specimens 652803 and 653704 to monitor
strain behavior of the EB-PVD coating. As in the case of the strain gage measurements on specimen
652805, the strain values obtained on the coatings were approximately a factor of two lower than thosemeasured on the substrate.
2.3 Data Reduction
2.3.1 Composite Specimen Model
In order to deduce the mechanical response of the ceramic from the test data of the
ceramic/substrate birnaterial system response, an analytical procedure was developed. Typically, the
response of the substrate may be considered as elastic - perfectly plastic. In compression and in tension,
the bimaterial response is generally bilinear. In the compression tests, the onset of the bilinear response
is assumed to occur when the substrate becomes plastic, as shown schematically in Figure 6. However,
TBC-F_I.DOC Page -4-
in thetensiontests,thebilinearresponseis attributedto crackinganddebondingof theceramic,afterwhichtheloadis assumedto becarriedby thesubstrate.A schematicof thetensiontestbehaviorisshownin Figure7.
Thededucedceramicresponsewhenthesubstrateis perfectlyplasticor theceramicdebondsistrivial. Staticequilibriumissufficienttodeterminetheloadsinbothcomponents.Whenbothmaterialsarelinearly elastic,however,the systemis staticallyindeterminate.Thus,it is necessaryto applycompatibilityconditions,inadditiontostaticequilibrium,to solvefor theindividualloadsin theceramicandsubstrate.Asthissolutionisnon-trivial,thepurposeofthissubsectionis todescribethedevelopmentoftheformulanecessarytodeducetheloadsandhencetheresponseoftheceramic.A detaileddescriptionof this developmentis givenin AppendixA.
Theassumptionsarethat(1)bothmaterialsarelinearlyelastic,(2)theaxialstrainsin theceramicandsubstrateareequal,(3)nodebondingoccurs,(4) thespecimendoesnotbuckle,and(5)themeasuredloadsandstrainsarenot influencedbyendeffects.Notethatin thefollowinganalysesanddiscussions,all loadsaretakenastensileandallpressuresareconsideredtobepositive.Themathematicalsymbolsusedin thederivationsaredefinedin AppendixA.
Thetestspecimen,shownin Figure8, is subjectedto anaxial load,Pr, and the corresponding
axial strain, _,, is measured. To deduce the individual stress state in each material, the ceramic andsubstrate were considered to be closed-ended, thick-walled cylinders [1,2] 2 whose state of stress is
described by
Pc pb 2 (la)o_ = _(c__ b_)+-(c__ b_)
c P b2 P c2b2 (lb)O_'-c__b2 r2(c2_b 2)
c P b2 P c2b2 (lc)t_aa- c2__ 2 + r2(c 2_ b 2)
and
_, _ Ps pb 2 (2a)_t(b2- a 2) + (b 2- a2--------_
• pb2a 2Oa,,- b 2-P_ba2+ r2(b 2 _ a 2)
(2b)
_ pb2a2 (2c)ors" b2-Pb_2 r2(b2-a 2)
for the ceramic and substrate, respectively.
2 References are given in Section 3.
TBC-FINI.IXX_ Page -5-
The elastic modulus and Poisson's ratio of the ceramic, denoted by Ec and Vo are generally
different from those of the substrate, denoted by Es and Vs. The resuk of these differences in the
mechanical properties is an "interfacial" pressure, p, which comes about with the application of an axial
load, shown schematically in Figure 9. During a compression (tension) test, the substrate tries to expand
(contract) radially more than the ceramic. Thus, there is a pressure (suction) at the ceramic/substrata
interface. This interracial pressure is related to the material properties (see Appendix A) through
vcEsAsPc - VsEcAcPs
P - x{EsAs[(1 - 2vc)b2 + (1 +Vc)C 2]+EcAc[(1-2vs)b2+ (1 +Vs)a2] }(3)
The pressure results in a triaxial state of stress for the ceramic and substrate, as is seen from Equations
(1) and (2).
Because the system is statically indeterminate when both materials are linearly elastic, it is
necessary to apply compatibility conditions, in addition to the equilibrium condition, to solve for theindividual loads in the ceramic and substrate. While the details of this work are given in Appendix A,
it can be shown that the load in the ceramic is related to the total applied load through
Pc = K(Ec)Pr (4)
where, for convenience, K(Ec) is defined as
K(Ec)b 2[EcAc(1 - 2vs) + EsA s(1 - 2Vc )]V,EcAc + D EcAc
DEsAs + b2[EcAc(1- 2Vs) + EsAs(1 - 2Vc)] (vsEcAc + vcEsAs) + DEcAc(5)
where
D = EsAs[(1 - 2vc)b 2+ (1 + Vc)C21+ EcAc[(1 - 2Vs)b 2 + (1 + Vs)a 2] (6)
It is possible (see Appendix A) to relate the ceramic modulus used in Equation (4) to the measured
axial strain and applied load by
_.__ Pr fK . _ VcEsAsK(Ec) (1 (7)
Although Equation (7) can be reduced to directly solve for the ceramic modulus, it was more convenient
to solve for the modulus by iterating on the ceramic modulus until the right-hand side of Equation (7)
agreed with the corresponding axial strain.
Thus, for a given axial strain and applied load, Equation (7) can be used to determine the ceramic
modulus, knowing the substrate modulus, Poisson's ratios for both the ceramic and the substrate, and
the specimen geometry. The ceramic modulus can then be used to calculate the axial load in the ceramic
by Equation (4). Equation (1) is used to calculate the triaxial stress state in the ceramic.
The technique described above is only valid when both materials remain linearly elastic. During
the compression tests, the substrate becomes plastic (taken to be perfect-plasticity). Conversely in the
TBC-FINI.IX:)C Page -6-
tensiontests,the substrateremainselastic,but theceramicundergoessevere damage in the form of
cracking and/or debonding. In either situation, the linear elastic approach is not valid and an additional
technique is required to analyze the test data.
For the compression tests, the substrate is assumed to become perfectly plastic for strains greater
than a critical strain, _,, after which the substrate is assumed to carry no further load than the load,
P_,,, corresponding to flow in the substrate. The system is then statically determinate. From static
equih'brium, the axial load in the ceramic is simply the difference between the total applied load and
the load in the substrate, P/_. Thus,
Pc=Pr-P_,,, (8)
Further, the interfacial pressure is assumed to be nonexistent. As a resuk, the state of stress becomes
uniaxial, as seen from Equations (1) and (2).
As was noted previously, cracking in and/or debonding of the ceramic occurs in the tension testing.
Because damage is not accounted for in the analysis, the linear elastic analysis is valid only to the onset
of severe damage to the ceramic. Presently, no technique is used to analyze the bimaterial response
beyond this point.
2.3.2 Data Reduction Procedure
The previous discussions described the development of the analytical technique used to deduce
the ceramic response from the ceramic/substrate bimaterial response. The following discussion describes
how to exercise the analytical technique to systematically reduce the experimental data (i.e., applied
load and corresponding axial strain data). A flow chart of this analytical procedure is shown in Figure10.
ha order to reduce the bimaterial response, specimen geometry and substrate material property
data are required. The substrate modulii in tension and compression were determined as a function of
temperature from tests conducted at SwRI. The data are shown in Figure 11. An "eyeball" fit to these
data is used to interpolate to intermediate temperatures. The substrate modulii are compared to apparent
modulii data derived from dynamic modulii data [3]. Poisson's ratios for the ceramic and substrate
were taken as 0.25 and 0.4, respectively. It is noted that Poisson's ratio was found to have only asecond-order effect on the deduced rest_onse.
The applied load and corresponding axial strain are also required inputs. If the axial strain is less
than the critical strain denoting the onset of plastic behavior in the substrate, an initial estimate of the
ceramic modulus is made. From this estimate, the right-hand side of Equation (7) is used to compute
an axial strain. If the computed axial strain does not reasonably agree with the measured strain, the
ceramic modulus is adjusted, and this iterative process is repeated until the strains agree. Once the
ceramic modulus is determined, the triaxial stress state is computed using Equation (1).
Should the axial strain exceed the critical strain denoting the onset of plasticity in the substrate,
the axial load in the ceramic is simply calculated by taking the difference between the applied load and
the load corresponding to plastic flow of the substrate. The uniaxial stress state is computed by ignoring
the interfacial pressure, as previously discussed.
TBC-HNI.DOC Page -7-
Hooke's law
1(9)
is used to relate the stress state of the ceramic coating to the axial strain. As it is convenient to plot
Hooke's law so that the slope of the plot is identically equal to the elastic modulus, o c -Vc(O c + o c) is
plotted against the axial strain in the ceramic.
2.3.3 Compression Data
The results of the compression testing of the exposed and unexposed ceramic/substrate bimaterial
specimens are shown in Figures 12-19. These datainclude the assumed and measured substrate response,the measured bimaterial response, and the deduced ceramic response. The substrate and bimaterial
responses are for uniaxial compression along the tube axis. It should be noted that the small dip in the
deduced ceramic response comes about from the difference between assumed and actual substrate
responses near the onset of yielding in the substrate.
The compressive ceramic modulus of the exposed and unexposed bimaterial specimens is given
as a function of temperature in Table FIT. Figure 20 shows these data as a function of test temperature.
2.3.4 Tension Data
The results of the tension testing for the unexposed ceramic/substrate bimaterial specimens are
shown in Figures 21-31. These data include the measured bimaterial response and the deduced ceramic
response. The bimaterial response is for uniaxial tension along the tube axis. As was previously noted,
the ceramic begins to crack and/or debond prior to yielding of the substrate. Thus, both materials are
assumed to be linear elastic throughout these calculations. The computations were carried only to the
point where the ceramic was thought to undergo severe damage.
The ceramic modulus in tension of the unexposed bimaterial specimens is given as a function of
temperature in Table IV. Figure 32 shows these data as a function of test temperature.
2.4 Data Interpretation
2.4.1 Compression Data
The substrate modulus test data are plotted in Figure 11, along with Pratt & Whitney-supplied
dynamic modulus data. Static data for the tension and compression tests were in good agreement with
each other at the various test temperatures, and slightly higher than the dynamic data. The test values
for the compression modulus at 1000"F are quite low, indicating a possible misalignment of the single
crystal axis relative to the test direction.
The ceramic modulus is inferred from the test records plotted in Figures 12-19 by taking a single
point fit to the bimaterial test curve at a point in the perceived linear regime. The analysis method of
Section 1.3 was then applied to derive the ceramic reponse below the yield strain of the substrate. The
resulting linear value of modulus is shown against each of the ceramic curves. As will be discussed for
each case, this approach was not always successful due to nonlinear behavior of the composite specimen
at low strains. Figure 20 plots the resulting ceramic modulus results versus temperature. Shifting linesfor some of the data occur as a result of applying engineering judgment to some of the test results. These
judgments will be presented below, for each test case.
"mC-FIN1.DOC Page -8-
Theapparentceramicmodulusat roomtemperatureseemsexceptionallyhigh comparedto thetrendline throughtherestof the data.TheRT testrecordhasananomaly,seenin Figure 12,whencomparedwith theothertestrecords.Thebimaterialstress-straincurveappearsto betrilinear, ratherthantheexpectedbilinearform. Theyieldpointof thesubstrateis setin this figureto thesecondbreakpointin thebimaterialresponsecurve.Theresultusingthefirst breakpointwasvisibly lesssatisfactoryin termsof thededucedceramicresponse,resultingin anincreasein themodulusof theceramicafterthebreak.The modulus fit used the two segments below the knee, as indicated. The resulting stress-strain
curve for the ceramic indicates a continued linear response, rather than a softening response. The second
linear region seems implausible. Most likely, the substrate modulus is far off, and the ceramic response
should be linear over all three of the linear portions of the test record. Use of only the last segment of
the ceramic stress-strain curve indicates a modulus much more consistent with the extrapolated value
from Figure 20, as shown by the shifting arrow on the data point.
This RT data interpretation is more consistent with the ceramic response at 1400°F in Figure 13,
where the tangent to the ceramic curve does not show apronounced bilinear break from elastic to inelastic
response. If a straight line is fit to the deduced ceramic response below the cusp, this slope is still valid
above the cusp, for a limited amount of further straining. The 1400"F data in Figure 14 contains a much
longer cusp effect, and it seems that the initial low slope is not valid. Superimposing the two 1400"F
curves gives a better feel for the gradual loss in linear elastic response starting at about 1% strain.
The test data at 1800"F (Figure 15) are linear above the cusp, although the response is offset in
the stress direction, due to the data interpretation system. This is best seen by parallel shifting a
straight-edge below to above the cusp. The linear behavior appears to extend to about 2% strain. The
1800*F data in Figure 16 indicate that the ceramic did not take up load until after about 0.8% strain. If
the two curves are superimposed but shifted in the strain direction, one can again see a reasonable sense
of an initial linear portion of the curve, to about 2% strain, before the ceramic shows nonlinear softening.
The data in Figure 20 for 1800*F have been corrected by taking the fitting point for the data reduction
model to be above the indicated cusp level.
The exposed specimen at 1000"F in Figure 17 is fitted by a high initial elastic slope (see Figure
20). However, if we use the trend from the earlier figures, we might take the modulus to be the fit from
about 0.5% strain out to about 0.1% strain. This value of slope is more consistent with the trend line
drawn in Figure 20, again shown by a shift in the original interpreted test point.
The initial modulus of the exposed 1800°F data (Figure 18) appears low, compared with the trend
line. However, again consistent with the other 1800"F test data, if we take the elastic response from
about 0.9% strain for fitting a linear response up to about 2% strain, the modulus agrees with the
unexposed data. The exposed specimen response at 1800"F (Figure 18) may be very easily superimposed
on the unexposed data (Figure 16). The negligible difference between these two is a strong
contraindication of any effect of exposure, at least at the test temperature of 1800*F.
The 2000"F test data were limited to a very small strain range. The test record was linear. If the
bimaterial response model is applied, the data point shown in Figure 20 predicts a very low modulus
for the ceramic. However, if we assume, consistent with other high temperature test results, that the
ceramic is not active over this range, the test record modulus is reasonably close to the substrate modulus
at 2000*F data. Thus, we recommend using the trend line for this test condition.
TaC-Fn_rl.DOC Page -9-
The2200"Fdata(Figure19)alsoindicateaconsiderablestrainin thebimaterialspecimenbeforeanyeffectof theceramiccanbeseen.After about0.8%strain,theresponseis nearlyelasticwith aslighteffectof softening,dueto creepin thebimaterialsystem(bothconstituentscreeping).If thedataafter 0.8%strainareusedto fit a modulusresult, the datapoint appearsquite consistentwith theextrapolationof thetrendline in Figure20.
Theceramicresponsein compressionis judgedto belinearlyelasticup to strainlevelsof about1-3%strainwith anonsetof strainsofteningatthatpoint,up to 1800"F.Beyondthattemperature,thelinearstrainlimit dropsagainto about2%,apossibleindicationof rateeffectsdueto creep.Theactual,detailedresultsshowconsiderablescatteratlow strainlevels,andengineeringjudgmentisrequiredtogetconsistentmodulusresults.
Theonsetof strainsofteningis seento increasewith strainlevel,from about1%strainat RT toabout3%strainat 1800"F,priorto theonsetof significantrateeffects.A possibleexplanationfor thiscouldbethereducednotchsensitivityof thematerialatthehighertemperatures(seeninplasmasprayedTBC), leadingto lessfracturesensitivityof themicrodefects,in compression.
No effectof residualstresscanbeseenin thecompressiondata. Thestrainat whichthebreakin thesubstrateresponseis used for the bilinear curve is shown as an arrow head on the strain scale.
Except for the RTtest, the break point is on the order of 0.7-0.75% strain. If we use the likely explanation
of the high breakpoint for the RT test, this breakpoint is consistent with the others.
No conclusion should be drawn regarding the existence of a residual stress for the actual
component condition. The compressive specimen is relatively short, and the substrate is quite thin
(flexible) compared with the component. We believe that the residual stress effect for these conditions
is likely to be too small to detect, given the level of crudeness necessary in this data reduction system.
2.4.2 Tension Data
The tension testing was qualitatively more difficult to interpret than the compression testing data.
The simple reason, of course, is the lack of any significant tensile strength in the ceramic. However,
unlike the expectation prior to test, the ceramic does have some apparent tensile strength. The following
discussion will attempt to provide some interpretation of the tension test resuks.
In general, the tensile behavior of the ceramic was seen to be elastic, up to a fracture strain. At
that point the ceramic ceased to have axial load carrying capability, but did act to reinforce the substrate.
In fact, the substrate single crystal material was found to exhibit absolutely simple, pure slip at RT
without any indication of slip locali7ation. The strain capacity of the substrate was enormous under
these conditions. While of little design importance, the phenomenon of reinforcement was very striking.
The reinforcement may affect the response of the substrate above the point of fracture of the ceramic.
The tensile testing procedure was changed from the original proposal to better evaluate some of
the unique phenomena of the ceramic's tensile behavior. Based on the compression test results, we
concluded that exposure had negligible, if any, effect on the ceramic response. We also deduced that
above 1400"F, the ceramic indicated an increasing creep rate. This behavior would also be expected in
tension, but is not judged to be of great importance, given the very limited tensile strength of the ceramic.
TBC-FIN1.DOC Page -10-
Thededucedceramicresponseis only meaningfulout to thepoint of maximumpredictedload.At thatpoint,theceramicdoesfracture(physicalevidenceduringtesting),andtheloadcarryingcapacityof theceramicdecreases,probablyquicklyasthestrainis furtherincreasedandmorecrackingoccurs.Thetestdesigndid succeedin minimizingtheeffectof thesubstrateonthetensilebarstiffness,andthebulk of theinitial stiffnessresponseis dueto thetensilestiffnessof theceramic.
TheRT testingresultedbothin pronounced, ideal slip in the bimaterial specimen data (Figure
21), and in sudden fracture of the substrate (Figure 22). The deduced RT tensile modulus was judged
to be higher than the trend line (shown for the compression specimen data fit in Figure 32). The ceramic
fracture strain in Figure 21 is about 0.2% strain. In the Figure 22 result, the substrate may have fractured
prior to achieving fracture of the ceramic. After fracture of the ceramic, the tensile bar load is all beingcarried in the metal substrate. Due to ceramic load shedding during fracture, the substrate quickly
acquires enough load to yield.
The first test result at 1400*F (Figure 23) shows linear substrate response following failure of the
ceramic at about 0.2% strain. The second test record (Figure 24) indicates about the same general level
of strain tolerance (0.2% strain), but considerably less stiffness. Vertical shifting of the test results for
superposition indicates significant variability in substrate elastic response. The variability in the test
results in tension, shown for these two specimens and the others, may be due both to thickness variations
in these very thin metal substrates and to the possible effect of the thinness on elastic response of the
single crystal.
The 1600*F data (Figure 25) clearly indicate linear substrate response with the fracture strain of
the ceramic at about 0.1% strain. However, the substrate modulus indicated in the extended elastic
response curve shows a value well below that expected for 1600*F. The low substrate modulus is
consistent with overpredicting the ceramic response.
The 1800"F data in Figure 26 indicate the point of ceramic fracture to be about 0.08% strain. The
second test result (Figure 27) probably has no ceramic strength in spite of what the data reduction system
shows. The modulus of the substrate is again probably too low, resulting in an inference that the ceramic
is carrying load. However, the linear response all the way to about 0.8% strain indicates that this is the
response of the substrate, not the ceramic.
The fracture strains of the ceramic at 2000°F and 2200"F are probably positive, but so small that
they are hard to record reliably (note that Figure 28 is plotted at a very high sensitivity). The data
interpretation problem is compounded by the increased creep effect in the substrate at these temperatures.The best estimate in the fracture strain comes from the 2200°F record, where the maximum tensile
ceramic strain seems to be about 0.025% strain. The creep in the substrate results in an apparent ceramic
hardening above the fracture strain as deduced by the data reduction model, but this resuk is not judged
to be real.
The reducing trend in the tensile fracture strain of the ceramic is probably an effect of the residual
stresses. As manufactured, the tensile specimens will lock in a tensile stress in the substrate and a
compressive stress in the ceramic. Due to the very thin substrate used, the load sharing between the
two is significant. If we take the stress-free temperature to be above 2200°F (assuming zero tensile
strength of the ceramic), the predicted residual strain in the ceramic is about 1.4%.
TBC-FIN1.DOC Page -11-
Thetensiletestingprogram included planned load reversals at various strain levels to evaluate
whether the ceramic fractures would close, causing a re-stiffening of the bimaterial specimen. The full
cyclic test records for these tests are shown in Appendix C. The conclusion from reviewing these test
records is affirmative, in that as the strain is reduced to the range of the apparent ceramic fracture strain,
the specimens exhibited higher stiffness, consistent with the stiffness prior to ceramic fracture. The
data also indicate, as expected, that creep in the substrate negates this closure effect unless one were to
drive the specimen into compression (this was not possible in the current loading arrangement). We
therefore conclude that the mechanism of ceramic failure is consistent with reducing the stiffness to
zero above a critical strain level, but requires a bilinear model to account for closure effects as strain is
reduced below the critical value. Creep growth of the substrate must be included to obtain the correctinteraction with ceramic crack closure.
The tensile modulus data have considerable scatter, owing to the extreme sensitivity of the data
acquisition system for the bimaterial specimen. However, the data indications are consistent with the
data obtained in compression. The failure mode in tension appears to be brittle fracture above a small
strain, and the fracture strain may be strongly dependent on the stress-free temperature effect and creepof the substrate.
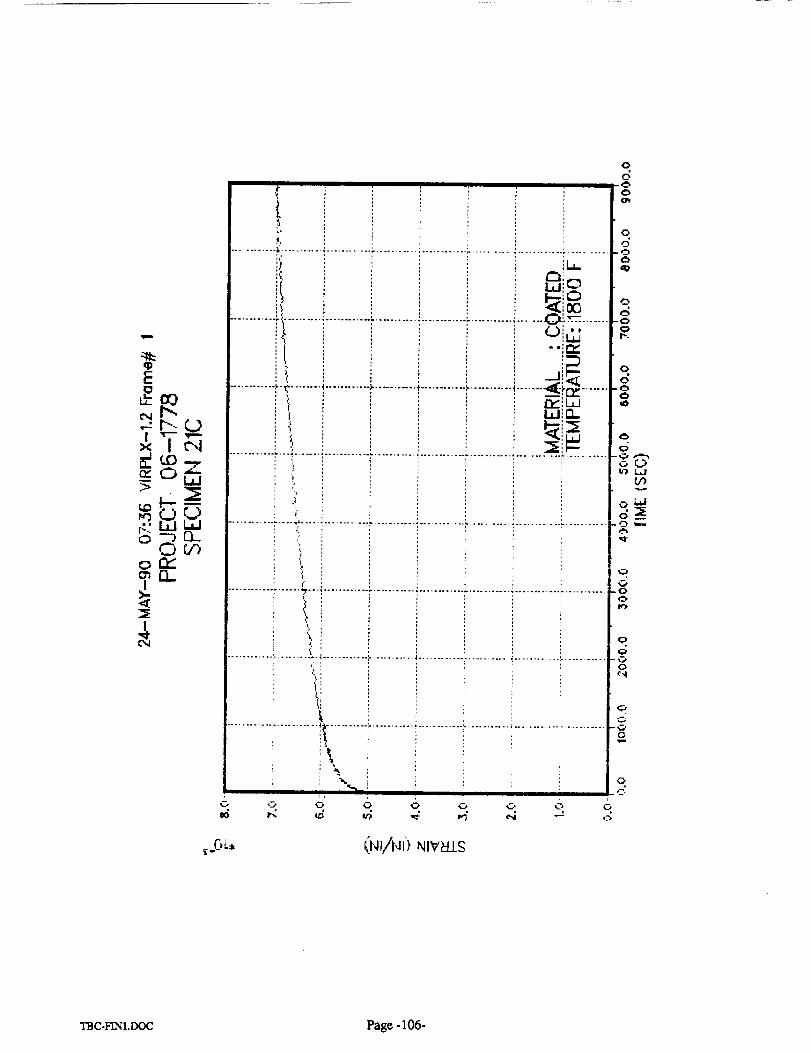
2.4.3 Creep Data
Three compressive, sustained load, creep tests were performed on Specimen 21, at three
temperatures: 1400"F, 1600"F, and 1800"F. All three tests were performed at load levels below the
proportional limit of the compression tests performed at the respective temperature levels. Using the
fitted ceramic elastic modulus data from Figure 20 and the applied load value, the elastic stresses in the
ceramic were 11037 psi, 8880 psi, and 7611 psi, respectively.
A viscoplastic model for the composite system is recommended to obtain the correct flow stress
in each material. The reason is that the creep strain in each material is the same as the composite creep
strain. The stress in each material is then that stress which will produce the resulting strain rate and
satisfy equilibrium with the applied load. It can be expected that this stress will not be the same as the
elastic stress, given above. Therefore, before final use of the strain rate versus stress for the ceramic,
it is recommended that Pratt & Whitney apply the viscoplastic model for PWA 1480 at the strain rates
given in Table V, predict the PWA 1480 stress level, and determine a corrected ceramic stress that
satisfies equilibrium with the applied load.
The creep tests show a clear primary creep transition and approach a steady creep rate for each
temperature. The creep rate data in Table V were obtained by a simple, estimated linear fit to the final
portion of the strain versus time plot for these tests, for which the data are given in Appendix D. A
preliminary comparison of the EB-PVD creep rate at 1800"F with that for plasma sprayed coating
(PWA264) indicates that the current TBC is more creep resistant than the plasma sprayed coating.
TBC-F_N1.DOC Page -12-
3 References
1. Timoshenko, S. P., and Goodier, J. N., _ of _, 3rd ed., McGraw-Hill Book Co.,
New York, 1970, pp. 69-71.
2. Boresi, A. P., and Sidebottom, O. M., Advanced Mechanics of _, 4th ed., John Wiley
and Sons, New York, 1985, pp. 492-500.
3. Private Communication (FAX re Elastic Modulii for PWA 1480 SC), Mr. David Nissley, Pratt
& Whimey, 31 January 1990.
TBC-FINI.DOC Page -13-
TABLE I
COMPRESSION TEST MATRIX
SpecimenNumber
17
18
19
20
21
24
25
26
27
28
30
31
32
33
34
Specimen
Type
Substrate
Coated
Coated
Substrate
Coated
Exp-CoatedCoated
Coated
Coated
Exp-Coated
Exp-Coated
Substrate
Substrate
Substrate
Substrate
Test
Mode
Compr
Compr
Compr
ComprStr Relax
Creep
Creep
Creep
Compr
Compr
Compr
ComprModulus
Modulus
Modulus
Modulus
Modulus
Modulus
Compr
Compr
Compr
Compr
Compr
Compr
Temp
(oF)
1400
RT
1400
RT
1400
1400
1600
1800
1400
1800
1800
1800
400
800
1000
1200
1600
2000
2200
1000
2200
1800
1000
1000
SpecimenInside
Diameter
(Inch)
0.7046
0.7060
0.7061
0.7040
0.7056
0.6598
0.6598
0.6598
0.6599
0.6597
0.7060
0.6596
0.6599
0.6590
0.7005
Ceramic
Thickness
(inch)
0.085
0.085
0.085
0.069
0.082
0.082
0.074
0.076
0.077
Substrate
Wall
Thickness
(inch)
0.022
0.022
0.022
0.022
0.022
0.045
0.045
0.045
0.045
0.045
0.022
0.045
0.045
0.045
0.022
TBC-bXNI.DOC Page -15-
TABLE II
TENSILE TEST MATRIX
SpecimenNumber
I
653601
653605
653701
653702
652801
652805
652902
653503
653504
653602
653603
653704
652802
652803
653502
Specimen
Type
Substrate
Substrate
Substrate
Substrate
Coated
Coated
Coated
Coated
Coated
Coated
Coated
Coated
Coated
Coated
Coated
Test
Modei ,
Standard
Standard
Standard
Standard
Standard
Standard
Standard
Standard
Standard
Standard
Standard
Standard
Optional
Optional
Optional
Temp
(°F)
RT
1400
1800
2200
RT
RT
1400
1800
2200
1400
2000
1600
1800
2200
1400
SpecimenInside
• Diameter
(Inch)
0.7506
0.7518
0.7515
0.7524
0.7510
0.7505
0.7507
0.7502
0.7517
0.7499
0.7527
0.7517
0.7525
0.7510
0.7530
Interface
Diameter
(Inch)
N/AN/A
N/A
N/A
0.7636
0.7637
0.7641
0.7630
0.7647
0.7633
0.7655
0.7641
0.7659
0.7636
0.7630
I P....
Outside
Diameter
(Inch)
0.7632
0.7652
0.7649
0.7652
0.8690
0.9620
0.9510
0.9535
0.9495
0.9530
0.9520
0.9422
0.9752
0.9525
0.8635
TBC-FIN1.DOC Page -16-
TABLE III
CERAMIC MODULUS IN COMPRESSION VERSUS TEMPERATURE
FOR UNEXPOSED AND EXPOSED TBC
Specimen Temperature Ceramic Modulus
ID (°F) (xl06 psi)I
Unexposed
18A 75 6.96
27A1 400 3.50
27B1 800 2.82i i i
27C2 1000 2.44
27D2 1200 2.52
19 1400 2.31[ II
21D 1400 2.50
21E 1400 5.40 <I)
27E2 1600 2.12
25 1800 2.48
26 1800 0.373i
27F2 2000 0.544
Exposed
30 1000 3.79
24 1800 0.957
28 2000 0.c2)
(1) Specimen was a second test of 21D.
(2) Ceramic modulus is very small.
TBC-FINI.DOC Page -17-
TABLE IV
CERAMIC MODULUS IN TENSION VERSUS
TEMPERATURE FOR UNEXPOSED TBC
Specimen Temperature Ceramic ModulusID (°F) (xl06 psi)
Unexposed
652801 72
652805 72
653502 1400
6.15
6.12
4.92
653602 1400 0.770
652902 1400 0.874
653704 1600 4.10
653503 1800 4.28
652802 1800 0.607
652803 2200 2.08
653504 2200 2.03
TBC-F_I.DOC Page -18-
TABLE V
CREEP RATE DATA
COMPRESSION TESTS
Temperature
(*F)Load
(Pounds)
6110
Strain Rate
(in/in/sec)
1400 2.4E-8
1600 5020 5.6E-8
1800 4250 8.3E-8
TBC-F_I.DOC Page -19-
• \\\\\\\\\\\\_\ N\\\ \
.\\\\\\\\\\\\\\\\\\\1
_//////////////////Mt
.874 -I
cS
EB-PVDCOATING
FIGURE 1. COMPRESSION SPECIMEN
TBC-FINI.lX_C Page -20-
ORIGINAL PAGE
BLACK AND WHITE PHOTOGRAPH
FIGURE 3. BIAXIAL TRANSDUCER
_u4trt_-,
TBC-HN1.DOC Page -22-
l" /'A _, ,Z.
BI.ACK AND WHITE PHOTOG_H
I
TI]C-FINI.DOC
FIGURE 4. COMPRESSION TEST SETUP
OP,IGtNAL _ . _Page-23- OF POOR £r_i'_E 1_
tel
II
SUBSTRATE
j BI_TERIAL
V
AXIAL STRAIN
FIGURE 6. SCHEMATIC COMPRESSION TEST RESPONSE
i BIMATERIAL
I
AXIAL STRAIN
FIGURE 7. SCHEMATIC TENSION TEST RESPONSE
"I'BC-Fn_I.DOC Page -25-
a,b,c
Pr,_
T F
_ = Initial Oucss
Compute _"
from Eq'n (7)
ADHJST Ec]
Pc = Pr - P_
i
I.ol
FIGURE 10. LINEAR ELASTIC MODEL FLOW CHART
TBC-F[NLDOC Page -27-
1 I 1 I 1 l I I I 1 I 1 1 1 1 I I 1 ] 1 1 I I I I I 1 I I
E I
.2u_ I_o -- I_LO
Ii.
&r--. _ ._
0 o __ IC.O<_ _ I
(1) c- o ,-.
,_E ,,!, e' o ,_0..'_ . _ I ,-
/n,, (,f)
" _ _ I n,." o
._-_ } / o, _/ 0 "E "V
E_° / E, _O0 / wl E _'
_0
* I I II I I I IJ J_l IJ I I I I I I I I
0 0 0 0 0 00 0 0 0 0 00 0 0 0 0 00 tO 0 tO 0
(!sd)(-_,+"o),,,- "o
o0
Z
oO.i°!0°d
ooo,:5
\
TBC-FIN1.DOC Page -29-
0
I I I I I I XI I I..I I I I I I I I I I I I I I I I I I IE
r, g
(!sd) ('-O+"O)4 -- =D
C)O
TBC-_I.tX_C Page -30-
Cj
Er_
C__D
o E
CEQ.Gr]
*Q
EgC_
q_
g_(J
C3
_1 l I I _1 I I 1 I I I I I I I ] I 1 I 1 I I I 1 1 I I i
0 0 0 0 0 00 0 0 0 0 00 0 0 0 0 (::30 _'] 0 _0 0 _f_
_ 0 r',. Lf] cN
o_o-X
00
Oo
{J_J
{/}
\
T_C-_[NI.DOC Page -31-
E
._OIL__o09(DO
0
o.E
or)(J
.i
E_0
(D
(J
_,+._
II I I I I I I i I I I
ILl
IIIIIII
0000
0 0 0 00 0 0 00 0 0 0
0 LO 0
(!sd)('_+"_)n- "_
I I,_ 11 I I
0
1210G
_4
0
1°0
0
00
ok5
TBC-HNI.DOC Page -33-
oE _
°_0
EEO__E
E .
o_
OGL
_0-_ ,¢._<D
[ I' I I I
0 0 0 0 0 00 0 0 0 0 00 0 0 0 0 00 Lr_ 0 _ 0
TBC-FINLDOC Page -34-
o0_,
.c_ C_
_g_E
Q.
E.o_,L
(-)Q_
-o,,x,
_oa
00
o o o o o o Oo\0 0 0 0 C_ 00 0 0 0 0 0 10 _ 0 _ 0
TBC-F_N1.DOC Page -35-
c-O
c-
r_.__.00
r'_
I I 1 I
I I 1 I I I I 1 I | | I I II _1 I I t I
N
IIIII I
0
c5
fi _. _
i
-i i i i i t j t t i i i i i i i i i i i ! j t i I 1::30
o o o o o o oc_0 0 (D 0 0 00 0 (::) O 0 0O L,O 0 _') 0uO Cq 0 r" LO
(!sd) ('.o+"D)a --=O
c_
o
'I"BC-FIN1.DOC Page -36-
I,
C_
oE
04_s0_
E_C_--L.
.---_56O(/3
L_
O_
E0
C)
C)0
I I I I I t I I I Z
_o--=x _ oo zde" °E
L_O0 o__'
__ ° _ <_-',-I_ _>
oo °o
= e c
i,iOn,"
0
J 1 I I _ I t I I00 tD _ c,4
ct"WQ_
I,I0 t--
- 000
0--0
00
il¢b
(tsd 90 L x) SNqNCIObl OIINV:N30
T_C-F[Nt.DOC Page -37-
hO
¢..-OO,,I
¢.-
I--
c_00.._C
_E.___
0L.
q_'U
nt_0
000
_1
41
¢-
-- O
o_
- _
- E
I I I I I I I I I I I I I I I I I I I I I I I I I I I I
41,101
,OQ.
01IU
l'Y
O
F::
413
U
cq
O
O
OT"--
-O
-o
_O-O
-O c
- C
_-_z-O_
-c_n"- I---
- .._I
-_x_0_-0
"- _ IO_- @ -
N 41J / --
-_ '', . -°-:o°-TM
OI t I J I I i I I I I I I t ', I J I i I I I t I I I'"l"_f_ 0
o o o °0 0 00 00 u'_
(tsd) ('Ln+"D)_ -"D
Zo
0++
TBC-FINt.DOC Page -38-
C _,
n,-E0--
x_
nI,..
0
_I I I I I I I I I I I I I I I 1 1 1 1 1 1 1 1 1 1 1 1 1 1_cSc_
oo Z
o ._
_zr.)
- _U U
I I I
0 0 00 0 00 0 0
/ _ _
___/ ZZ
0o.0
00
o o.
0
(!sd) ('_+"o)a - =o
TBC-_I.tX>C Page -39-
I I 1 I ] 1 I I I I I I ! 1 l I I l 1 1 l l I I ] i I i I
Illltll
(!sd) ('_+".o)4 - "o
00
TBC-FI_I.DOC Page -40-
c°0'_t"
<D -+-,i--O
r-,-E<,
"O0_l:)_(j X
-IC_E
I I I I I I I I I 1 ] _ I__l,I I 1 I ! I 1 1 I I I I I I I I_-
F,
o?
i o o -
Ill {:: _
_ o _
\
-I I | I I I I I I I I I I | L ! I I I I 1 | I t l I I I I
0 0 00 0 00 0 0if) 0 ff_
(!sd) (",,_+".0)4 - ".0
C"4
Sc_
o0
6
0
_z ;'_
od _
0
00
0
TBC-FIN1.DOC Page 41-
co°.0_
E
{UP'-
0¢0(3=U_ C
a:.E_
E a.ou'l
0 X
-El C
aL.
o
I I I i I I 1 1 1 I I I [ I I I I I I 1 I I I I I | I 1 ID
MC
g
-I 1 I I 1 I I I I 1 1 1 I
0 00 00 0if) o
0
0
el
m
rr
c_
4o
_d
0d
0 "_
-0 c _["- t/_
- _ z_;- c _- _ r'.-- _
_z._ -_ZE _
_ , -o<o/ -dr" V}_, _ _tJmU - --J _._
0<( 0_°l -0 m
i i "t'N _0
% N -
0_ _ _ I _ 0
o o °.
o0
(!sd) ( _'..0+'.0)4 - "".0
TBC-F[_LDOC Pas¢ -42-
_1
m
b_ ,.o
0El:Z) -OaOfFj _ -E¢_"6 -I---
e_:
0 -a. _
_-_ -a::E
°m °
O
0
000ff'l
I I I I I I I I I I I I I I I I I I I I I I I I I I I I
I 1 I I I I I I t I I i i I t I
0000
(!sd) ('_+"_)a - "o
Z0
Z;_
rj Z
T_C-FT_I.DOC Page -43-
oL,-
cg000
._,--
F..__
_L.C)
_cr".E_
goo x
I 1 I I I i I I I I I 1 1 ! f_l I I I I I ! I I | I 1 I I --
\
_t
\ -
_1 I I I I I I I I I I I 1 I _ I i I I I i I I i I i I t 1
0 0 00 .0 00 0 0
0 L.C),mr""
(!sd) (_mo+"o)4[ - "_o
(',4
oc5
oOc5
o _-
0 m
d
O0
o o.0
T_C-F_L[X)C Page-44-
i I i I 1 I I I I I I i I t I I I ! I I t I l I t I
O 0O 00 00
(!sd) (',_+",_)a - =o
0
0
0
0
0
00
o°0
2:
¢.q
z
'I"BC-ENI.[X)C Page -46-
co°0 t",,I
Lr)
C
e:E
.<2_'_E&,0
C3
0
i I 1 1 11 1 1 1 11 I 1 11 I 11 1 11 I I I I I I 11 1
I
I
I
m
1
w
i
I
I
m
I
i
I
I
D
I
i
I
I I I I
000
It.l,
il: ,_1- <
® .v_ -_l0 E -c _0_o .o -0
Q. ® -- (_I
i
00
6
00
o o.0
w U@
l_ u
°VI.E_¢,n
i i i i i I i i i i _ i t i i I i i i i i i i_li_l
0 00 E)0 C)0 Lr)
O,4
Se$
oC)
0
ej
°_ cJ
(!sd) ("_+".o)4 - ".o
TBC-FI]qI.DOC Page -47-
+L,._
c_
E+.,__o.__.,_
0EL
r": E
0
<3.)"t_r+jO
(/I
a
0
I I I I I I I I I I I I I I I I I I I I I I I I I I I I I I I I I
-+ + +_ _C -
_ -
0 0 0 00 0 0 00 0 0 0'_- r_ 04 _--
00
o°0
(tsd) ("..0+"o)4 - ".o
l,q,000
zo
i++2::, mod_ z
L¢3m
_z
- _r_
m_
\
TBC-_t.DOC Page -48-
c-O
c-"m
b.__
O_
_E
"O
I--L)
O-4-_
¢) ,._._(Do
¢)0_
(nc-
l---
O
I I I I I I I I I
4J I , I _ 1 I I
(!sd 90 t x) SRqFIGOFI 911dVW30
00
o4
oo Z
oo
oD u :_
W
w _o _
e4
° _12)
00
"mC-F_L_X: Page -49-
5 Appendix A: Elastic Bimaterial Model
The following is a detailed derivation of the linear elastic model used to deduce the ceramic
response from the ceramic/substrate bimaterial system. Table A-1 defines the mathematical symbols
used in the derivation that follows.
Table A-1
Definition of Mathematical Symbols
Symbol Definition
a,b, c Inside, interface and outside radius, respectivelyk
Ac,As Cross-sectional area of the ceramic and substrate, respectively
uc, Us Radial displacement of the ceramic and substrate, respectively
e,c, _ Axial strain in the ceramic and substrate, respectively
Pr,_,, Total applied load and corresponding axial strain
Pc,Ps Axial load in the ceramic and substrate, respectively
Ec,Es Elastic modulus of the ceramic and substrate, respectively
Vc,Vs Poisson's ratio of the ceramic and substrate, respectively
o c, os,, Axial stress in the ceramic and substrate, respectively
oC_,oS,, Radial stress in the ceramic and substrate, respectively
o_,ffsoo Circumferential stress in the ceramic and substrate, respectively
_, P,o,, Critical strain denoting plastic substrate behavior and the corresponding
axial load
Figure 8 defines the cross-sectional area of the ceramic and substrate which are given by
A c = _c 2 - b 2) (A - la)
As = _(b 2 - a 2) (A - lb )
From the thick-walled cylinder solution [1,2], the radial displacements of the ceramic and substrate
are given by
TBC-F_I.DOC Page -50-
us -rl-2vs)(-pb2)+(l+--v2s)b2a2(-p)-vs_1Es(b__a2 ) (1 r _ .J (A -2b)
The radial displacements at the ceramic/substrate interface are given from Equations (A-2a) and (A-2b)
by taking r = b. Thus,
b 1
b [ 1-2Vs)(-pb')+(1 +Vs)(-pa =)-_S1us =Es(b__a_)m ( s _ j
(A _ 3b)
Assuming no debonding at the ceramic/substrate interface, the radial displacements must be equal.
Equating Equations (A-3a) and (A-3b) and solving for the interfacial pressure, p, gives
VcEsAsPc - VsEcAcPs
P = _{gsAs[(1 - 2vc)b2+ (1 + Vc)C2] + EcAc[(1 - 2vs)b2 + (1 + Vs)a2] } (A - 4)
The axial strains from 3-D Hooke's law are given by
1 c= +o ,)I
x _v+(o_+_)1=gt4,
The normal stresses in the ceramic are given as
Pc pb 2
(_ = =(c'- b")+-(c_- O2)
c Pb 2 Pc 2b2
C,, = c2_ b2 r2(c 2_ b2 )
c Pb _- + PC 2b2o_- c__-_ :(c__b2)
Similarly, the normal stresses in the substrate are given as
(A -5a)
(,4-5b)
(A-6a)
(,4-6b)
(A -6c)
TBC-F_I.DOC Page -51-
Ps pb 2
O_: - _(b2_ a2 ) + (b2_ a2) (A - 7a)
<"-,;":a'-"r',7;:"a"> (A -7b)
Substituting Equations (A-6) and (A-7) into Equations (A-5a) and (A-5b), respectively, gives
1e,c = [Pc + _1 - 2Vc)pb 2] (A - 8a)
= _ Its - _1 - 2Vs)pb 2] (a - 8b)
Noting that the axial strain in the ceramic must equal the axial strain in the substrate, equating
the axial strains given in Equations (A-8a) and (A-8b) and solving for the load in the ceramic yields
( E,:A_'_
2 s)p*J- 2 )pb
Substituting Equation (A-4) into (A-9) and simplifying gives
1
Pc - DEsAs{DEcAcPs + b2[EcAc( 1 - 2Vs)
where, for convenience, D is defined as
+ EsAs(l - 2vc)] (VsEcAcPs - VcEsAsPc)}
D = EsAs[(1 - 2Vc)b2+ (1 + Vc)C2]+ EcAc[(1 - 2vs)b2 + (1 + vs)a 2]
(A -9)
(A - 10)
(A- 11)
Pr= Pc + Ps (A - 12)
From equilibrium,
Or, equivalently
P_ =P_-P_
Substituting Equation (A-13) into (A-10), it can be shown that
Pc = K(Ec)Pr
where
b2[EcAc(1 - 2Vs) + EsAs(1 - 2Vc)]V,EcAc + D EcAc
(,4 -13)
(A- 14)
(,4 - 15)D EsAs + b 2[EcAc(1 - 2Vs) + EsAs (1 - 2Vc )] (vsEcAc + VcEsAs ) + D EcA c
K(Ec) -
TBC-F_I.DOC Page -52-
Finally, substituting Equations (A-4), (A-13) and (A-14) into Equation (A-8a) yields
ec_ Pr tK(Ec)+b_VcEsasK(Ec)-VsEcac(a-K(Ec))](X-2Vc)}_cAc t D
(A - 16)
TBC-FI_I.EX_C Page -53-
COMPRESSION SPECIMEN NO. 17, PHOTO NO. 40668
COMPRESSION SPECIMEN NO. 18, PHOTO NO. 40669
TBc-Fn_I.DOC Page-55-
COMPRESSION SPECIMEN NO. 19, PHOTO NO. 40670
#2O
COMPRESSION SPECIMEN NO. 20, PHOTO NO. 37271
TBC-_:NI.DOC Page -56-
COMPRESSION SPECIMEN NO. 21, PHOTO NO. 40671
COMPRESSION SPECIMEN NO. 24, PHOTO NO. 37271
TBC-F_tI.DOE Page-57-
COMPRESSION SPECIMEN NO. 25, PHOTO NO. 31770
COMPRESSION SPECIMEN NO. 26, PHOTO NO. 37269
TBC-IKN1.DOC Page -58-
COMPRESSION SPECIMEN NO. 27, PHOTO NO. 40672
TBC-FIN1.DOC
COMPRESSION SPECIMEN NO. 28, PHOTO NO. 40673
Page -59-
COMPRESSION SPECIMFM NO. 30, PHOTO NO. 40674
31
COMPRESSION SPECIMEN NO. 31, PHOTO NO. 40675
TaC-_I.tX3C Page -60-
COMPRESSION SPECIMEN NO. 32, PHOTO NO. 37268
COMPRESSION SPECIMEN NO. 33, PHOTO NO. 40676
TBC-F_.DOC Page -61-
TENSIONSPECIMENNO.652801,VIEW NO. 1,PHOTONO.40731
TENSIONSPECIMENNO. 652801,VIEW NO.2, PHOTONO.40732
TBC-Fn_I.DOC Page-63-
TENSION SPECIMEN NO. 652801, VIEW NO. 3, PHOTO NO. 40733
TENSION SPECIMEN NO. 652801, VIEW NO. 4, PHOTO NO. 40734
I13C-FENLDOC Page-64-
TENSION SPECIMEN NO. 652801, VIEW NO. 5, PHOTO NO. 40730
TENSION SPECIMEN NO. 652801, VIEW NO. 6, PHOTO NO. 40735
"mC.FINI.IXXZ Page -65-
N-OILl--) _j0n_ ZO_ W
OD_
•-_ a_I GO
_D
! i !
....... . ....... ........ ........ ........ • ......
(Dft..
($87 > _U07
T
0
L_
Z
Z
_J
Z
n_
TBC-FINI.DOC Page -67-
Iii PO-) POO_Y Z13.. W
GO_h- E)IX- Ill
' I ' ' I ....
" I
-i
($8]) CUO]
7
Z
Z
{E
F--
T_C-_I.DOC Page -68-
k-I'--.I
LLI "-J"--, r'-%C,n.-"Z1.3_ILl
Z--
0".}[',_ r--)r.... LLI.,--, 13_
,j)
' I ' ' I ' I ' I ' I ' I '
'/1( _lI'III j I I _ _'_l:'I] I I ..... I ...... I I I I
.... " ...... " ............ i," ....
,I
........ / ...................... ?'. ........[i-ic ...../
I'
I
, 0 _'...... .t .... :........................... rJz,_'J " "
•--,. C.z
¢.,
t •LLII,, . IL_
• II-- ...... --'_t.... ..._...:..... :...... :..... :......:.... ..,:._..• \ ..... iT'- _r'r
t
• \_ .... n,'. W............. ,. .... :............. " ...... ".... __woz
".,, I--: Z. (T_-W% '
%
%..
............................ ..........
.%
i l I l I I I I , I , I , 1 , "_
,_, ,'u IT.., _ ,D _
r-- ,£, _ ',,r- r-1 ,.",4 _ _;
'{ S8"-J ':' I_Cl-I
_Do4
t_
£,j
_P
_D
_D
OJ
.,--,.
Z_
,"T"
I,---I
-%...,-
I,--.I
n--i.--03
"mC-FINLDOC Page -69-
F-
[-,.
L_
_._ ..... :................................... :.,,_...
.............. ,_ .L.U , .
I i L i I t I i
Lrl
C_
I'_ OJ -'-4
,::8}_]::,,fiIVO-]
_J
r#
,x,
_k
It)
_.,
,"7-
F---
_]v-03
TBC-FiN1.DOC" Page -70-
I--_:_Iii I_I
C_Z
d'l Ill
I_- III•---,fl_
....\i:........:....:....:....:........:
i,_
.,4-I-,,-I
I--
,d
TBC-F2,_I.DOC Page -71-
I--L"la_l-3. 1",3c,
7-ca.. lad
I_- IJJ
I
....!.........!.........!.........!.........
(SSq) CtSOq
8_
j--,,
r-
r
ZI---4
<IrrI.--03
TBC-FIN1.DOC Page -72-
k-0iii <I"-) CO
n_8_ Z
WCOT
kid O3
, t , 1 , I l 1 I , J I , I I 1 J
(SSq)
_k
Z
Z
Z
e r_F-O3
T
e#
TBC-FtNI.DOC Page -73-
W _.--),I"_O _Jn_8_ Z
W
h- _-__- ___,--4WIkO 09
• 'q.,,
: _.:
• \,
i %. C................... X_..' ........................ d'_._ ''
',s .• " : --,\ i • --,i i . "_k_.. . • --• . • .. • • ,C22"_2
• . - :\_. - "n'W
.. ,: I-.-: Z",,,:",, ...3z.LLI
X_b, "---!
.... _......_...... i...... i..... :_.'_,.,..... _......
,:::S8q ) 0U 0q
¢,
1,1"_
i.=--i
12",,I .._,.fro
¢w
_' 01.i
\,
'rBc-FINI.IXX2 Page -74-
F-L;, ,---+Ill rrl--) f...._0 _,J
0._ ZW
P-,- 0•--+ mI n
t_
.... ..\_..: .......................................
.+_ "l. L
"' " I_l
i ",2",, '• "_. h W
.... _ ...... i ...... ;..... ',_ _-:\.... _ ...... ; ...... Yn" " "
.... \ \ . . ._.j._--
? ? ? :\\s:" : _:_: : : i ,\ i _iw.............................. 'h- '_ .......... LuJ...(_ . •
.....i......i......i......i..... ....i......\, .
I
'v
f.- _ _ ".I- M 0,I
(c,_S-I) LI;_ C,-I
b',
Ij_l
_f
/
n--I--
TSC-F_I.IX)C Page -75-
F-
L_N:I
CL_
_)'_.
Iq©
_-]
_r
C"J
.,'7"LU
(_'lIJl
' f '
_'tz
......... %, ...........................................
\
'_,:,
................. ,, ........................... i _t"_'$' ' J_,l,./%
_/' Ct• %.,
_u'%%%, • .
• ._...,................... }._ .-
_.JF-
" _: I._U............................... _'V ......... t._ :LL:
i . . - \".. . ";:I LL.I
• : : i \\,:hX
•i...... i ........... :_,,,_ ..... ......
• ....... :\\,_.,
11 " .
9
..... I I i i
_ _ _ _ _, ,7.,1r-- _, _'_ _ _'_ c,,,I
(ssq) cNoq
_T
6:1
r_r_
I.ii.,¢.,ir_
U-I
i"c._
s
I-"4
%.,-
Z
I--
'rnC-_l.tX:_c Page -76-
F--
L.U
D
_J_
CO
F',-
I
E'J
ZW
WD_Li3
c_
_, %, •
,..,
\'2"-,................... o ................................i i
"L^ "_t •
i i ', _.,--
..... _ .................................... .,. ,,:..........._ "I 't
d
E.EUF--
__.
"_11"l
<0: _','l '_1
LI.J L,
l.JJH-
I m I J i i L I L I I
t'%,
i't-,
I%)"ll"
LI:,C'J
C',/
U3
8
",.
I-'-4
"x_/
I--
TBC-H]_LDOC Page -77-
F-L_
CI._ 7-Itl
CO ..'.--rx.r-.- L:,
mI 0_L.D 11)
' I ' ' ' ' ' ' ' ' I '
• , Ii l ............................................
!
....i'\..........................................i
'\. b
L,\................................ dr",
'\ __--_
_CI2e'X
_Wi
\i' i ..................... W-t?.. •t--- '_
_\i a: w>-'H-
, I J
,',_SSq ]:,, Cb_Oq
"", • !\ ................... : ...." .,K
".*"x
........................ : .... :. _.-_...__ .............
"_--.,.,..i7-\
i I _ I i I I i I ; i _ 1 _ "
d:}
P_
(I)
1111
U_
IT.,
,.__."
N,.,-"
TBC-FI_t.IX)C Page -78-
OJ
' I '
"\_!1.... : ...............................
%, .
" %
\\
................... !\_ ........... ."
.,_ ,-4 ,-_ . --_ --_ C[_ _._ _1_ ':_[
i S8q) C[b_Oq
6}
11"
o,I
"7-
",,_z
ZI---4
rr-I--
TBC-FINt.DOC Page -79-
lzl
n
I
,Cs
IJl
_J
ZW
I"'-4
W
' I ' I '
'4b.
xL'L u
............... "_:-.............................. _,'1 •
I, t
\ ",, _._l
....... : ........ :...... -\,_,. ........ : ........ :..._..
.............................. _k_......... W.-_.. •
? i ! !'\X Z _-
i
I I
"1
_ I _ I ; I _ 1 _ I
o._ l.I], ',1" I_, "'_
.r_(S_-I ::, CUO-1
a_
a_
l,J",,CJ
,-*j
I..P
,.T.,.,,,.l
Z_
-__.¢
._q_
W-
TBC-HNLDOC Page -80-
W
rr" ZCJ_ W
P_- LJ.J
I ' I ' I ' I ' I ' ' I ' I ' I ' I ' 1 '
\
($8]) (I_0]
Z
Z
r _)
"7"
n-"
Ol
.,4
TBC-F_N1.DOC Page -81-
C_J0
ZQ._ ILl
I LO
' I ' ' I ' ' i ' I ' ' i ' I '
\
i!!\iiiiiiii
X...<
I , , L , A _ , I l t l , I , | t "_"_l
+,-..,.
l,.==.q
ZI-.-I
"s...,"
ZI--M
I-...-O3
'rBC-F[NI.DOC Page -82-
t--
W
O
0"3_
p,_
ItD
_J
Z
_D
C(:,
' I '
' • LT___I
., . .(,,}
................. ;\i ................... 7_
. _. _
........................... _L '\. " .......... _L.I..CL -.
•, ;\[\_ ,_: m
'\i \",\
" "t%
• i % ,i,.%
% ,..
-\
U'_ i_, b'1 _, 1,1"I i._, ,J
( :.,:-i ::, CUO-I
LI:IOJ
7-
"-,.,
I--4
c
<2:Cr_I--
TBC-FINI.OO(2 Page -83-
k-L_
On_ Z8_ W
I_- W•-, 8_I _/_kO
! ! I | I I ! I I I
'1
\
\_.r,
. i -
........ :.5 V ............................... i ....
_.
\\
'\\
t J I I I I I I I I
I,D
I_l
Zi,i..-i
I.i!
Z
n-"
CO
TBC-F_I.DOC Page -84-
! I i I I t ! I I ! ; I
F--L)LO _3""3 N0rY Z8_ W
CC, _-4b- L3r,- LO
kO_O
(SSq) O Oq
1,0
Z!---I
Z
rr"I.--t._
.,4
TBC-FrN1.DOC Page -85-
' I ' I ' I ' |
I----0t.tJ CO
0or" 7"O.. l.d
Z
Ix.. (.2Ix.- t.t.I•--t Cl
I 60t,Dt521
0_
0,1
m . . _1. ................................................]
\
.... ..............i........i........i.......
iiiiiii iiii
, ssq) ([NOI
T'-
g .,-.,
'7"
ZI,,--,4
,'7"I-,-.4
<ZtwI--O3
TBC-FIN1.DOC Page -86-
q)
E
_ao--_P'.O
c_ C_-7m
I
I
o
0
If)
............... _...... _........ '........ F ........ 4................ _ ......
o
.......7........i.......",.......",........i.......i......._........",.......;......._- "_" ........_,
EiiiiiEiiNr.-,|.......J........i.......i.......J........L.......i.......J........L.......i.......m._......._
........,......._.._.......L__-....... _........ _....... _........ ,........ _ ....... _....... _........
........ i........ _............... ,........ _ ....... _ ......
_0
.,........ f .......
.......,_................................................._........,,..............._........,,.......
: i
IN : ;
....... ....... ....... ... _,_..............
i
I
c o o c; _ o ,S d o c; o
.g
©
:x-
rr,
o
o
#..-
CG-
O
C#d
TBC-Haql.DOC Page -88-
E
x
r'r
z
oIr'r
_EI
.......i..................... : ......._ ...... i.......E
0
0
.0
_ _,i,=_
0
C>0
0
d
......_........F ......._ .......',........_ ............... ,........b,......._................_.......
,,
........................................................................i................!.......
i :/
...........',.......,_........................,_............... _ ......
i ,
......_..: ................._........;........,........,................_ ..............
___1._ i ! i .i i ! ! ! i i _....N .I......._......_;..............'...............;.....;..............._........ud ' _ '_ i <S
!;.......-........._......._i
o d d o d o d d d o o oC. C 0 0 0 _-) C- 0 0 0 0
uw
_Z
dbo
-0
©
xa_
r-n
TBC-_NLDOC Pag¢ -90-
_LO_. D
:>
_ LLI _--'_
!
I
0
0
If)
....... "........ _"....... _ ....... -' ........ :"....... " ....... ":................ ; ....... _t_1._" ;_ " I_,
0
.......:........,,...._._____._................_.......:......._.._........,i i fii i i i -_'----4-- ',
.... ..._, ...... ;..... _...... _,...... _..... _.............. _, , ._..,_ _,'__....... .ia¢.._--'_L' ..... "... o
_1................i......................._........................_.............._ .......L_.
! : : _0, o_ ..g_
0 ;.i.i
' X
............................................................................. _;__r-,n
: ! • [ ! : . c_
............. _ ....... , ................ , ............... ....... i ....................... _ ....... &
.................. , _ ............... : ............................... : ....... _ ....... . ....... C_
- | -__
_' _.- _-" C' C_ C' _ -'2", C, C_
c-- c." d d o 9 c. o d d oC- C +-- r'_ C, • - C- C, C, r,
_, o_ _ _ -__,_ -- _-
c_ -
me'-', C_O-
TE3C-_TLZ_)C Page-92-
E
el,
-,aC
IcC
o
ii O
ill! I°
o
.......i........_.......i.......i.........i......i........7........i......i......._.4.......i i i i i J J J J _.
......j........_......._.......i........i......._........_........_......._.......,_.._........_,i''_ o
...... _ ........ F ....... _ ....... 4 .............. 1 ....... _ ........ F ....... 4 .........
_ n__-........................_'_=:,"-;....i.......7........T.......7.......:__ .......t_
.................................................................................."--=_t_ n,,
.............. _ ...............,. , ....... _ ............ -_,.............. _ ............... F ........ _. __
: - X
................ _ ..................................................... _ ....... _ ................
I !1 ,. : o: ! ,.,-
........ ......... _............... _....... ] ........ ]........ _........ oO
.......:........:.......i._..._........•......._.......-........,.......:......._................ q' _ i ! : _ i I ia-
c, o o o o ¢, ,:, ,:, -:, o o. q qO O O O O O O O O O O O O
_.O .r-, O .C_, O O r',, <D-, __D O O O
e4 _4 ....
TBC-FT_qI.TX)C Page -93-
zi--
AC_
_., c_
- !0
0-, 0 l-
i i : i I-'s_. Io
..-_,-" '.-,. ! _ "/......"": _ " i .._ i
.--V ', _; i _ t
....._.... ;.......... !.......... i .......... _"" : ; i _ _ /_
",i I _i
"_?_.! ! ', " i ! ' 0
:-,'A ', ; : i i ? o _,, _... ., ', - . ..........•..........,,........... o N..........i..........!\"<,:_...........!..........::..........! i e x
i.........!..........i...........!.N........!..........i....................._
' ___ _
I " I " ] " I " l " I
O 0 O 0 0 0 O 0 Od, 6 o d, o o _ _ o o0 0 0 0 0 0 0 0 0
TBC-FIN_.DO¢ Page -97-
qpIE
fx i_O
ii i ...,.II .
0
'0 '0 0 0 c',,_ "b,_ 0
I
_, i ! ,:"x, i c.>i_
.............:,i_......._:ii ...........i............"...........;........_ .......;, -,. p- ,,:
'L i "-, "g., "
............,.........._,..........................:_...._=...,,............!............_............
i',,. i "-,. ,,'h.. i
', _ I '* ",. ". I ',
............_...........i........",:'_"'N'_"i............;..........:_.-.:'-'-_..-.;...........
",, ; -,. -. _ _ "_
........................ , ............ ? ............. _..."_,,. :-.,... _ ..... '.-.....:-_ ........... . ...........
i ! ! "_,:.--.-'._..2_,.."',..."-_.
0
i.
z
_5
_o.o _
T_C-HNI.DOC Page -98-
_°_ tif, i
, :i i i i i i i o_ ,
t......_........i_....._........*........_........_........_........_........_--_.......I-,_-_i ! i i i i : : :l.Ll _,'
_o ] ] ] i L i i i i i o._
[ i i ! _ i ! ! l ! ! |<>w
" ........]........i........i........t....._........i........i........i........i........i........_
i ! i i i ' i i i ! o
........]........]........_........Ti __ ........'........_........Fi i :: i i _k. i i
o _ o o o o. o o o o o oo _ o o o o d o o d o0 _ 0 0 0 0 0 0 0 0 0
TBC-FIN1.DOC Page -99-
qDE
r_0o
ZF--LO
©
_ EL V')I
r_E:L
I
i
0
d
-.,.
©
o,o
'r3_
t,: _ 00
-__, _ r,,_-_'2. "" _ I
\i_\................:_......._;._......,.......................................,.._......... _"
', .: _ t,
V9
gj'_
x
4_
O
, _-, ; '%
'o . _.
' L : "L --.
.............................'_. ....i........":__ i.......................................
':._'.i"-". "'_,i "%,
............................................. ......... _......._,.......... ;_...... ;;..................._,_,-._-. ;., _. _.,
' _ '_ 'P" -- I I. '. "_.
..................................................... _ -- _,_- -'_-. -'; ;:1'_ - - -'_'_;%.-- -. _ .......... -'_ ",
•. -, "%.. :"-,_,.. ,
L_-.--. -_,'._. --.;
•. -.;_.:_-_.. _.
]11 I
d 6 _ 6 o
_ _ ¢_
(._! C_C_
TBC-FINI.DOC Page - 101-
E
\\\
I
.........._..........4...........I...........I-
\_\\._..........f_..-_,_...!..........j..........I
TBC-F_I.DOC Page - 102-
E
i> ._
I
I
o
l I " I " I
o. o. o o o. o o
_.OL.
-0d_W_
LJ
LJ
o
o
(NI/_II) NIV_.L£
o
o
TBC-F_I.DOC Page -104-
E
D- A 7
cry-
I
0
0
I oi °-0J/
............_..................,L...................................................................6
em
...................................................................................._
,.oL. (NIA,t)NIV_±S
L_
W
TBC-_,rl.DOC Pago -105-
,qpE
x
..,_ v)ol:EmnI
._.
0
¢ ;
............ _ .................................... , ..................................... ;. ...........
l'k I_ _
............".............................................................._.......O" ...........i= '. : : ; "-" =_,_ / _ -
............ ;-.V........ i ............ _........... _............ _........... i ....... _._,..,.,- ....... _<>.,, _: _
i LLI: TM l
.................iI...................................................................... '_........... N
_ 0
" _................. ..... • ... . ...........
[I"
'1
'_
-C,
%, : ('_
i[
............_............,,..........._...........,.................................................o.[ @
i ,.. "
; % i Q
G 0 E_ 0 _ _ E* 0 C/
O,II/NI ) Nlkt)-IJ.S
TBC-EN_.DOC Page - 106-