Mechanisms for knowledge transfer between national systems of innovation: public, private, and academic mechanisms (including science & technology cooperation) Bart Van Looy (KU Leuven) Beatrice Bertini (Univ. of Pisa) Elisa Grassi (Scuola Superiore Sant’Anna, Pisa) Francesca Mirizia (Univ. of Pisa, Univ. of Firenze) Contact: [email protected]KU Leuven INCENTIM - Center of Expertise for R&D Monitoring (ECOOM) – KU Leuven
Transcript
Mechanisms for knowledge transfer
between national systems of
innovation: public, private, and
academic mechanisms (including
science & technology cooperation)
Bart Van Looy (KU Leuven)
Beatrice Bertini (Univ. of Pisa)
Elisa Grassi (Scuola Superiore Sant’Anna, Pisa)
Francesca Mirizia (Univ. of Pisa, Univ. of Firenze)
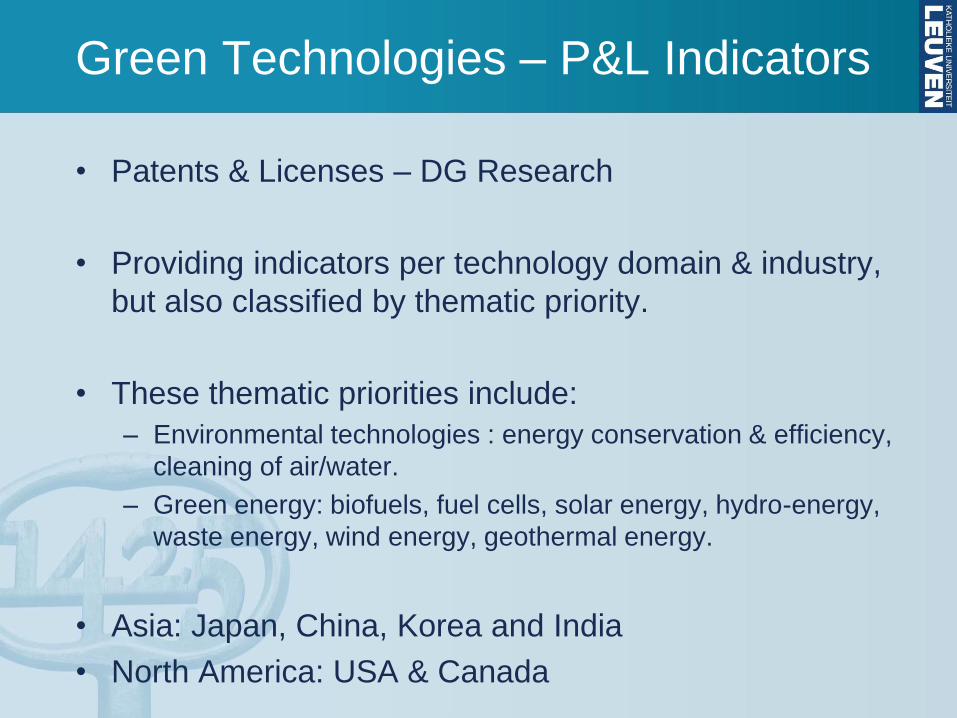
Electrical machinery, apparatus, energy 5C 28.32% 18.14% 49.93% 96.39%
Engines, pumps, turbines; including thermal processes and apparatus 5D 38.13% 20.10% 38.64% 96.87%
Energy conservation and energy efficiency 5E 29.22% 22.03% 44.70% 95.95%
Biofuels 5F 34.62% 37.36% 21.05% 93.03%
Fuel cells and hydrogen technology 5G 21.21% 26.79% 49.86% 97.86%
Solar energy 5H 38.35% 20.92% 36.72% 95.99%
Hydro energy 5I 65.63% 12.50% 13.28% 91.41%
Waste energy, energy from waste heat, fuel from waste 5L 35.61% 28.79% 31.00% 95.40%
Wind energy 5M 63.27% 15.97% 16.27% 95.51%
Geothermal energy, energy from natural heat 5N 28.83% 31.60% 33.74% 94.17%
Green Energy 6z 32.94% 30.24% 31.47% 94.65%
Treatment, disposal, combustion and recycling of waste; cleaning of air and water
pollution 6A 36.13% 22.57% 37.25%
95.95%
Energy conservation and energy efficiency 6B 29.22% 22.03% 44.70% 95.95%
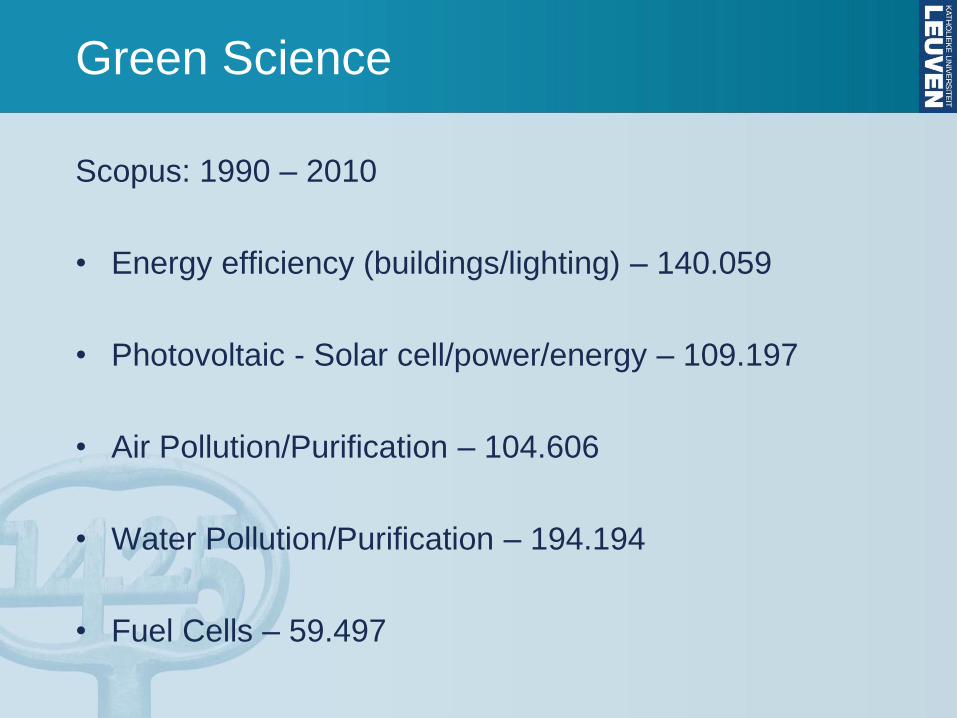
Green Science
Scopus: 1990 – 2010
• Energy efficiency (buildings/lighting) – 140.059
• Photovoltaic - Solar cell/power/energy – 109.197
• Air Pollution/Purification – 104.606
• Water Pollution/Purification – 194.194
• Fuel Cells – 59.497
Energy efficiency (buildings/lighting) – 140.059
Photovoltaic - Solar cell/power/energy – 109.197
Air Pollution/Purification – 104.606
Water Pollution/Purification – 194.194
Fuel Cells – 59.497
Green Science: Energy Efficiency
United States 36,484 H Advanced Economies 24.20
China 16,740 I I-China 11.10
Japan 10,074 H Advanced Economies 6.68
Germany 9,187 G Europe 6.09
United Kingdom 7,121 H Europe 4.72
France 5,393 G Europe 3.58
Italy 5,005 G Europe 3.32
Canada 4,797 H Advanced Economies 3.18
RUSSIA 4,521 I I - Russia 3.00
South Korea 4,218 H Advanced Economies 2.80
India 4,103 I I -India 2.72
Taiwan 2,889 H Advanced Economies 1.92
Spain 2,797 G Europe 1.86
Australia 2,572 H Advanced Economies 1.71
Netherlands 2,570 G Europe 1.70
Switzerland 2,349 H Europe 1.56
Sweden 1,937 H Europe 1.28
Brazil 1,671 I I-Brazil 1.11
Poland 1,618 C Europe 1.07
Turkey 1,418 C Emerging & Developing Economies Europe 0.94
Belgium 1,281 G Europe 0.85
Hong Kong 1,103 H Advanced Economies 0.73
Greece 1,088 G Europe 0.72
Finland 1,034 G Europe 0.69
Austria 1,031 G Europe 0.68
Israel 1,001 H Advanced Economies 0.66
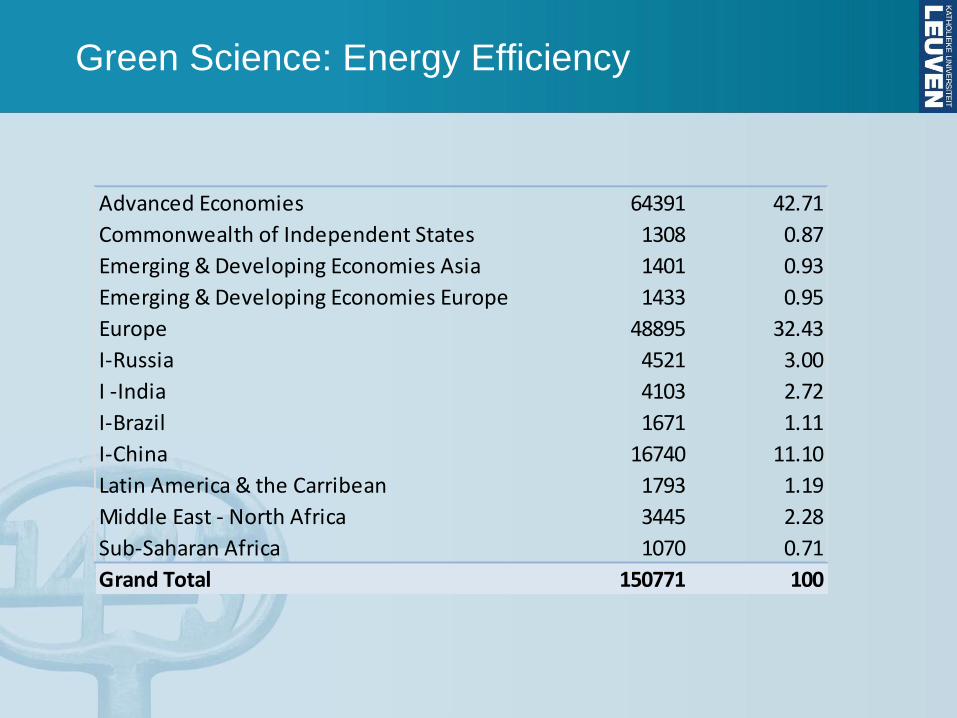
Green Science: Energy Efficiency
Advanced Economies 64391 42.71
Commonwealth of Independent States 1308 0.87
Emerging & Developing Economies Asia 1401 0.93
Emerging & Developing Economies Europe 1433 0.95
Europe 48895 32.43
I-Russia 4521 3.00
I -India 4103 2.72
I-Brazil 1671 1.11
I-China 16740 11.10
Latin America & the Carribean 1793 1.19
Middle East - North Africa 3445 2.28
Sub-Saharan Africa 1070 0.71
Grand Total 150771 100
Green Science: Energy Efficiency
Tsinghua University 1076
IEEE 895
University of Tokyo 755
UC Berkeley 744
Osaka University 743
Massachusetts Institute of Technology 741
Lawrence Berkeley National Laboratory 710
Zhejiang University 659
Harbin Institute of Technology 607
Russian Academy of Sciences 605
Kyoto University 599
University Michigan Ann Arbor 598
Chinese Academy of Sciences 583
Eidgenossische Technische Hochschule Zurich 552
National Taiwan University 546
Pennsylvania State University 544
Tokyo Institute of Technology 528
Oak Ridge National Laboratory 526
Green Science: Solar Energy
Country Volume Region Region Share
United States 36,484 H Advanced Economies 24.20
China 16,740 I I-China 11.10
Japan 10,074 H Advanced Economies 6.68
Germany 9,187 G Europe 6.09
United Kingdom 7,121 H Europe 4.72
France 5,393 G Europe 3.58
Italy 5,005 G Europe 3.32
Canada 4,797 H Advanced Economies 3.18
RUSSIA 4,521 I I - Russia 3.00
South Korea 4,218 H Advanced Economies 2.80
India 4,103 I I -India 2.72
Taiwan 2,889 H Advanced Economies 1.92
Spain 2,797 G Europe 1.86
Australia 2,572 H Advanced Economies 1.71
Netherlands 2,570 G Europe 1.70
Switzerland 2,349 H Europe 1.56
Sweden 1,937 H Europe 1.28
Brazil 1,671 I I-Brazil 1.11
Poland 1,618 C Europe 1.07
Turkey 1,418 C Emerging & Developing Economies Europe 0.94
Belgium 1,281 G Europe 0.85
Hong Kong 1,103 H Advanced Economies 0.73
Greece 1,088 G Europe 0.72
Finland 1,034 G Europe 0.69
Austria 1,031 G Europe 0.68
Israel 1,001 H Advanced Economies 0.66
Green Science: Solar Energy
Advanced Economies 52383 41.81
Commonwealth of Independent States 1388 1.11
Emerging & Developing Economies Asia 1512 1.21
Emerging & Developing Economies Europe 2746 2.19
Europe 39782 31.75
I - China 9814 7.83
I -India 4083 3.26
I-Brazil 1235 0.99
I-Russia 3350 2.67
Latin America & the Carribean 2099 1.68
Middle East - North Africa 3345 2.67
Sub-Saharan Africa 3555 2.84
Grand Total 125292 100
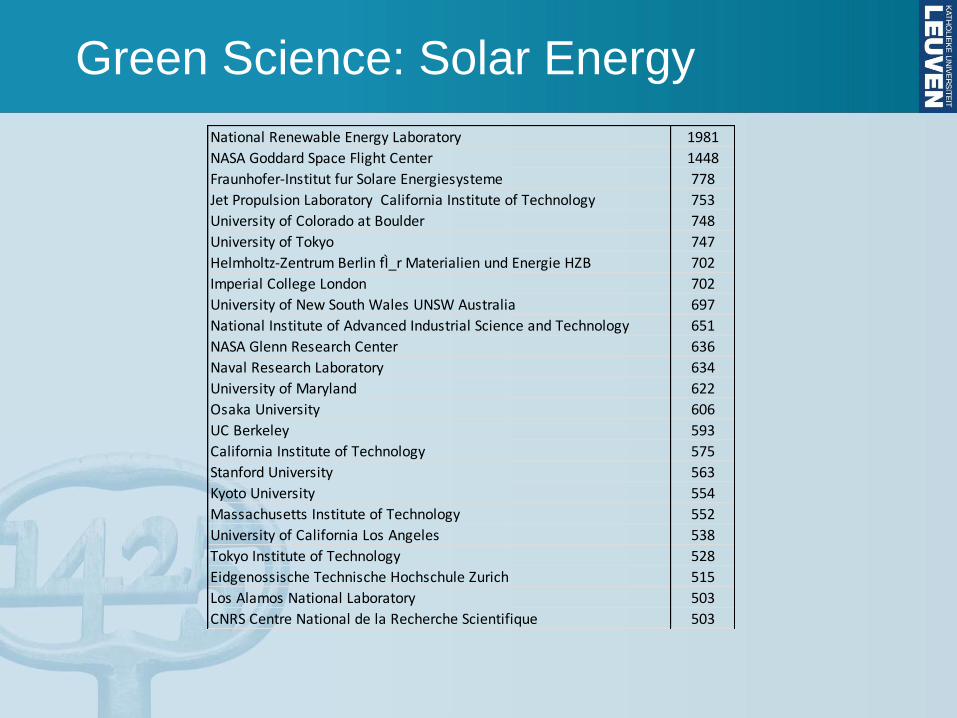
Green Science: Solar Energy
National Renewable Energy Laboratory 1981
NASA Goddard Space Flight Center 1448
Fraunhofer-Institut fur Solare Energiesysteme 778
Jet Propulsion Laboratory California Institute of Technology 753
University of Colorado at Boulder 748
University of Tokyo 747
Helmholtz-Zentrum Berlin fÌ_r Materialien und Energie HZB 702
Imperial College London 702
University of New South Wales UNSW Australia 697
National Institute of Advanced Industrial Science and Technology 651
NASA Glenn Research Center 636
Naval Research Laboratory 634
University of Maryland 622
Osaka University 606
UC Berkeley 593
California Institute of Technology 575
Stanford University 563
Kyoto University 554
Massachusetts Institute of Technology 552
University of California Los Angeles 538
Tokyo Institute of Technology 528
Eidgenossische Technische Hochschule Zurich 515
Los Alamos National Laboratory 503
CNRS Centre National de la Recherche Scientifique 503
Do Science – Technology flows pay off?
• Yes (see also Porter, Fleming, Furman, Jaffe, Acs,…)
Key points/lessons learned:
• Importance of scientific eminence & education (skilled labour – absorptive capacity locally)
• International cooperation pays off (increasingly both ways, both ‘transfer’ and ‘reverse innovation’)
• The presence of IP rather enabling than constraining? In any case, IP seems a ‘minor’ issue compared to the (presence or lack of) human capital (higher education!) and institutional framework conditions (see J. Kay in this respect).
• The nature/effectiveness of concrete arrangements varies according to the life cycle stage of technology/knowledge (Emergence versus growth)
• (Mapping capabilities & flows is first and foremost instrumental for identifying relevant capabilities (sources) & absorptive capacity)
Back up/Illustrative Slides
• Texture of biotech regions (global): beyond
pharmaceutical firms (Lecocq & Van Looy)
• Impact of academia on corporate patenting – the case
of Italy (Leten, Landoni & Van Looy)
• Science unfolding in technology (Callaert,
Grouwels,Van Looy)
Does it pay off? • Van Looy, B., E. Zimmermann, R. Veugelers, J. Mello, A. Verbeek, and K. Debackere (2003), “Do science-
technology interactions pay off when developing technology? An exploratory investigation of 10 science-
Dependent Variable: Number of Patents per mio capita (Citing Country)
Source
Type III Sum of
Squares df Mean Square F Sig.
Parameter Estimate
(B)
Corrected Model 2282,367a 39 58,522 100,608 ,000
Intercept 2,230 1 2,230 3,834 ,050 1,221
Scientific
performance (Citing
Country)
656,199 1 656,199 1128,096 ,000 2,958
Academic patenting
(Citing Country)
20,438 1 20,438 35,136 ,000 ,245
Science intensity of
patent portfolio
(Citing Country)
79,180 1 79,180 136,121 ,000 ,218
Herfindahl Foreign
Citations
2,710 1 2,710 4,658 ,031 -,435
Ratio Home versus
Foreign citation
intensity
,091 1 ,091 ,156 ,693 -,013
Technology domain
(FhG35)
298,384 34 8,776 15,087 ,000
Error 566,563 974 ,582
Total 19157,226 1014
Corrected Total 2848,930 1013
a. R Squared = ,801 (Adjusted R Squared = ,793)
• Sufficient levels of science-technology linkage are imperative for the
performance of national innovation systems.
• As such our findings underscore the relevance of science (for technology)
• Both scientific publications, the science intensity of patents and even the patenting behavior of academia are positively related with technical performance.
• On top, countries which ‘source’ science from a variety of countries, seem to benefit from this diversity.