Mechanisms of decomposition of metal during femtosecond laser ablation
Changrui Cheng and Xianfan Xu*School of Mechanical Engineering, Purdue University, West Lafayette, Indiana 47907, USA
�Received 2 July 2004; revised manuscript received 14 June 2005; published 17 October 2005�
The mechanisms of decomposition of a metal �nickel� during femtosecond laser ablation are studied usingmolecular dynamics simulations. It is found that phase explosion is responsible for gas bubble generation andthe subsequent material removal at lower laser fluences. The phase explosion process occurs as combinedresults of heating, thermal expansion, and the propagation of tensile stress wave induced by the laser pulse.When the laser fluence is higher, it is revealed that critical point phase separation plays an important role inmaterial removal.
Pulsed laser ablation is the process of material removalafter the target is irradiated by intensive laser pulses. It isnow acknowledged that pulses with very short durations,such as picosecond or femtosecond, are advantageous inmany applications.1 The short pulse duration confines heatdiffusion, which leads to high-quality machining. Sharp-edged, clean and highly reproducible machining results havebeen obtained using a femtosecond laser.2
Femtosecond laser ablation has become one of the mostintensively investigated topics in the research of laser-material interaction. However, the basic mechanisms leadingto ablation are still not conclusive. Femtosecond laser abla-tion occurs at very short temporal and spatial scales, involv-ing complicated optical, thermodynamic, energy transfer, andmechanical processes which are closely coupled. At the sametime, the target could be heated to extremely high tempera-ture and pressure, where thermal and mechanical propertiesof the material are generally unknown.
Different mechanisms, such as phase explosion,3–8 criticalpoint phase separation,9 spallation,6 and fragmentation7,8,10
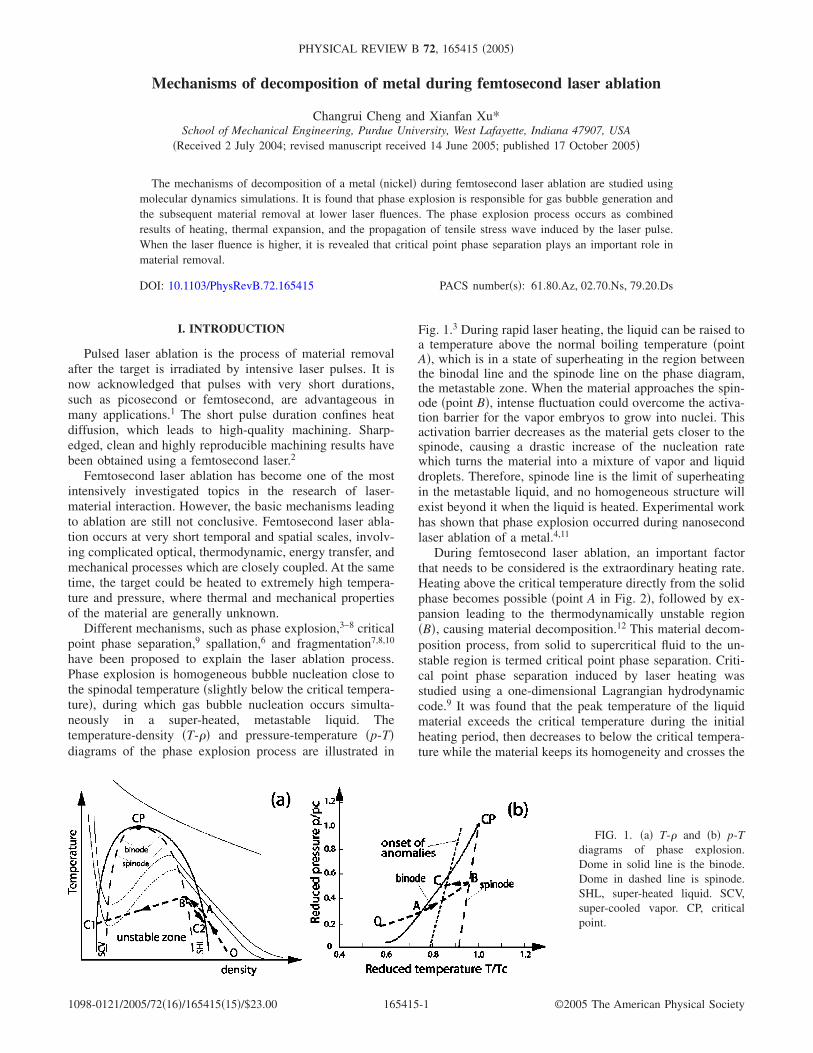
have been proposed to explain the laser ablation process.Phase explosion is homogeneous bubble nucleation close tothe spinodal temperature �slightly below the critical tempera-ture�, during which gas bubble nucleation occurs simulta-neously in a super-heated, metastable liquid. Thetemperature-density �T-�� and pressure-temperature �p-T�diagrams of the phase explosion process are illustrated in
Fig. 1.3 During rapid laser heating, the liquid can be raised toa temperature above the normal boiling temperature �pointA�, which is in a state of superheating in the region betweenthe binodal line and the spinode line on the phase diagram,the metastable zone. When the material approaches the spin-ode �point B�, intense fluctuation could overcome the activa-tion barrier for the vapor embryos to grow into nuclei. Thisactivation barrier decreases as the material gets closer to thespinode, causing a drastic increase of the nucleation ratewhich turns the material into a mixture of vapor and liquiddroplets. Therefore, spinode line is the limit of superheatingin the metastable liquid, and no homogeneous structure willexist beyond it when the liquid is heated. Experimental workhas shown that phase explosion occurred during nanosecondlaser ablation of a metal.4,11
During femtosecond laser ablation, an important factorthat needs to be considered is the extraordinary heating rate.Heating above the critical temperature directly from the solidphase becomes possible �point A in Fig. 2�, followed by ex-pansion leading to the thermodynamically unstable region�B�, causing material decomposition.12 This material decom-position process, from solid to supercritical fluid to the un-stable region is termed critical point phase separation. Criti-cal point phase separation induced by laser heating wasstudied using a one-dimensional Lagrangian hydrodynamiccode.9 It was found that the peak temperature of the liquidmaterial exceeds the critical temperature during the initialheating period, then decreases to below the critical tempera-ture while the material keeps its homogeneity and crosses the
FIG. 1. �a� T-� and �b� p-Tdiagrams of phase explosion.Dome in solid line is the binode.Dome in dashed line is spinode.SHL, super-heated liquid. SCV,super-cooled vapor. CP, criticalpoint.
spinode line into the unstable zone, causing phase separation.Laser ablation of silicon was studied using a scheme com-bining Monte Carlo and molecular dynamics,8 which showedphase explosion occurs in femtosecond laser ablation�500 fs�. The same study showed for a 50 ps pulse, laserablation is due to fragmentation caused by highly nonuni-form strain rates or the instability in low-density liquids.However, different trends were observed in another molecu-lar dynamics �MD� study.6 A longer laser pulse �150 ps�leads to phase explosion, while using a shorter laser pulse�15 ps�, the laser induced tensile stress has a strong effect onablation. The inconsistency among the results in the litera-ture could be due to the different fluence range, pulse width,materials studied, and the computational methods used.
Experimental measurements of transient parameters dur-ing femtosecond laser ablation such as temperature and pres-sure are highly challenging. In this work, we focus on mo-lecular dynamic simulation of femtosecond laser ablation ofnickel, and investigate possible ablation mechanisms at dif-ferent laser fluences. Nickel is modeled as a system of atomsinteracting via Morse potential, and molecular dynamicssimulations are performed on this model system. The laserpulse width is fixed at 100 fs, the pulse width of the com-monly used Ti:sapphire femtosecond laser. The detailed laserablation process will be illustrated, and the ablation phenom-ena together with the thermodynamic paths of materials atdifferent locations during ablation will be analyzed to iden-tify the ablation mechanisms. To locate the thermodynamicpaths, calculations of the critical point and binode line areconducted. As will be seen, we show that at lower laser flu-ences, phase explosion can be the dominant mechanism forfemtosecond laser ablation, and critical point phase separa-tion occurs at higher laser fluences.
II. SIMULATION METHODS
A. Molecular dynamics modeling
The problem studied in this work is femtosecond laserablation of nickel in vacuum. The target has a thickness �inthe x direction� of 187 nm, and a lateral dimension of10.6 nm�10.6 nm. Note that the length of the material willincrease when it is heated, as will be seen in Sec. III. On theother hand, the MD simulation is capable of tracking mo-tions of atoms due to thermal expansion and ablation. The
laser pulse is incident along the x direction onto the target. Ithas a uniform spatial distribution and a temporal Gaussiandistribution of 100 femtoseconds full width at half-maximum�FWHM� centered at t=1 picosecond. The wavelength of thelaser is 800 nm.
In our MD model, the Morse potential13 is used to simu-late the interactions among atoms in nickel,
��rij� = D�e−2b�rij−r�� − 2e−b�rij−r��� , �1�
where D is the total dissociation energy, r� is the equilibriumdistance, and b is a constant, with values of 0.4205 eV,0.278 nm, and 14.199 nm−1, respectively.13 Although thereare other potentials suitable for metals, such as theembedded-atom method �EAM�,14 the Morse potential ischosen in this work because it has been proven to be a goodapproximation to the interactions between atoms in fcc met-als such as nickel, and is capable of predicting many materialproperties. It has been widely used to study the laser-metalinteraction in different laser applications.15–18 Its simple formallows us to compute a relative large number of atoms,which is essential for revealing the details of the laser abla-tion process.
The procedure of the MD calculation is described as fol-lows. At each time step, the total force, velocity, and positionof all the atoms are calculated. The force vector acted onatom i from atom j is
Fji� = F�rji�rji
o� = −���rji�
�rrji
o� = 2Db�e−2b�rji−r�� − e−b�rji−r���rjio� ,
�2�
where rjio� is the unit vector of rji
� , the position vector from j toi. The total force on atom i is the summation of the forcevectors from all neighboring atoms. After the total force foreach atom is obtained, the velocity and position at the newtime step are calculated from the modified Verletalgorithm.19,20
From Eq. �2�, it is seen that the force between two atomsbecomes negligible when they are very far away from eachother. A cutoff distance, rc �taken as 2.46 r� in this work�, istherefore selected and the force between two atoms is evalu-ated only when their distance is less than rc. The distancesbetween atoms and rc are compared using the cell structureand linked list method.19,20 To avoid the time consuming
FIG. 2. �a� T-� and �b� p-Tdiagrams of critical point phaseseparation.
C. CHENG AND X. XU PHYSICAL REVIEW B 72, 165415 �2005�
165415-2
evaluation of the forces using Eq. �2�, a force table is precal-culated, and the force between two atoms is obtained fromthis table according to their distance. The simulation speed issignificantly increased by using these methods.
In this work, all the parameters are nondimensionalized tominimize the truncation errors. The total number of atoms isabout 1 900 000 and a parallel processing technique is ap-plied to accelerate the computation. A computer cluster com-posed of eight 2.0 GHz PCs is used. MPICH, a potableimplementation of message passing interface, the standardfor message-passing libraries, is applied for the parallel MDcalculation. More details of the numerical approach areavailable elsewhere.21
B. Evaluation of thermodynamic parameters
In this work, precise evaluation of the thermodynamicparameters of material is crucial to the investigation of abla-tion mechanisms. The methods to calculate the temperature,pressure, and density are explained in this section.
The macroscopic parameters can be evaluated after theforce-velocity-position of all atoms are obtained. To evaluatethese parameters, the calculation domain is divided into lay-ers perpendicular to the x direction. In this work, the thick-ness of the layers is the cutoff distance rc. This means thattemperature, pressure, density, etc., of the material are aver-aged in y-z cross sectional areas, and are functions of the xcoordinate at each time step.
As will be shown in Sec. II C, the two-temperature modelis applied, and the lattice and electrons of metals are consid-ered as two systems having their own temperatures. The lat-tice temperature Tl is calculated by summing the kinetic en-ergy, with the bulk velocity of the material excluded,
Tl =1
3NkBm�
i=1
N ��j=1
3
�vi,j − v j�2� , �3�
where N is the total number of atoms in a volume where thetemperature is evaluated �about 10 000�, kB is the Boltzmannconstant, and m is the mass of the atom. j represents thespatial coordinates �x, y, and z when j=1, 2 and 3, respec-tively�, vi,j is the velocity of atom i at the jth coordinate, andv j is the average velocity of the N atoms at the jth coordi-nate.
Pressure is another important quantity for the investiga-tion of the thermodynamic processes during laser ablation. Itis calculated using the expression22
p = �kBTl +1
6V��i=1
N
�j�i
Fij� · rij
� . �4�
Equation �4� is derived from the virial theory, which con-siders the interaction of molecules in the matter to derive theequation of state. The first part ��kBT� is from the momentumtransport related to the random motion of the atoms, and issimilar to the pressure in ideal gases where the forces be-tween molecules and/or atoms are neglected. The second part
��1/6V��i=1N � j�iFij
� ·rij� �� considers the pressure from the in-
teracting forces among atoms.
In Eqs. �3� and �4�, the volume with the lateral size of thematerial �10.6�10.6 nm� and the thickness of the cutoff dis-tance is chosen to evaluate the temperatures and pressures.The number of atoms in such a volume ��10 000� is largeenough to represent a Maxwell-Boltzmann velocity distribu-tion �Eq. �5��, the theoretical equilibrium velocity distribu-tion,
P�v� = 4�v2� m
2�kBT�3/2
e−mv2/2kBT. �5�
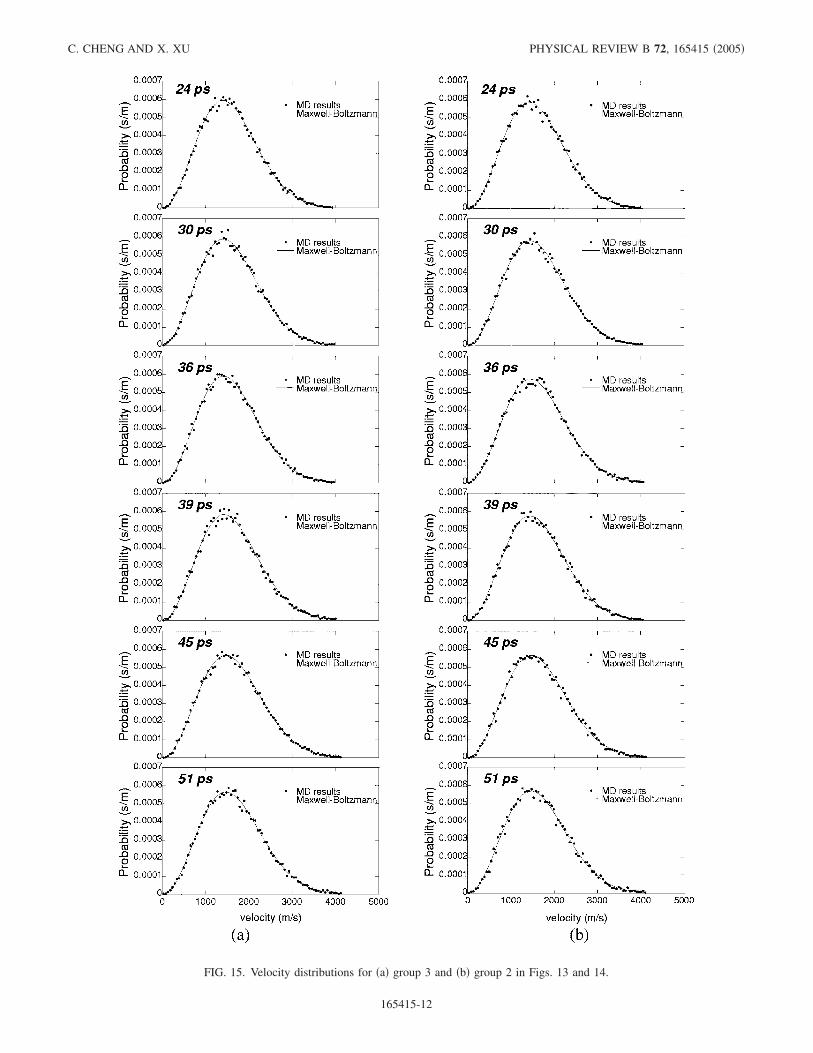
An example is given in Fig. 3. The Maxwell-Boltzmannvelocity distribution of the atoms indicates that the localequilibrium is established so that a temperature can be de-fined. Similar calculations under other times and laser flu-ences show that the local equilibrium is also achieved asshown later in Figs. 15 and 20. This is consistent with otherwork where a local equilibrium was found in ultrafast laserheating.23
Proper boundary conditions are important to the simula-tion. On the top surface which is irradiated by the laser pulse,the free boundary condition is applied. Periodical boundaryconditions are applied in the lateral directions �y and z�. Toprevent the reflection of pressure wave, the bottom boundaryis subject to the so-called “nonreflecting boundarycondition.”24 For this boundary condition, the force calcula-tion of atoms near the boundary is specially treated so thattheir behavior is similar to those inside the material and theincoming pressure wave will pass through the boundary. Thisensures that the ablation process will not be interfered withby the reflected pressure wave.
C. Two temperature model for laser heating
In general, three energy transfer stages during femtosec-ond laser irradiation of metals have been identified.25 Ini-tially, the free electrons absorb the energy from the laser.This stage is characterized by a lack of thermal equilibriumamong the electrons. In the second stage, the electrons reachthermal equilibrium and the density of states can now berepresented by the Fermi distribution. However electrons and
FIG. 3. The velocity distribution of the atoms at locationx=184.5 nm and t=120 ps. Laser fluence is 0.3 J /cm2.
MECHANISMS OF DECOMPOSITION OF METAL DURING… PHYSICAL REVIEW B 72, 165415 �2005�
165415-3
the lattice are still at two different temperatures. In the finalstage, electrons and the lattice reach thermal equilibrium andthermal diffusion carries the energy into the bulk. A two-temperature model to predict the nonequilibrium temperaturedistribution between electrons and the lattice during femto-second laser irradiation of metals was first described byAnisimov et al.26 Qiu and Tien27 derived the two-temperature model from the Boltzmann transport equation.The two-temperature model looks at the heating mechanismas consisting of the absorption of laser energy by the elec-trons and heating of the lattice by electron-lattice interaction.It treats electrons and the lattice as two separate subsystemswith different temperatures governed by respective equa-tions. It has been concluded that if the laser pulse duration ismuch longer than the electron relaxation time which is of theorder of 1 fs, the first stage of electron nonequilibrium canbe ignored.28 As such, the existence of nonequilibrium be-tween the electrons and the lattice is more important for thestudy of femtosecond laser �typically �100 fs� metal inter-action, resulting in wide applications of the two-temperaturemodel �e.g., Ref. �29��.
In the two-temperature model, the electron temperatureTe, and the lattice temperature Tl are subject to two coupledone-dimensional �1D� governing equations,
Ce�Te
�t=
�
�x�ke
�Te
�x� − G�Te − Tl� + S , �6�
Cl�Tl
�t= G�Te − Tl� , �7�
where Ce and ke are volumetric specific heat and thermalconductivity of electrons, respectively. Their temperature de-pendencies are approximated as Ce=�Te, �e=�e,0Te /Tl.G�Te−Tl� is the electron-lattice coupling term, which showsthat the energy transfer from electrons to the lattice is pro-portional to their temperature difference. The values of �e,0,�, and G are taken as 91 W/m K, 1.065�103 J /m3 K2, and3.6�1017 W/m3 K, respectively.29,30 S is the laser heatingsource term expressed as
S =I0
tp �
1
de−��t − t0�/tp�2
e−x/d, �8�
where tp is the time constant determining the pulse duration,and t0 is the time of the pulse center. To achieve a 100 fsFWHM pulse centered at 1 ps, the values of tp and t0 are0.06 ps and 1 ps, respectively. d is the absorption depth witha value of 14 nm,31 and I0 is the absorbed laser fluence.
Equation �6� is solved using the TDMA �Tri-DiagonalMatrix Algorithm� method with the adiabatic boundary con-dition applied on both boundaries. The value of temperaturesof electrons and the lattice in the coupling term, G�Te−Tl�, istaken as those in the previous time step.
The lattice temperature is updated by scaling the veloci-ties of all atoms �with bulk velocity excluded� by a factor 1+G�Te−Tl��t /Ek,t at each time step, where Ek,t is the ki-netic energy at the time t, and �t is the time step. This isequivalent to solving Eq. �7�, the governing equation of thelattice equation in the two-temperature model. Lattice con-
duction is always considered in the MD simulation, althoughit is small compared with the electron conduction in a metal.Another method has been used in literatures to consider theelectron-lattice coupling during laser heating,32,33 where theenergy coupling between the electrons and the lattice is con-sidered as an additional term in the total force of each atom.However, it can be shown that these two methods are iden-tical.
To consider the effect of density variation from materialexpansion and phase change, thermal conductivity and spe-cific heat of electrons are scaled by the ratio of the localdensity to the original density. Therefore, when density de-creases, so do the effective thermal conductivity and specificheat. This is consistent with the electron properties ofmetals.34 Before the heating calculation is started, the mate-rial is equilibrated at 300 K for about 300 ps to ensure it isunder the expected initial equilibrium condition.
III. RESULTS
A. Evaluation of the critical point
Since we are interested in ablation around the criticalpoint, we first evaluate the phase diagram, including the criti-cal point and the binode line of our model system near thecritical point. As will been seen, the phase diagram is crucialfor analyzing the phase change mechanisms in laser ablation.The phase diagram is obtained by computing an equilibriumheating problem with periodical boundary conditions on allboundaries. At a fixed temperature, the pressure of the sys-tem as a function of specific volume is computed, that is, ap-v curve is obtained at each temperature. The system isequilibrated for a long time �200–300 ps� at each p-v-Tvalue to ensure that the point on the phase diagram is at anequilibrium state. This is repeated at different temperatures,so p-v curves at different temperatures are obtained.
Figure 4 shows the results of the phase diagram and criti-cal point calculation. It is seen that at 9700 K, the pressuredecreases continuously with the increase of specific volume,indicating this temperature is above the critical temperature.
FIG. 4. Calculated p-v diagram near the critical point. Solidbold line is the binode.
C. CHENG AND X. XU PHYSICAL REVIEW B 72, 165415 �2005�
165415-4
At 9300 K, the pressure does not decrease monotonouslywith the increase of specific volume; the flat plateau indi-cates the region where the liquid and vapor phases coexistwhich is confirmed by the observation of the two-phasestructure. Therefore, the critical temperature is between
9700 K and 9300 K. More calculations at intermediatetemperatures indicate that the parameters of the criticalpoint are Tc=9470±40 K, �c=2500±200 kg/m3, andpc=1.08±0.02 GPa. The critical point of nickel foundfrom literature is 9576 K/2293 kg/m3/1.12 GPa,35
7810 K/2210 kg/m3/0.49 GPa,36 and 9284 K.37 These val-ues are extrapolated from low temperature data using semi-empirical equations of state.
The binodal lines are obtained by connecting the pointswhere the vapor phase starts to appear and where the liquidphase is turned into vapor completely. Between the binoldallines, the pressure is a constant at a constant temperature, andliquid and vapor coexist as shown in Fig. 4.
In the following sections, the phase diagram obtainedfrom the above calculation will be used to reveal the thermo-dynamic paths of the phase change processes during laserablation.
B. Laser ablation
The process of laser ablation is first analyzed from theatomic distributions. Figure 5 shows snapshots of atomic dis-tributions at laser fluences of 0.27, 0.3, 0.65, 1.0, and1.5 J /cm2. Here, only the near surface region where the laserenergy is absorbed and laser ablation occurs is shown. In thefigure, each atom is represented by a black dot. Laser isirradiated perpendicularly onto the right surface, while thebottom of the target is always located at x=0 nm �not shownin the figure�. To observe the interior of the target, the wholedomain is sliced into 10 layers with equal thicknesses in they direction, and the fifth layer is shown in these figures ex-cept Figs. 5�c5�, �d5�, and �e5�, where the whole thickness isdisplayed. Note 0.27 J /cm2 is the lowest laser fluence tocause volumetric phase change.
It is seen from these figures that the ablation phenomenaare different at low and high fluences. At 0.27 J /cm2 and0.30 J /cm2 �Figs. 5�a� and 5�b��, gas bubbles first appearinside the material, and grow larger at later time steps. Afterthe size of bubbles is large enough, the material is separatedinto pieces. On the other hand, at higher laser fluences, theinitial homogeneous phase turns into mixture of liquid drop-
FIG. 5. Snapshots of the ablated area at different laser fluencesand times.
FIG. 6. Electron and lattice temperatures at the surface and thebottom of the target.
MECHANISMS OF DECOMPOSITION OF METAL DURING… PHYSICAL REVIEW B 72, 165415 �2005�
165415-5
lets and gas phase over a long length, completely differentfrom the low-fluence ablation where gas bubbles can be eas-ily identified. The liquid droplets are then coalesced into big-ger liquid clusters, while a certain number of atoms remainas the gas phase, forming a �background� vapor phase. Wewill point out in Sec. IV that different ablation patterns indi-cate different ablation mechanisms for low and high laserfluences.
Another phenomenon seen in Fig. 5 is that at the twolower laser fluences �0.27 J /cm2 and 0.30 J /cm2� the gasbubbles are generated inside the material, rather than on ornear the surface. The distances from the surface to the origin
of gas bubbles at laser fluences 0.27 and 0.3 J /cm2 are 25and 18 nm, respectively. The reason why gas bubbles aregenerated inside the material will be discussed later in Sec.IV.
C. Time evolution of temperature, pressure, and density
The detailed ablation process is analyzed in this sectionby studying the time evolution of temperature, pressure, anddensity in the target material. The electron and the latticetemperature on the surface and the bottom of the material atthe laser fluence of 0.27 J /cm2 are shown in Fig. 6. It is seen
FIG. 7. �a� Temperature and �b� pressure distributions at different time steps at laser fluence of 0.27 J /cm2.
C. CHENG AND X. XU PHYSICAL REVIEW B 72, 165415 �2005�
165415-6
that the electron temperature on the surface is increasedquickly to the peak value of 18 000 K, while the lattice tem-perature does not increase as fast. Due to the electron-latticecoupling, the electron temperature starts to decrease and thelattice temperature increases, until they reach approximatelythe same value after tens of picoseconds. The electron andlattice temperatures at the bottom stay constant at 300 Kwithin 100 ps after the laser pulse.
The lattice temperature and pressure wave for the laserfluence of 0.27 J /cm2 at different time steps during the ab-lation process are shown in Fig. 7. Note that the laser pulse iscentered at 1 ps with duration of 0.1 ps. At time 0, the targetis at an equilibrium state of 300 K, and the pressure is almostzero. After the laser pulse is incident on the target, the sur-face temperature increases dramatically, and a strong com-pressive �positive� pressure is generated and propagates intothe target. This compressive pressure is due to the thermalexpansion in the near surface region. A negative pressurewhich represents a tensile stress follows the compressivewave, but its magnitude is much smaller. As will be shownlater, this tensile stress has a significant effect on the materialseparation process. Melting occurs at the surface at about6 ps. It is also noticed that the lattice temperature of thesolid-liquid interface is about 3800 K, much higher than thecalculated melting temperature of nickel �2500 K�, indicat-ing the existence of strong overheating. The interfacial tem-perature decreases at later time steps and reaches about2750 K at 90 ps when the melting process slows down butdoes not stop. A lattice temperature disorder appears after6 ps �for example, at about 150 nm at t=15 ps�. Comparedto the atomic distribution, it is found that this disorder al-ways occurs at the liquid-solid interface; therefore, this tem-perature disorder is due to the energy transfer associated withsolid-liquid phase change. The peak temperature reaches thehighest value of 7700 K at 54 ps, lower than the criticaltemperature 9470 K calculated in Sec. III A.
The different phases of the material can also be revealedby the atomic number density distribution shown in Fig. 8,which is evaluated from dividing the number of atoms in aslice of material perpendicular to the depth direction x by thevolume of this slot. For solid, the atomic density fluctuatesfrom nearly zero to a high value along the x direction �seeFig. 8, 0 ps�, since the density is high around the lattice layerbut low in between the two lattice layers. Note that the thick-ness of the slice is much smaller than the lattice constant. Forliquid, the atomic number density is almost uniform sincethere is no lattice structure �e.g., Fig. 8, 15 ps, 155–195 nm�.For the gas state, since its density is much lower than that ofthe liquid, the number density would be small comparingwith that of the liquid.
The temperature and pressure distributions for other flu-ences of 0.30, 0.65, 1.0, and 1.5 J /cm2 are shown in Figs. 9,10, 11, and 12, respectively. It is seen from these figures thatthe peak surface temperature increases significantly with thelaser fluence, and even exceeds the critical temperature atthree higher laser fluences �see Figs. 10–12�. Also noted isthat at these three laser fluences, the surface temperature isslightly lower than the interior temperature. As indicated inFig. 5, expansion is very strong near the ablation front. Fig-ures 7 and 9 show that the total thickness of the target in-
creases 31 nm and 36 nm for 0.27 J /cm2 and 0.3 J /cm2, re-spectively, in about 45 ps after the laser pulse, while itincreases 94 nm, 132 nm, and 152 nm for the three higherlaser fluences. The stronger material expansion causes tem-perature decrease around the surface at higher laser fluences.As will be shown in Sec. IV, this cooling eventually leads tophase separation at these higher laser fluences, as comparedto what happened at lower laser fluences when the phasechange happens before significant cooling can take place.
Figures 9–12 reveal another important difference between
FIG. 8. Atomic number density at different time steps at laserfluence of 0.27 J /cm2.
MECHANISMS OF DECOMPOSITION OF METAL DURING… PHYSICAL REVIEW B 72, 165415 �2005�
165415-7
FIG. 9. �a� Temperature and �b� pressure distributions at different time steps at laser fluence of 0.3 J /cm2.
C. CHENG AND X. XU PHYSICAL REVIEW B 72, 165415 �2005�
165415-8
the laser-material interactions at low and high laser fluences.As shown in Fig. 7�b�, a tensile stress follows the compres-sive wave induced by laser heating at 0.27 J /cm2. This ten-sile stress can also be observed for the fluence of 0.3 J /cm2
in Fig. 9�b�. However, for the three higher fluences of 0.65,1.0, and 1.5 J /cm2 shown in Figs. 10�b�–12�b�, there is nosuch tensile stress following the compressive stress. The pos-sible reason is that at these higher laser fluences, since thetemperature near the surface is higher than the critical point,the material is a super-critical fluid with a low density. Thislow density super-critical fluid cannot withstand much ten-sile stress. It will be shown later in Sec. IV that the tensilestress assists the phase change process at lower laser flu-ences, while at higher laser fluences, phase separation occurswhen the super-critical fluids enter the thermodynamic un-stable zone as a result of expansion.
IV. DISCUSSIONS
A. Ablation at low laser fluences
The mechanisms leading to ablation is studied by analyz-ing the thermodynamic trajectories of groups of atoms thatundergo phase separation. The thermodynamic trajectoryrepresents the time evolution of the material under investiga-tion in thermodynamic space. Specifically, the evolutions ofgroups of atoms in T-� diagrams are plotted and analyzed indetails. There is no preference in choosing the groups ofatoms. Atoms in one group are in close proximity to eachother, and follow the bulk motion of the material. Atoms areallowed to enter or leave the group.
Figure 13 shows the groups of atoms analyzed for thelaser fluence of 0.3 J /cm2 at 120 ps �the same figure as Fig.5�b5��. According to Fig. 13, groups 2 and 4 have turned into
FIG. 10. �a� Temperature and �b� pressure distributions at different time steps for fluence 0.65 J /cm2.
MECHANISMS OF DECOMPOSITION OF METAL DURING… PHYSICAL REVIEW B 72, 165415 �2005�
165415-9
gas at 120 ps, while groups 1, 3, and 5 are in the liquid phase�and will remain as liquid�. Their thermodynamic trajectoriesof densities and temperatures during the ablation process areshown in Fig. 14. The arrows indicate the progress of time,while the numbers along the trajectories mark the time in ps.The binode and spinode lines are taken from the calculationresults in Sec. III A. From Fig. 14, it is seen that groups 2, 3,and 4, which experience material separation, cross both thebinode line and the spinode line. These three groups undergoa phase separation process, with groups 2 and 4 turning intovapor. On the other hand, groups 1 and 5, which do not touchthe spinode, do not undergo phase change. This indicates thatthe phase change of the material is directly related to whetherit reaches the spinode line or not. Recall what was describedin Sec. I for phase explosion, when liquid enters the meta-stable region and approaches the spinode, it will undergo thephase explosion process and turn into a mixture of liquid andvapor. Therefore, the thermodynamic trajectories of the
groups suggest that phase explosion occurs at this laser flu-ence.
In the above discussion, it is important that local thermalequilibrium is achieved so that a temperature can be defined.This can be verified by plotting out the velocity distributionat the locations of interest and comparing it with the equilib-rium Maxwell-Boltzmann distribution expression, Eq. �5�. InFig. 15, the velocity distributions of atom groups 2 and 3 inFigs. 13 and 14 at a number of time steps leading to ablationare shown. The Maxwell-Boltzmann distributions that canbest represent these velocity distributions are also shown.From Fig. 15, it is seen that velocities of atoms indeed followthe equilibrium Maxwell-Boltzmann distribution.
Analyzing the ablation process at a lower fluence of0.27 J /cm2 reaches the same conclusion, groups of atomsthat are not able to reach the spinode line do not experiencephase separation, while those crossing the spinodal line un-dergo phase separation.
FIG. 11. �a� Temperature and �b� pressure distributions at different time steps at laser fluence of 1.0 J /cm2.
C. CHENG AND X. XU PHYSICAL REVIEW B 72, 165415 �2005�
165415-10
At a lower laser fluence of 0.25 J /cm2, no gas bubbles aregenerated. A number of groups of atoms are marked in theT-� diagram in Fig. 16 at the time steps when they are clos-est to the spinode line. Although the temperature of liquid isbetween 5500 K and 6900 K, much higher than the equilib-rium boiling temperature �3186 K�, none of these groupsreach the spinode line and turn into vapor. Therefore, liquidvapor phase change does not occur at this laser fluence. Thisconfirms again that crossing the spinode line is necessary forthe material to turn into gas and experience decomposition.
FIG. 12. �a� Temperature and �b� pressure distributions at different time steps at laser fluence of 1.5 J /cm2.
FIG. 13. Positions of groups of atoms at laser fluence of0.3 J /cm2.
FIG. 14. Thermodynamic trajectories of groups of atoms at laserfluence of 0.3 J /cm2.
MECHANISMS OF DECOMPOSITION OF METAL DURING… PHYSICAL REVIEW B 72, 165415 �2005�
165415-11
FIG. 15. Velocity distributions for �a� group 3 and �b� group 2 in Figs. 13 and 14.
C. CHENG AND X. XU PHYSICAL REVIEW B 72, 165415 �2005�
165415-12
One factor that facilitates phase explosion is the tensilestress generated by laser heating. When the material is heatedby a laser pulse, its density decreases, which is mainly due tothe thermal expansion resulting from laser heating. However,the propagation of the stress wave induced by laser heatingalso has an effect on the density profile. As shown in Fig.7�b�, there is a tensile stress after the strong compressivewave passes. In Fig. 17, this tensile stress and the atomicnumber density for the fluence of 0.3 J /cm2 are plotted to-gether. The time step of 36 ps is chosen because gas bubblesare generated about 3 ps later. At the surface, the tensilestress remains at zero �as it should be according to the re-quirement of force balance�. Under the surface, the increaseof the tensile stress tends to decrease the density. On theother hand, the decrease of temperature tends to increase thedensity. The combined effect is that the minimum density isreached below the surface, where the material located ismore likely to reach the spinode line and undergo the phasechange process. This explains why the gas bubble appearsnot at the surface, but under the surface as shown in Fig. 5.
B. Ablation at high laser fluences
Similar to the preceding section, the mechanism leadingto ablation at higher laser fluences is also analyzed from thethermodynamic trajectories of groups of atoms.
Figure 18 shows the thermodynamic trajectories of sev-eral groups of atoms. The locations of these groups of atomsat 90 ps are marked in Fig. 19. The laser fluence is0.65 J /cm2. From Fig. 18, it is seen that all the three groupsare first raised to temperatures higher than the critical tem-perature and become a super-critical fluid. After expansion,their temperature decreases, and they enter the unstable zonebelow the critical point as the phase separation occurs atabout 30 ps. Groups 1 and 2 evolve into gas, while group 3becomes liquid. Comparison between Figs. 5 and 18 showsthat there is no phase separation during the initial heatingperiod �from 1 ps to about 30 ps� although the density de-creases continuously. The material remains homogeneousuntil it enters the unstable zone after expansion, and the liq-uid �group 3� precipitates out from the homogeneous phase.Similarly to Fig. 15, the velocity distributions of groups 2and 3 at different time steps leading to ablation are plottedand compared with the equilibrium Maxwell-Boltzmann dis-tribution to verify the local thermal equilibrium condition.Again, velocities of atoms are found to follow the equilib-rium distribution, indicating that local thermal equilibrium isachieved. �See Fig. 20.�
The thermodynamic trajectories of the groups of atomsdescribed above are clearly different from those at lowerlaser fluences, but follow that of critical point phase separa-tion shown in Fig. 2�a�. Heating above the critical point,followed by the expansion into the unstable zone that causesphase separation has been clearly illustrated, which agrees
FIG. 16. Positions of groups of atoms on T-� diagram at 45 psat laser fluence of 0.25 J /cm2.
FIG. 17. Profile of pressure and atomic number density at 36 psat laser fluence of 0.3 J /cm2.
FIG. 18. Thermodynamic trajectories of atoms groups. Fluence,0.65 J /cm2.
FIG. 19. Positions of groups of atoms on T-� diagram at 90 psat laser fluence of 0.65 J /cm2.
MECHANISMS OF DECOMPOSITION OF METAL DURING… PHYSICAL REVIEW B 72, 165415 �2005�
165415-13
FIG. 20. Velocity distributions for �a� group 3 and �b� group 2 in Figs. 18 and 19.
C. CHENG AND X. XU PHYSICAL REVIEW B 72, 165415 �2005�
165415-14
with the theoretical description of critical point phase sepa-ration. Similar thermodynamic trajectories are found for la-ser fluences of 1.0 J /cm2 and 1.5 J /cm2. Therefore, it is con-cluded that critical point phase plays important roles inmaterial decomposition.
V. SUMMARY
In this work, the mechanisms of femtosecond laser abla-tion of a nickel target are studied using molecular dynamicsimulations in a laser fluence range commonly used for ma-terials processing. Two distinct laser fluence regimes areidentified, which are caused by different ablation mecha-nisms. At lower laser fluences, the peak temperature reachedis below the critical temperature, and material decomposition
is through phase explosion. Bubble nucleation occurs insidethe metastable liquid at temperatures as the spinode is ap-proached, and is assisted by the tensile stress developed dur-ing laser heating. At higher laser fluences critical point phaseseparation occurs. The initial peak temperature reached ex-ceeds the critical temperature. The super-critical fluid entersthe unstable zone after relaxation and loses its homogeneity,causing phase separation.
ACKNOWLEDGMENTS
Support of this work by the National Science FoundationGrant No. 0219098-CTS is acknowledged. C.C. also thanksthe Fellowship support from the Purdue Computational Re-search Institute.
*Author to whom correspondence should be addressed. Electronicaddress: [email protected]
1 D. von der Linde and K. Sokolowski-Tinten, Appl. Surf. Sci.154–155, 1 �2000�, and references therein.
2 F. Korte, J. Serbin, J. Koch, A. Egbert, C. Fallnich, A. Ostendorf,and B. N. Chichkov, Appl. Phys. A: Mater. Sci. Process. A77,229 �2003�.
3 R. Kelly and A. Miotello, Appl. Surf. Sci. 96–98, 205 �1996�.4 K. H. Song and X. Xu, Appl. Surf. Sci. 127, 111 �1998�.5 J. H. Yoo, S. H. Jeong, X. L. Mao, R. Grief, and R. E. Russo,
Appl. Phys. Lett. 76, 783 �2000�.6 L. V. Zhigilei, Appl. Phys. A: Mater. Sci. Process. A76, 339
�2003�.7 D. Perez and L. J. Lewis, Phys. Rev. Lett. 89, 255504 �2002�.8 P. Lorazo, L. J. Lewis, and M. Meunier, Phys. Rev. Lett. 91,
225502 �2003�.9 K. Sokolowski-Tinten, J. Bialkowski, A. Cavalleri, D. von der
Linde, A. Oparin, J. Meyer-ter-Vehn, and S. I. Anisimov, Phys.Rev. Lett. 81, 224 �1998�.
10 D. Perez and L. J. Lewis, Phys. Rev. B 67, 184102 �2003�.11 X. Xu, in Annual Review of Heat Transfer, edited by C.-L. Tien,
V. Prasad, and F. P. Incropera �Bell House, New York, 2001�,Vol. 12, p. 79.
12 V. P. Skripov and A. V. Skripov, Sov. Phys. Usp. 22, 389 �1979�.13 L. A. Girifalco and V. G. Weizer, Phys. Rev. 114, 687 �1959�.14 S. M. Foiles, M. I. Baskes, and M. S. Daw, Phys. Rev. B 33,
7983 �1986�.15 W. K. Liu, J. M. Yuan, and S. H. Lin, Phys. Rev. A 60, 1363
�1999�.16 E. Ohmura, I. Fukumoto, and I. Miyamoto, Proc. SPIE 4088, 84
�2000�, and references therein.17 V. Constantoudis and C. A. Nicolaides, Phys. Rev. E 64, 056211
�2001�.18 N. N. Nedialkov, S. E. Imamova, and P. A. Atanasov, J. Phys. D
37, 638 �2004�.19 M. P. Allen and D. J. Tildesley, Computer Simulation of Liquids
�Clarendon, Oxford, 1987�.20 X. Wang and X. Xu, Int. J. Heat Mass Transfer 46, 45 �2002�.21 C. Cheng and X. Xu, Appl. Phys. A: Mater. Sci. Process. A79,
761 �2004�.22 J. M. Haile, Molecular Dynamics Simulation: Elementary Meth-
ods �Wiley, New York, 1992�.23 X. Wang and X. Xu, ASME J. Heat Transfer 124, 265 �2002�.24 C. Schäfer, H. M. Urbassek, L. V. Zhigilei, and B. J. Garrison,
Comput. Mater. Sci. 24, 421 �2002�.25 J. Hohlfeld, S.-S. Wellershoff, J. Güdde, U. Conrad, V. Jähnke,
and E. Matthias, Chem. Phys. 251, 237 �2000�.26 S. I. Anisimov, B. L. Kapeliovich, and T. L. Perel’man, Sov.
Phys. JETP 39, 375 �1974�.27 T. Q. Qiu and C. L. Tien, J. Heat Transfer 115, 835 �1993�.28 T. Q. Qiu and C. L. Tien, Int. J. Heat Mass Transfer 37, 2789
�1994�.29 S. S. Wellershoff, J. Hohlfeld, J. Güdde, and E. Matthias, Appl.
Phys. A: Mater. Sci. Process. A69, S99 �1999�.30 P. A. Atanasov, N. N. Nedialkov, S. E. Imamova, A. Ruf, H.
Hügel, F. Dausinger, and P. Berger, Appl. Surf. Sci. 186, 369�2002�.
31 D. R. Lide, Handbook of Chemistry and Physics, 77th ed. �CRCPress, Boca Raton, FL, 1996�.
32 H. Häkkinen and U. Landman, Phys. Rev. Lett. 71, 1023 �1993�.33 D. S. Ivanov and L. V. Zhigilei, Phys. Rev. B 68, 064114 �2003�.34 R. Berman, Thermal Conduction in Solids �Clarendon, Oxford,
1976�.35 D. A. Young and B. J. Alder, Phys. Rev. A 3, 364 �1971�.36 M. M. Martynyuk, Russ. J. Phys. Chem. 57, 810 �1983�.37 D. A. Young, UCRL-52352, Lawrence Livermore Laboratory,
1977.
MECHANISMS OF DECOMPOSITION OF METAL DURING… PHYSICAL REVIEW B 72, 165415 �2005�


![Melting and thermal ablation of a silver film induced by ... · Femtosecond laser pulse processing of material has been drawn considerable attention and been intensively studied [1–4].](https://static.documents.pub/doc/80x56/604443645dabfd7ffe20edc9/melting-and-thermal-ablation-of-a-silver-film-induced-by-femtosecond-laser-pulse.jpg)


