Mechanisms of Deterioration of Nutrients by Marcus Karel and James M. Flink Department of Nutrition and Food Science Massachusetts Institute of Technology Cambridge, Massachusetts 02139 ANNUAL REPORT - PHASE XL NASA/MSC CONTRACT No. 9-12485 https://ntrs.nasa.gov/search.jsp?R=19740013628 2018-05-11T04:18:10+00:00Z
2.1 Introduction 2-12.2 The freeze drying microscope 2-22.3 Observations of freeze drying fronts in 2-8
the microscope2.4 Retention of volatile organic compounds 2-10
2.4.1 Retention of hexanol in a complex 2-10food gel
2.4.2 Quantitative evaluation of volatile 2-13retention in the freeze drying microscopeusing ^ C labelled ethyl acetate
2.5 Freeze drying behavior of emulsified model systems 2-15
2.5.1 Triolein-maltodextrin 2-162.5.2 1-bromonaphthalene-maltodextrin 2-212.5.3 Triolein or 1-bromonaphthalene-Avicel 2-23
3. Browning of dried foods at high temperature 3-1
3.1 Introduction 3-13.2 Non-fat dry milk 3-3
3.2.1 Methods 3-33.2.2 Vacuum vs air heating 3-53.2.3 Influence of water activity and 3-7
temperature
3.2.3.1 Quantitative measure of 3-7browning
3.2.3.2 Visual analysis of browning 3-9
3.3 Freeze dried whole egg 3-13
3.3.1 Methods . 3-133.3.2 Evaluation of browning of freeze dried 3-15
whole egg
4. Artificial gel structures for engineered space foods 4-1
4.1 Introduction . 4-14.2 Non-aqueous materials and the freeze drying 4-3
process4.3 Artificial gel systems 4-11
Volatile retention during freeze drying 5-1
5.15.2
5.3
5.4
5.5
5.6
IntroductionThe influence on volatile retention of dextroseequivalent (D.E.) for a series of dextrinsVolatile retention during freeze drying ofaqueous suspensions of cellulose and starchVolatile retention during freeze drying ofprotein solutionsRetention of volatile organic compounds in acomplex freeze dried food gelEffect of structure disrupting treatments onvolatile release from freeze dried maltose
Freeze dried food products of improved quality
6.16.2
6.3
IntroductionMethods
6.2.1 Methods of preparation6.2.2 Organoleptic tests
Organoleptic evaluations
6.3.1 Evaluation of processing variables6.3.2 Short term storage evaluation
5-15-2
5-6
5-11
5-43
5-63
6-1
6-16-2
6-26-3
6-6
6-66-7
7. Summary of Results 7-1
List of Figures
Section 2. 2-27
Section 3. . 3-20*
Section 4. 4-16
Section 5.2 5-5a5.4 5-355.5 5-585.6 5-78
Section 6. 6-17
1-1
1. General Introduction
Phase n of this contract has been devoted to continu-
ation of studies initiated during Phase I, which will lead
to development of methods by which freeze dried foods of
improved quality will be produced. In addition to continu-
ation of Phase I studies, Phase 31 saw the initiation of
a study into the technology of preparation of artificial
food matrices.
As listed in the Phase I end items, studies have
continued in the following areas:
1) The applicability of theories of flavor retention
developed originally in mono-and disaccharide containing
food liquids has been demonstrated for a number of
food polymers, both proteins and polysaccharides.
2) Studies on the formation of structures during
freeze drying have been continued for emulsified systems
using the optical microscope having a special freeze drying
stage.
3) The deterioration of organoleptic quality of
freeze dried foods due to high temperature heating has
been evaluated, and improved proceedures developed.
4) The influence of water activity and high tempera-
ture on retention of model flavor materials and browning
deterioration has been evaluated for model systems and
food materials.
5) A freeze dried food of high quality whose
processing is based on results obtained in areas discussed
1-2
above has been prepared and sent to NASA/MSC as provided
for in the contract schedule for Phase II.
6) Studies on production of a totally artificial
food applicable to advance spacecraft food system needs
has been initiated-
The scheme of presentation utilized in the Phase I
Annual Report has been continued in this Annual Report.
The research areas under investigation in Phase II are
presented as separate sections as follows:
2. Studies using the freeze drying microscope
3. Browning of dried foods at high temperatures
4. Artificial gel structures for engineered space foods
5. Volatile retention during freeze drying
6. Freeze dried food products of improved quality.
A summary of the results of Phase II is presented
as the last section (7).
2-1
2. Studies using the freeze drying microscope
2.1 Introduction
The development of a freeze drying apparatus for
mounting on a microscope stage for continuous observations
at high magnifications of freezing and freeze drying
behavior has been described in the Phase 1 Annual Report
of this contract. A technical article based in large part
on data presented in the Phase 1 Annual Report has since
been published and is included here (as section 2.2)
since it concisely describes the freeze drying apparatus
and the methods of utilization. Section 2.3 presents an
analysis of the freeze drying behavior of the ice/dry
layer interface, as our observations had raised some
question as to the nature of the moisture content gradient,
In conjunction with the project end items regarding
food matrices, studies were initiated on the microscopic
freeze drying behavior of various food components,
relative to phase separation and matrix structure during
freezing and freeze drying. These initial studies have
concentrated on systems which could be more easily handled
in the microscope, and generally consist of a non-volatile
carbohydrate, a volatile or non-volatile organic liquid
and water. These studies are discussed in sections 2.4
and 2.5.
2-2
2.2 The freeze drying microscope
Microscopic investigations of the freeze drying
of volatile-containing model food solutions.
Reprint from J. Food Sci. 38:(7) :1174-1178 (1973) .
2-3
J. M. FLINK, F. GEJL-HANSEN and M.Dept. of Nutrition & Food Science. Massachusetts Institute of Technology. Cambridge, MA
MICROSCOPIC INVESTIGATIONS OF THE FREEZE DRYINGOF VOLATILE-CONTAINING MODEL FOOD SOLUTIONS
INTRODUCTIONAQUEOUS SOLUTIONS of organic sol-utes are the basic fluids of biologicalsystems, such as the extracellular and in-tracellular fluids of solid food materials.
. Extraction of these fluids from foodsolids results in organic-containing aque-ous solutions of economic importance tothe food industry. The behavior of theseextracts during the freezing process isquite important in determining the finalqual i ty of freeze-dried products fFlinkand Karel, 1970b; Flink and Libuza,1972; Rulkens and Thijssen, 1972*. Thisincludes both the period of the loweringof temperature to a level at which the
solvent, water, starts to crystallize as ice,as well as during the continuation of thefreezing process when the increased con-version of water to ice results in the even-tual solidification of the aqueous solutionas a relatively complex system of icecrystals, concentrated solute phase orphases, and perhaps even pure solutephases.
The flavors of food materials are com-posed of numerous organic compoundspresent at low concentrations in aqueoussolutions. Most studies on flavor qualityretention have dealt with measuring thebefore, during or after retention of suit-able volatile organic compounds from
Fig. 1—Microscope stage freeze-drying system with detail of sampleholder.
nonvolatile solute-containing aqueous so-lutions (Flink and Karel, 1970a,b; Thijvsen and Rulkens, 1969; Rulkens andThijssen, 1972; Chandrasekaran and King1972).
In a continuation of studies on the dt-sorption of volatile organic constituentifrom aqueous carbohydrate systems dur-ing freeze drying (Flink and Karel, 1969.1970a,b), microscopic analysis of th;freeze-dried material showed changeswhich had taken place in the system dur-ing the freezing and freeze drying (Flinkand Gejl-Hansen, 1972). Most notablewere the partitioning of the carbohydratenonvolatile solute (maltodextrin) intotwo fractions, and the appearance of thevolatile organic constituent (hexanal) asliquid droplets. Flink and Gejl-Hansenconcluded that the formation of the liq-uid droplets and their partitioning intothe carbohydrate-rich phase were very im-portant factors in accounting for the re-tention of the volatile organic compoundduring freeze drying.
To determine during which part of thefreeze-drying process the partitioning oc-curs requires the development of afreeze-drying microscope stage on whichthe entire freeze-drying process could beobserved. Various freezing and freeze-dry-ing microscope stages have been reportedin the literature (McCrone and O'Brad-ovic, 1956; MacKenzie, 1964; Chauffard.1971; Freedman et al., 1972), thoughmost studies using this equipment havedealt with investigations on conditions af-fecting the development and behavior ofthe ice phase (Luyet, 1968). Key et al(1966) have reported on microscopic ob-servations of the solidification am)freeze-drying behavior of organic mix-tures and aqueous solutions of inorganicsalts.
This paper reports on (1) the design ofa new freeze-drying microscope stag*capable of continuous observations at thehigh magnifications required for flavor re-tention studies and (2) the results of stud-ies on the separation and retention ofvolatile organic compounds during free"drying.
EXPERIMENTAL
The freeze-drying microscope
The freeze-dryirg microscope is capable o'
•n74-JOUR/VAL OF FOOD SCIENCE-Volume 38 (1973)
illt.-{ used for continuous observation of|.-f re-drying samples at magnification up to| .ix. This high magnification is essential when,. .nutting the formation and separation of
-.jets within the nonvolatile solute matrix.I he freeze-drying microscope consists of
• -<v systems which -:an be considered inde-«-.Jently°. the microscope system, the freeze-• • > m f system and the data acquisition systems.
Pie microscope system. The freeze-drying..tuscope is based on an Olympus Model EH..t.iscope body. As this microscope is modu-
j. it is "custom designed" by being equipped. -h the following special options:
I Trinocular head to allow for both visualij data acquisition;
2. Wide field and flat field photographic,cpieces of I5x which allow magnifications atlie limit of resolution;
J. A polarizing filter set used to evaluatenslullinity of the sample;
4. A dry 60x objective which can be used,i high magnification (900x) analysis of the
Itceze-dried material;5. A long working distance 40x objective
that enables the distance between the samplemd front surface of the objective lens to be 1.3mm. This distance is an important considera-tion when designing the freeze-drying chamber.
The freeze-drying system. The freeze-dryingjiystcm consists of a freezing and freeze-drying> lumber specially designed and constructed inihii laboratory for use with the Olympus micro-^opc and the associated support equipment.
The freeze-drying chamber is a vacuum-tight-ptical system which is capable of being refrig-cutcd (Fig. I). Three glass windows set into anAluminum block provide for sample holding (2)and vacuum seals (1, 3). The block also con-uins an internal path for the flow of chilledrefrigerant (4, 5) as well as a vacuum passage tothe lower vacuum chamber (6). The glass sam-
) pic holder has a large contact area with thealuminum block at the refrigerated end. giving alarge heat transfer surface. A gap is left betweenthe sample holder and one wall of the blockpermitting air and water vapor to flow to thelower chamber and out the vacuum line. Thelower window is semi-permanently sealed to theMock with Apeizon putty. The upper window,4 0.17 mm thick cover glass (45 x 50 mm) restson a rubber O-ring (7) that is held in circularihape by an aluminum ring (8). The total thick-ness of the O-ring and cover slip is less than 1.3mm, allowing use of the long working distanceobjective. Chips of a cover slip are placed at theextremities of the sample holder to support acover slip for the sample at an approximate dis-tance of either 170 ^m (I chip) or 340 jim (2'hips). This enables control of the sample thick-ness which is optically important .
A dry ice-alcohol refrigeration system isusfd for freezing and temperature maintenanceduring freeze drying (l-'ip. 2). A bottom-empty-ing flask maintains a Hooded suction head on"ie centrifugal pump. Fluid is pumped to thefreeze drier through a copper coil immersed in adry ice-alcohol bath before being returned to"it! suction line reservoir. Temperature can be'I'Sulatcd either by on-ol'f cycles of the pump,"i by control of the pump speed.
A single stage rotary oil vacuum pump isused in conjunction with a CaSO4 desiccantvapor trap to remove fixed pases and watervapor from the frcc/.e-drying chamber.
Dried compressed air is gently blown across"ic upper cover slip window to prevent conden-sation of environmental water vapor. The lower
2-4FREEZE DRYING OF MODEL FOOD SOLUTIONS-IKS
A.
O DROP OF VOLATILEPATHWAY OF VOLATILE
CENTRIFUGALPUMP
-igfrfr-COPPER COILJ— OEWAR FLASK
WITHORY-ICE-ALCOHOL
Fig. 2—Refrigeration system for freeze-drying Fig. 3-Path taken by hexanol droplet duringmicroscope, freezing of aqueous maltodextrin solution.
\ V. IA U lFig. 4-lce dendrites during freezing of 3.3% maltodextrin solution(ISO*.).
Fig: 5—Freeze-drying front in 3.3% maltodextrin solution (ISOxJ.
•\-[76-JOURNAL OF FOOD SCIENCE-Volume 38 (1973)
100
2-5
Fig. 6—Freeze-drying front in 3.3% maltodextrin solution /600xJ. F/g. 7—Freeze-drying front in upper layer of 10% maltodextrin solution(shadow of lower region front is to left) (ISOxJ.
glass surface is within an insulation system anddoes not suffer condensation problems.
A carved balsa wood container is used forthermal insulation. This container is attached tothe motion controls of the microscope stage.
Data acquisition systems. Evaluation offreezing and freeze-drying experiments requiresthe measurement of temperatures and pressuresas well as documentation of visual observations.The following instruments supply this informa-tion.
Temperatures are measured by insertion of amicrothermocouple junction into the samples(Omega Engineering Co.. Stamford, Conn.).The junct ion diameter is 125 Aim. The thin ther-mocouple wires (50 /urn) are passed between theO-rin;: and aluminum block of the freeze dryerwithout loss of vacuum.
The system pressure is measured on thevacuum line with a thermocouple-type vacuumgauge having a range of 0-20 lorr (Veeco Instru-ments).
Photographic records of typical visual obser-vations are made with either a Polaroid ED-10microscope camera or a 35 mm camera.
Visual observation is made via a closed cir-cuit television system. This allows long visualobservation periods without serious eyestrainand further, groups of people can observe andevaluate each experiment.
MethodsPreparation of model system. An aqueous
solution is prepared according to a standardizedprocedure. This is especially important whenutilizing components of limited solubility. Themodel system is either held at preparation tem-perature or chilled to 0°C by holding in crushedice.
Preparation of microscope equipment. Thedry ice-alcohol cooling system is prepared andthe microscope stage connected to the coolingsystem. The freezing stage may be precooled to0°C at this time, if desired. Dehumidified airsweeps the stage to prevent condensation of wa-ter vapor.
Sample freezing. The cooling system flow isadjusted to give the desired freezing conditionsat the microscope stage. Freezing progress isfollowed either visually or photographically.
Subsequent steps prior to freeze drying,Upon the completion of the first freezing analy-sis, the sample can either be freeze dried orthawed and subjected to further freezing analy-sis. The latter is of interest when studying theresolubilization of the organic constituents orthe influence of freezing history on subsequentfreezing and freeze-drying behavior. Thawing isaccomplished by stopping the coolant flow oradditionally removing the heat absorbent fromthe lamp of the microscope optical system.
Sample freeze drying. Upon completion ofthe final freezing analysis, the chamber is evacu-ated and the frozen sample is freeze dried. Dueto the small sample dimension, relatively rapidsublimation of the ice occurs. Following drying,the material can further be analyzed by morestandard procedures as described by Flink andGejl-Hanscn(1972).
RESULTS & DISCUSSION
EXPERIMENTAL RESULTS can bedivided into characterization of freezing
.and freeze-drying behavior in the micro-
100AI
**•••£*'..-1
r ^ .-u r.--.-..^- ... .....J
fig. O—Freeze-drying front in lower layer of 10% maltodextrin solution(shadow of upper region front is to right) (}50xJ.
Fig. 9—Hexanol droplets at ice crystal grain boundries (SOOxJ.
2-6
FREEZE DRYING OF MODEL FOOD SOLUTIONS-IITI
/ rV-fif-——•
f /» lO-Hexanol droplets in freeze-dried matrix. 100 microns into sam-pie (JSOxJ.
scope, and studies on the freezing andfreeze drying of aqueous solutions con-taining volatile organic compounds.Freezing behavior
Freezing of water and aqueous malto-dextrin solutions (10%) from room tem-perature generally occurs in 2-10 min.Temperature measurements indicatedthat the maltodextrin solution com-mences freezing at approximately -5°Cand is completed at -7°C (Fig. 13).
Fast freezing is characterized by solidi-fication of the sample in less than 20 sec(initial appearance of ice to completesolidification). The ice structure appearsas plates or sheets without fine structure(Fig. 9).
Slow freezing is characterized by a fastfreezing of a small part of the sampleclosest to the chilled surface followed bydendritic growth of ice crystals over a
period of 0.5-10 min (Fig. 4). Some sam-ples which have been slow frozen in thinslabs undergo dendritic crystallization intwo layers; the bottom of the samplecrystallizes first as disordered dendrites(Fig. 8), the upper region crystallizes lateras ordered dendrites (Fig. 7).
Freeze-drying behaviorFreeze-drying fronts (the moving inter-
face between frozen and dried regions)recede into the sample from all four sides.Samples approximately 1 cm x 1 cm, and0..155—0.3 mm thick under a cover sliprequire from 50-80 min to freeze dry.
Separate freeze-drying fronts are ob-served in each of the different ice crystalorientations (and thus solute matrixorientations). The fronts are not com-pletely planar, with small variations oc-curring among crystals having the sameorientation (Fig 5, 6), and larger varia-
Fig. 1 1 -Hexanol droptets in freeze-dried matrix; same view as 10. butat sample surface
tions for crystals of different orientation(at different vertical locations) (Fig. 7,8).
Freezing and freeze drying ofaqueous solutions containingvolatile organic compounds
Aqueous solutions of maltodextrin(10% w/v) and hexanol (0.3% w/v) areused for studying the phenomena associ-ated with freezing and freeze dryingwhich are responsible for retention of thevolatile organic compounds in the driedmaterial. The initial solution containssome liquid droplets prior to cooling.During the freezing process, the hexanolsolubility limit is exceeded and manydroplets of hexanol liquid appear. Oftenthese droplets of hexanol move relative totheir initial location due to bulk liquidfluid flow associated with liquid densitydifferences resulting from temperaturegradients and fluid flow associated with
Fig. 12—Hexanol droplets in freeze-dried matrix; same field as UI600X.).
„ 0us,
-» -5
MP
ER
A
5u
-2010 15 ZO 25 30
TIME (MINUTES)65 7O
Fig.- 13—Sample temperature during freezing and freeze-drying of drop-let samples.
mZ-JOURNAL OF FOOD SCIENCE-Volume 38 (1973)2-7
the growth of ice crystals. Figure 3 por-trays the path taken by a hexanol dropletduring the concentration steps associatedwith freezing. The extent of dropletmovement is quite variable; in some casesit can be many droplet diameters, thoughin many cases it is little or none. Thisprocess results in the entrapment of thedroplet in the interstitial solute matrixconsisting of eutectic maltodextrin solu-tion. Figure 9 shows these droplets at theice grain boundaries of a completely fro-zen maltodextrin sample. These en-trapped droplets of volatile (averagediameter 2 microns) remain stationaryduring freeze drying and are foundthroughout the sample thickness in thedry amorphous matrix (Fig. 10 to 12).Similar behavior was observed in experi-ments at hexanol concentrations above<0.8% w/v) and below (0.1% w/v) thatnoted above.
The appearance of liquid droplets ofalcohols in freeze-dried aqueous malto-dextrin solutions has been related to thesolubility of the volatile alcohols (Flinkand Gejl-Hansen, 1972). Furthermore,the influence of molecular size, solubilityand concentration on retention of thevolatile following freeze drying has beendemonstrated by Flink and Karel (1969,1970a). A 0.5% (w/v) solution of a more
soluble alcohol, n-butanol, behaved simi-larly, though the droplets formed duringfreezing are much smaller, making themmore difficult to observe.
While experimental work is continuingwith the freeze-drying microscope, it ap-pears obvious that for some typical vola-tile organic compounds of limited aque-ous solubility, retention after freezedrying is in the form of liquid dropletswhich primarily develop during coolingand freezing and are entrapped in the in-terstitial matrix after freezing. Thesedroplets of volatile compounds are lockedinto the dry material following the freezedrying step.
REFERENCES
Chandrasekaran. S.K. and King. C.J. 1972.Volatile retention during drying of foodliquids. AIChE J. 18(3): 520.
Chauffard, F. 1971. Microscopical examinationof freezing and freeze-drying. Nestle Re-search News 1971: 78.
Flink, J.M. and Gejl-Hansen, F. 1972. Reten-tion of organic volatiles in freeze-dried car-bohydrate solutions: Microscopic observa-tions. J. Agr. Food Chem. 20(3): 691.
Flink, J.M. and Karel, M. 1969. Mechanisms ofretention of organic volatiles in freeze-driedsystems. Presented at the AIChE Meeting,Nov. 1969, at Washington, D.C.
Flink, J.M. and Karel, M. 1970a. Retention oforganic volatiles in freeze-dried solutions ofcarbohydrates. J. Agr. Food Chem. 18(2):295.
Flink, J.M. and Karel. M. 1970b. Effect! ofprocess variables on retention of volatile* infreeze drying. J. Food Sci. 35: 444.
Flink, J.M. and Labuza. T.P. 1972. Retentionof 2-propanol at low concentration byfreeze-drying carbohydrate solutions. JFood Sci. 37: 617.
Freedman, J., Whittam. J. and Rosano, H.1972. Temperature gradient freeze-dryinfmicroscope stage. J. Food Sci. 37: 492.
Luyet, B.J. 1968. The formation of ice and thephysical behavior of the ice phase in aque-ous solutions and in biological systems. In"Low Temperature Biology of Foodstuffs,"Ed Hawthorn. J. and Rolfe, E.J. PergamonPress, Oxford.
MacKenzie, A.P. 1964. Apparatus for micro-scopic observations during freeze-drying.Biodynamica 9(186): 213.
McCrone, W.C. and O'Bradovic, S.M. 1956.Microscope cold stage for controlled studyover the range -100 to -HOO°C. Anal.Chem. 28(6): 1038.
Rey, L., Dousset, M. and Chauffard. F. 1966. 'Les lyophilsations complexes. In "Advance!in Freeze Drying." Ed Rey, L. Hermann,Paris.
Rulkens. W.H. and Thijssen, H.A.C. 1972. Re-tention of volatile compounds in freezedrying slabs of maltodextrin. J. FoodTechnol. (Brit.) 7(1): 79.
Thijssen. H.A.C. and Rulkens, W.H. 1969. Ef-fect of freezing rate on rate of sublimationand aroma retention in freeze-drying. In"Recent Developments in Freeze Drying.Part 1. Thermodynamic Aspects of Heat andMass Transfer." Bull. I1R Annex 1969-4. p.99, International Institute of Refrigeration.
Ms received 4/21/73: revised 6/14/73; accepted6/16/73.
This study was supported by contract no.9-12485 from the Manned Spacecraft Center,NASA, Houston.
2-8
2.3 Observations of freeze drying fronts in the microscope
During observations of freeze drying processes,
the sublimation front appears as a dark band of varying
width. In an effort to determine changes occurring at
the freeze drying interface, a study of the nature of the
sublimation front was conducted. In particular, the
dark nature of the band made observations difficult,
and it was originally considered that the dark region
could indicate some aspect of the changing moisture
content.
Two views of sublimation fronts for different malto-
dextrin samples'are shown in Figure 1. The observed width
of the front was found to depend on the rate of movement
of the front. The sharp front on the left was progressing
at about 300 ym/min and had a width of about 2-3 ym,
while the more diffuse front on the right (about 15 ym
wide) was moving at less than 100 ym/min. Rates of move-
ment of the freeze drying front are related to a balance
of heat and mass transfer in the drying sample. A closer
inspection of the dark band showed that rather than being
a diffuse region, in actuality it was an ice-vapor
interface at an angle to the optical axis. There was
a sharp interface at the chamber bottom glass surface
and another sharp interface at the chamber top glass
surface, and it was possible at high magnification using
2-9
thin samples, to focus at selective places along the
inclined interface. The fact that this interface is
inclined to the optical axis means that light rays passing
through the interface are refracted and/or internally
reflected and thus the incline appears dark. The width
of the dark band depends on the slope of the incline
(and sample thickness) and the slope of the incline
of the interface,; reflects the fact that the chamber
cooling is entirely from the lower glass sample holder
and thus there is a vertical temperature gradient in
the sample. A low temperature at the sample-sample
holder interface will give a slower drying at the lower
level and thus the interface slope will decrease, result-
ing in a broadening of the diffuse dark band;
This behavior, while of interest, is not expected
to effect the general validity of the observations
made using the freeze drying microscope. Examples of
the direct transferability of observations in the freeze
drying microscope and the laboratory freeze dryer are
the agreement of retention levels of ethyl acetate in
freeze dried maltodextrin (see section 2.4) and similarity
of physical appearance of samples freeze dried in both systems,
2-10
2.4 Retention of volatile organic compounds
Retention of volatile organic compounds was investi-
gated in the freeze drying microscope for a complex food
gel. This study was associated with the study reported
upon in section 5.5 of this report. In addition to
14this study, an evaluation of the possible use of C
labelled volatiles as a means of quantitatively determining
volatile retention during freeze drying under the microscope
was conducted.
2.4.1 Retention of hexanol in a complex food gel
A complex food gel which is a commercial replace-
ment for pectin served as the non-volatile solute at a
solids content of 1%. The gel solids consisted of the
following components:
locust bean gum 35%
guar gum 20%
Carrageenan gum 15%
Agar gum 30%
The 1% (w/v) gel was mixed with hexanol (0.2% w/v)
and a droplet was placed on the stage of the freeze drying
microscope. The liquid sample, prior to initiation of
freezing contained a few hexanol droplets of -2ym which
were observed to move about in the aqueous phase. Also
present were undissolved gel particles of up to lOOym in
maximum dimension.
2-11
Slow freezing conditions resulted in the growth of
regular ice dendrites, first along the bottom surface of
the microscope chanber (location of largest supercooling),
and later at higher levels in the sample parallel to the
chamber bottom. In all, five layers of regular ice
dendrites formed. During the period of ice dendrite
growth, hexanol droplets and insoluble gel grains were
observed to be pushed away from the growning ice crystals
and trapped in the interstitial solute phase. As this
phase solidified (i.e. the temperature decreased), hexanol
precipitated from solution as spherical inclusions in
the solute matrix. (A similar phenomenon is graphically
presented in section 2.2).
Following complete solidification of the gel
vacuum was applied and freeze drying was commenced.
Despite a satisfactory vacuum (0.4 torr) and ice front
temperature (-12.5°C), the drying front moved very slowly
(-lOOym/min), with the highest, rate occurring in the
largest dendrites. Each layer of dendrites had a
different rate of movement of the ice interface, probably
due to a temperature gradient across the sample and
possibly also due to differences in ice dendrite dimensions,
One interesting phenomenon noted was the<apparent spontan-
eous appearance of drying zone ahead of the drying front,
much like dry islands in a sea of frozen material. It
2-12
could not be determined if this behavior might be due to
microscopic cracks in the frozen material, or from some
Evaluations of browning in the heat treated egg is
conducted on a chloroform extract of the egg and on an
aqueous KC1 extract of the previously chloroform-extracted
material. The proceedure is given below:
1) Weigh exactly 3.00g of freeze dried egg into a
56 ml erlenmeyer flask.
2) Extract with 35ml chloroform for 15 min with
agitation.
3) Suction filter taking care to collect all clear
filtrate.
4) Wash sample with 2-10ml portions of chloroform.
5) Repeat steps 2-4 and combine the filtrates.
6) If the filtrate is unclear, complete 2-5 before
refiltering the entire combined filtrate.
7) Solution absorbance is measured at 390 nm, using
chloroform as a blank.
3-14
8) Browning value for chloroform extract is calculated
as:O.D xlOO
B.V. = —3.00g ,
9) The material collected on the filter paper after
step 5 (or 6) is dried in air.
10) Weigh exactly l.OOg of the dried material into
a 50 ml erlenmeyer flask.
11} Extract with 25ml of a 10% KC1 solution for 15min
with agitation.
12) Gravity filter (No. 589 filter paper) into a
100ml volumetric flask with a small amount of
asbestos fiber at the apex of the filter paper.
13) Rinse solids with 3-20ml portions of 10% KCl solution,
14) After sample is well drained, filtrate to mark
with 10% KCl solution.
15) If solution is cloudy, centrifuge before continuing.
16) Measure fluoresence against a 0.200 yg/ml quinine
sulfate solution set at 50%.
Fluorimeter settings:
Exict A = 365nm Exict slit = 40
Emm \ = 450nm Emm slit = 14
Filter = 39
i.
3-15
. 3.3.2 Evaluation _of_ browning of freeze dried whole egg
During the SKYLAB mission, freeze dried eggs were
found to be particularly susceptible, and it was decided
to include them in the program in Phase II. Brown color
formation was studied in freeze dried raw whole egg. It
v/as necessary to first evaluate an analytical technique.
It would be most desirable to obtain a quantity which can
be correlated with visual evaluation of product discolora-
tion. A standard method for deterioration of quality of
dehydrated egg products during storage is the Standard
,Fluroescence Technique of Pearce and Thistle [Can. J. Res.
20D:276(1942)].
This technique is generally used at temperatures
of normal or slightly accelerated storage conditions, and
there was no information on its applicability to the
higher temperatures. Initial results showed that while
the visual brown color increased with heating time at
100°C, fluorescence values reached a maximum at an inter^
mediate heating time with subsequent decrease at 11 and
32% RH, and an asympotic approach to a maximum value in
dry samples. (Figure 11).
When the heating temperature was lowered to 70°C
there were no fluorescence maxima, and fluorescence of
eggs appeared to be similar to the pattern of browning in
milk (Figure 12). It was observed that the chloroform
extract used to remove lipid prior to the KC1 extraction
3-16
for the fluorescence measurements, had a visual darkness
similar to appearance of the samples prior to extraction.
The possibility of using the chloroform extract as a
measure of browning was thus investigated.
Measurement of absorption of chloroform extracts
of browned egg showed an optimal sensitivity at 390nm.
The browning values of the chloroform extract were observed
to increase rapidly and then level off as time of heating
was increased (Figure 13). Visual comparisons have shown
that the samples could be differentiated, but it was not
possible to conclusively correlate browning values with
visual ranking analysis, because of lack of samples heated
during the early portion of the heating period.
Qualitatively, visual inspection of heated samples
of dry egg shows an appearance which parallels the measured
browning values, in that (1) all the heated samples appear
much darker than the unheated sample and (2) the gradations
of darkness between samples heated for different times
are slight compared with differences between samples heated
at different temperatures.
It has been noted that the visual color of the chloro-•
form extracts monotonically increases in darkness with
heating time, which is in constrast to behavior of fluores-
cence (Figure 14). Fluorescence technique is measuring
a browning intermediate which breaks down rapidly at the
3-17
' temperatures of interest in this study. The intermediate
nature of the products contributing to fluorescence is
not unexpected and emphasizes the need for additional
methods for evaluating the brown color.
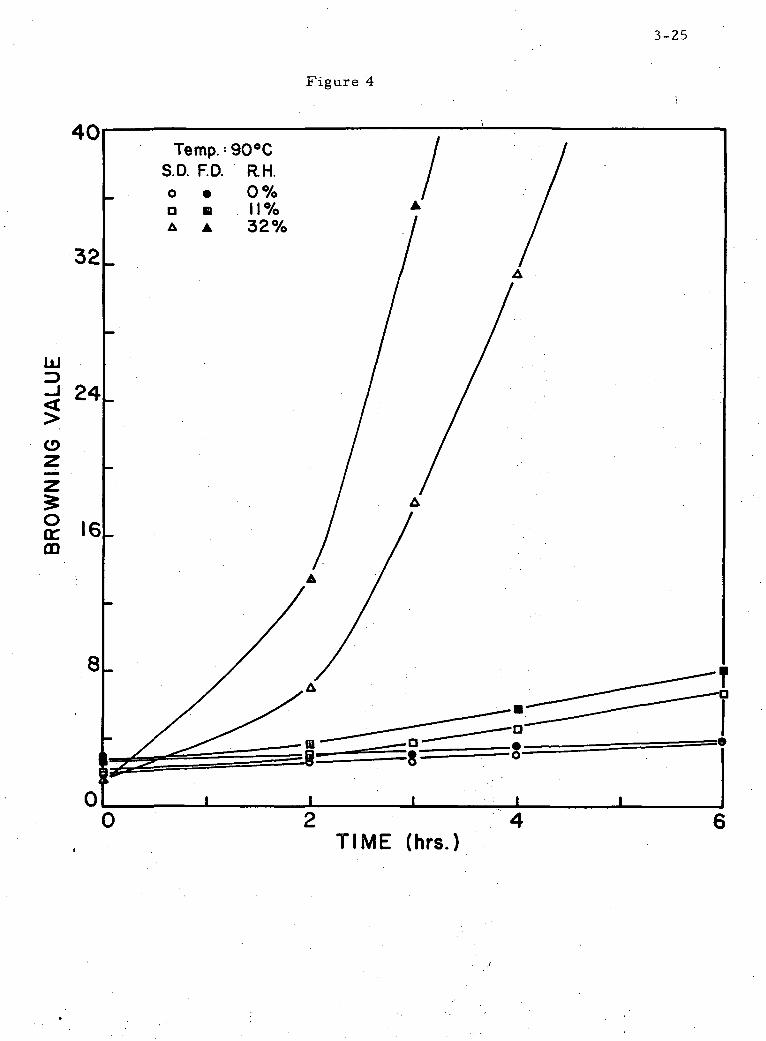
The extent and the rate of browning appear to be
related to the rate of formation of the intermediates as
measured by fluoresence arid the onset of their destruction.
In Figure 13 are plotted data from two experiments conductedt
at 90°C on different batches of raw egg. While the curve
90°C(A) appears markedly different from that labelled 90°C(B)
it appears that the sources of these differences lies
entirely in different "lag" periods for these two samples,
and this difference may in turn be related to formation
of intermediates. An approximate evaluation of initial
rates of browning can be made. While this is only a
rough approximation, an activation energy of about 23 Kcal/
mole is found, somewhat lower than that found for dried
milk though close to the value found for the model
system studied in Phase I (19kcal/mole).
3-18
Table 1
Browning of
B . V . . = ' mt + b
Temperature ' RK
°C ^-(°K~1xlO~3)JL .-r-x.-!..—
70 2.92 32
80 2.83 1132
90 2.75 01132
.100 2.68 01132
110 2.61 0113232*
freeze-dried non-fat milk
t = time in minutesr = correlation coefficientm = browning rate
m
0.0099
0.00310.0837
0.00330.01570.4083i
0.01570.25810.6649
0.09230.82711.88042.1920
Activation
RH
. 01132
In m = m'—
m1
-23.7843-26.7203-16.4836
In m
-4.6135
-5.7682-2.4803
-5.7125-4.1548-0.8957
-4.1548-1.3546-0.4082
-2.3827-0.1897+0.6316+0.7848
energy
+ b '
b
1.2383
2.55-7.6557
2.57142.4971
-36.7143
1.4140-31.1514-35.0946
-2.5030-69.74-104.33-208.62
b1
59.657869.745543.9083
r
0.9938
0.83090.9966
0.91700.87780.9997
0.97150.97040.9945
0.96910.95780.96870.9991
r
-0.999.3-0.9875-0.9825
3-19
Table 2
Browning of Dried Milk at 90°C
Visual and Chemical Evaluation
Ranking by visual test*
32/6
32/4
32/3
11/6
32/2
11/4
11/3
00/4
00/6
00/3
32/0
11/2
11/0
00/2
00/0
a
b
c
d
d,e
e,f
f
gggh
h
i
i
i
***
****
Browning value**
109.5
49.6
23.2
8.4
10.4
5.4
4.5
1.39
1.06
0.96
2.4
3.50
1.82
0.27
0.31
**
***
*** *
Sample codes (RH/HRS): samples with same lowercase letters are not different at 5% level
Browning value equalsOD42Q x 100
Wt sample
Acceptability limit - independent judgement
Acceptability limit - group judgement
3-20
Section 3
Figure 1
Figure 2
Figure 3
Figure 4
Figure 5
Figure 6
Figure 7
Figure 8
List of Figures
Water sorption isotherm of freeze dried
non-fat milk at 37°C
Browning of freeze dried non-fat milk heated
at 90°C in ampoules sealed with either air
or under vacuum
Browning of freeze dried non-fat milk heated
at 100°C in ampoules sealed with either air
or under vacuum.
Browning of freeze dried and spray dried
milk powders at various water activities
at 90°C
Browning of freeze dried and spray dried milk
powders at various heating temperatures
and 32% R.H.
Duplicate experiments of browning of freeze
dried milk powder at 100°C
Browning of freeze dried milk powder heated
at various temperatures and 32% R.H.
Browning of freeze dried milk powder heated
at various temperatures at 0 and 11% R.H.
3-21
Figure 9
Figure 10
Figure 11
Figure 12
Figure 13
Figure 14
Rates of browning of freeze dried milk
powder for heating treatments at various
water activities
Arrhenius plots for browning of freeze
dried non-fat milk
Fluorescence of freeze dried whole egg
heated at 100°C
Fluorescence of freeze dried whole egg
heated at 70°C
Browning values of chloroform extracts of
freeze dried whole egg powder heated at
various temperatures (Insert - Arrhenius plot)
Fluorescence values of freeze dried whole
egg powder heated at various temperatures.
3-22
20
15
£o>~ 10
Figure 1
0.2 0.4 0.6WATER ACTIVITY (Aw)
0.8
Figure 2
3-23
±>S S5 ^ttfo = ro
Q- i-£ oo>
I I
0*43
UJ
<* • CJ
CM00
301VA ONINMOdS
3-24
Figure 3
<•« 1 CD
301VA ONINMOdQ
Figure 4
3-25
Temp.: 90°CS.D. F.D. RH.
• 0%
2 4TIME (hrs.)
3-26
Figure 5
32%R.H.S.D. F.D. TempA A 90°Co • 80°CD • 70°C
TIME (hrs.)
3-27
Figure 6
LdID
Ioc00
Temp.' |00°C
run I run 2 R.H.A A 0%• o 11%
• u 32%
TIME (hrs.)
3-2b
Figure 7
200.
LU
2 4TIME (hrs.)
3-29
Figure 8
80
60UJ
40
o<rco
20
• / i "T"I"~: - - o IOO°C(0%)
p^ ^~" v 70°C(II%)j ^ I I I I >
2 4TIME (hrs.)
Figure 9
3-30
80 90 100 110TEMPERATURE (°C)
Figure 10
\0\
3-31
-2
In m
-4
-6
o\32%
\
26 2.7 2B 2J9 3.0 3.1
3-32
Figure 11
6000.
14002 4
TIME (hrs.)
Figure 12
3-33
5000
4000.
UJ
UJOz.UJoCOLJ
3000_
2000.
lOOOi
oL
•Refrigerator stored,not humidified.
0% R.H.
j I
TIME (hrs)
Figure 13
3-34
UJ:D
CD
Oo:m
TIME (hrs.)
Figure 1'4
3-35
4000.
2 4TIME (hrs.)
4-1
4• Artificial gel structures for engineered space foods
4.1 Introduction
The future supply of space missions requiring a
palatable, stable and controlled-nutrient level diet, may
rely to an increasing extent on artificially created
foods based on a variety of key ingredients. One of the
important attributes of such systems is the development
of texture simulating natural foods or even exceeding in
quality such natural food items. At present the commercial
emphasis in this field has been almost entirely on thermo-
plastic extrusion, or solution-spinning of oilseed- or
bean- derived proteins. The commercial approach has been
predicated on creation of a mass market with relatively
rapid recovery of investment. These requirements pre-
cluded the utilization of expensive technology or of
simulated food replacing actual foods with low inherent
cost. The commercial approach has therefore concentrated
on very inexpensive "extenders" of meats and on somewhat
more expensive "analogs" meant to substitute for the
increasingly costly foods derived from animal tissues
(meats, fish, crustaceans).
In our preliminary approach to the present problem,
therefore, we have decided to concentrated on two aspects
which are not at present subjects of active commercial
activity:
4-2
A) Non-aqueous and complex freeze drying methods
designed to produce structured dehydrated systems.
B) Preliminary experiments on establishing
parameters and approaches for creation of gel systems
approximating organoleptic characteristics of fruits
and vegetables.
4-3
4.2 Non-aqueous materials and the freeze drying process
The following review of this subject was presented
by Professor Flink at the A.I.Ch.E. Meeting in Detroit
in June of 1973, and was subsequently published in
AIChE Symposium Series 69 (132) , 63-69 , (1973.) .
4-4
NONAQUEOUS MATERIALS AND THEFREEZE DRYING PROCESS
Drying processes involving the substantial presence of nonaqueous materials
an be divided at present into two major areas:
1. Freeze drying of nonaqueous systems.
2. Freeze dehydration of aqueous systems using nonaqueous solvents.
The first process is conceptually similar to the conventional freeze drying
irocess except that nonaqueous solvents are being sublimated. This allows the
ireparation of porous dry materials which are not normally or easily soluble in
vater. The second process is somewhat different, being an organic extraction of
rozen aqueous-based materials which results in dried products that have charac-
eristics similar to conventionally freeze dehydrated materials.
. The basic concepts of the two processes are discussed, and examples of their
lotential application to the food industry are presented.
James M. Flink
Drying procedures utilized in the processing or production)f foods almost exclusively involve the removal of water fromhe primarily nonvolatile organic solute. Dehydration is gen-:rally accomplished by contacting the foods with heated air;or example, by tunnel or spray drying. Separate mediums forteat and mass transport are also utilized, as in drum drying.n describing these traditional drying processes, the term\onaqueoits materials refers to organic materials generally>resent in limited concentrations.
During this symposium, however, we are considering situa-ions in which nonaqueous materials comprise a major portion»f the items being dried or used in the drying process itself.lost interact ions of nonaqueous materials and drying proc-sses (especially freeze drying in our case) can be divided intohe following topics:
1. Freeze drying of metal salt systems present in high con-entration in aqueous solutions.
2. Freeze drying of nonaqueous systems, or mixtures ofionaqueous and aqueous systems.
3. Drying of water-containing samples by contacting them/ith nonaqueous materials.
Department of Nutrit ion and l-'ood Science. Massachusetts InstituteI' Technology, Cambridge, Massachusetts 02139.
These three areas are relatively independent since theyapproach the interaction of nonaqueous materials and dryingprocesses from quite different viewpoints.
Topic 1 employs the rather loose interpretation of inor-ganic acid and metal salt solutions as nonaqueous even thoughthe fluid medium is water. This liberty is taken so that interest-ing ideas from the field of metallurgy and material sciencemight be included and considered for possible adaptations tofood processing.
The tendency, when considering food drying, is to think interms of removal of the system solvent, water. In topic 2,nonaqueous materials serve as the system solvent, and freeze .drying in this case refers to the removal of volati le organicsolvent, with the essentially solvent-free, nonvolatile solutesremaining. Mixed aqueous-nonaqueous systems have also beenstudied.
In topic 3, conventional food materials (that is, productscomposed primarily of water) are dried by contacting themwith an excess of nonaqueous material. Studies have been con-ducted with the material to be dried in both the frozen andunfrozen states. Although use of a frozen product is closestconceptually to conventional freeze drying, we will discussboth situations since claims of quality equal to normal freezedrying are made for both frozen and unfrozen materials.
63
4-5
64 FOOD PRESERVATION
FREEZE DRYING OF AQUEOUS INORGANIC SYSTEMS
In the past few years metallurgists and material scientistshave become increasingly interested in the utilization offreeze drying for the production of ceramic (/ to J) and metal(4 to 6) powders having novel properties. In contrast to theusage of freeze drying in the food industry where the samplecomposition is generally accepted as that present in the rawmaterial, processes for preparation of freeze-dried metal orceramic powder start with a controlled formulation ofvarious pure chemical species. These species mix on a mol-ecular level when they are in solution, forming a completelyhomogeneous dispersion. The importance of freeze drying tothe overall process is that, if proper processing conditions areutilized, this homogeneous molecular dispersion can be main-tained in the dry product. Proper processing essentially con-sists of the following:
1. Choosing chemical species which! maintain their solu-bility during the lowered temperatures of the freezing steps.
2. Very rapid freezing so that gross partitioning of solutefrom the ice cannot occur.
3. Maintenance of freeze drying conditions which allow nomelting or other structural changes during the drying steps.
Contrary to freeze drying of foods, the freeze-dried pow-der resulting from this processing scheme is generally anintermediate in the overall process. Thus, for example,Landsberg and Campbell (6) describe further treatments oftungsten-rhenium powders formed by freeze drying an aqueoussolution of the ammonium salts of tungsten and rhenium. (Theinitial solution was prepared by mixing a H2W04-NH4OH
solution with a Re 0? solution.) The freeze-dried powder wasfirst heated stepwise from 200° to 900°C. while exposed tohydrogen gas to reduce the salts to the metal. Following thisreduction, the metal powders were compressed (with binders)and sintered to form the desired tunsten-rhenium alloy havinguniform composition.
Roehrig and Wright (5) report similar treatments on a widevariety of metals and ceramics. They further note that onecan selectively transform components of the homogeneouspowder so that the resultant product could be either a two-component metal alloy or a ceramic-metal mixture.
Another interesting characteristic of the freeze dryingprocess concerns the very fine particle size of the powder.Roehrig and Wright (3, 5) describe the preparation of tungstencarbide particles 200 to 500 A in diameter although they hadbeen present as particle chains 0.7 pm in diam. (presumablydue to overheating in the conversion to the carbide). Thesechains could be comminuted to give the individual particles.Landsberg and Campbell (6) also report extremely fine parti-cles for their freeze-dried ammonium tungstatc (0.03 to 0.05ftm), although the particles increase in'size following reduc-tion to metallic tungsten (0.2 to 0.4 pm).
These fine grain powders provide very large surface areas,as noted by Trambouze (7) in his discussion of the use of
AIChE SYMPOSIUM SERIES
freeze drying for the preparation of adsorbents and catalysts.This fact in itself is of interest when considering possible usesfor these very fine freeze dried powders. At the same time,fine-particle, freeze-dried alumina powders were treated bycalcining, coripressing, and sintering to form very dense speci-mens (99.8% of the theoretical maximum) (/). These verydense alumina materials were shown by electron microscopyto have a very smooth surface essentially free of pores.
These concepts which have been developed for the produc-tion of metal and ceramic powders, may be relevant for develop-ing future food processing techniques. Of particular interest are:
1. Preparation of controlled formulations homogeneouslydistributed at the molecular level in the dry state.
2. Freeze-dried material which serves as an intermediate forfurther processing treatments.
3. Preparation of powders with fine particle size and subse-quent control of surface properties.
FREEZE DRYING OF NONAQUEOUS SOLVENT SYSTEMS
For food or biological systems, the solvent occurring innature is water. Thus, preservation techniques based on thelowering of the activity of the solvent have been concernedwith the removal of water. One of these techniques is freezedrying, or lyophilization. In the freeze drying process, samplesof nonvolatile solutes dissolved in water are maintained in thefrozen state, and the water, having a higher vapor pressurethan the solute, is volatilized by a sublimative transformation.Materials containing solutes that have higher vapor pressuresthan water are subject to some special considerations.
The same principles that exist for freeze drying aqueoussystems apply to all systems where a relatively nonvolatilesolute is present in a more volatile solvent. Therefore, mater-ials dissolved in nonaqueous solvents can be dried (desolven-tized) by freeze drying. The success of this technique has beendemonstrated by Rey and his co-workers for a number ofpurely nonaqueous solvent/solute systems as well as for mixedaqueous/nonaqueous systems(8 to / /) . As most of the fun-damental aspects of this area of freeze drying have been con-ducted by Rey et al., the following discussion will draw heavilyon their developments.
For the successful freeze drying of nonaqueous systems,it is necessary that the solvent-and solutes have widely differ-ing vapor pressures at temperatures for which the system existsin the solid state. Other considerations involve the abil i ty tomaintain the sample in the solid state so that structural changeswill not occur. As with aqueous samples, the nonaqueous sys-tem must be kept at a temperature well below the solventmelting point so that it is maintained in the solid state duringsublimation of solvent. To conduct the freeze drying, it is alsonecessary to have a condensing surface at a temperature lowerthan that at the frozen-dry interface of the freeze dryingsample. Finally, the rate of vapor transport from the sampleto the condenser is greatly enhanced by conducting the sub-limation at reduced pressure.'
4-6
No. 132, Vol. 69
Rey (8) described some initial work demonstrating thatieveral organic solvents could be utilized for freeze drying,jlycerol distearate, at a concentration of 7.5%, or poly-ityrene at concentration of 0.1 to 1% was freeze dried fromsolutions of benzene, carbon tetrachloride, dioxane, or chloro-brm. A 5% maltose solution in diethylamine was also freezeIried.
In these processes, the sample temperatures generally rangedrom -90°C. at the initiation of the process to -30°C. as theast traces of solid solvent were removed. At the completion)f the drying process, the temperature was allowed to reach20°C. Chamber pressures during sublimation were approxi-nately 10"' torr. To achieve the low temperatures necessary,(quid nitrogen (-196°C.) was used for the ini t ial freezing andor cooling the vapor condenser.
Rey et al. (9) later reported on expansion 01 their earliervork to systems that utilize two solvents. The> have namedhe freeze drying of multisolvent systems, where some sol-'ents are nonaqueous in nature, as complex freeze drying.Complex freeze drying can be subdivided into two subsetsiccording to the methodology used:
1. Successive complex freeze drying.
2. Joint, simultaneous, or staggered complex freeze drying.
Successive complex freeze drying consists of successivelimple freeze dryings in which some of the systems treatedvere nonaqueous. This type of complex freeze drying is:onducted in the following manner:
1. A simple solvent-solute system (either aqueous or non-iqueous solvent) is freeze dried.
2. The freeze-dried cake is impregnated with a second solute-olvent system in which the cake is not soluble.
3. The impregnated solvent-solute system is frozen and then'reeze dried.
An example is given in which a mixed low density solid of•olystyrene and dextran is obtained (9).
This complex freeze drying process can be repeated anylumber of times provided that the subsequent solvents usedvould not dissolve any of the solutes which comprise thereeze-dried cake. Use of such a solvent is conceivable, however,'here controlled solubilization might be used to produce de-red product.characteristics.'
The products obtained by successive freeze dryings withifferent solvents have several interesting characteristics. Asith most freeze-dried materials, a highly porous solid isbtained. The process can be devised, however, so that theorous cake .is composed of normally incompatible materials'hich are present in close association on a molecular level.urthermore, these materials are present in a highly extendedate with respect to in ternal surface area. The order of prep-ration of the mater ia l can be expected to influence theliysical and chemical properties of the final material . The)lvent-solute system freeze-dried first wil l determine therimary structure of the final solid since further impregnationsid freeze drying will occur in the void spaces remaining. The
FUNK 65
second solute phiise can exist as islands in a matrix of firstsolute phase, or the second phase could form an interminglingmatrix with the primary phase, such that both could be con-sidered independent backbones of the overall structure.
Current practice for the freeze drying of immiscible sys-tems is to prepare an emulsion of the materials and freeze drythe emulsion. Complex freeze drying can be expected to givedry materials having different, properties even though the over-all compositions would be the same.
Successive complex freeze drying allows the preparation ofdry materials with closely controlled physical and chemicalproperties. In the fabrication of food materials, for example,texture might be improved by the addition of a second water-insoluble solute which will prevent overall softening of thefood following rehydration. The fabrication of structures onthe molecular level by complex freeze drying is an area forpotential development.
The incorporation of water-soluble materials in a water-insoluble matrix, or vice versa, is another potentially significantarea in food processing. Consider the possibility of controlledrelease materials (water-soluble compounds released from awater-insoluble matrix) where the influence of temperatureon diffusion controls the release. The influence of water onrelease of the water-soluble compounds could be predeterminedby properly designing the water-insoluble matrix. It should bepossible, for example, to have matrices which do not releasewhen contacted with water vapor, but allows leaching whencontacted with liquid water, or matrices which will not releasewhen contacted with water in either the liquid or vapor state.In the later case, release would be temperature controlled.
Successive complex freeze drying seems to offer the bestpossible control of the properties of the final product sinceeach step can be independently regulated. This level of controlis obtained only by uti l izing multiple freeze drying steps, whichwill result in a high total cost. Freeze drying mixed systems inone operation will significantly reduce processing costs butpresumably at some loss of quality.
Complex freeze drying in one step has been subdivided byRey et al. (9) into two mechanisms, simultaneous and staggered,depending on whether the solvent vapors are sublimated simul-taneously or if one vapor is preferentially removed. As hasbeen noted, the properties of final materials having the samesolids composition can differ depending on the solvents usedand on the conditions utilized for freezing the solutionsinitially.
We will consider a few general cases. Homogeneous systemsare defined as those in which the solvents are miscible andthe solutes, each being miscible in its particular solvent, arecompletely mixed when in the liquid state. This homogeneitydisappears during freezing, when the solvents with their re-spective solutes undergo phase separation and crystallize.Freeze drying can now occur either in a simultaneous orstaggered manner. An example of simultaneous sublimation isthe mixed solvent system, waterdioxane. The dioxane isused to solubilize polystyrene: water is the solvent for dextran.During freezing, dioxane (with the polystyrene) crystallizes
66 FOOD PRESERVATION
first and the dioxane crystals are eventually surrounded byice crystals (with the dextran). Sublimation, however, occurswith equal loss of dioxane and water. The solvent system,dioxane:carbon tetrachloride has a different sublimationbehavior. This homogeneous system separates upon freezing;dioxane crystallizes first, initially as isolated regions, althoughit later is surrounded by solidifed carbon tetrachloride. Dur-ing freeze drying, carbon tetrachloride sublimates much morerapidly than dioxane; only 44% of the dioxane has been lostwhen the last of the carbon tetrachloride-is removed.
Most systems considered for complex freeze drying will beheterogeneous rather than homogeneous. A degree of homo-geneity is achieved by forming an emulsion of the solvents.While it is not necessary that water be included, most systemsstudied have been water:solvent emulsions. The final structureachieved depends on the state of the emulsion and thus pri-marily on the solvent material. For example: when water isemulsified with carbon tetrachloride, it crystallizes first, asa continuous phase; when emulsified with benzene, it formsa dispersed phase and crystallizes second.
An interesting aspect of complex freeze drying of emulsi-fied systems is that, although the sublimation rate is differentin each phase, the nonaqueous solvent is usually eliminatedfirst. Although this characteristic is primarily related to vaporpressure differences, other factors such as solutes and emul-sion properties exert an influence. The preferential elimina-tion of the nonaqueous solvent occurs whether the solventis the continuous or dispersed phase. Thus, when solvents arethe dispersed phase, solvent vapor must be able to pass throughthe continuous phase, ice. Lambert et al. (12) recently dem-onstrated this phenomenon under more controlled condi-tions.
Freeze drying of nonaqueous materials has been investi-gated with liquid ammonia and liquid carbon dioxide assolvents (#). Both of these good solvents have wide-rangingusefulness, especially in cases where water proves inadequate.The particularly reactive environment provided by liquidammonia is conducive to the formation of new chemicalspecies. Unstable compounds produced in this system can thenbe freeze dried at low temperature to yield stable dry powders.Dry powders containing stabilized free radicals can be pre-pared by irradiating frozen solutions of free radical formersin liquid ammonia at -196°C. The frozen liquid ammonia solu-tion freeze dries at such low temperature (approximately-110°C.) that the free radicals remain immobilized and retaintheir activity.
Liquid carbon dioxide is increasingly recognized as an im-portant solvent for foods due to its special physical andchemical characteristics. A promising area for the expandeduse of liquid carbon dioxide is for extraction of food flavors.Following this extraction, several processes can be consideredfor obtaining the solvent-free extract. Carbon dioxide-soluble, nonvolatile solute can be added to the liquid system,which can then be frozen by contact with a surface chilled byliquid nitrogen and at a vapor phase pressure of about 10atmospheres. Freeze drying at -78°C. will commence spon-
4-7
AIChE SYMPOSIUM SERIES
taneously when the pressure is reduced to atmospheric andheat input is allowed; it will be rapid at low temperature andatmospheric pressure, and the product will be a dry matrixcontaining the flavor extract. Another use of the liquid carbondioxide extract, involving impregnation of freeze-dried coffee(not soluble in liquid carbon dioxide) is discussed by Rey (11).This is essentially a successive complex freeze drying.
The influence of complex freeze drying process variables onproperties of the final product have been investigated byBlond (13) and Blond et al. (14). The physical property ofprimary interest was the specific surface of the dry materialas measured by krypton gas adsorption and pore size evaluationusing sectioned samples under the optical microscope. Thesestudies showed that the speed of freezing, the solute concen-tration, colloidal state and degree of polymerization (influenc-ing solution viscosity), and the type of solvent all influencethe specific surface of the dry material. Results are presentedfor polystyrene freeze dried in benzene and for corn starch inwater. Similar trends for surface area response are noted forboth systems for most parameters; however, solute concentra-tion produces differing behaviors. In general, more rapid freez-ing or increased solute concentration gives an increase in surfacearea of the polystyrene although the choice of solvent producesquantitative differences. Polystyrene freeze dried from eitherbenzene, carbon tetrachloride, or dioxane vary greatly insurface area as measured by BET analysis of the kryptonadsorption (38, 4.2, or 3.5 m.2/g., respectively). It was sug-gested that these differences were due to variable developmentof microporosity (pores of submicron size) depending onmolecular solvent:solute interactions since the overall surface,as measured in the microscope, was relatively constant forall solvents (between 1.3 and 2.2 m.2/g.). Similar behavior wasreported for polyvinyl pyrrolidone where a 3-fold increase insurface area resulted from freeze drying from acetic acid in-stead of water (13).
Attempts to control the porosity of cellulose acetate mem-branes by freeze drying from nonaqueous solutions was re-ported by Rothbaum (15). Dioxane was used to dissolvethe cellulose acetate. Following freeze drying, electron micros-copy revealed that the cellulose acetate membrane was essen-tially unidirectionally transversed by large diameter pores(~1000 A). Increased concentration of cellulose acetate re-sulted in a more random spatial crystallization of dioxane butlittle change in the dioxane crystal size (that is, pore diameter).The desired reduction of pore diameter must be achieved bychanges in the solvent crystallization steps. Rothbaum foundthat increased freezing rate will lead to glass formation andpoor freeze drying. Thus, if some intermediate freezing rateis not successful, it might be necessary to evaluate other sol-vent systems for species which crystallize as smallerunits.
Thus, the various methods of complex freeze drying offerthe possibility of fabricating dried materials with closely reg-ulated properties. A wide variety of solvents is available forselective solubilization of materials to be incorporated into avery complex matrix, for example:
4-8
lo. 132, Vol. 69
1. A reactive matrix of high internal surface to be used fordsorptive or catalytic purposes.
2. A mixed matrix of catalytically reactive species which'ill be inert during storage but can react at a high rate due tos intimate molecular mixing when the catalytic agent isapplied.
3. Texture improvement of fabricated foods by incorpora-on of compounds of limited water solubility within a water-jluble matrix.
IRVING BY CONTACTING WITH NONAQUEOUSOLVENTS
A quite different interrelationship of freeze drying and .onaqueous solvents from that already presented is dehydra-on process based on contacting of aqueous materials withonaqueous solvents. This type process has been variouslyibeled extractive freeze drying, solvent extraction, solventrying, azeotropic distillation, azeotropic drying, and azeo-•opic freeze drying. The terms extractive drying and extrac-'ve freeze drying will be used here for processes above and 'elow the freezing point.
Another nonaqueous drying technique is used by biolo-ists for the preparation of structurally unaltered samples forlectron microscopy. It is called critical point drying (16 to8).
Extractive methods have been developed for situationsrhere the aqueous sample (generally an imal or vegetableissue) is present in ei ther the nonfrozen or frozen state. Ex-ractions have been conducted with both polar and lonpoiarolvents. In the case of nonpolar solvents, the term extraction\ not t ruly correct as the water obtained from the productall not be dissolved in the nonpolar solvent. However, the:rm extractive drying wil l be used to describe dehydrationy contact wi th nonaqueous materials. Literature referencesjr these various processing conditions are: .
FLINK 67
onfrozen samplerozen sample
Polar solvent
19. 20, 24, and 2925. 27, 28, 31 to 33
Nonpolar solvent
79,27, to 2426, 30
A wide variety of solvents have been evaluated for use inrying of food products. Polar solvents are generally alco-ols, predominantly ethanol (27. 2S. 31 to 33}. Acetone'6, 20. 25) and acetates!/9. 20. 27) have also been investi-ited. The use of a more novel polar solvent, polyethyleneycol 400. h;is been reported by Thijssen (29). In this case,ie proper choice of sample composition allows unfrozenquid mater ia ls to be successfully dried by extraction withoutis.s of their in i t i a l round shape. Fur ther , flavors present inlis liquid can be retained to a high degree.Though more potent ial dif f icul t ies exist with nonpolar
ilvents, pr imari ly due to toxicological and organolepticpccts of the residual solvent, studies have been conductedling a wide variety of nonpolar solvents such as benzene (24),
Some interesting aspects of extractive drying of nonfrozenmaterial will be considered first. This process is essentially asolvent extraction, but is continued to the point where thematerial being extracted is finally obtained in the dry state.This requires that the extracting solvent be replenished withfresh make-up as the process continues. On a commercial scale,this would require the recycling of the extracting medium afterthe extracted water had been separated. Thus, one importantconsideration is the ease of separation of the solvent andwater. Processes can be designed for nonpolar solvents wherethe phase separation following condensation of vapors givesan automatic separation; as for polar solvents, a distillationstep will probably be required.
The rate of drying of shrimp was shown by Hieu andSchwartzberg (24) to be more rapid when polar solvents (eth-anol or ethyl acetate) are being used rather than benzene.When drying hardwoods, however, Galezewski and Eckelman(79) found that toluene generally gave more rapid drying thanethyl acetate when no concern was shown for sample structuralchanges. Once these considerations were reflected by changesin the drying procedure, the relative effectiveness of the twosolvents was closer. Thus, it was shown that interactive effectsof solvent and the aqueous material (such as swelling behavior)can greatly influence the allowable conditions for the extrac-tive drying. The investigation by Hieu and Schwartzberg (24)gives an extensive mathematical analysis of the transport prop-erties and processing conditions for a number of solvents usedfor the extractive drying of shrimp. Unfortunately, qualityaspects of the final product were only cursorily presented.
Bacterial spores were shown to be viable after extractivedrying with acetone or n-butylacetate to residual moisture con-tents of between 1 to 3%. Extractive drying was conductedin two manners: one as a simple extraction with acetone; theother, an extraction and azeotropic distillation under vacuumwith n-butyl acetate.
A description of a commercial-scale process for extractivedrying with ethylene dichloride as the solvent is available withsome cost figures (21). While the commercial facility has beenused for drying various animal and vegetable materials, thereis mention of methods.by which concentrated liquids mightbe dried. It is necessary to add liquids as concentrated drops.This generally would be accomplished by spraying the liquidconcentrate into the extracting solvent. Forming an emulsionof the feed liquid with cold solvent prior to spraying resultsin more uniform dry material.
Thijssen (29) has recently reported briefly on another sys-tem by which liquids might be.extractively dried. Viscositycontrol of the feed material, enables drying of droplets with-out an emulsification step. By proper control of all processingsteps, retention of model flavor compounds in the dry parti-cles was greater than 90%.
Extractive freeze drying is essential ly identical with extrac-tive drying except that the material being dried is in the frozenstate. This offers potential advantages over regular extractive
68 FOOD PRESERVATION
drying in that the frozen product will undergo water loss withlittle or no change in volume. Ordinary extractive drying willsuffer from some shrinkage effects during water removal al-though they will be less severe than in normal air drying sincethe material solvent, water, is replaced by the extraction sol-vent. This means that there is less surface tension changes inthe piece, and consequently, less tendency to try to reducethe interfacial area. As in normal freeze drying, processing con-ditions must be chosen to balance heat and mass transfers ata level where the product will remain frozen.
Slight differences in concept can be associated with the useof either nonpolar or azeotrope forming polar solvents. Withnonpolar solvents, the solvent serves primarily as a heattransfer medium. The ice sublimates due to the heat transferfrom the liquid medium. The vapor is insoluble in the solventand thus is rapidly transported to the vapor space of the ves-sel due to density and pressure differences between the watervapor bubble and the liquid solvent. A chilled condenser willremove water vapor from the vapor space, while a vacuumpump is used to remove noncondensables. The receiver flaskis designed so that solvent vapors which are condensed will bereturned to the extraction vessel. Extractive freeze dryingwith nonpolar solvents is conducted with essentially no in-teraction of the water vapor with the solvent.
Extractive freeze drying with low boiling azeotropes (28,30) is more of a true extraction procedure than when non-azeotrope nonpolar solvents are used. Azeotropes of both polar(27) and nonpolar solvents (30) have been described. Thesolvent medium supplies heat to the frozen material, causingsome ice to sublime. The water vapor produced forms an azeo-trope with the solvent which boils at a reduced temperature.
By maintaining the vessel pressure at some fixed level, aconstant boiling point is obtained for the azeotrope. Heat issupplied to the solvent at a rate such that the solvent temp-erature is incrementally above the azeotrope boiling point.In this case, all azeotrope which forms at the sample surfaceis vaporized and condensed elsewhere in the system. Agita-tion of the solvent insures that the concentration of waterat the sample surface cannot accumulate to the point whereinsufficient azeotrope is formed, resulting in water at theinterface and a reduction of interfacial mass transfer; thiswould lead to melting of ice in the frozen sample.
Extractive freeze drying has been also described for polarsolvents where the extraction solvent is present in large ex-cess and the water extracted is not removed from the ex-traction vessel simultaneous with the drying process (25).Malecki (2S) used molecular sieves to dehydrate the extrac-tion solvent. Drying of gelatin capsules at -78°C. was moreeffective using ethyl ether than absolute ethanol, though inboth cases drying at this temperature was incomplete evenafter 15 days. Tests using cryogenic liquids, such as liquidnitrogen, with desiccants proved to be too slow.
.A method of drying which was developed specifically forthe preservation of sample s tructure is critical point drying(16 to 18). Critical point drying involves bringing the solventphase in the sample material to its critical point (critical
4-9
AIChE SYMPOSIUM SERIES
temperature and critical pressure). At this point gas and liquidphase boundaries disappear-all the solvent existing as onephase without surface tension. The vessel is warmed slightlyabove the critical temperature to prevent condensation duringsample removal and the pressure is then slowly lowered bycontrolled removal of the gas.
As critical pressures are quite high for most solvents, thisprocess must be earned out in a pressure vessel. Water, forexample, has a critical pressure of 217.7 atm. and a criticaltemperature of 374°C. Thus, for aqueous based materials it isdesirable to replace the water by a material having a lower criti-cal point. Carbon dioxide (/ 7) and fluorocarbons(/<5. 18)have been used. The process itself is relatively rapid [tissuesamples processed with freon-113 take 45 min. (16)] althoughpreliminary procedures to impregnate the sample with the de-sired solvent may prove to be time consuming.
CONCLUSIONS
Nonaqueou^ materials offer many interesting relationshipsto the freeze drying process. Materials of controlled and novelproperties can be prepared using nonaqueous materials assolvents in normal freeze drying processes. Texture, catalyticeffect, adsorbent capacity, flavor, etc. can be designed intosuch materials by careful stepwise or simultaneous complexfreeze drying procedures. Systems can be prepared with mixingof components at the molecular level. Such systems can possi-bly be used for controlled chemical reaction rates.
Nonaqueous materials can also be used for freeze dryingof aqueous samples by extractive procedures. A novel dryingmethod which rivals freeze drying in the retention of samplestructure is critical point drying. Nonaqueous materials, whichoffer simpler operating conditions, will be of significance hereas well.
ACKNOWLEDGMENT
This study was supported by contract no. 9-12485 from the MannedSpacecraft Center, NASA, Houston.
LITERATURE CITED
1. Kim, Y. S., and F. R. Monforte,Bull. Am. Ceram. Soc. 50, 532(1971).
2. Schnettler, F. J., F.R. Monforte, and W. W. Rhodes, Sci. Ceramics.4.79(1968).
3. Roehrig, F. K., andT. R. Wright,/ Am. Ceram. Soc.. 55, 58 (1972). .4. Gelles S. H., and F. K. Roehrig,/ Metals (June, 1972).5. Roeluig. F. K.. an<!T. R. Wright,/ Vac. Sci. Technol. 9, 1368 (1972).6. Landsberg, A., andT. T. Campbell,/ Metals. 17, 856 (1965).7. Trambouze, Y.flui Inter. Inst. Regrig. Annex 1969-9 13 (1969).8. Rey, \...Experienfa. 21. 241 (1965).9. _., M. DOUSSRL and F. Chauffard, "Advance in Freeze-Dry-
ing." p. 89, Hermain, Paris (1966).10. Chauffard, E..Rei: ginerale du Froid, 60. 219 (1969).11. Rey, L.. U.S. Patenl 3.532,506 to Societe Technique pour Produits
Nestle S.A. (OctoSer 6, 1970).12. Lambert, D.,J.M.RSnk, and Marcus K.are\,Crvobiologv. 1045(1973)13. Blond, G.,Le Vide, 1971,232(1971).
4-10
o. 132, Vol. 69 FUNK 69
., M. Medas, R. Merle, M. Funamal, and D. Simatos, Bull.Inter. Inst. Refrig. Annex 1969-9,59 (1969).
. Rothbaum, H. P.,Nature, 214,285 (1967).i. Smith, M. E. and E. H. Finke, Invest. Ophthalmology. 11, 127
(1972).'. Anderson, T. F.. Trans. N.Y. Acad. Sci.. 13, 130(1951).I. Cohen, A. L., D. P. Marlow, and G. E. Garner,/ Microscopic 7, 331
(1968). •I. Galezewski, J. A., and C. A. Eckelmzn,Holzforschung. 25, 23
(1971).). Freeman, R. R., M. A. Auro, T. R. Dashiell, J. E. Murphy, I. Osh/ine,
and R. F. Smith, Chem. Eng. Progr.. 53, 590 (1957).1. Levin, E., and R. K. f inn, ibid.. 51,223(1955).!. Levin, E., U.S. Patent 3,607,304 (1971).
23. Tpussaint, N. F., U.S. Patent 3,628,967 to Florasynth, Inc. (1971).24. Hieu.T. G., and H. G. Schwartzberg, paper presented at meeting of
Am. Inst. Chem. Engrs., New York (1972).25. Hink, J. H., Jr., U.S. Patent 2,659,986 to Cutter Laboratories (1953).26. Porsche, J. D., and G. Josh, U.S. Patent 2,374,455 to Armour and
Co. (1945).27. Borher, B., U.S. Patent 3,298,109 to Sun Oil Co. (1967).28. Malecki, G. J., Dept. of Defense Contract AD 602,496, National Techn.
Info. Service (1964).29. Thijssen.H.A.C., Proc. of the Nordfosk Meeting, Finland, p. 5 (1972).30. Wistieich, H. E., and J. A. Blake, Science. 138, 138 (1962).31. Thompson, J. E., U.S. Patent 3,211,559 (1965).32. Holdsworth, S. D., Food Manuf.. 44, 44 (1969).33. Thijssen, H. A. C., private communication to the author.
4-11
4.3 Artificial gel systems i
Work on artificial gel systems has concentrated
on calcium alginate gels. The major effort has been in
evaluating methods by which the desirable textural
qualities can be retained. In addition, the influence
of process and composition on taste quality has been
considered.
The general method for preparation of the calcium
alginate gel consists of equilibrating a sodium alginate
solution (usually 3-5%) (contained in a plastic sample
cell having nylon membranes at both ends) in a calcium
lactate bath (usually 4.5%). The calcium ions diffuse
into the cell and crosslink the alginate molecules to
form the gel. The strength and thus textural properties
of the gel will depend on the initial concentration of
alginate and lactate solution in the sample cell and bath,
other molecular species present in the systems, and to
some extent sample cell-bath geometries.
Tests with various concentrations of sodium alginate
and calcium lactate showed that an optimum relative to
textural quality was achieved with initial solution
concentrations of 3.0% and 4.5%, respectively. Approximately
48 hours of equilibration time was required to completely
gel samples when in a cell of 30mm diameter and 50mm
height. These samples have a crispy texture after equili-
bration.
4-12
Sucrose was added to the sodium alginate solution,
both to give the product sweetness and to modify the
texture by improved water binding. Sucrose concentrations
of 0 to 25% (in the sodium alginate) were evaluated
initially. The textural behavior was not greatly altered
by sucrose concentration. It was noted that the gel
sweetness was not sufficient, even at 25% sucrose levels.
Refractometric measurements allowed a system mass balance
to be obtained. This showed that sucrose was diffusing
from the sodium alginate solution into the bath. Sucrose
loss ranged from 50-75% of that initially present depending
on (1) initial sucrose concentration (2) relative amounts
of the alginate and lactate solutions and (3) size of the
sample holder. One attempt to halt the sucrose diffusion
involved using a calcium lactate (4.5%) - sucrose (22%)
gelling bath. This was unsuccessful as no gelling occurred
after 3 days. One further attempt, somewhat more successful,
involved a higher initial sucrose concentration (50%) and
a smaller sample holder which reduced equilibration times
to 24 hours. While 60% of the sucrose w,as lost, the 20%
remaining in the gel was adequate to give a distinct
sweet taste.
Artificial sweetener (saccharine) at a level of
0.32 grams per 400 ml of alginate solution gave no better
quality than the sucrose.
4-13
Textured modification was attempted using two
polymers as additives to the basic alginate solution
Dextran-10 or a pregelatinized starch were used at
various concentration combinations.
starch/alginate dextran/alginate
1.5 3.0 0.5 3.0
1.5 4.0 1.6 .3.0
1.5 5.0 2.0 3.0
The effects of the added polymer were not signifi-
cantly beneficial to warrant further investigation.
Three fruits: apple, pear and cherry, were simulated
using the calcium alginate gels. The formulations are
listed in Table 1. While problems associated with diffusion
loss of sucrose and flavor was noted, good texture was
achieved for the fresh gels.
In addition to some preliminary organoleptic tests,
the rheological behavior of some fruits and of selected
gels was compared using a simple load cell in which a
load could be applied and the corresponding fruit (or gell)
compression measured in terms of fractional decrease in
slice thickness. Figure 1 shows the compression loading
and relaxation behavior of peach and apple slices.
4r-14
Figure 2 shows a comparison of peach and gel behavior.
In Figure 3 the compression behavior of two gels is
compared with that of peach and apple, showing a good
similarity in this particular rheological characteristic.
In general the progress in obtaining fresh gels
with fruit characteristics was good. Substantial prob-
lems, however, were encountered in the attempts to
.freeze dry the gel structure and this aspect will require
much work. Freezing and thawing caused substantial
deterioration of texture and attempts to freeze dry the
gels resulted in poorly rehydrating and very tough
matrix. Preliminary work on counteracting the effects
of freezing and drying by modification of freezing rate
and by addition of polymers was not successful. Figure 4
shows compression data for two gels each at a 2% algin
and 1% starch level, but with either 3% and 6% sucrose
both with and without a freezing treatment. The toughening
effect of the frieze-thaw cycle is evident.
Figure 5 compares the compression data for an
algin gel before dehydration with the same gel after
freeze drying and rehydration. The toughening effect
of the drying is apparent.
Work is currently in progress on new approaches
to exploring the effects of freezing and drying in order
to counteract these effects.
4-15
Table 1
Sodium Alginate Solutions for Formulations Simulating Fruits
Apple
45 ml (3% starch, 15% sucrose)
14 ml 5% malic acid
60 ml 3% sodium alginate
0.2ml/100ml apple flavor
Pear
., 36 ml (5% starch, 50% sucrose)
24 ml 2.5% malic acid
60 ml 3% sodium alginate
0.2ml/100ml pear flavor
Cherry 1
100 ml 20% sucrose, 3% sodium alginate
l.Oml/lOOml cherry flavor
Cherry 2
100 ml 50% sucrose, 3% sodium alginate
1.5ml/100ml cherry flavor
4-16
Section 4
Figure 1
Figure 2
Figure 3
Figure 4
Figure 5
List of Figures^
Compression-relaxation curves for fresh
peach and apple slices
/
Compression-relaxation curves for fresh
peach and calcium alginate gel systems
(gel 1 - 2 % algin, 3% sucrose; gel 2 -
2% algin, 2% starch)
Compression curves of fresh apple, peach
and gel slices (gel 1 - 2 % algin, 3% sucrose;
gel 2 - 2 % algin, 2% starch)
Compression curves for fresh and frozen
and thawed gels containing 2% algin, 1% starch
and added sucrose
3%
6%
3% F.T.
6% F.T.
3% sucrose
6% sucrose
3% sucrose
6% sucrose
fresh
fresh
frozen and thawed
frozen and thawed
Compression of slices of fresh and rehydrated
freeze dried algin gels
4-17Figure 1
o»
( °X/XV) NOISS3ddf\IOD
Figure 24-1!
O 0
( °X/XV)
• < D O
oOo
oo00
oo
£o>
4.19.
OO
Q<O
0)f-(300
O ^x*--O Q0) O. 0) 0>Q. <O O
• o < n
D -OoCM
GO•
O(D
•
O*: CN6 o
NOISS3ddlMOO
4-20
rx/xv)
4-21
(°X / XV) NOISS3ddlAIOD
5-1
5. Volatile retention during freeze drying
5.1 Introduction
Work conducted prior to this; contract primarily
with low molecular weight carbohydrates showed that
flavor retention during freeze drying could be explained
on the basis of the microregion theory of Flink and Karel,
and that this theory could serve as a basis for optimiza-
tion of process parameters. The Annual Report for Phase I
presented results of studies on the behavior of the non-
carbohydrate polymeric material polyvinylpyrrolidone (PVP),
and also introduced our use of a radiochemical technique
for studies of volatile retention. This technique has
been used subsequently to evaluate the retention behavior
of a number of polymeric materials present in foods and
of potential significance in formation of food matrices.
This work has been presented in a series of research
papers which have been published (section 5.3), accepted
for publication (sections 5.4, 5.6) or submitted for
publication (section 5.5). In addition current results
which have not yet been written for publication are presented
as section 5.2 These reports are assembled to form
section 5 of the Phase 2 Annual Report.
5-2
5.2 The influence on volatile retention of dextrose
equivalent (D.E.) for a series of dextrins
Dextrins are formed by partial hydrolysis of starch.
The degree of starch breakdown, which depends on a number
of process parameters, results in a distribution of mole-
cular units ranging in molecular weight from the mono-
saccharide, dextrose, to the higher polysaccharides.
While it is possible to determine the complete molecular
weight distribution for any dextrin sample, it is more!
usual for dextrins to be classified according to the
percentage distribution of the lower oligosaccharides.
The most widely utilized method of classification, however,
is the so-called dextrose equivalent (D.E.) which is a
measure of the number of reducing groups per unit weight
of sample. Dextrose, which has one reducing group per
glucose unit , is defined to have a D.E. of 100. Maltose,
with one reducing group for each two glucose residues
(i.e. one reducing group ,for each maltose molecule) has
a D.E. value of 50. As the dextrin molecular weight
distribution moves toward larger molecular units, the
D.E. values decrease with a lower limit generally being
about 2-4. Depending on the D.E. values, these products
are generally referred to as maltodextrins or dextrins.
Maltodextrin materials have often been included
in studies on flavor retention during freeze drying, but
5-3
there has been no effort to investigate the influence of
molecular weight distribution of maltodextrins on the
volatile retention. Since maltodextrins are utilized in
a number of formulated foods, and may be incorporated into
freeze dried food matricies, we conducted an investigation
of the influence of dextrose equivalent on volatile reten-
tions.
14C-labelled volatiles (acetone and ethyl acetate)
were used to evaluate the retention in several commercial
dextrin preparations. The characteristics of the dextrins
are listed below (Maltrin was obtained from Grain Process-
ing Corporation, and Stardri from A.E. Staley).
Percentage of the material in fractionswith different number of glucose units
Material
Maltrin 100
Maltrin 150
Maltrin 200
Maltrin 250
Stardri 24F
Stardri 35F
Stardri 42F
Maltose
The volatile retention was evaluated using solutions
containing 1% of volatile and either 10, 20 or 30% of the
dextrin preparations. Two (2) ml samples were frozen at
D . E . value
9-12
13-17
18-22
23-27
24-28
33-36
42-45
50
1 unit
0.5
1.0
1.0
2.5
5
14
20
0
2 units
3.5
3.5
6.0
5.0
14
12
14
100
3 units
6.5
7.5
. 8.0
8.5
14
11
12
0
4 or more units
89.5
88.0
85.0
84.0
67
63
54
0
5-4
-40°C in scintillation vials, freeze dried and rehydrated
with 2 ml of water. Scintillation liquid (PPO, napthalene,
dioxane) was added and normal counting procedures used.
The results, in the form of two graphs, presents
the retentions of acetone (Figure 1) and ethyl acetate
(Figure 2) for the three concentrations as a function of
dextrose equivalent. An increase of the dextrose equiva-
lent is indicative of a change of the polysaccharide compo-
sition to units of lower molecular weight. It can be
seen that for both volatiles, as the solids concentration
increases, the influence of dextrose equivalent is reduced.
Also, as is expected, it can generally be stated that a
higher solids concentration results in higher retentions,
though at high D.E. with acetone, a slight reversal is
observed. An example of the complex interactions of
solids and volatile can be seen by the fact that retention
shows a slight decline with increasing D.E. for ethyl
acetate, while a sizable rise is observed for acetone
over the range DE 10 to 25, followed by a leveling off.
It cannot be certain but the leveling of the acetone
curves above 25D.E. may be related to the change from
Maltrin samples to the Stardri samples, where there is a
large increase in the saccharides of 1 to 3 glucose units.
In Figure 2, two different polysaccharide distributions
at a DE value of 24 (Maltrin 250 and Stardri 24F) were
5-5
evaluated. It can be seen that the sample which had the
higher percentage of low MW species (Stardri 24F) had a
sizably higher retention.
These studies have shown that a variety of dextrin
materials show the same general volatile retention behavior
as observed for a number of simpler carbohydrate systems.
At the higher solids concentration investigated (30%) the
level of retention was above 60% for all D.E. values\t
investigated. While differing shapes of the retention-
D.E. curves were observed for acetone and ethyl acetate,
at a 30% solids concentration these variations in retention
are not very large when compared to the overall level
of retention.
5-5a
Section 5 List of Figures
Figure 1 Retention of Acetone by dextrins with varying
dextrose equivalent values.
Figure 2 Retention of ethyl acetate by dextrins of
varying dextrose equivalent values (starred
points are for Stardri 24F, a 24DE maltodextrin
with high percentage of low MW oligosaccharides)
5-5b
Figure 1
80
70
UJHLUa:UJzoUJo
60
50
40
A 10%U o 20%
• 30%
10 20 30 40DEXTROSE EQUIVALENTS
50
, 5-5c
Figure 2
80
60
UJI-UJcruj
LJO
40
20
10 20 30 40DEXTROSE EQUIVALENTS
50
5-6
5.3 Volatile retention during freeze drying of aqueous
suspensions of cellulose and starch
Reprint from J. Agr. Fd. Chem. 21(6):936-939(1973)
5-7
Reprinted from AGRICULTURAL AND FOOD CHEMISTRY, Vol. 21, No. 6, Page 936, Nov./Dec. 1973Copyright 1973 by the American Chemical Society and reprinted by permission of the copyright owner.
r
Volatile Retention during Freeze Drying of Aqueous Suspensions ofCellulose and Starch
Jorge Chirife1 and Marcus Karel*
This paper studies the retention of 14C-labeled2-propanol in freeze-dried starch or cellulose sus-pensions. Among the variables affecting the re-tention level are concentration of solids and ini-tial concentration of the alcohol in the suspen-sion. The observed retentions can be explainedby inclusion within the polymer chains, the pre-
dominant mechanism of retention, and adsorp-tion. Cellulose gave a much lower retention thanstarch, probably because the low mobility of thechains in the highly crystalline, cellulose reducesthe capacity for retention of the alcohol throughinclusion. ~;
In the past few years, significant progress has beenmade~irT studies on the mechanism of volatile retention infreeze-dried foods. Most of these studies have been basedon model systems, mainly carbohydrate solutions (Flinkand Karel, 1970a,b; King, 1970; Rulkens and Thijssen,1972; Thijssen and Rulkens, 1968) and water-soluble poly-mers (Chirife and Karel, 1973b; Chirife et al., 1973). It is tobe expected that studies on model systems, based on indi-vidual food components, could eventually lead to a betterunderstanding of volatile retention in more complex food'systems.
In this study we present results which characterize theretention of 2-propanol in model systems based on cellu-lose and starch, polysaccharides widely found in fruits andvegetables. The observed retentions are analyzed in terms
Department of Nutrition and Food Science, Massachu-setts Institute of Technology, Cambridge, Massachusetts02139.
1 Present address: Departamento de Industries, Facul-tad de Ciencias Exactas y Naturales, Buenos Aires, Ar-gentina.
936 J. Agr. Food Chem., Vol. 21, No. 6, 1973 .
of possible interactions between the polymeric substrateswith volatile.
EXPERIMENTAL SECTION
Model Systems Preparation. The model systems con-sisted of either cellulose powder (Whatman CC 41, meanparticle size passing 200 B.S.S.).or starch (Merck, SolubleStarch), 14C-labeled 2-propanol, and water. They wereprepared by suspending the desired amount of cellulose orstarch in water and adding 2-propanol; 0.1% (w/w) ofcarboxymethylcellulose (CMC) was added to facilitate thehandling of the suspensions.
Five-milliliter aliquots of the suspensions were pipettedinto 50-ml Erlenmeyer flasks and frozen immediately inliquid nitrogen to maintain the solids in the suspendedstate. The resultant sample thickness was about 4 mm.The samples were then freeze-dried for 48 hr at ambienttemperature and at a chamber pressure of less than 100Mm in a Virtis freeze drier (model 10-MRTR).
Reagent grade 2-propanol was mixed with 14C-labeled2-propanol to give the desired specific radioactivity. The
CELLULOSE AND STARCH
radioactive propanol was obtained from InternationalChemical and Nuclear Corporation, Irving, Calif.
Humidification Experiments. In several experiments,freeze-dried samples were humidified by placing taredand weighed flasks in vacuum desiccators containing satu-rated salt solutions, which maintained the desired con-stant relative humidities.
2-Propanol Analysis. The 2-propanol content was de-termined by measuring the radioactivity of the sampleswith a liquid scintillation counter.
Reproducible measurements with a constant countingefficiency were obtained by dispersing the dried samplesof cellulose or starch in water (to 10% w/w) and adding 1ml of this suspension to 10 ml of the scintillator solution[2,5-diphenyloxazole (1 g), naphthalene (100 g), dioxaneto 1000-ml volume]. The resulting dispersion was countedwith a liquid scintillator counter (Beckman LSD series).
RESULTSFigure 1 shows the effect of initial solids concentration
on 2-propanol retention by freeze-dried cellulose andstarch suspensions. In both cases the alcohol retention in-creases linearly with solids content in the range examined.For these experiments the initial concentration of 2-pro-panol was fixed at 0.1% (w/w) for the cellulose systemand 0.05% (w/w) for the starch-based model.
For both cellulose and starch, when solids content iskept constant, relative retention increases as initial alco-hol concentration decreases. The use of 14C-labeled 2-pro-panol of relatively high specific radioactivity allowed for awide range of concentration from 2-3 ppm to 5000 ppm forthe starch system.
Results obtained during freeze drying of 20% (w/w) sus-pensions are shown in Figure 2. The curve which charac-terizes the behavior of starch suspensions is particularlyinteresting because the low volatile concentrations inves-tigated are similar to those encountered in natural foodsystems. The 2-propanol retention in freeze-dried cellulosesuspensions appears to level off at 7.3% retention as theinitial volatile concentration is decreased.
Table I summarizes the alcohol retention (1-propanol or2-propanol) observed during freeze drying of several modelsystems (carbohydrates and polymers). All the. experi-ments were performed in very similar processing condi-tions (plate temperature, drying time, chamber pressure,frozen layer thickness) and system composition (solidsconcentration, volatile content), so the observed reten-tions give a direct indication of the particular ability ofeach solid substrate to retain the volatile. For high initialalcohol concentrations (0.5 to 1.0% w/w), the low molecu-lar weight carbohydrates are much more effective than thepolymeric systems (PVP, Dextran, Starch, Cellulose).However, at low volatile concentrations, the polymers arealso able to produce significant alcohol retentions. The ex-ception is cellulose, which even at low initial volatile con-centration gives low retention values.
Readsorption of 2-propanol in the dry layer of celluloseduring freeze drying was investigated in the following ex-periment. Samples were prepared by freezing alternatelayers of a cellulose suspension containing no volatile andlayers of a solution containing the volatile. Each layer wascompletely frozen before the next layer was added. Thecomposition of the systems for these experiments wasfixed: cellulose 20% (w/w) and 2-propanol 0.5% (w/w).During freezing and drying, the layers were separated bythin brass mesh to avoid any "contamination" betweenthem. After the standard cycle of freeze drying (48 hr),the layers were separated for individual analysis. Excel-lent agreement was .found among all the samples. It wasobserved that the amount of 2-propanol adsorbed in thelayers originally containing no volatile was 31.5% of theretention found in the layers originally containing the vol-
40
30
20
10
UJcr
/iTARCH
CELLULOSE
I I I I I I I I I I I I I I I I I I I I I I I ! I I I I I I
5 10 15 20 25 30INITIAL CONTENT OF SOLIDS, (%).
Figure 1. Effects of initial solids content on retention of 2-propa-nol in freeze-dried aqueous suspensions containing starch orcellulose. Initial 2-propanol content: 0.05% (w/w) in starch sus-pensions, and 0.1% (w/w) in cellulose suspension.
50 100 500 1000 5000 10000
INITIAL . CONCENTRATION OF 2'PROPANOL, ppm.
Figure 2. Effects of initial concentration of 2-propanol on reten-tion in freeze-dried suspensions containing 20% of starch or ofcellulose.
atile, the absolute amount being between 0.0244-0.0269 gof 2-propanol/100 g of cellulose.
In another experiment, we studied alcohol release dueto adsorption of water. Twenty percent suspensions ofstarch containing 0.05% (w/w) were freeze dried understandard conditions. These conditions resulted in the re-tention of 0.0775 g of 2-propanol/100 g of starch. Thefreeze-dried systems were then equilibrated to differentrelative humidities and the loss of alcohol was deter-mined. Figure 3 shows the 2-propanol retention in freeze-dried starch humidified to 11, 52, and 75% relative hu-midity.
DISCUSSIONTwo types of interactions between the solid substrates
and the volatile will be discussed in connection with themechanism of 2-propanol retention during freeze drying ofcellulose and starch suspensions; they are inclusion andadsorption in the dry layer. The first one refers to an en-trapment of the volatile between the polymeric units ofcellulose and starch, and the second to the binding of thealcohol to specific sites of these polymers. Russell et al.(1937) studied the sorption isotherm of alcohols in cellu-lose. They.found that after sorption of alcohol, evacuationat room temperature did not completely remove the alco-hol. They postulated that as a result of the process of re-moval of alcohol, cellulose- chains interact, forming inter-nally stressed structures that hold the residual "solvent."
• J. Agr. Food Criem,, Vol. 21, No^ 6,1973 937
CHIRIFE, KAREL
Table I. Alcohol Retention during Freeze Drying of Carbohydrate and Polymer Solutions
Chirife and Karel (1973b)Flink and Karel (1970a)Flink and Gejl-Hansen(1972)Flink and Karel (1970a)Flink and Karel (1970a)Present workChirife eiol. (1973)Chirifeefo/.(1973) ]Flink and Karel (1970a)Flink and Karel (1970a)Present work
97 Flink and Labuza (1972)88 Flink and Labuza (1972)58 Chirife e» a/. (1973)
Present workPresent work
. 100
i. 90
O 80
1Oa: 60a.<!g 50
fe 40
z 30
2 30
. II % RH6
52 % RH "
75 % RH
I J L l'--«lJ _L10 15 40 45 5020 25 30 35
T I M E , hours.
Figure 3. Retention of 2-propanol during exposure of freeze-dried starch suspensions to specified levels of relative humidityat 25°.
Staudinger et al. (1953) also showed that nonpolar liq-uids which do not react with cellulose cannot be completely
• removed by drying in vacuum. They also postulated aninclusion of the organic liquids produced when hydroxylgroups of the cellulose chains hydrogen-bond together.
We have demonstrated in previous studies that most ofthe retention of volatiles in water-soluble polymers, inparticular dextran and polyvinylpyrrolidone, is due pri-marily to entrapment in microregions similar in their re-tention properties to those formed by low molecularweight carbohydrates (Chirife et al., 1973; Flink andKarel, 1970a). However, in polyvinylpyrrolidone, adsorp-tion also plays a role and, in fact, a small but significantreadsorption of propanol occurs in dry layers formed dur-ing freeze-drying (Chirife and Karel, 1973). The "layeredsystem" experiments reported in this paper show thatreadsorption of 2-propanol in the dry layer can contributeto retention in freeze-dried cellulose suspensions.
Sorption of alcohols in dry cellulose has been measuredby several workers, including Lauer and Ayer (1957), Co-lombo and Immergut (1970), and Le Maguer (1972).Through measurements of heats of sorption, Colombo andImmergut (1970) found that the interaction cellulose-methanol involves hydrogen-bond formation which ex-tended over a wide range of vapor coverage. However,sorption isotherms measured at high volatile partial pres-sures may not be valid at the low levels expected in freezedrying of model systems. A small amount of very activesites may be available for strong adsorption of smallquantities of the volatile, leading to retention. Sorption of
938 J. Agr. Food Chem., Vol. 2.1, No. 6, 1973
volatile compounds in starch was studied by a number, ofauthors; Maier and Bauer (1972) suggest that most aromacompounds may be bound by hydrogen bonds or inclusion.Starch has the capacity to complex many ligand moleculessuch as aliphatic alcohols, fatty acids, and aliphatic hydro-carbons (Bear, 1944; Kuge and Takeo, 1967; Osman-Ismailand Solms, 1972; Takashi and Takeo, 1968). It was con-.sidered that complexing occurs mainly within the helicalregions of the amylose fraction. Several possibilities weretaken into account for the forces that stabilize the inclusioncomplex, namely hydrophobic bonding, hydrogen bonding,dipolar interactions, etc. (Kuge and Takeo, 1967). Basedon this property of amylose, Solms et al. (1973) suggest thatthe formation of starch-inclusion complexes is an importantmechanism of volatile retention during food processing.However, some characteristics which regulate the formationof such complexes strongly indicate that this is not the casefor the 2-propanol retention during freeze drying of starchsuspensions. To begin with, a certain minimum concentra-tion of ligand was necessary to initiate the formation of in-soluble complexes (Solms et al., 1973). Also, reaction mix-tures did not give inclusion compounds under constanttemperature conditions but only if a temperature gradientwas applied ranging from 90° to room temperature (Solmset al., 1973). This suggests that the reaction requires somesort of activation. Furthermore, the humidification exper-iments shown by Figure 3 are another indication that noirreversible complex was formed, resulting in 2-propanolretention. Humidification to 75% RH produces almosttotal loss of retained 2-propanol. This effect can be attrib-uted to the swelling effect of water molecules which per-mits the loss of the entrapped alcohol.
We may conclude that inclusion of the volatile betweenthe polymer chains and readsorption in the dry layer arethe main mechanism of retention. The low levels of reten-tion observed with cellulose can be explained on the basisof the low mobility of the cellulose chains, as comparedwith starch or other polymeric materials.
ACKNOWLEDGMENTThe authors acknowledge the support of Universidad de
Buenos Aires and Facultad de Ciencias Exactas y Natu-rales in the form.of a travel grant to Dr. Chirife. Thisstudy was also supported in part by Contract No. 9-12485from the Manned Spacecraft Center, NASA, Houston,Texas.
3-iUADDITIVES IN HEATED MILK
LITERATURE CITEDBear, R. S., J. Amer. Chem. Soc. 64.1338 (1944).Chirife, J., Karel, M., Flink, J., J. Food Sci. 38,671 (1973).Chirife, J., Karel, M., J. Food Sci. in press (1973a).Chirife, J., Karel, M., J. Food Technol. submitted for publication
(1973b).Colombo, E. A., Immergut, E. H., J. Polym. Sci. Part C No. 31,
137(1970).Flink, J. M., Karel, M., J. Agr. Food Chem. 18,295 (1970a).Flink, J. M., Karel, M., J. Food Sci. 35,444 (1970b).Flink, J. M., Labuza, T. P., J. Food Sci. 37, 617 (1972).Flink, J. M., Gejl-Hansen, F., J. Agr. Food Chem. 20.691 (1972).King, J., Crit. Rev. Food Technol. 1,379 (1970).Kuge, T., Takeo, K., Agr. Biol. Chem. 31,257 (1967).Lauer, K., Ayer, J. E., J. Polym. Sci. 26,67 (1957).Le Maguer, M., "Proceedings of the International Symposium on
Heat and Mass TWrisfer Problems in Food Engineering," Vol.1, Wageningen, Netherlands, Oct 24-27,1972, p Cl-1.
Maier, H. G., Bauer, A., Die Starke 24,101 (1972).Osman-Ismail, F., Solms, J., Die Starke 24, 213 (1972).Rulkens, W. H., Thijssen, H. A. C., J. Food Technol. 7,79 (1972).Russell, J. K., Maass, O., Campbell, W. B., Con. J. Res. 15, 13
(1937).Solms, J., Osman-Ismail, F., Beyeler, M., Con. Inst. Food Sci.
Technol. J. 6, A10 (1973).Staudinger, H., Inder Birken, K. H., Staudinger, M., Makromol.
Chem. 9,148(1953). .Takashi, K., Takeo, K., Agr. Biol. Chem. 32,753 0.968).Thijssen, H. A. C., Rulkens, W. H., Ingenieur (The Hague) 80, 45
(1968).
Received for review June 11, 1973. Accepted August 29,1973.
5-11
5.4 Volatile retention during freeze drying of protein
solutions i
Accepted for publication in Cryobiology
5-12
Volatile Retention During Freeze Drying of Protein Solutions
by J. Chirife* and M. Karel
Massachusetts Institute of Technology
Cambridge, Massachusetts 02139
Running head: Volatile retention in dried proteins
*Present address: Departamento de Industrias, Facultad de Ciencias
Exactas y Naturales, Buenos Aires, Argentina
5-13
INTRODUCTION
Retention of organic volatiles in freeze-dried
systems is determim:d by properties of non-volatile
solutes which often form an amorphous matrix of the
freeze-dried solid. Retention presumably results from
an entrapment mechanism which immobilizes the volatile
compounds within that amorphous solute matrix (7, 13,
33, 36). At present two approaches appear to give
mechanistic despriptions for observed volatile retention
phenomena. These are "selective diffusion" (19, 20, 29,
34, 36) and "microregions entrapment" theories (13, 15).
While these are based on different approaches, they may
represent macro and micro views of the same basic
phenomenon (8).
Most of the research on volatile retention has been
concerned with interactions between carbohydrates and
various volatiles. Recently, Chirife et al. (8). were
able to extend the applicability of the microregions
theory to a system other than carbohydrates. Model systems
of a water soluble polymer, polyvinylpyrrolidone (PVP)
virtually duplicate the behavior of carbohydrates with
the exception that a small fraction of volatile may be
retained by adsorption phenomena (9), In that work,
PVP was chosen as a model system because it is a water-
soluble polymer containing a polar group different from
5-14
those of polysaccharides but also present in proteins.
PVP does not, however, manifest the complexity of
interactions that occurs in proteins.
We are now presenting results which describe
retention of 2-propanol in a model system based on a
water soluble protein, bovine serum albumin (BSA). Some
experiments were also performed in a model system based
on the enzyme, pepsin.
EXPERIMENTAL
Model system preparation
The model systems consisted of either bovine serum
albumin (BSA) or pepsine, ll*C labeled 2-propanol and
water. The model systems were prepared by dissolving
the desired amount of protein in distilled water and
adding 2-propanol. In preparing the pepsin model
system, the pH was increased to 8.5-9.0 using NaOH..
Five ml aliquots of the solution were pipetted into
50 ml Erlenmeyer flasks which were frozen as specified
below and then freeze dried for 48 hr in a Virtis
freeze drier (model 10-MRTR). The drying took place
at room temperature and low chamber pressures (< 100 ym).
Temperatures were not measured during freeze drying.
No partial melting or collapse was observed in any of
the samples during freeze drying. The conditions of
freeze drying were identical to those that we previously
5-15
found gave high volatile retentions in low molecular
weight carbohydrate-volatile systems.
The sample thickness was varied in some experiments
as noted under RESULTS & DISCUSSION. In most experiments
the composition of the systems was fixed as (initial
concentration expressed in weight percent): protein 20%,•
2-propanol 0.05%, water 79.95%. In several experiments
the effect of changing concentrations was studied; the
changed compositions are noted under RESULTS & DISCUSSION.
Samples wenb frozen by one of two methods: fast
freezing was accomplished by immersion of flasks in
liquid nitrogen; slow freezing refers to placing the
stoppered flasks in still air at -40°C.
Some freeze-dried samples of BSA containing no
2-propanol were analyzed gravimetrically for residual
moisture content by drying in a vacuum oven at 87°C
for 32 hr. The moisture content was found to be < 0.4%.
BSA
Bovine serum albumin, Cohn Fraction V, powder of purity
95% was obtained from Nutritional Biochemical Corporation.
Pep siri
Pepsin, N.F. powder was obtained from Fisher Scientific
Co. The proteins were not further purified.
2-Propanol
Reagent grade 2-propanol was mixed with ^C labeled
5-16
2-propanol to give the desired specific radioactivity.
The radioactive propanol was obtained from International
Chemical and Nuclear Corporation in Irving, California.
2-Propanol analysis
The 2-propanol content was determined by measuring
the radioactivity of the samples with a liquid scintilla- -
tion counter. Reproducible measurements with a constant
counting efficiency were obtained by dissolving the dried
samples in water (to 10% w/w) and adding 1 ml of this
solution to 13 ml of the scintillator solution (2f
5-diphenyloxazole 1 g, naphtalene 100 g, dioxane to 1000
ml volume). The resulting mixture was counted with a
liquid scintillation counter(Beckman LSD Series). The
results were corrected for background counting, although
this correction was significant only at the lowest volatile
concentrations. It was demonstrated that the sedimentation
of insoluble protein did not affect the reproducibility of
the measurements.
RESULTS & DISCUSSION
Effects of pre-treatments and processing conditions onfreeze-drying. • .
As discussed previously (8, 15), we conceive the
retention of volatiles in freeze-dried solutions to be
caused by the formation of microregions during freezing.
During dehydration the microregions are stabilized by
5-17
formation of a matrix which becomes completely impermeable
to organic volatile:; but not to water when the local
moisture content drops to a critical level. The matrix
is stabilized by noncovalent bonds between suitable
polar groups of the solute units and the critical moisture
content tends to occur at the B.E.T. monolayer value•
(8, 15) .
Process conditions affect the formation of micro-regions
and/ consequently the extent of retention. Freezing rate
is of considerable importance as it influences volatile
incorporation in the solute matrix (13); slow rates promote
volatile retention in microregions.
Table 1 presents a comparison betweeft retention of
propanol in freeze-dried BSA and pepsin systems and
retentions previously observed in freeze-dried PVP and
maltose. In all systems slow freezing resulted in
higher retention than rapid freezing; this effect was
particularly notable with the high molecular weight
(#70,000) BSA. These findings are compatible with the
microregion theory: slow freezing, which allows diffusion
of solute from the freezing front, results in fewer,
larger, more concentrated micrpregionsf which are less
.permeable than those created by rapid freezing (14).
Figure 1 shows the effect of initial alcohol
concentration on retention of 2-propanol by BSA (rapidly
5-18
frozen) and pepsin (slowly frozen). The relative retention
by BSA can be seen to decrease with increasing alcohol
concentration. Similar results were found by Chirife
et al. (8) in the PVP-n-propanol system and are also
consistent with the microregions theory (14). It is
expected that as the volatile concentration decreases the•
volatile loss would approach a minimum, which would depend
on volatile amount transiently entrapped within ice,
(and therefore outside the non-volatile solute matrix)
and other factors. Relative volatile retention will
therefore approach a maximum. In the case of BSA-propanol
system this maximum has not yet been reached down to an
initial concentration of 50 ppm, at which concentration
propanol retention was only about 20%, With pepsin,
however, retention is high (over 80%) at all initial
concentrations studied (up to 1000 ppm). Apparently
maximum retention here is attained already at relatively
high initial concentrations of propanol.
The microregions theory predicts that increasing
the solid concentration increases volatile retention
up to a limiting concentration which depends on the
type of solid and type and amount of volatile. Figure 2
shows the results obtained with the BSA-2~propanol
system (slowly frozen). The shape of the curve is in
good agreement with those obtained by other workers in
5-19
several model systems (8).
Thickness of sample is also a factor in retention.
Figure 3 presents the retention of 2-propanol (initial
concentration 0.05%) in BSA (slowly and rapidly frozen)
and pepsin (rapidly frozen). The retention decreases
with increasing thickness primarily because the more•
rapid drying cind steep moisture gradients in thin
samples decrease the period during which the moisture
content is high enough to permit volatile escape (14).
We also investigated the possibility th.at changes
in the proteins induced by heat or by pH changes could
influence the 2-propanol retention during freeze drying.
Samples of BSA and pepsin were subjected to pH changes
and/or heat treatment prior to addition of the volatile.
The samples were then freeze dried under standard
conditions and the observed volatile retentions were
compared with control samples. Results are shown in
Table 2.
BSA was partially denatured by shaking a 20%
solution in a bath at 65.5°C during 120 min (33).
An increase in viscosity after heating was easily observable
indicating unfolding of the molecule. Table 2 shows that
heat denatured BSA is as effective in 2-propanol retention
during freeze drying as the native protein. This result
indicates that preservation of native structure of the
5-20
native protein is not necessary for entrapment of the
volatile. Table 2 also shows that an increase to pH 10
has only a minor influence in the observed retention, in
spite of the known conformational changes occurring in
BSA at this pH (6, 27).
Pepsin shows a similar behavior; samples heated at•
82°C did not show any difference in 2-propanol retention
as compared with the unheated samples. However, this
experiment is not as conclusive as the one with BSA
because it is known that at pH 7 or higher, pepsin is
already "alkali denc.tured" (4) .
A combination of heat and low pH was able to
produce a small reduction in volatile retention. However,
it is likely that this effect was due to a change in the
substrate composition, because some hydrolysis of peptide
bonds occurs in these conditions due to autolysis (4).
The physical appearance of the freeze-dried cake also
confirmed that a change in composition of the system occurred,
The possibility of binding of 2-propanol on specific
sites of BSA was also considered. BSA binds a great
variety of small uncharged molecules (12, 28, 32}. Very
little information is available, however, about
identification of binding sites. In the presence of any
specific molecule, a particular configuration of BSA
is stabilized which permits the various portions of the
5-21
small molecule to interact with the appropriate groups
in the protein (30).
Also, the folded structure of globular proteins
is partially stabilized by hydrophobic interactions,
and these interactions are important in binding (28).
However, we believe that the role of hydrophobic•
interactions, if any, is not significant in retention
of propanol during freeze drying. In discussing the
interaction of volatiles with food components, Solms
et al. (31) have suggested that hydrophobic interactions
between proteins and ligands are of importance in the
mechanism of flavor retention during food processing.
They based this suggestion in experimental results obtained
by Arai et al. (2) who found that some n-hexanal and
n-hexanol were retained by soy protein after vacuum
distillation at 30°C, and the amount of bound ligand
increased with heat denaturation of the soy protein.
According to Solms et al. (31) proteins retain volatiles
interacting with them by unfolding and destruction of
tertiary structures with the binding mechanism being a
hydrophobic one. Binding, in this view, depends partially
on the capacity of the ligand to cause unfolding of the
protein. Heat denaturation increases the amount of
binding through the unfolding of the molecule.
We believe that the role of hydrophobic interactions
5-22
as a mechanism of volatile retention by protein systems
have been over-emphasized by Solms et al. (31); the
amount of n-hexanol in soy protein after vacuum
distillation of 9.1% (w/w) soy protein solution represents
only a retention of 0.13% for an initial volatile
concentration of 1000 ppm, whereas in our study retention•
was in the range of 10 to 90%. In addition, an
examination of the experimental procedure of Arai et al.
(2) concludes that heat denaturation of the protein was
not responsible for the observed increase in volatile
retention. Arai et al. (2) mixed the protein solution
with the volatile and then heated the mixture to produce
the denaturation at a temperature of 90°C during 1 hr.
Heating in presence of the organic compounds may have
resulted in chemical reactions between the protein and
the volatiles.
Release of entrapped volatile by humidifi,cation
BSA solutions (20% solids, 0.05% 2-propanol) were
freeze dried under standard conditions (slowly frozen,
freeze dried at room temperature). These conditions
resulted in the retention of 0.16 g 2-propanol/ 100 g
BSA. The freeze-dried systems were then exposed to
different relative humidities and water uptake and volatile
loss were measured as a function of time. From results
5-23
in Figure 4 it can be seen that humidification leads
to loss of propanol until a new level of retention is
reached, which is again stable unless the humidity is
increased further.
These results are of striking similarity with those
observed by Flink and Karel (15) during humidification
of freeze-dried carbohydrate-volatile systems. They
found that at low relative humidities (in equilibrium
with moisture contents below the B.E.T. monolayer value)
there was no volatile loss; at higher humidities a rapid
volatile loss occurred until a new level of volatile
content was reached.
The adsorption of water by BSA was studied by
several authors. Using the B.E.T. equation and the
vapor pressure data of Bull (5) on horse serum albumin,
Pauling (25) estimated that the first layer of sorbed
.water contained 6.7 g water/100 g BSA. Amberg (1) and
Eley and Leslie (11) reported values of 6.2 g water/ .
100 g BSA for the B.E.T. monolayer.
Fuller and Brey (17) determined the nuclear magnetic
resonance line widths of water sorbed on solid BSA. Their
results indicated that the sorbed water exists in different
states, and some 6.5 to 8.5 g water/100 g BSA was strongly
bonded to the protein. Figure 4 shows that there is little
volatile loss during humidification to 20% and 32% RH?
the water adsorbed in these conditions being respectively,
5-24
5.5 and 8.5 g water/100 g BSA. This appears to indicate
that water corresponding to that "strongly bonded" by
BSA does not significantly disrupt the microregions
entrapping the volatile. However, at 52% and 75% RH
the adsorbed water is well above that range and results
in significant volatile release due to microregion
disruption. These results can be considered surprisingly
consistent with those obtained with carbohydrates,
•/ considering the diversity of polar groups and complexity
of interactions that can occur in a protein as compared
to carbohydrates.
Role of adsorption
Adsorption has to be also considered in explaining
the 2-propanol retention by BSA. Proteins are able to
adsorb polar vapors in the "dry" state, in contrast to
carbohydrate-volatile systems (13, 21). The sorption
of aliphatic alcohols in BSA and related proteins has
been measured by a number of authors. Among them, Benson
and Richardson (3) measured the sorption isotherm of
ethanol, methanol and butanol vapors on egg albumin
and of ethanol on BSA. Eley and Leslie (11) studied
the sorption of methanol on BSA; Fogiel and Heller (16)
reported on the sorption of ethanol by egg albumin, and
Puri and Malik (26) on the sorption of methanol and
ethanol vapors on casein. Most of these studies have
5-25
been concerned with the B.E.T. analysis of the measured
isotherms. However, this kind of analysis is of little
utility from the point of view of the adsorbate which
is irreversibly adsorbed (under the experimental
conditions) and does not take part in the equilibrium»
, i
relations of the B.E.T. theory. Unfortunately, it is
not always possible to decide whether chemisorption is
involved in addition to non-covalent forces.
Some indication of the ability of the non-volatile
solids comprising the freeze-dried matrix to interact
strongly with the volatile is given by "layering"
experiments such as those reported by Flink and Karel
(13) , and Chirife and Karel (9). The same experiments
were done on the system BSA-2-propanol. Samples were
prepared by rapidly freezing alternate layers of a
solution containing the volatile and layers of a
solution containing no volatile. Each layer was
completely frozen before the next layer was added. The
initial 2-propanol content was fixed for this experiment
at 1% (w/w) for purposes of comparison with, the
experiments reported on the PVP-n-propanol system (9).
After the standard cycle of freeze drying (48 hr), the
layers were separated for individual analysis. The
absolute amount of 2-propanol adsorbed in the dry
layers was about 0.051 g 2-propanol/lOO g BSA. This
5-26
value is equal to those reported by Chirife and Karel
(9) for PVP-n-propanol, and Flink and Karel (13) for
maltose-2-propanol, and shows that a small amount of
very active sites may be available for strong adsorption
of small quantities of alcohol. In this connection, it
is noteworthy that Fogiel and Heller (16) in studying•
the sorption isotherm of ethanol on freeze-dried egg
albumin found a strong deviation of B.E.T. theory at very
low relative pressures (below 0.05), which were tentatively
interpreted in terms of chemisorption or a small, fraction
of active sites having a very high affinity for the
vapor.
Attempts at 'thermal desorption of entrapped volatile
Freeze-dried samples of BSA-2-propanol containing
about 0.16 g 2-propanol/100 g BSA were placed in a '•
vacuum oven over anydrous calcium sulfate and activated
charcoal and evacuated at 50°C, 72°C, 87°C and 106°C.
The samples were placed on a bed of purified sand to •i _ •
insure good thermal contact. The 2-propanol content was
measured as a function of time.
The results are shown in Figure 5; it can be seen'
that there is no significant loss of volatile in the
range of temperatures examined. In addition, we did not
observe any change in the external structure of the
freeze-dried BSA by effect of temperature. These results
5-27
are in good agreement with those obtained by Chirife and
Karel (18) who studied the effect of temperature on
the release of entrapped n-propanol from freeze-dried
maltose. They noted especially the coincidence of
structural changes observable visually at the onset of
volatile release. -We believe that the observed results•
support the microregion theory of volatile retention.
The loss of volatile appears associated with disruption
of structure present in the freeze-dried cake. Thermal
energy from heating will cause disruption only when it
is above some energy level (24). Therefore, as shown
in Figure 5, 2-propanol retention in freeze-dried BSA
will remain constant when the sample is heated at
temperatures at Which no major structural changes occur.
The lack of apparent change in the external structure
of BSA does not preclude the possibility of denaturation
in the "dry" state. Mirsky (22) heated crystals of
horse serum albumin (HSA) at various temperatures from
60°C to 115°C. At no temperature were the crystals
destroyed and even after heating at 115°C the crystals
seemed as perfectly formed as before heating. However,
Mirsky confirmed the occurrence of denaturation in the
solid state for the highest temperatures, without
apparent change in the external crystal form.
5-28
SUMMARY
Retention of ll*C labeled 2-propanol was studied
in freeze-dried systems containing either bovine serum
albumin (BSA) or pepsin. Retention during freeze
drying varied with: initial concentration of solids
and 2-propanol, rate of freezing and sample thickness.
Heat denaturation of the proteins did not significantly
affect the volatile retention. When freeze-dried BSA
was rehumidified, volatile retention dropped to a new
level which depended on the final water content. Heating
the freeze-dried BSA systems in vacuum had no effect on
the 2-propanol retention. The results are indicative
of structurally dependent retention and can be mainly
interpreted by the "microregions" theory of volatile
retention.
5-29
REFERENCES '
1. Amberg, C.H. Heats of adsorption of water vapor
on bovine serum albumin. J. Am. Chem. Soo. 79, 3980
(1957).
2. Arai, S., Noguchi, M., Yamashita, M., Kato, H. and
Fujimake, M. Studies on flavor components in
soybean. Part VI. Some evidence for occurrence of
protein-flavor binding. Agr. Biol. Chem. 34, 1569
(1970).
3. Benson, S.W. and Richardson, R.L. A study of hysteresis
in the sorption of polar gases by native and
denaturated proteins. J. Am. Chem. Soo. 77, 2585 (1955).
4. Bovery, F.A. and Yanary, S.S. Pepsin. In "The Enzymes,"
(Boyer, P.E., Lardy H. and Myrback, K.,Eds.), 2nd ed.,
Academic Press, New York, 1960.
5. Bull, H.B. Adsorption of water by proteins. J. Am. Chem.
Soo. 66, 1499 (1944).
6. Callaghan, P. and Martin, N.H. The relation of the rotary
dispersion behavior on human serum albumin to its
configuration. Bioahem. J. 83, 144 (1962).
7. Chandrasekaran, S.Kf and King, C.J. Retention of
volatile flavor components during drying of fruit
juices. Chem. Eng. Progr. Symp. Ser. No. 108, 67,
122 (1971).
5-30
8. Chirife, J., Karel, M. and Flink, J.M. Studies on
mechanisms of retention of volatile in freeze-dried
food models: The system PVP-n-propanol. J. Food Soi.
(in press) (1973).
9. Chirife, J. and Karel, M. Contribution of adsorption
to volatile retention in a freeze-dried food model•
containing PVP. J. Food Soi. (in press) (1973).
10. Chirife, J. and Karel, M. Effect of structure disrupting
treatment on volatile release from freeze-dried
maltose. (Submitted for publication to J. Food Teah.)
(1973).
11. Eley, D.D. and Leslie, R.B. Kinetics of adsorption of
water vapor and electrical conduction in bovine plasma
albumin. Trans. Faraday Soo. 62, 1002 (1966).
12. Feeney, R.E., Smith, L.M., Feinstein, G. and Mohammadzadeh,
K. Binding of hydrophobic substances by proteins in
solution. Ceval So. Today. 15, 182 (197.0).
13. Flink, J.M. and Karel, M. Retention of organic volatiles
in freeze-dried solutions of carbohydrates. J. Agric.
Food Chem. 18, 295 (1970).
14. Flink, J.M. and Karel, M. Effects of process variables
on retention of volatiles in freeze drying, J. Food
Soi. 35, 444 (1970).
15. Flink, J.M. and Karel, M. Mechanisms of retention of
organic .volatiles in freeze-dried systems. J. Food
Tech. 7, 199 (1972).
5-31
16. Fogiel, A. and Heller, W. Sorption of vapors by proteins.
I. Sorption of water vapor and ethanol vapor by egg
albumin. J. Phys. Chem. 70, 2039 (1966).
17. Fuller, M.E. and Brey Jr., W.S. Nuclesar magnetic resonance
study of water sorbed on serum albumin. Biol. Chem.
243, 274 (1968).
18. Karel, M. Recent research and development in the field
of low-moisture and intermediate-moisture foods. CRC
. Grit. Rev. in Food Technology 3, 329.
19. King, C.J. Freeze drying of foodstuffs. CRC Grit. Rev.
in Food Technology 1, 379 (1970).
20. King, C.J. Recent developments in food dehydration
technology. Proa. Third Int. Conf. on Food Science and
Technology, Washington, D.C.
21. Menting, L.C. and Hoogstad, B. Volatiles retention during
the drying of aqueous carbohydrate solutions. J. Food
Sci. 32, 87 (1967).
22. Mirsky, A.E. The effect of heat on crystals of serum
albumin; Production of crystals of denatured protein.
Science 93, 285 (1941).
23. Mohammadzadeh-K., A., Feeney, R.E. and Samuels, R.B.
Solubility of alkanes in protein solutions. Biochim,
and Biophys. Acta 147, 583 (1967).
.24. Northolt, M.G. Deformation behavior of amorphous film
of nylon 11 and some other polyamides above and below
5-32
the glass transition temperature. J. Polym. Sci.a
Part C, 38, 205 (1972).
25. Pauling, L. The adsorption of water by proteins. J. Am.
Chem. Soo. 67, 555 (1945).
26. Puri, R.B. and Malik, R.C. Studies in physicochemical
properties of caseins. Part V. Sorption of ethanol
and methanol Vapors. J. Indian Chem. Soo. 49, 763
(1972).
27. Putnam, F.W. Structure and function of the plasma proteins.
In "The Proteins: Composition, Structure and Function"
(H. Neurath, Ed.), Vol. 3, p. 99. Academic Press, New
York, 1965.
28. Ray, A., Reynolds, J.A., Polet, H. and Steinhardt, J.
Binding of large and neutral molecules by native
bovine serum albumin. Biochem. J. 5, 2606 (1966).
29. Rulkens, W.H. and Thijssen, H.A.C. Retention of volatile
compounds in freeze drying slabs of malto-dextrin.
J. Food Technol. 7, 79 (1972).
30. Schachman, H.K. Considerations on the tertiary structure
of proteins. Cold Spring Harbor Symp. on Quant. Biol.
XXVIII, 409 (1963).
31. Solms, J., Osman-Ismail, F. and Beyeler, Mi The interaction
of volatiles with food components. Can. Inst. Food Sai.
Technol. J. 6, A 10 (1973).
5-33
32. Steinhardt, J. and Beychok, S. Interaction of proteins
with hydrogen ions and other small ions and molecules.
In "The Proteins: Composition, Structure and Function"
(H. Neurath, Ed.), Vol. 3, p. 140.Academic Press, New
York (1964). .
33. Terada, H. Interaction of an organic dye with serum
albumin in heat denatured system. Life Sci. Part II.
11, 417 (1972) .
34. Thijssen, H.A.C. and Rulkens, W.H. Retention of aromas
in drying food liquids. Ingenieur. 80, 45 (1968) .
35. Thijssen, H.A.C. and Rulkens, W.H. Effect of freezing
rate on the rate of sublimation and aroma retention
in freeze drying. Bulletin Int. Inst. du Froid Annex
1969-9 (1969).
36. Thijssen, H.A.C. Flavor retention in drying preconcen-
trated food liquids. J. Appl. Chem. Bioteohnol. 21,
372 (1971).
5-34
ACKNOWLEDGMENTS . .
The authors acknowledge the financial support of
Universidad de Buenos Aires and Facultad de Ciencias
Exactas y Naturales for Dr. J. Chirife. This study was
also supported in part by Contract No. 9-12485 from the
Manned.Spacecraft Center, NASA, Houston.
5-35
FIGURE LEGENDS
Figure 1 Effect of initial 2-propanol content on the
retention during freeze drying of BSA and
pepsin solutions (20% solids).
Figure 2 Effect of concentration of solids on 2-propanol•
retention during freeze drying of BSA solutions
(initial 2-propanol content: 0.05% w/w).
Figure 3 Effect of sample thickness on 2-propanol
retention during freeze drying of BSA and
pepsin solutions (20% solids content, initial
2-propanol content: 0.05% w/w);
Figure 4 Loss of 2-propanol from freeze dried BSA
humidified to specified relative humidities
at 25°C.
Initial 2-propanol content: 0.16 g/100 g BSA
Equilibrium water content at 20% RH: 5.7 g/100 g BSA
at 32% RH: 8.5
at 52% RH:12.6
at 75% RH:20.2
Figure 5 Retention of 2-propanol in freeze dried BSA