Mechanisms of peripheral phylogeographicdivergence in the indo-Pacific: lessons fromthe spiny lobster Panulirus homarusAhmad Farhadi1,2* , Andrew G. Jeffs3, Hamid Farahmand4, Thankappan Sarasam Rejiniemon5, Greg Smith6
and Shane D. Lavery7
Abstract
Background: There is increasing recognition of the concordance between marine biogeographic and phylogeographicboundaries. However, it is still unclear how population-level divergence translates into species-level divergence, and whatare the principal factors that first initiate that divergence, and then maintain reproductive isolation. This study examinesthe likely forces driving population and lineage divergences in the broadly-distributed Indo-Pacific spiny lobster Panulirushomarus, which has peripheral divergent lineages in the west and east. The study focuses particularly on the West IndianOcean, which is emerging as a region of unexpected diversity. Mitochondrial control region (mtCR) and COI sequences aswell as genotypes of 9 microsatellite loci were examined in 410 individuals from 17 locations grouped into 7 regions fromSouth Africa in the west, and eastward across to Taiwan and the Marquesas Islands. Phylogenetic and population-levelanalyses were used to test the significance and timing of divergences and describe the genetic relationships amongpopulations.
Results: Analyses of the mtCR revealed high levels of divergence among the seven regions (ФST = 0.594,P < 0.001). Microsatellite analyses also revealed significant divergence among regions, but at a much lowerlevel (FST = 0.066, P < 0.001). The results reveal different patterns of mtCR v. nDNA divergence between thetwo distinct peripheral lineages: a subspecies in South Africa and Madagascar, and a phylogeographicallydiverged population in the Marquesas. The results also expose a number of other more fine-scale populationdivergences, particularly in the Indian Ocean.
Conclusions: The divergence of peripheral lineages in the west and east of the species’ range appear tohave been initiated and maintained by very different processes. The pattern of mitochondrial and nucleardivergence of the western lineage, implicates processes of parapatric isolation, secondary contact andintrogression, and suggests possible maintenance through adaptation and behavioural reproductive isolation.In contrast, the eastern lineage appears to have diverged through a rare colonisation event, maintainedthrough long-term isolation, and matches expectations of the core-periphery hypothesis. The process of activeperipheral speciation may be a common force in the Indo-Pacific that helps drive some of the regions’recognized biogeographic boundaries.
Keywords: Indo-West Pacific, Larval dispersal, Marine biogeography, mtDNA, Microsatellites, Panulirus,Peripheral speciation, Phylogeography, West Indian Ocean
* Correspondence: [email protected] of Biological Sciences, University of Auckland, Auckland, NewZealand2Department of Natural Resources and Environment, School of Agriculture,Shiraz University, Shiraz, IranFull list of author information is available at the end of the article
BackgroundOur understanding of the origins of marine biodiversityhas been greatly enhanced through investigation of theevolutionary history of biogeographic provinces. This isparticularly so in the vast Indo-Pacific region, whichharbours the bulk of marine diversity, and has long beenof great biogeographic interest across a wide taxonomicrange of species [1–5]. Marine biogeographic provincesare largely defined by distributions of species and/orendemism [6, 7]. However, there is increasing recogni-tion of the concordance between marine biogeographicand phylogeographic boundaries [8, 9], and there havebeen a number of within-species genetic studies thathave greatly expanded our understanding of some of thecommon evolutionary patterns in the Indo-Pacific [10, 11].However, it is still unclear how population-level divergencetranslates into species-level divergence [8], and what thediffering factors are that first initiate that divergence, andthen maintain reproductive isolation [12, 13]. This isparticularly puzzling in the marine environment, wheremany species have the ability to disperse widely throughplanktonic larvae [14].Although there are common biogeographic and
phylogeographic boundaries among Indo-Pacificspecies that hint at common causes of divergence,there are also many discrepancies in the patternsobserved among species [15, 16]. These discrepanciessuggest that a diversity of forces act on marinespecies in this region to initially create genetic andbiogeographic boundaries. These may include not onlythe obvious restrictions to dispersal of drifting larvaeby the prevailing ocean currents [14, 17], but also theimpact on both currents and habitat availability byrecent sea-level changes, or more distant geologicalevents [18].It is also unclear what the forces are that maintain
reproductive isolation as diverged populations becomespecies, and what is the relative importance of physicalversus ecological boundaries in maintaining that diver-gence [19]. That is, how is it that the dynamic processes ofgene flow reduction and population subdivision withinspecies may ultimately lead to biogeographic divergenceamong species. Although it may at first appear to be medi-ated in a simple way through allopatric speciation, thecomplex overlapping distributions of most marine taxathrough the region show that the process is far from sim-ple, and have led some to invoke the potential impact ofadaptation to differing environments [20].Another major gap in our understanding of Indo-
Pacific biodiversity is the fine-scale pattern of populationsubstructure across the region. The broad biogeographicpatterns and provinces are now somewhat clear [8], butthere is still much doubt about the locations of less obvi-ous barriers to gene flow within each province, and if
these too may be common among species [21]. Suchfine-scale questions are of particular importance formanagement of commercial or endangered species, andrequire much more intensive sampling than common inpast studies across this vast region, especially within theless-studied Indian Ocean, which appears to harbour un-recognised levels of biodiversity [15, 22].In this study, we begin to address these outstanding
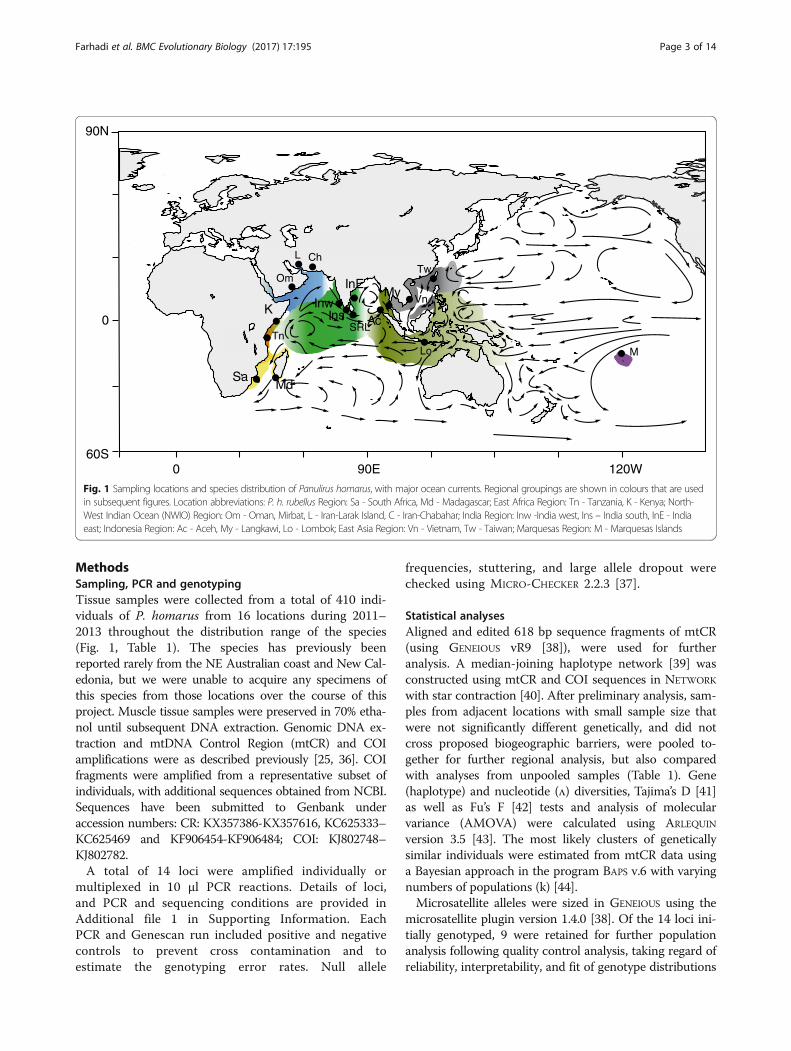
questions using the scalloped spiny lobster, Panulirushomarus (Linnaeus, 1758). P. homarus is a valuable fish-eries species distributed widely across the Indo-Pacificregion (Fig. 1) [23]. This species has ocean-going larvaewith a larval period (PLD) of at least 6 months [24],which could be expected to provide high levels ofgenetic connectivity over large spatial scales [14]. Recentmitochondrial and nuclear DNA sequence analyses ofsmall numbers of P. homarus across the range of thisspecies [25] revealed three evolutionary lineages thatmatched three of the four previously described morpho-logical subspecies: P. homarus rubellus (in South Africaand Madagascar) [26, 27], P. homarus “brown” (in theMarquesas Islands, Central Pacific) [28], and P. homarushomarus, which appears to inhabit all the interveningpart of its distribution (see Fig. 1). There was found tobe no genetic basis for the previously described P.homarus megasculpta subspecies [25]. P. homarus thusappears to show peripheral endemism, which is nowbecoming recognised as a common process drivingthe generation of marine biodiversity [15, 19, 29, 30].One corollary of peripheral endemism is articulatedin the “core-periphery” (or “central-marginal”, or“centre of origin”) hypothesis [31], which predicts thatperipheral populations will exhibit lower diversity andgreater divergence, a pattern seen in several marinespecies [32–34].We investigate here the process of phylogeographic
divergence in this species across biogeographic boundar-ies, to shed light on the evolutionary forces driving this.Using a greatly expanded data set that includes substan-tially increased sample sizes from a much wider diversityof locations, examined using two mitochondrial DNAgenes and nine nuclear microsatellite loci, we address twogroups of related questions: (1) What can multiple loci tellus about the processes driving divergence at the westernand eastern peripheries? When did the divergences occur,have they both been driven and maintained by similarallopatric processes, do they match the predictions ofthe core-periphery hypothesis, and are they concord-ant with those of other species? (2) Do more fine-scale divergences exist between populations separatedby other recognised biogeographic boundaries, theIndo-Pacific barrier (IPB), and the proposed mid-In-dian Ocean barrier (MIOB [22]). Can we help clarifythe nature and location of the MIOB [35].
Farhadi et al. BMC Evolutionary Biology (2017) 17:195 Page 2 of 14
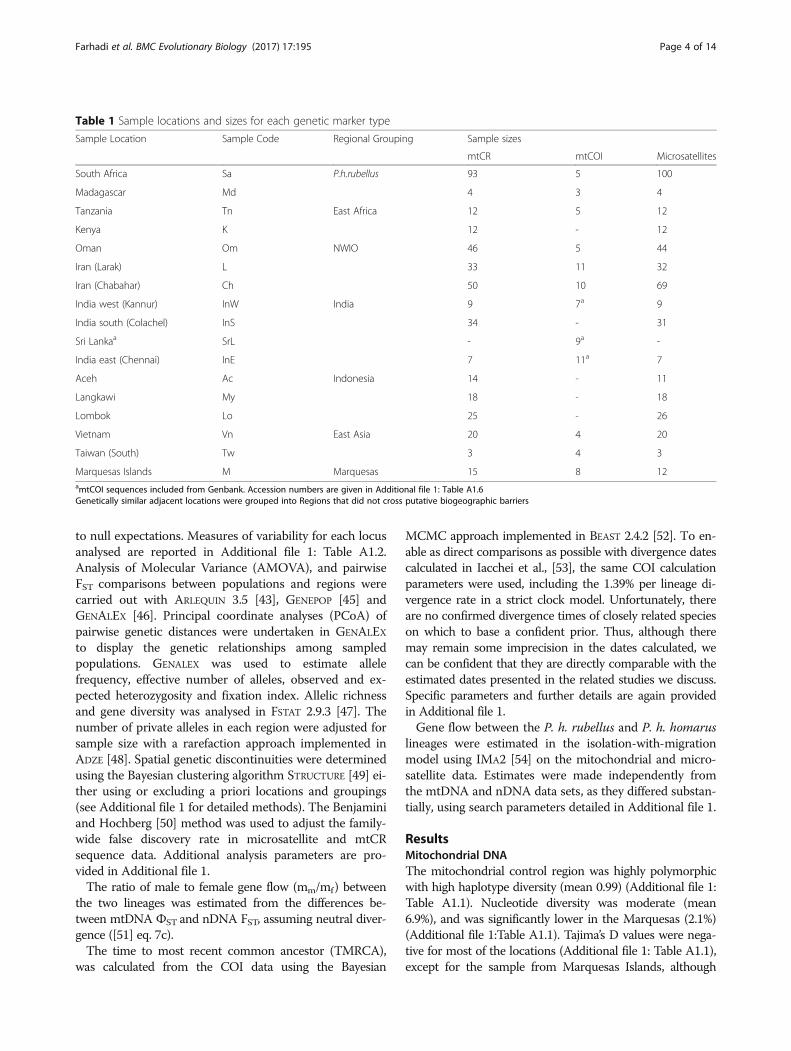
MethodsSampling, PCR and genotypingTissue samples were collected from a total of 410 indi-viduals of P. homarus from 16 locations during 2011–2013 throughout the distribution range of the species(Fig. 1, Table 1). The species has previously beenreported rarely from the NE Australian coast and New Cal-edonia, but we were unable to acquire any specimens ofthis species from those locations over the course of thisproject. Muscle tissue samples were preserved in 70% etha-nol until subsequent DNA extraction. Genomic DNA ex-traction and mtDNA Control Region (mtCR) and COIamplifications were as described previously [25, 36]. COIfragments were amplified from a representative subset ofindividuals, with additional sequences obtained from NCBI.Sequences have been submitted to Genbank underaccession numbers: CR: KX357386-KX357616, KC625333–KC625469 and KF906454-KF906484; COI: KJ802748–KJ802782.A total of 14 loci were amplified individually or
multiplexed in 10 μl PCR reactions. Details of loci,and PCR and sequencing conditions are provided inAdditional file 1 in Supporting Information. EachPCR and Genescan run included positive and negativecontrols to prevent cross contamination and toestimate the genotyping error rates. Null allele
frequencies, stuttering, and large allele dropout werechecked using MICRO-CHECKER 2.2.3 [37].
Statistical analysesAligned and edited 618 bp sequence fragments of mtCR(using GENEIOUS vR9 [38]), were used for furtheranalysis. A median-joining haplotype network [39] wasconstructed using mtCR and COI sequences in NETWORK
with star contraction [40]. After preliminary analysis, sam-ples from adjacent locations with small sample size thatwere not significantly different genetically, and did notcross proposed biogeographic barriers, were pooled to-gether for further regional analysis, but also comparedwith analyses from unpooled samples (Table 1). Gene(haplotype) and nucleotide (л) diversities, Tajima’s D [41]as well as Fu’s F [42] tests and analysis of molecularvariance (AMOVA) were calculated using ARLEQUIN
version 3.5 [43]. The most likely clusters of geneticallysimilar individuals were estimated from mtCR data usinga Bayesian approach in the program BAPS v.6 with varyingnumbers of populations (k) [44].Microsatellite alleles were sized in GENEIOUS using the
microsatellite plugin version 1.4.0 [38]. Of the 14 loci ini-tially genotyped, 9 were retained for further populationanalysis following quality control analysis, taking regard ofreliability, interpretability, and fit of genotype distributions
90N
0
SaMd
K InwIns
InE
Ac
My
Tn
Om
M
,
Tw
Vn
Lo
L Ch
060S
90E 120W
SRL
Fig. 1 Sampling locations and species distribution of Panulirus homarus, with major ocean currents. Regional groupings are shown in colours that are usedin subsequent figures. Location abbreviations: P. h. rubellus Region: Sa - South Africa, Md - Madagascar; East Africa Region: Tn - Tanzania, K - Kenya; North-West Indian Ocean (NWIO) Region: Om - Oman, Mirbat, L - Iran-Larak Island, C - Iran-Chabahar; India Region: Inw -India west, Ins – India south, InE - Indiaeast; Indonesia Region: Ac - Aceh, My - Langkawi, Lo - Lombok; East Asia Region: Vn - Vietnam, Tw - Taiwan; Marquesas Region: M - Marquesas Islands
Farhadi et al. BMC Evolutionary Biology (2017) 17:195 Page 3 of 14
to null expectations. Measures of variability for each locusanalysed are reported in Additional file 1: Table A1.2.Analysis of Molecular Variance (AMOVA), and pairwiseFST comparisons between populations and regions werecarried out with ARLEQUIN 3.5 [43], GENEPOP [45] andGENALEX [46]. Principal coordinate analyses (PCoA) ofpairwise genetic distances were undertaken in GENALEXto display the genetic relationships among sampledpopulations. GENALEX was used to estimate allelefrequency, effective number of alleles, observed and ex-pected heterozygosity and fixation index. Allelic richnessand gene diversity was analysed in FSTAT 2.9.3 [47]. Thenumber of private alleles in each region were adjusted forsample size with a rarefaction approach implemented inADZE [48]. Spatial genetic discontinuities were determinedusing the Bayesian clustering algorithm STRUCTURE [49] ei-ther using or excluding a priori locations and groupings(see Additional file 1 for detailed methods). The Benjaminiand Hochberg [50] method was used to adjust the family-wide false discovery rate in microsatellite and mtCRsequence data. Additional analysis parameters are pro-vided in Additional file 1.The ratio of male to female gene flow (mm/mf) between
the two lineages was estimated from the differences be-tween mtDNA ФST and nDNA FST, assuming neutral diver-gence ([51] eq. 7c).The time to most recent common ancestor (TMRCA),
was calculated from the COI data using the Bayesian
MCMC approach implemented in BEAST 2.4.2 [52]. To en-able as direct comparisons as possible with divergence datescalculated in Iacchei et al., [53], the same COI calculationparameters were used, including the 1.39% per lineage di-vergence rate in a strict clock model. Unfortunately, thereare no confirmed divergence times of closely related specieson which to base a confident prior. Thus, although theremay remain some imprecision in the dates calculated, wecan be confident that they are directly comparable with theestimated dates presented in the related studies we discuss.Specific parameters and further details are again providedin Additional file 1.Gene flow between the P. h. rubellus and P. h. homarus
lineages were estimated in the isolation-with-migrationmodel using IMA2 [54] on the mitochondrial and micro-satellite data. Estimates were made independently fromthe mtDNA and nDNA data sets, as they differed substan-tially, using search parameters detailed in Additional file 1.
ResultsMitochondrial DNAThe mitochondrial control region was highly polymorphicwith high haplotype diversity (mean 0.99) (Additional file 1:Table A1.1). Nucleotide diversity was moderate (mean6.9%), and was significantly lower in the Marquesas (2.1%)(Additional file 1:Table A1.1). Tajima’s D values were nega-tive for most of the locations (Additional file 1: Table A1.1),except for the sample from Marquesas Islands, although
Table 1 Sample locations and sizes for each genetic marker type
Marquesas Islands M Marquesas 15 8 12amtCOI sequences included from Genbank. Accession numbers are given in Additional file 1: Table A1.6Genetically similar adjacent locations were grouped into Regions that did not cross putative biogeographic barriers
Farhadi et al. BMC Evolutionary Biology (2017) 17:195 Page 4 of 14
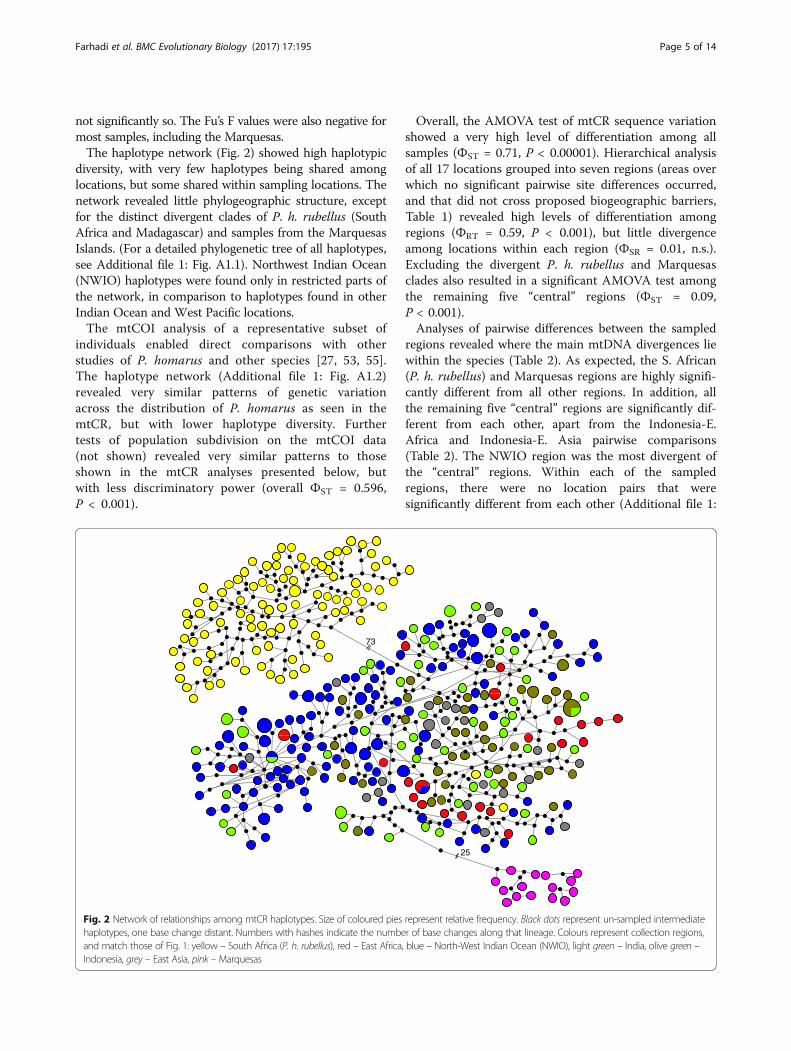
not significantly so. The Fu’s F values were also negative formost samples, including the Marquesas.The haplotype network (Fig. 2) showed high haplotypic
diversity, with very few haplotypes being shared amonglocations, but some shared within sampling locations. Thenetwork revealed little phylogeographic structure, exceptfor the distinct divergent clades of P. h. rubellus (SouthAfrica and Madagascar) and samples from the MarquesasIslands. (For a detailed phylogenetic tree of all haplotypes,see Additional file 1: Fig. A1.1). Northwest Indian Ocean(NWIO) haplotypes were found only in restricted parts ofthe network, in comparison to haplotypes found in otherIndian Ocean and West Pacific locations.The mtCOI analysis of a representative subset of
individuals enabled direct comparisons with otherstudies of P. homarus and other species [27, 53, 55].The haplotype network (Additional file 1: Fig. A1.2)revealed very similar patterns of genetic variationacross the distribution of P. homarus as seen in themtCR, but with lower haplotype diversity. Furthertests of population subdivision on the mtCOI data(not shown) revealed very similar patterns to thoseshown in the mtCR analyses presented below, butwith less discriminatory power (overall ФST = 0.596,P < 0.001).
Overall, the AMOVA test of mtCR sequence variationshowed a very high level of differentiation among allsamples (ФST = 0.71, P < 0.00001). Hierarchical analysisof all 17 locations grouped into seven regions (areas overwhich no significant pairwise site differences occurred,and that did not cross proposed biogeographic barriers,Table 1) revealed high levels of differentiation amongregions (ФRT = 0.59, P < 0.001), but little divergenceamong locations within each region (ФSR = 0.01, n.s.).Excluding the divergent P. h. rubellus and Marquesasclades also resulted in a significant AMOVA test amongthe remaining five “central” regions (ФST = 0.09,P < 0.001).Analyses of pairwise differences between the sampled
regions revealed where the main mtDNA divergences liewithin the species (Table 2). As expected, the S. African(P. h. rubellus) and Marquesas regions are highly signifi-cantly different from all other regions. In addition, allthe remaining five “central” regions are significantly dif-ferent from each other, apart from the Indonesia-E.Africa and Indonesia-E. Asia pairwise comparisons(Table 2). The NWIO region was the most divergent ofthe “central” regions. Within each of the sampledregions, there were no location pairs that weresignificantly different from each other (Additional file 1:
73
25
Fig. 2 Network of relationships among mtCR haplotypes. Size of coloured pies represent relative frequency. Black dots represent un-sampled intermediatehaplotypes, one base change distant. Numbers with hashes indicate the number of base changes along that lineage. Colours represent collection regions,and match those of Fig. 1: yellow – South Africa (P. h. rubellus), red – East Africa, blue – North-West Indian Ocean (NWIO), light green – India, olive green –Indonesia, grey – East Asia, pink – Marquesas
Farhadi et al. BMC Evolutionary Biology (2017) 17:195 Page 5 of 14
Table A1.5). Notably, there was no significant differencebetween P. h. rubellus samples from S. Africa and sam-ples from Madagascar (ФST = 0.01, P = 0.32).The mtDNA pattern of relationships among regions is
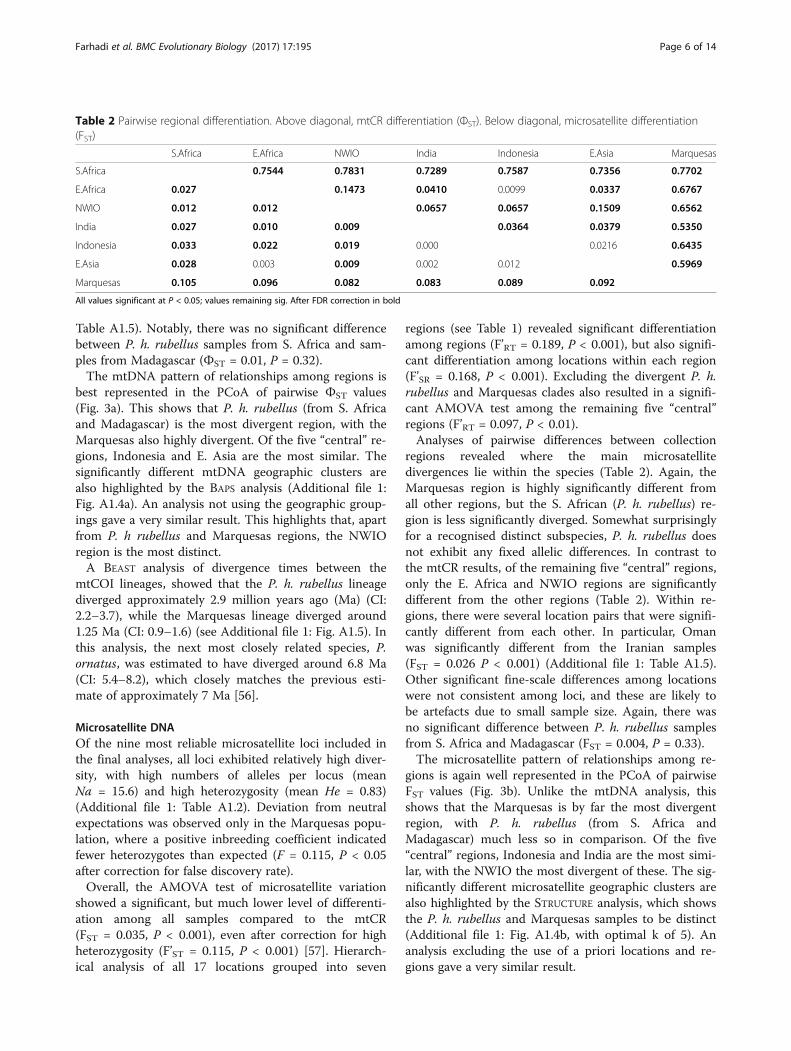
best represented in the PCoA of pairwise ФST values(Fig. 3a). This shows that P. h. rubellus (from S. Africaand Madagascar) is the most divergent region, with theMarquesas also highly divergent. Of the five “central” re-gions, Indonesia and E. Asia are the most similar. Thesignificantly different mtDNA geographic clusters arealso highlighted by the BAPS analysis (Additional file 1:Fig. A1.4a). An analysis not using the geographic group-ings gave a very similar result. This highlights that, apartfrom P. h rubellus and Marquesas regions, the NWIOregion is the most distinct.A BEAST analysis of divergence times between the
mtCOI lineages, showed that the P. h. rubellus lineagediverged approximately 2.9 million years ago (Ma) (CI:2.2–3.7), while the Marquesas lineage diverged around1.25 Ma (CI: 0.9–1.6) (see Additional file 1: Fig. A1.5). Inthis analysis, the next most closely related species, P.ornatus, was estimated to have diverged around 6.8 Ma(CI: 5.4–8.2), which closely matches the previous esti-mate of approximately 7 Ma [56].
Microsatellite DNAOf the nine most reliable microsatellite loci included inthe final analyses, all loci exhibited relatively high diver-sity, with high numbers of alleles per locus (meanNa = 15.6) and high heterozygosity (mean He = 0.83)(Additional file 1: Table A1.2). Deviation from neutralexpectations was observed only in the Marquesas popu-lation, where a positive inbreeding coefficient indicatedfewer heterozygotes than expected (F = 0.115, P < 0.05after correction for false discovery rate).Overall, the AMOVA test of microsatellite variation
showed a significant, but much lower level of differenti-ation among all samples compared to the mtCR(FST = 0.035, P < 0.001), even after correction for highheterozygosity (F’ST = 0.115, P < 0.001) [57]. Hierarch-ical analysis of all 17 locations grouped into seven
regions (see Table 1) revealed significant differentiationamong regions (F’RT = 0.189, P < 0.001), but also signifi-cant differentiation among locations within each region(F’SR = 0.168, P < 0.001). Excluding the divergent P. h.rubellus and Marquesas clades also resulted in a signifi-cant AMOVA test among the remaining five “central”regions (F’RT = 0.097, P < 0.01).Analyses of pairwise differences between collection
regions revealed where the main microsatellitedivergences lie within the species (Table 2). Again, theMarquesas region is highly significantly different fromall other regions, but the S. African (P. h. rubellus) re-gion is less significantly diverged. Somewhat surprisinglyfor a recognised distinct subspecies, P. h. rubellus doesnot exhibit any fixed allelic differences. In contrast tothe mtCR results, of the remaining five “central” regions,only the E. Africa and NWIO regions are significantlydifferent from the other regions (Table 2). Within re-gions, there were several location pairs that were signifi-cantly different from each other. In particular, Omanwas significantly different from the Iranian samples(FST = 0.026 P < 0.001) (Additional file 1: Table A1.5).Other significant fine-scale differences among locationswere not consistent among loci, and these are likely tobe artefacts due to small sample size. Again, there wasno significant difference between P. h. rubellus samplesfrom S. Africa and Madagascar (FST = 0.004, P = 0.33).The microsatellite pattern of relationships among re-
gions is again well represented in the PCoA of pairwiseFST values (Fig. 3b). Unlike the mtDNA analysis, thisshows that the Marquesas is by far the most divergentregion, with P. h. rubellus (from S. Africa andMadagascar) much less so in comparison. Of the five“central” regions, Indonesia and India are the most simi-lar, with the NWIO the most divergent of these. The sig-nificantly different microsatellite geographic clusters arealso highlighted by the STRUCTURE analysis, which showsthe P. h. rubellus and Marquesas samples to be distinct(Additional file 1: Fig. A1.4b, with optimal k of 5). Ananalysis excluding the use of a priori locations and re-gions gave a very similar result.
All values significant at P < 0.05; values remaining sig. After FDR correction in bold
Farhadi et al. BMC Evolutionary Biology (2017) 17:195 Page 6 of 14
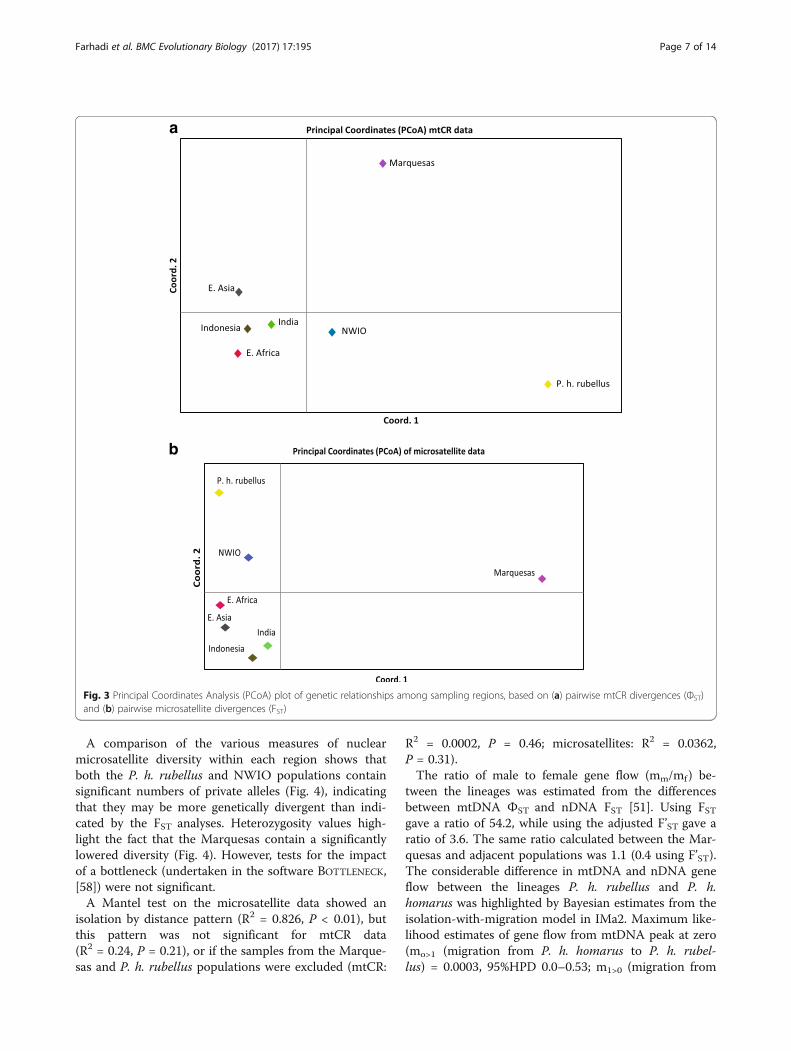
A comparison of the various measures of nuclearmicrosatellite diversity within each region shows thatboth the P. h. rubellus and NWIO populations containsignificant numbers of private alleles (Fig. 4), indicatingthat they may be more genetically divergent than indi-cated by the FST analyses. Heterozygosity values high-light the fact that the Marquesas contain a significantlylowered diversity (Fig. 4). However, tests for the impactof a bottleneck (undertaken in the software BOTTLENECK,[58]) were not significant.A Mantel test on the microsatellite data showed an
isolation by distance pattern (R2 = 0.826, P < 0.01), butthis pattern was not significant for mtCR data(R2 = 0.24, P = 0.21), or if the samples from the Marque-sas and P. h. rubellus populations were excluded (mtCR:
R2 = 0.0002, P = 0.46; microsatellites: R2 = 0.0362,P = 0.31).The ratio of male to female gene flow (mm/mf) be-
tween the lineages was estimated from the differencesbetween mtDNA ФST and nDNA FST [51]. Using FSTgave a ratio of 54.2, while using the adjusted F’ST gave aratio of 3.6. The same ratio calculated between the Mar-quesas and adjacent populations was 1.1 (0.4 using F’ST).The considerable difference in mtDNA and nDNA geneflow between the lineages P. h. rubellus and P. h.homarus was highlighted by Bayesian estimates from theisolation-with-migration model in IMa2. Maximum like-lihood estimates of gene flow from mtDNA peak at zero(mo>1 (migration from P. h. homarus to P. h. rubel-lus) = 0.0003, 95%HPD 0.0–0.53; m1>0 (migration from
Fig. 3 Principal Coordinates Analysis (PCoA) plot of genetic relationships among sampling regions, based on (a) pairwise mtCR divergences (ФST)and (b) pairwise microsatellite divergences (FST)
Farhadi et al. BMC Evolutionary Biology (2017) 17:195 Page 7 of 14
P. h. rubellus to P. h. homarus) = 0.0003, 95%HPD 0.0–0.47), while estimates from nDNA were significantlygreater than zero (mo>1 = 0.51, 0.11–0.59; m1>0 = 0.26,0.16–0.58). (Additional file 1: Table A1.6).
DiscussionA more extensive sampling of individuals, locationsand genetic loci confirms our previous findings ofhigh levels of diversity within and among regions ofP. homarus [25, 36]. The analyses of mtCR andmicrosatellite variation provide further evidence thatP. h. rubellus and the Marquesas population arestrongly diverged from the remainder of the species,but low differentiation among centrally-located sam-ples. The differences between the mtDNA and nDNApatterns of divergence of these peripheral populationsenable a closer examination of the evolutionary pro-cesses driving and maintaining their divergence.
P. h. rubellus (south African) lineageThere is still strong evidence to support a distinct sub-species status for P. h. rubellus [25]. This sub-specieshas a distinct morphological form, is substantially geo-graphically isolated on the extreme of the P. homarusdistribution, is characterized by belonging to a uniquemtDNA lineage that is considerably diverged from theremainder of the species, and is distinct at the ITS-1nuclear locus [25]. However, the microsatellite resultsindicate that, surprisingly, there is considerably lessnuclear than mtDNA divergence between these sub-species than under neutral expectations [59]. They havevery divergent mtDNA lineages (16% K2P for mtCR,compared with 4% divergence of the Marquesas lineage),and a substantial number of private microsatellite alleles,
yet only small mean microsatellite allele frequency dif-ferences, resulting in significantly larger than expecteddifferences between mtDNA ФST and nDNA FST. The P.h. rubellus lineage is less divergent than the Marquesaspopulation in its microsatellite DNA, even though it isfar more divergent in its mtDNA.It is known that there is currently some overlap in the
distribution of the distinct P. h. rubellus and P. h.homarus forms along the north-eastern coast of SouthAfrica and Mozambique, with the homarus form de-creasing in frequency southward [60]. It is also knownfrom previous work that some degree of hybridizationoccurs between the two forms, as a very small numberof individuals with the rubellus morphological form havebeen found to carry the homarus mtDNA [25, 61]. Giventhe geographically highly demarcated boundary to thedivergent mtDNA lineages, and the very limited sharingof mtDNA among morphological forms, it is clear thatthere are very low levels of mtDNA gene flow betweenlineages. In contrast, the microsatellite results suggestrelatively high nDNA gene sharing between these line-ages. There are several potential explanations for thisphenomenon, and all of them may be relevant to themechanisms that initiate and maintain marine speciesdivergence and biogeographic boundaries in the Indo-Pacific.Potentially, the discrepancy in divergence of mtDNA
and nuclear microsatellite alleles could be due simply tostochastic lineage sorting with random fixation ofmtDNA alleles and/or insufficient time for nuclear al-leles to diverge in frequency [62–64]. However, this isunlikely here, given the ratio of mtDNA/nDNA diver-gence and estimated gene flow, and the extreme contrastin the divergence ratio between P. h. “brown” (in the
Fig. 4 Microsatellite allelic patterns across regions for Mean He – expected heterozygosity, and Mean No. private alleles (found only in that region)
Farhadi et al. BMC Evolutionary Biology (2017) 17:195 Page 8 of 14
Marquesas) and P. h. rubellus. This pattern is close toexpectations for neutral divergence in P. h. “brown”,which has a mtDNA lineage 4% divergent, no privatemicrosatellite alleles, a mtDNA ФST/nDNA FST ratio of0.59/0.09 and an estimated ratio of male to female geneflow (mm/mf) [51] of 1.1. In contrast, this pattern is sig-nificantly divergent from neutral expectations in P. h.rubellus, which has a mtDNA lineage 16% divergent,and a high proportion of private microsatellite alleles,but the mtDNA ФST/nDNA FST ratio is 0.75/0.02 andthe estimated ratio of male to female gene flow (mm/mf)is 54.2. This departure from neutral expectations ishighlighted by the difference between mtDNA andnDNA estimates of gene flow from the isolation-with-migration model. It is unlikely that either neutral diver-gence with no gene flow, or high levels of current geneflow in both males and females would leave behind thepattern seen in P. h. rubellus.Given the deep mtDNA divergence, it is more likely
that the P. h. rubellus lineage diverged allopatrically (orparapatrically) at around 2.9 Ma, and it is only recentlythat the distributions of the two lineages have begun tooverlap, leading to secondary contact and introgression[65, 66]. On initial allopatric divergence, it is not uncom-mon to see rapid divergence of a new mtDNA lineage,and slower divergence of nDNA alleles, depending oneffective population size [59, 62]. Upon secondary con-tact, there are several possible factors that may haveeroded the nDNA divergence more rapidly than themtDNA divergence, but still maintained lineage diver-gence through a degree of reproductive isolation [67].Firstly, marked differences between the sexes in migra-tion behaviour, especially related to breeding, is com-monplace among spiny lobsters [68–70], although thisseems unlikely to have sufficient impact on a broadscale. Alternatively, asymmetric developmental fitness ofhybrids may exist, whereby crosses of one type (i.e.,homarus males with rubellus females) are substantiallyless fit, resulting in asymmetric male gene flow but re-stricted female gene flow. The fact that only rubellusfather/homarus mother hybrids have so far been re-ported may lend some support to this hypothesis [25].Another possibility is that of a frequency-dependentmale preference in both subspecies for conspecific mat-ing. This would result in fewer cross-species matingswith the rare female subspecies. Each of these scenarioswould result in greater male than female gene flow be-tween lineages. A final possibility (discussed furtherbelow) is that of strong environmental selection on dif-ferentially adapted phenotypes. The distribution of P. h.rubellus extends the furthest south of any P. homaruspopulation, across the recognised biogeographic bound-ary separating warm tropical from cooler subtropicalwaters along the south-westerly progress of the Agulhas
current [71]. If P. h. rubellus did diverge allopatrically inthe past in this region, there is every likelihood over asubstantial period of time that it would adapt to thecooler temperatures of its range. If so, the resultingdifferential selection along this coast on the two lineagescould maintain their largely non-overlapping parapatricdistributions, and the degree of reproductive isolationevident today. Further exploration of this potentialadaptation is worth pursuing.P. h. rubellus divergence likely originated with the
advent of modern glacial cycles at the beginning of thePleistocene ~2.5 Ma, when a relatively warm, stableinterval of global climate transitioned to cooler, high-amplitude cycles, curtailing a warm-water corridoraround southern Africa, and intermittently reducingconnectivity along this coastline [72]. There is evidenceof local adaptation to cooler waters in some other spe-cies in this region (Nassarius snails [73], Hymenosomacrabs [74, 75]), and extensive evidence of ongoing bio-geographic barriers that separate tropical, subtropical,warm-temperate and cool-temperate waters along thiscoast [75]. The breakdown of physical separation be-tween the two lineages likely arose through populationexpansion during one or more inter-glacial cycles.Regardless of the exact mechanisms, the data are
clear that P. h. rubellus likely diverged about 2.9 Ma(CI: 2.2–3.7), that there is a surprising discrepancy inmtDNA and nDNA divergence between these line-ages, and that, despite apparently high recent nDNAgene flow, distinct lineages are able to persist in para-patry. This highlights that marine lineages may stillbe able to maintain divergence despite substantialgene flow, a matter of considerable interest in marinespeciation and biogeography [19, 76].
Marquesas lineageLike P. h. rubellus, the Marquesas population (P. h.“brown”) is also a peripherally isolated unique mtDNAlineage, but the data suggest that very differentprocesses have led to its origin and maintenance. Un-like P. h. rubellus, its mtDNA lineage is only slightlydivergent, and appears to have diverged only around1.25 Ma (CI: 0.9–1.6). Its mtDNA diversity representsjust a small subset of the total diversity present inthe neighbouring P. h. homarus populations. ThenDNA pattern in this population is one of reductionin allelic diversity, but with no unique alleles (unlikeP. h. rubellus). As such, it may best be regarded asan isolated and distinct population rather than adistinct subspecies, although it does appear to have adistinct morphology [28].Since its colonisation around 1.25 Ma (CI: 0.9–1.6),
likely through a rare period of favourable current flowfrom the West Pacific (see below), the Marquesas
Farhadi et al. BMC Evolutionary Biology (2017) 17:195 Page 9 of 14
population appears to have diverged genetically throughrandom drift in allele frequencies, with no unique nDNAgenotypes. The population appears to have beencompletely marooned through much of this time, and isnow isolated by a very large distance from the mainpopulation range of the species (i.e., >7000 km). (Thegeographically closest recorded specimen is from NewCaledonia, >6000 km distant). The lowered levels ofmtDNA and nDNA diversity, and positive value ofTajima’s D for the mtCR, all suggest that this populationhas a reduced effective size, although not sufficient toleave a significant signal of a bottleneck in its microsat-ellite allele frequencies. This genetic pattern is aspredicted by the core-periphery hypothesis: lowereddiversity in the periphery compared to central popula-tions, as measured by mtDNA and nDNA allelic diver-sity and private alleles, and increased genetic divergenceof the peripheral population [31].It has been recognized previously that the Marquesas
Islands display a high level of endemism and genetic dis-tinction of its marine fauna [3, 16, 20, 77]. This has beenlinked to the formation of these islands and local retentivecurrents [28] and/or prevailing westward currents thatnow prevent gene flow toward the East Pacific [78].Thus very different processes appear to have led to the
divergence and maintenance of the western and easternperipheral lineages of P. homarus. Further, the easternperiphery matches the expectations of the core-peripheryhypothesis, while the western periphery does not.
Fine-scale population divergencesExamination of mtDNA in P. h. rubellus has previouslyindicated the Madagascan population of this lineage isgenetically divergent from the South African population[61]. However, we found no evidence of this distinctgene lineage or any significant divergence in microsatel-lite alleles in Madagascar. Our sample size fromMadagascar may have been insufficient to detect anallele frequency difference, but it should have been pos-sible to detect a distinct mtDNA lineage. Given thedistinct lineage observed by Reddy et al. [61] was a COI-like nuclear copy (numt), unlike our COI sequences, it ispossible that the divergence identified by this marker isnot widespread throughout the mitochondrial or nDNAgenomes.We found strong evidence for reduced gene flow
across the distribution of P. h. homarus, despite the longlarval dispersal period (around 6 months). The NWIOregion appears to be genetically isolated (at bothmitochondrial and nuclear loci) from regions to thesouth (Kenya and Tanzania) and to the east (India andbeyond). This unexpected degree of isolation observedin both marker types may be explained by the Arab SeaGyre and east-west monsoon currents [28, 36] which
likely act to limit larval transport and gene flow alongthe north-east African coast and Arabian Peninsula.Larval connectivity with populations further to the eastaround the Indian subcontinent may also be limited bythe significant outflows of turbid fresh water in thevicinity of Karachi (such as the Indus). Similarly, thehuge outflows from the Meghna River delta(Brahmaputra outflow) into the Bay of Bengal may helpto explain the limited coastal larval connectivity to theeast of the Indian subcontinent. Both these regions tothe west and east of India appear to be breaks in thenatural distribution of P. homarus, and may also reflectbreaks in larval connectivity. These genetic patterns donot clearly locate the existence of a single mid-IndianOcean barrier (MIOB), as has been seen in other species[22]. The genetic divergence to the west of India isgreater than that to the east, but there is clearly anisolation-by-distance effect along this coastline.There appear to be few breaks in connectivity between
the Indonesian (Aceh and Lombok samples) and EastAsian (Vietnam and Taiwan samples) regions, at eithermtDNA or nDNA markers. Although our sampling isless intense across this region, the continuous habitat,strong currents, and many stepping-stone islandssuggest that connectivity is likely to be strong in thisspecies across this region. Indeed, more intense sam-pling of this region in the closely related P. ornatus (withsimilar larval duration) has not detected any populationdifferentiation in mtDNA or nDNA [79, 80], and broadsampling of P. penicillatus across this region also failedto find any marked genetic differentiation [53, 81].
Peripheral divergence and biogeographic implicationsThis study provides further evidence of the ability of mar-ine Indo-Pacific populations to diverge genetically, despitea capacity for extensive planktonic larval dispersal. It is ap-parent that the levels of gene flow within the species aresufficient to maintain cohesion of the species, except atthe peripheries of the distribution range. In the east, theMarquesas population appears to be an isolated remnantof past dispersal, which is now gradually diverging genetic-ally and morphologically. In the west, the great mtDNAdivergence and reduced nDNA divergence in the P. h.rubellus lineage strongly suggests past allopatric diver-gence of this lineage, with more recent secondary contactand introgression. The evidence that nDNA gene flow be-tween the lineages is now much higher than mtDNA geneflow, suggests that a partial reproductive barrier has devel-oped during their allopatric isolation, and that this barriermay act through a combination of male mating prefer-ences, and ecological selection on differentially adaptedphenotypes. Such a scenario may also be a common fea-ture behind some of the marine biogeographic boundariescommonly observed across the Indo-Pacific.
Farhadi et al. BMC Evolutionary Biology (2017) 17:195 Page 10 of 14
A similar situation is seen in the closely related P. orna-tus, where a very distinct mtDNA lineage has been foundin the WIO [80]. However, in that species the mtDNAbarrier appears to have started breaking down, and thislineage has now spread much more widely eastwards atlow frequency. It is possible that this species experienceda similar allopatric divergence history in the WIO as P. h.rubellus, but that a behavioural reproductive barrier didnot develop in P. ornatus before secondary contact andintrogression occurred. P. ornatus exhibits its greatestmtDNA lineage boundary further north than P. homarus(north of Kenya). Another related species, P. penicillatus,has its most divergent Indian Ocean mtDNA lineage in itsNWIO population, specifically in the Red Sea [53, 82],which itself has now been recognised as being a commonbiogeographic province [8]. The one factor in commonamong all these genetically divergent Panuliruspopulations is that they all lie at the extreme westernperiphery of their species’ distribution. Thus it seems thatperipheral populations in the WIO may have a high prob-ability of forming divergent lineages and perhaps species,even if there is potential for long-distance larval dispersal.Recent studies in other diverse species have also
highlighted the importance of the WIO as a location ofunique marine lineages and biodiversity. A number offinfish species have been identified as having divergentpopulations in the WIO [15, 22, 83], and a similar patternis now also being described in several invertebrate speciesin the same region [84–86]. Therefore, there appears to beconsiderable scope for phylogeographic and biogeographicboundaries to be present in the WIO, which has onlyrecently been recognised [15]. As further studies areundertaken in the WIO, we propose that additional com-mon biogeographic barriers will be found, and it appearshighly likely that the WIO in general will exhibit higherlevels of population divergence than the Indo-Polynesianprovince to the east for widespread species. We alsosuggest that the potential mechanisms of populationdivergence described for P. homarus in this study may alsoapply more widely in this region.Analysis of mtDNA divergence times in P. penicillatus
revealed that the East Pacific lineage of that species di-verged approximately 1.5 Ma (0.8–2.31), while the NWIORed Sea lineage diverged only about 0.7 Ma (0.4–1.1) [53].Similar calculations on the mtDNA divergences in P.homarus show that the P. h. rubellus lineage likelydiverged around 2.9 Ma (2.2–3.7), while the Marquesassub-population diverged around 1.25 Ma (0.9–1.6).Identical calculations on the P. ornatus mtDNA data esti-mate that the East African lineage diverged around0.66 Ma [80], and it does not appear to have a peripherallyisolated eastern lineage. It is clear from these estimatesthat there is some, but not complete, overlap in time andplace where genetic lineages diverged in these species with
similar biology. Around 0.7 Ma, both P. ornatus and P.penicillatus had peripheral WIO populations that genetic-ally diverged. Around 1.5 Ma, both P. penicillatus and P.homarus had peripheral Eastern Pacific populations thatgenetically diverged. The P. h. rubellus lineage is by far theoldest divergence among this group, and appears to pre-date these divergences by several million years, but coin-cides with the estimated date of most common divergenceacross the MIOB in a range of fish species [22].These estimated dates of divergence point toward the
possibility of common periods of phylogeographic diver-gence across the Indo-Pacific, which may help to identifythe potential initial drivers of divergence. The dramaticimpact of sea-level changes on both sea shelf habitatavailability and fluctuations in prevailing currents havepreviously been highlighted, especially in the IndianOcean, where coastal shelves are generally narrow [18].However, the divergences reported here fall well beforethe most recent sea-level changes (around 0.02 Ma), andthus it is very difficult to accurately align any of these di-vergences with any specific sea-level events. Intersectingwith these long-term temporal changes are the complexseasonal changes in currents and upwelling in the WIOthat have been identified [36, 86]. Cowman andBellwood [87] have alerted us to the changes over timein biogeographic processes that have likely taken placein the Indo-Pacific; “accumulation”, followed by“survival”, “origin”, and then most recently a period of“survival and export” of species. All the Panuliruslineage divergences reported here fall into the most re-cent Pliocene period that they characterise as a period of“survival and export” of species. The present study con-firms that, even within the tropical spiny lobsters withenormous larval dispersal potential, this has certainlybeen a period of “export” of unique genetic lineages atthe peripheries of the Indo-Pacific.
ConclusionsThe data presented here show that very differentevolutionary processes have led to the initial divergenceand long-term maintenance of the western and easternperipheral lineages of P. homarus. The pattern of mito-chondrial and nuclear divergence of the western lineage,implicates processes of parapatric isolation, secondarycontact and introgression, and suggests possible mainten-ance through adaptation and behavioural reproductiveisolation. In contrast, the eastern lineage appears to havediverged through a rare colonisation event, maintainedthrough long-term isolation, and matches expectations ofthe core-periphery hypothesis. This may provide anexplanation of some of the common evolutionaryprocesses that translate phylogeographic divergence intobiogeographic divergence, and continue to generatemarine diversity throughout the Indo-Pacific.
Farhadi et al. BMC Evolutionary Biology (2017) 17:195 Page 11 of 14
AcknowledgementsThe laboratory work for this study was carried out in the Molecular Ecologyand Evolution Lab in the School of Biological Sciences at the University ofAuckland. Sincere thanks are extended to the Iranian Fisheries ResearchOrganization and the University of Tehran, Iran, Matthew Slater, John Kochey,Peter Fielding, Renee Albertson, Nguyen Thi Bich Ngoc and Tin Yam Chanfor kindly providing us with samples. The authors would like to thankVibhavari Thakur and Bhargavi Yellapu for laboratory assistance and samplecollection. We also thank the University of Auckland Centre for Genomicsand Proteomics for sequencing and genotyping services.
FundingThe study was conducted with the financial support from Nexus AquasciencesSdn Bhd and the Australian Research Council’s Industrial TransformationResearch Hub (Project number IH 120100032).
Availability of data and materialsGenotype data will be accessible through the Dryad repository, sequencedata are accessible through NCBI Genbank and accession numbers areprovided in manuscript.
Authors’ contributionsAF, AJ, HF and SL conceived the ideas. AJ, AF, TSR collected samples, AJ, SL,GS, provided materials and laboratory equipment, AF produced the data, AF,SL analysed the data. AF, SL, AJ wrote the manuscript. All authors read andapproved the final manuscript.
Authors’ informationAhmad Farhadi is a postdoctoral researcher interested in population geneticsand phylogeography of marine taxa. The work was undertaken under thesupervision of Shane Lavery, who studies the molecular ecology andevolution of a broad range of marine taxa, and Andrew Jeffs, who works onthe ecology and aquaculture of spiny lobsters.
Ethics approvalAll animal sampling in this study complied with the Council of the EuropeanCommunities Directive 86/609/EEC regarding the protection of animals usedfor experimental and other scientific purposes, and fully complied with localfisheries management and marine protected area controls. Dead reptantlobsters were purchased or provided by local commercial fishers andsampled and therefore no specific permits were required for the describedfield sampling as the fishers were required to comply with local lawsregarding capture. The species sampled are not endangered or protected.
Consent for publicationNot Applicable.
Competing interestsThe authors declare that they have no competing interests.
Publisher’s NoteSpringer Nature remains neutral with regard to jurisdictional claims in publishedmaps and institutional affiliations.
Author details1School of Biological Sciences, University of Auckland, Auckland, NewZealand. 2Department of Natural Resources and Environment, School ofAgriculture, Shiraz University, Shiraz, Iran. 3Institute of Marine Science andSchool of Biological Sciences, University of Auckland, Auckland, NewZealand. 4Department of Fisheries and Environment, Faculty of NaturalResources, University of Tehran, Tehran, Iran. 5Department of Botany andBiotechnology, AJ college of Science and Technology, Kerala, India. 6Institutefor Marine and Antarctic Studies, University of Tasmania, Hobart, TAS,
Australia. 7School of Biological Sciences and Institute of Marine Science,University of Auckland, Auckland, New Zealand.
Received: 7 June 2017 Accepted: 11 August 2017
References1. Briggs JC. Marine zoogeography. New York: McGraw-Hill; 1974.2. Briggs JC. The marine east indies: diversity and speciation. J Biogeogr.
2005;32(9):1517–22.3. Briggs JC, Bowen BW. A realignment of marine biogeographic provinces
with particular reference to fish distributions. J Biogeogr. 2012;39(1):12–30.4. Ekman S. Zoogeography of the sea. London: Sidgwick and Jackson; 1953.5. Kulbicki M, Parravicini V, Bellwood DR, Arias-Gonzalez E, Chabanet P, Floeter SR,
Friedlander A, McPherson J, Myers RE, Vigliola L, et al. Globalbiogeography of reef fishes: a hierarchical quantitative delineation ofregions. PLoS One. 2013;8(12):e81847.
6. Reaka ML, Rodgers PJ, Kudla AU. Patterns of biodiversity and endemism onindo-West Pacific coral reefs. PNAS. 2008;105:11474–81.
7. Springer VG. Pacific plate biogeography, with special reference toshorefishes. Smithson Contribut Zool. 1982;367:1–182.
8. Bowen BW, Gaither MR, DiBattista JD, Iacchei M, Andrews KR, Grant WS,Toonen RJ, Briggs JC. Comparative phylogeography of the ocean planet.PNAS. 2016;113(29):7962–9.
9. Cowman PF, Parravicini V, Kulbicki M, Floeter SR. The biogeography oftropical reef fishes: endemism and provinciality through time. Biol Rev.2017:n/a-n/a.
10. Gaither MR, Rocha LA. Origins of species richness in the indo-Malay-Philippine biodiversity hotspot: evidence for the centre of overlaphypothesis. J Biogeogr. 2013;40(9):1638–48.
11. Keyse J, Crandall ED, Toonen RJ, Meyer CP, Treml EA, Riginos C. The scopeof published population genetic data for indo-Pacific marine fauna andfuture research opportunities in the region. B Mar Sci. 2014;90(1):47–78.
12. Palumbi SR. Genetic divergence, reproductive isolation, and marinespeciation. Annu Rev Ecol Syst. 1994;25:547–72.
13. Rocha LA, Bowen BW. Speciation in coral-reef fishes. J Fish Biol.2008;72(5):1101–21.
14. Cowen RK, Sponaugle S. Larval dispersal and marine populationconnectivity. Annu Rev Mar Sci. 2009;1:443–66.
15. Borsa P, Durand JD, Chen WJ, Hubert N, Muths D, Mou-Tham G, Kulbicki M.Comparative phylogeography of the western Indian Ocean reef fauna. ActaOecol-Int J Ecol. 2016;72:72–86.
16. Bowen BW, Shanker K, Yasuda N, Malay MCMD. Heyden Svd, Paulay G,Rocha LA, Selkoe KA, barber PH, Williams ST et al: Phylogeography unplugged:comparative surveys in the genomic era. B Mar Sci.2014;90(1):13–46.
17. Hellberg ME, Burton RS, Neigel JE, Palumbi SR. Genetic assessment ofconnectivity among marine populations. B Mar Sci. 2002;70(1):273–90.
18. Ludt WB, Rocha LA. Shifting seas: the impacts of Pleistocene sea-levelfluctuations on the evolution of tropical marine taxa. J Biogeogr.2015;42(1):25–38.
19. Bowen BW, Rocha LA, Toonen RJ, Karl SA, ToBo L. The origins of tropicalmarine biodiversity. Trends Ecol Evolut. 2013;28(6):359–66.
20. Gaither MR, Bernal MA, Coleman RR, Bowen BW, Jones SA, Simison WB,Rocha LA. Genomic signatures of geographic isolation and natural selectionin coral reef fishes. Mol Ecol. 2015;24(7):1543–57.
21. Gaither MR, Toonen RJ, Robertson DR, Planes S, Bowen BW. Geneticevaluation of marine biogeographical barriers: perspectives from twowidespread indo-Pacific snappers (Lutjanus kasmira and Lutjanus fulvus). JBiogeogr. 2010;37(1):133–47.
22. Hodge JR, Bellwood DR. The geography of speciation in coral reef fishes:the relative importance of biogeographical barriers in separating sister-species. J Biogeogr. 2016;43(7):1324–35.
23. Holthuis L. FAO species catalogue. Marine lobsters of the world: anannotated and illustrated catalogue of species of interest to fisheries knownto date, vol. vol. 13. Rome: FAO; 1991.
24. Phillips BF, Booth JD, Cobb JS, Jeffs AG, McWilliam P. Chapter 7. Larval andpostlarval ecology. In: Phillips BF, editor. Lobsters: biology, management,aquaculture and fisheries. Oxford: Blackwell; 2007. p. 231–62.
25. Lavery SD, Farhadi A, Farahmand H, Chan T-Y, Azhdehakoshpour A,Thakur V, Jeffs AG. Evolutionary divergence of geographic subspecies
Farhadi et al. BMC Evolutionary Biology (2017) 17:195 Page 12 of 14
28. George RW. Tethys Sea fragmentation and speciation of Panulirus spinylobsters. Crustaceana. 2005;78:1281–309.
29. Hodge JR, Read CI, van Herwerden L, Bellwood DR. The role of peripheralendemism in species diversification: evidence from the coral reef fish genusAnampses (family: Labridae). Mol Phylogenet Evol. 2012;62(2):653–63.
30. Puckridge M, Last PR, Andreakis N. The role of peripheral endemism andhabitat associations in the evolution of the indo-West Pacific tuskfishes(Labridae: Choerodon). Mol Phylogenet Evol. 2015;84:64–72.
31. Eckert CG, Samis KE, Lougheed SC. Genetic variation across species'geographical ranges: the central-marginal hypothesis and beyond. Mol Ecol.2008;17(5):1170–88.
32. Cahill AE, Levinton JS. Genetic differentiation and reduced genetic diversityat the northern range edge of two species with different dispersal modes.Mol Ecol. 2016;25(2):515–26.
33. Lal MM, Southgate PC, Jerry DR, Bosserelle C, Zenger KR. Swept away: oceancurrents and seascape features influence genetic structure across the 18,000km indo-Pacific distribution of a marine invertebrate, the black-lip pearloyster Pinctada margaritifera. BMC Genomics. 2017;18(1):66.
34. Liggins L, Gleeson L, Riginos C. Evaluating edge-of-range genetic patternsfor tropical echinoderms, Acanthaster planci and Tripneustes gratilla, of theKermadec Islands, southwest Pacific. B Mar Sci. 2014;90(1):379–97.
35. Cowman PF, Bellwood DR. Vicariance across major marine biogeographicbarriers: temporal concordance and the relative intensity of hard versus softbarriers. Proc R Soc B. 2013;280(1768):20131541.
36. Farhadi A, Farhamand H, Nematollahi MA, Jeffs A, Lavery SD. MitochondrialDNA population structure of the scalloped lobster Panulirus homarus(Linnaeus 1758) from the West Indian Ocean. ICES J Mar Sci. 2013;70(7):1491–8.
37. Van Oosterhout C, Hutchinson WF, Wills DPM, Shipley P. MICRO-CHECKER:software for identifying and correcting genotyping errors in microsatellitedata. Mol Ecol Resour. 2004;4(3):535–8.
38. Kearse M, Moir R, Wilson A, Stones-Havas S, Cheung M, Sturrock S, Buxton S,Cooper A, Markowitz S, Duran C, et al. Geneious basic: an integrated andextendable desktop software platform for the organization and analysis ofsequence data. Bioinformatics. 2012;28(12):1647–9.
39. Bandelt HJ, Forster P, Rohl A. Median-joining networks for inferringintraspecific phylogenies. Mol Biol Evol. 1999;16(1):37–48.
40. Forster P, Torroni A, Renfrew C, Rohl A. Phylogenetic star contraction appliedto Asian and Papuan mtDNA evolution. Mol Biol Evol. 2001;18(10):1864–81.
41. Tajima F. Statistical method for testing the neutral mutation hypothesis byDNA polymorphism. Genetics. 1989;123:585–95.
42. Fu YX. Statistical tests of neutrality of mutations against population growth,hitchhiking and background selection. Genetics. 1997;147(2):915–25.
43. Excoffier L, Lischer HEL. Arlequin suite ver 3.5: a new series of programs toperform population genetics analyses under Linux and windows. Mol EcolResor. 2010;10(3):564–7.
44. Cheng L, Connor T, Siren J, Aanensen D, Corander J. Hierarchical andspatially explicit clustering of DNA sequences with BAPS software. Mol BiolEvol. 2013;30:1224–8.
45. Raymond M, Rousset F. Genepop (version 1.2) population genetics softwarefor exact tests and ecumenicism. J Hered. 1995;86(3):248–9.
46. Peakall R, Smouse PE. GenAlEx 6.5: genetic analysis in excel. Populationgenetic software for teaching and research-an update. Bioinformatics. 2012;28(19):2537–9.
47. Goudet J. FSTAT (version 2.9.3): a computer program to calculate F-statistics. J Hered. 2013;104:586–90.
48. Szpiech ZA, Jakobsson M, Rosenberg NA. ADZE: a rarefaction approach forcounting alleles private to combinations of populations. Bioinformatics.2008;24(21):2498–504.
49. Pritchard JK, Stephens M, Donnelly P. Inference of population structureusing multilocus genotype data. Genetics. 2000;155(2):945–59.
50. Benjamini Y, Hochberg Y. Controlling the false discovery rate - a practicaland powerful approach to multiple testing. J R Stat Soc Series B Methodol.1995;57(1):289–300.
51. Hedrick PW, Allendorf FW, Baker CS. Estimation of fmale gene lowfrom measures of nuclear and female genetic differentiation. J Hered.2013;104(5):713–7.
52. Bouckaert R, Heled J, Kühnert D, Vaughan T, Wu C-H, Xie D, Suchard MA,Rambaut A, Drummond AJ. BEAST 2: a software platform for bayesianevolutionary analysis. PLoS Comput Biol. 2014;10(4):e1003537.
53. Iacchei M, Gaither MR, Bowen BW, Toonen RJ. Testing dispersal limits in thesea: range-wide phylogeography of the pronghorn spiny lobster Panuliruspenicillatus. J Biogeogr. 2016;43(5):1032–44.
54. Hey J. Isolation with migration models for more than two populations. MolBiol Evol. 2010;27(4):905–20.
55. Senevirathna JDM, Munasinghe DHN, Mather PB. Assessment of geneticstructure in wild populations of Panulirus homarus (Linnaeus, 1758) acrossthe south coast of Sri Lanka snferred from mitochondrial DNA sequences.Int J Mar Sci. 2016;6(6):1–9.
56. Tourinho J, Solé-Cava A, Lazoski C. Cryptic species within the commerciallymost important lobster in the tropical Atlantic, the spiny lobster Panulirusargus. Mar Biol. 2012;159:1897–906.
57. Hedrick PW. A standardized genetic differentiation measure. Evolution.2005;59(8):1633–8.
58. Cornuet JM, Luikart G. Description and power analysis of two tests fordetecting recent population bottlenecks from allele frequency data.Genetics. 1996;144:2001–14.
59. Larsson LC, Charlier J, Laikre L, Ryman N. Statistical power for detectinggenetic divergence - organelle versus nuclear markers. Cons Genet.2009;10(5):1255–64.
60. Berry P. The biology of the spiny lobster Panulirus homarus (Linnaeus) offthe east coast of southern Africa, report 28. Durban: OceanographicResearch Institute; 1971.
61. Reddy Maggie M, Macdonald Angus HH, Groeneveld Johan C, SchleyerMichael H. Phylogeography of the scalloped spiny-lobster Panulirus homarusrubellus in the southwest Indian Ocean. J Crust Biol. 2014;34(6):773–81.
62. Avise JC. Phylogeography: The history and formation of species. Cambridge:Harvard University Press; 2000.
63. Hare MP, Cipriano F, Palumbi SR. Genetic evidence on the demography ofspeciation in allopatric dolphin species. Evolution. 2002;56(4):804–16.
64. Marko PB, Hart MW. Retrospective coalescent methods and the reconstructionof metapopulation histories in the sea. Evol Ecol. 2012;26(2):291–315.
65. Tillett BJ, Meekan MG, Broderick D, Field IC, Cliff G, Ovenden JR. Pleistoceneisolation, secondary introgression and restricted contemporary gene flow inthe pig-eye shark, Carcharhinus amboinensis across northern Australia.Conserv Genet. 2012;13(1):99–115.
66. Reid K, Hoareau TB, Graves JE, Potts WM, dos Santos SMR, Klopper AW,Bloomer P. Secondary contact and asymmetrical gene flow in a cosmopolitanmarine fish across the Benguela upwelling zone. Heredity. 2016;117(5):307–15.
67. Servedio MR. Geography, assortative mating, and the effects of sexualselection on speciation with gene flow. Evol Appl. 2016;9(1):91–102.
68. Gardner C, Frusher S, Haddon M, Buxton C. Movements of the southern rocklobster Jasus edwardshi in Tasmania, Australia. B Mar Sci. 2003;73(3):653–71.
69. Kelly S. Temporal variation in the movement of the spiny lobster Jasusedwardsii. Mar Freshw Res. 2001;52(3):323–31.
70. Santos J, Rouillard D, Groeneveld JC. Advection-diffusion models of spinylobster Palinurus gilchristi migrations for use in spatial fisheries management.Mar Ecol Prog Ser. 2014;498:227–41.
71. Teske PR, Winker H, McQuaid CD, Barker NP. A tropical/subtropicalbiogeographic disjunction in southeastern Africa separates two evolutionarilysignificant units of an estuarine prawn. Mar Biol. 2009;156(6):1265–75.
72. Dwyer GS, Cronin TM, Baker PA, Raymo ME, Buzas JS, Correge T. North-Atlantic deep-water temperature-change during late pliocene and latequaternary climatic cycles. Science. 1995;270(5240):1347–51.
73. Teske PR, Papadopoulos I, McQuaid CD, Newman BK, Barker NP. Climate change,genetics or human choice: why were the shells of mankind's earliest ornamentlarger in the pleistocene than in the holocene? PLoS One. 2007;2(7):e614.
74. Teske PR, McLay CL, Sandoval-Castillo J, Papadopoulos I, Newman BK, GriffithsCL, McQuaid CD, Barker NP, Borgonie G, Beheregaray LB. Tri-locus sequencedata reject a "Gondwanan origin hypothesis" for the African/South Pacific crabgenus Hymenosoma. Mol Phylogenet Evol. 2009;53(1):23–33.
75. Teske PR, von der Heyden S, McQuaid CD, Barker NP. A review of marinephylogeography in southern Africa. S Afr J Sci. 2011;107(5–6):43–53.
Farhadi et al. BMC Evolutionary Biology (2017) 17:195 Page 13 of 14
77. Delrieu-Trottin E. Al. E: shore fishes of the Marquesas Islands: an updatedchecklist with new records and new percentage of endemic species. CheckList. 2015;11(5):1–13.
78. Bonjean F, Lagerloef G. Diagnostic model and analysis of the surfacecurrents in the tropical Pacific Ocean. J Phys Oceanogr. 2002;32:2938–54.
79. Dao HT, Smith-Keune C, Wolanski E, Jones CM, Jerry DR. Oceanographiccurrents and local ecological knowledge indicate, and genetics does notrefute, a contemporary pattern of larval dispersal for the ornate spinylobster, Panulirus ornatus in the south-east Asian archipelago. PLoS One.2015;10(5):e0124568.
80. Yellapu B, Jeffs A, Battaglene S, Lavery SD. Population subdivision in thetropical spiny lobster Panulirus ornatus throughout its indo-West Pacificdistribution. ICES J Mar Sci. 2016;74(3):759–68.
81. Abdullah MF, Chow S, Sakai M, Cheng JH, Imai H. Genetic giversity andpopulation structure of pronghorn spiny lobster Panulirus penicillatus in thepacific region. Pac Sci. 2014a;68(2):197–211.
82. Abdullah MF. Alimuddin, Muththalib M, Salama AJ, Imai H: genetic isolationamong the northwestern, southwestern and central-eastern Indian Oceanpopulations of the pronghorn spiny lobster Panulirus penicillatus. Int J MolSci. 2014b;15(6):9242–54.
83. Muths D, Tessier E, Bourjea J. Genetic structure of the reef grouperEpinephelus merra in the West Indian Ocean appears congruent withbiogeographic and oceanographic boundaries. Mar Ecol. 2015;36(3):447–61.
84. Hoareau TB, Boissin E, Paulay G, Bruggemann JH. The southwesternIndian Ocean as a potential marine evolutionary hotspot: perspectivesfrom comparative phylogeography of reef brittle-stars. J Biogeogr.2013;40(11):2167–79.
85. van der Ven RM, Triest L, De Ryck DJR, Mwaura JM, Mohammed MS, KochziusM. Population genetic structure of the stony coral Acropora tenuis shows highbut variable connectivity in East Africa. J Biogeogr. 2016;43(3):510–9.
86. Vogler C, Benzie J, Barber PH, Erdmann MV. Ambariyanto, Sheppard C,Tenggardjaja K, Gerard K, Worheide G: Phylogeography of the crown-of-thorns starfish in the Indian Ocean. PLoS One. 2012;7(8):e43499.
87. Cowman PF, Bellwood DR. The historical biogeography of coral reef fishes:global patterns of origination and dispersal. J Biogeogr. 2013;40(2):209–24.
• We accept pre-submission inquiries
• Our selector tool helps you to find the most relevant journal
• We provide round the clock customer support
• Convenient online submission
• Thorough peer review
• Inclusion in PubMed and all major indexing services
• Maximum visibility for your research
Submit your manuscript atwww.biomedcentral.com/submit
Submit your next manuscript to BioMed Central and we will help you at every step:
Farhadi et al. BMC Evolutionary Biology (2017) 17:195 Page 14 of 14