Mechanosensitive Calcium Entry and Mobilization in Renal A6 Cells
V. Urbach, I. Leguen, I. O’Kelly, B.J. HarveyWellcome Trust Cellular Physiology Research Unit, Department of Physiology, University College, Cork, Ireland
Received: 3 August 1998/Revised: 19 November 1998
Abstract. Using spectrofluorescence imaging of fura-2loaded renal A6 cells, we have investigated the genera-tion of the cytosolic Ca2+ signal in response to osmoticshock and localized membrane stretch. Upon hypotonicexposure, the cells began to swell prior to a transientincrease in [Ca2+] i and the cells remained swollen after[Ca2+] i had returned towards basal levels. Exposure to2/3rd strength Ringer produced a cell volume increasewithin 3 min, followed by a slow regulatory volumedecrease (RVD). The hypotonic challenge also produceda transient increase in [Ca2+] after a delay of 22 sec.Both the RVD and [Ca2+] i response to hypotonicity wereinhibited in a Ca2+-free bathing solution and by gadolin-ium (10 mM), an inhibitor of stretch-activated channels.Stretching the membrane by application of subatmo-spheric pressure (-2 kPa) inside a cell-attached patch-pipette induced a similar global increase in [Ca2+] i asoccurred after hypotonic shock. A stretch-sensitive[Ca2+] i increase was also observed in a Ca2+-free bathingsolution, provided the patch-pipette contained Ca2+. Themechanosensitive [Ca2+] i response was by gadolinium(10 mM) or Ca2+-free pipette solutions, even when Ca2+
(2 mM) was present in the bath. Long-term (>10 min)pretreatment of the cells with thapsigargin inhibited the[Ca2+] i response to hypotonicity. These results provideevidence that cell swelling or mechanical stimulation canactivate a powerful amplification system linked to intra-cellular Ca2+ release mechanisms.
Animal cells initially swell in hypotonic media, but theirvolume is subsequently regulated by loss of KCl and
water triggered by a myriad of signaling pathways (Langet al., 1998). A dominant role is attributed to variationsin the intracellular Ca2+ concentration in the activation ofthis regulatory volume decrease (Razani-Boroujerdi,Partridge & Sopori, 1994). An increase in cytosolic Ca2+
accompanies cell-swelling in different types of epithelialcells (Wong & Chase, 1986; Christensen, 1987; Wong,Debell & Chase, 1990; McCarty & O’Neil, 1992; Ehren-feld, Raschi & Brochiero, 1994; Mooren & Kinne, 1994;Tinel Hanna, Wehner & Sauer, 1994). The generation ofthis cytosolic [Ca2+] response to hypotonic exposure in-volves extracellular Ca2+ entry and/or Ca2+ release fromintracellular stores. A mechanosensitive [Ca2+] i rise hasbeen described in different cell types, including fibro-blasts (Henkart & Nelson, 1979), endothelial cells (Na-ruse & Sokabe, 1993), human intestine (Okada, Hazama& Yan, 1990), mammary cells (Henkart & Nelson,1979), airway epithelial cells (Sanderson, Charles &Dirkse, 1990) and renal A6 cells (Kawahara & Mat-suzaki, 1992).
In the present study, using spectrofluorescence im-aging of Fura-2 loaded A6 cells, a distal renal cell linefrom Xenopus laevis,the source of the intracellular Ca2+
signal and its mechanism of control in response to os-motic shock were investigated and compared to the Ca2+
signal produced by a localized membrane stretch. Weobserved that the increase in cytosolic [Ca2+ ] associatedwith a cell swelling is due to a Ca2+ entry via a stretch-activated channel and subsequent release from thapsigar-gin-sensitive stores. Importantly we show that activationof single stretch-activated calcium channels is sufficientto trigger an amplified Ca2+
i signal. Thus Ca2+i signaling
operates with high gain in response to cell swelling andmembrane stress.
Materials and Methods
A6 CELL CULTURE
A6 cells, a cell line derived from theXenopus laevisnephron werepurchased from American Type Culture Collection (Rockville, MD).Correspondence to:V. Urbach
J. Membrane Biol. 168, 29–37 (1999) The Journal of
The cells were grown at 28°C on plastic tissue culture flasks (Corning,NY) in a modified culture medium for amphibian cells (NCTC 135,Gibco, NY) containing 10% fetal calf serum (Gibco), 0.6% penicillinand 1.0% streptomycin (Gibco), and gassed with 5% CO2. After thecells had formed a polarized confluent monolayer, they were dispersedby exposure to 0.25% trypsin (Trypsin-EDTA, Gibco) for 5 min at37°C. Following centrifugation, the cell pellet was resuspended in cul-ture medium and subcultured (> million of cells per flask) or resus-pended in a normal Ringer solution for the experiments.
INTRACELLULAR Ca2+ MEASUREMENTS
Isolated A6 cells were loaded with the acetoxy-methyl ester of fura-2(5 mM) dissolved in DMSO, for 30 min at room temperature. The finalDMSO concentration was < 0.1% in Ringer solution. The dye-loadedcells were washed in standard Ringer solution and deposited on a glasscoverslip, mounted in a miniperfusion chamber and placed on the stageof a Nikon epifluorescent microscope (Diaphot TMD). The light froma Xenon lamp was filtered through alternating 340 nm and 380 nmfilters. The emitted fluorescence produced after the excitation of fura-2was filtered at 510 nm and detected with a video camera (Darkstar,Photonics Sciences, UK). The video images were digitized, recordedand analyzed using an image analysis program (STARWISE FLUOsystem, IMSTAR Paris, France). The fluorescence obtained at eachexcitation wavelength (I340 and I380) depends upon the level of Ca2+
binding to fura-2. Intracellular Ca2+ concentration was measured fromthe fluorescence ratio I340/I380. Calibration of the dye was performedusing a range of EGTA-buffered Ca2+ solutions of the fura-2 free acidusing the equation of Grynkeiwicz et al. (1985):
[Ca2+] i 4 K8(R − Rmin)/(Rmax − R),
whereK8 is the product of the dissociation constant of the Ca2+ fura-2complex and a constant related to the optical characteristics of thesystem.R is the experimental ratio of I340/I380 from which the back-ground fluorescence has been subtracted, andRmin and Rmax are thevalues ofR in the presence of zero and saturating calcium respectively.K8, Rmin andRmax were obtained using fura-2 free acid in a range ofEGTA-buffered Ca2+ solutions.
The intracellular Ca2+ changes were determined under two dif-ferent experimental procedures designed to mechanically stress the cellmembrane. Localized membrane stretch was produced by applicationof suction inside a patch-pipette after formation of a giga-ohm seal onan isolated A6 cell. Cell swelling was produced by exposure of iso-lated cells to a 2/3rd strength hypotonic Ringer solution superfusedthrough a micropipette positioned within 10mm of the cell. In otherexperiments, to avoid possible shear stress effects, a slow exchange ofthe entire bath solution was made. These two methods of producing anosmotic shock produced changes in intracellular Ca2+ of similar timecourse and magnitude.
SINGLE-CELL VOLUME DETERMINATION
Isolated A6 cells were seeded on Petri dishes in 1 ml normal Ringersolution, and placed on the inverted microscope stage (Nikon DiaphotTMD). Video images of cells recorded with a camera (WAT 902,WATEC, Japan) connected to a video frame grabber (model LG3,Scion Corporation). Images were recorded in real time, stored andanalyzed on a Macintosh computer using the public domain NIH Imageprogram (v1.57ppc), developed at the U.S. National Institutes ofHealth and available from the Internet by anonymous ftp from zippy.nimh.nih.gov or on floppy disk from the National Technical In-formation Service, Springfield, Virginia, part number PB95-
500195GEI. Assuming a spherical shape of isolated cells, the relativevolume change (V/V0) was calculated from the cross-sectional surfacearea before (S0) and during swelling (S) from the relation:V/Vo 4
(S/S0)3/2 (Ross & Cahalan, 1995). The A6 cells were exposed to a
hypotonic solution by perfusion (10 ml/min) of 2/3rd strength Ringer(extracellular Ca2+ concentration was maintained constant at 2 mM).
Cell volume changes were also detected by analyzing the inten-sity of fura-2 fluorescence signals. The two excitation wavelengths offura-2 permit a ratiometric determination of cytosolic [Ca2+] indepen-dent of the dye concentration. A rise in intracellular [Ca2+] producesan increase of the fluorescent intensity measured at 340 nm and adecrease at 380 nm. Thus a reduction of fluorescence at both 340 nmand 380 nm, without a change of the ratio value, indicates a dilution ora leakage of the dye, without a change in [Ca2+]. Since this phenom-enon was observed upon hypotonic exposure of the cells, we concludethat the decrease of dye concentration corresponds to a dilution of thedye, due to the cell swelling. Using this technique a simultaneousmeasurement of cell swelling and intracellular Ca2+ is possible.
SOLUTIONS
The standard amphibian Ringer solution had the following composition(in mM): 120 NaCl, 3.7 KOH, 6 HEPES, 2 CaCl2, 1 MgCl2 and pH 7.4.Osmolarity was adjusted to 250 mOsM by adding glucose. The hypo-tonic perfusion solution was made by diluting the standard Ringer withdistilled water and CaCl2 was added to maintain the Ca2+ concentrationat 2 mM (2/3rd strength Ringer). The Ca-free Ringer solution contained(in mM): 120 NaCl, 3.7 KOH, 10 HEPES, 5 EGTA (250 mOsM), andpH adjusted at 7.4. Fura 2/AM was supplied by Molecular ProbesGadolinium (III) chloride hexahydrate was obtained from AldrichChemical. Thapsigargin was purchased from Sigma Chemical.
Data are given as mean ± SE, andn is the number of experiments.Statistical significance was determined from Studentt-tests as indicatedin the text.
Results
EFFECT OFHYPOTONICITY ON CELL VOLUME AND
CYTOSOLIC CALCIUM
Exposure of A6 cells to 2/3rd strength Ringer solutionproduced a cell swelling and an increase in intracellularcalcium concentration ([Ca2+] i). The time course ofchanges in cell volume and [Ca2+] i were compared. Theexperiments were started 10 min after plating the isolatedA6 cells on plastic Petri dishes. No significant changesin cell surface area were observed under control condi-tions when A6 cells were bathed in normal isotonicRinger solution for extended periods of time. The initialdiameter of isolated cells was 25 ± 0.5mm and remainedconstant at 26 ± 0.5mm (n 4 7) measured after 30 min.However, within 3.4 ± 0.2 min of exposure to 2/3rdstrength Ringer solution, cell volume increased by 43 ±2% (n 4 19), followed by a slow regulatory volumedecrease (Fig. 1). Over the initial 15 min of hypotonicexposure, the cell volume had undergone a volume regu-latory decrease of 19 ± 3% (n 4 19) (Fig. 1).
Exposure to hypotonic shock also produced a tran-
30 V. Urbach et al.: Ca2+ in A6 Cells
sient and large increase in [Ca2+] i (Fig. 2). Comparisonof cell volume and Ca2+ variations after a hypotonicshock showed that small volume changes, as low as 5%,can elicit the [Ca2+] i rise (Fig. 2). However, the cellvolume and [Ca2+] i changes were dissociated in time.As shown in Fig. 2, the cells began to increase in volumeprior to any increase in [Ca2+] i. Furthermore, duringcontinued hypotonic exposure, the cells were still in-creasing in volume, whereas [Ca2+] i had returned to-wards basal levels. The dissociation between cell swell-ing and Ca2+ transients is also apparent from the experi-ment shown in Fig. 3, where measurements of relativechanges in cell volume and calcium were obtained si-multaneously in the same cell. Two phases in the cellu-lar responses were observed. An initial reduction offluorescence intensity at both 340 nm and 380 nm, whichcorresponds to dilution of the dye due to the cell swell-
ing, was observed (phase a). No changes in [Ca2+] i wererecorded during this time. After a delay of 22.5 ± 5seconds (phase b), the fluorescence intensity increased at340 nm and decreased at 380 nm, which translates to a[Ca2+] i increase from 151 ± 4 nM to a peak value of 510± 21 nM (n 4 42). This effect on [Ca2+] i was observedin 94% of cells exposed to a hypotonic shock. The cal-cium response was transient and, after the peak, [Ca2+] i
levels decreased towards resting levels of 175 ± 5 nM,with a mean half-time of 40 ± 10 sec (n 4 11). It is clearfrom these experiments that the increase in intracellularCa2+ lags behind the initial cell swelling phase and thetransient increase in [Ca2+] i is over, while cell volume isstill increasing.
EFFECTS OFEXTERNAL Ca2+AND GADOLINIUM ON
[Ca2+] i DURING A HYPOTONIC SHOCK
The contribution of extracellular calcium to the rise in[Ca2+] i after hypotonic exposure of A6 cells was inves-tigated. The substitution of normal Ringer (2 mM Ca2+)in the bath with a Ca-free-EGTA solution did not pro-duce a detectable change in baseline [Ca2+] i. The [Ca2+] i
in control was 170 ± 14 nM, and was unchanged at 182± 14 nM measured 10 min after incubation in Ca-free-EGTA Ringer solution (n 4 27, P > 0.5). However,after exposure to a hypotonic shock produced in the ab-sence of external Ca2+, (2/3rd strength Ca-free-EGTARinger solution), only 52% of cells responded with ablunted increase in [Ca2+] i. The remaining 48% of cellsgave no calcium response. In responding cells exposedto calcium-free solutions, the mean absolute increase in[Ca2+] i was reduced to 264 ± 29 nM (n 4 27) comparedto an increase of 428 ± 12 nM (n 4 31, P < 0.01)observed in the same pool of cells exposed to extracel-lular calcium. These results show that Ca2+ entrythrough the plasma membrane is one of the componentsof the rise in intracellular Ca2+ during cell swelling(Fig. 4).
One possible route for Ca2+ entry during cell swell-ing is via a stretch-activated channel. We investigatedthe effect of pretreatment of A6 cells with gadolinium(Gd3+ ), an inhibitor of stretch-activated channels, on theCa2+ response to a hypotonic shock (Fig. 4). After Gd3+
(10 mM) treatment, only 58% of the cells responded to ahypotonic shock with calcium changes that were reducedand asynchronous, whereas 94% of cells responded innon-gadolinium-treated paired experiments on the samecell batches (Fig. 4). The mean increase of [Ca2+] i pro-duced by hypotonic exposure of responding cells wasreduced to 228 ± 19 nM (n 4 7) in the presence of Gd3+
compared to an increase of 330 ± 38 nM (n 4 39) incontrol experiments (P < 0.05). These results supportthe involvement of volume-activated and Gd3+-sensitivechannels in Ca2+ entry during hypotonic exposure of thecells.
Fig. 1. Cell swelling and volume regulation during a hypotonic shock(2/3rd strength Ringer). The relative volume (V/Vo) was calculatedfrom the initial volume,VO, measured at the beginning of the experi-ment (t 4 0) and the volume,V, measured at each subsequent timepoint. (A) Three typical experiments are shown for cells exposed tocalcium-containing bathing solution (d), to Ca2+-free solution (s), andto 10 mM gadolinium (h). The arrow indicates the start of hypotonicexposure of the cells (t 4 4 min). (B) Comparison of the maximumrelative volume increase (Vmax) in the presence of calcium-containinghypotonic solution (n 4 19), in a Ca-free bathing solution (n 4 10)and after gadolinium treatment (n 4 14). (C) Comparison of the RVDresponse in cells bathed in calcium-containing hypotonic solution (n 4
19), Ca2+-free bathing solution (n 4 10) and gadolinium (n 4 19).DVcorresponds to the difference betweenVmax and V measured 15 minafter the beginning of hypotonic exposure.
31V. Urbach et al.: Ca2+ in A6 Cells
EFFECTS OFEXTERNAL Ca2+AND GADOLINIUM ON CELL
SWELLING AND RVD
The effect of removal of external calcium or exposure toGd3+ on the cell volume responses to hypotonic exposure
of A6 cells was investigated. Removal of external Ca2+
from the bath solution did not significantly affect thetime course of the swelling response or the maximalvolume increase of cells exposed to a 2/3rd strength so-lution. In Ca-free-EGTA solution, the maximal volumeincrease, reached after 3.6 ± 0.4 min of hypotonic expo-sure of the cells, was 41 ± 2% (n 4 10) (Fig. 1). Thechange in cell volume and the time taken to reach thepeak volume increase are therefore similar to that foundin control Ca2+ containing solutions.
Exposure of cells to Gd3+ (10 mM) did not affect thecell swelling response to hypotonic shock. A maximalvolume increase of 51 ± 5% (n 4 14) was reached after4.0 ± 0.6 min of exposure to a hypotonic solution con-taining Gd3+ (Fig. 1).
We verified that a cell volume increase still occurredin cells in which the swelling-induced rise in [Ca2+] i was
Fig. 2. Comparison of typical [Ca2+] i (d) and cellvolume (s) variations during the first minutes ofexposure to a hypotonic solution (2/3rd Ringer).Note the recovery of intracellular [Ca2+] to restinglevels before the end of the hypotonic exposureand before the maximum volume increase.
Fig. 3. Representative experiment obtained in isolated A6 cells show-ing [Ca2+] i and fura-2 fluorescence intensity measured at 340 nm and380 nm as a function of time, before and after exposure to hypotonicsolution (2/3rd strength Ringer). The [Ca2+] i rise was observed after adelay of 18 sec. Cell swelling had already occurred over this timeperiod as indicated by the decrease in fluorescence intensity at the twoexcitation wave lengths.
Fig. 4. Effects of external [Ca2+]o and gadolinium (10 mM) on the[Ca2+] i response to a hypotonic shock (2/3rd Ringer solution). The[Ca2+] i response to a hypotonic shock is shown for cells bathed incalcium-containing solutions ([Ca2+]o 4 2 mM) (d), in calcium-freesolution (s), and in solutions containing gadolinium and calcium (h).
32 V. Urbach et al.: Ca2+ in A6 Cells
completely abolished by Gd3+. Fura-2 fluorescence in-tensity measurements at 340 nm and 380 nm show cellswelling occurring in the presence of Gd3+ although the[Ca2+] i level remained constant throughout the period ofosmotic shock (Fig. 5).
Removal of external Ca2+ or addition of Gd3+ (10mM) in the bath solution inhibited regulatory volume de-crease after cell swelling (Fig. 1). When cells were ex-posed to a Ca2+-free solution or to Gd3+, the volumemeasured 15 min after hypotonic exposure was not sig-nificantly reduced (calcium free:DV/V0 4 3.5 ± 3%,n4 10, P > 0.5 and Gd3+: DV/V0 4 0.6 ± 0.5%,n 4 14,P > 0.5).
These results confirm the primary role of calciumentry through Gd3+-sensitive channels in generating theRVD response. An increase in [Ca2+] i is necessary toinitiate RVD but a maintained elevated [Ca2+] i is notrequired for restoration of cell volume once RVD is ini-tiated.
EFFECTS OFLOCALIZED MEMBRANE STRETCH ON[Ca2+] i
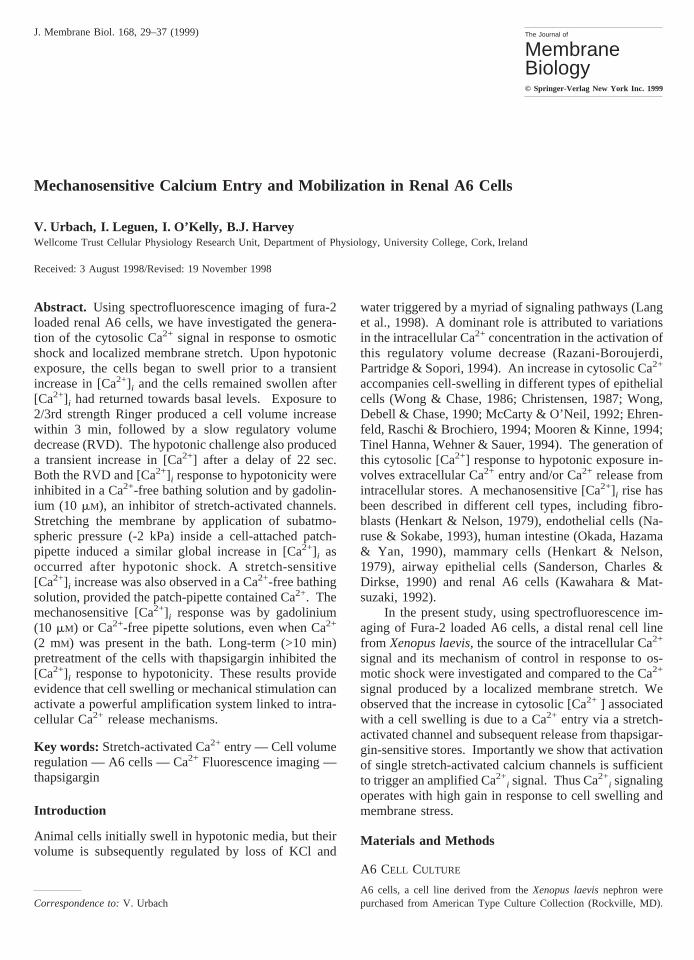
The role of stretch-activated Ca2+ channels in the cal-cium response, was examined by testing the effect oflocalized stretch of the membrane on [Ca2+] i. We showthat suction inside a cell-attached patch-pipette causes atransient increase in intracellular calcium (Fig. 6A). Thedata are summarized in Table 1. Intracellular [Ca2+] in-
creased 3-fold within 1 sec of application of membranestretch and subsequently decreased within 30 sec to aplateau value 2-fold higher (296 ± 16 nM, n 4 10) thanbasal while the stretch was maintained. The calcium re-sponse occurred instantaneously with the onset of mem-brane stretch and was transient despite the maintenanceof stretch (Fig. 6A). In the first seconds of membranestretch, the increase in [Ca2+] i was localized under thepatch pipette, before spreading rapidly to more distantregions within the cell (Fig. 6B).
EFFECTS OFEXTERNAL Ca2+AND GADOLINIUM ON THE
STRETCH-ACTIVATED Ca2+ RESPONSE
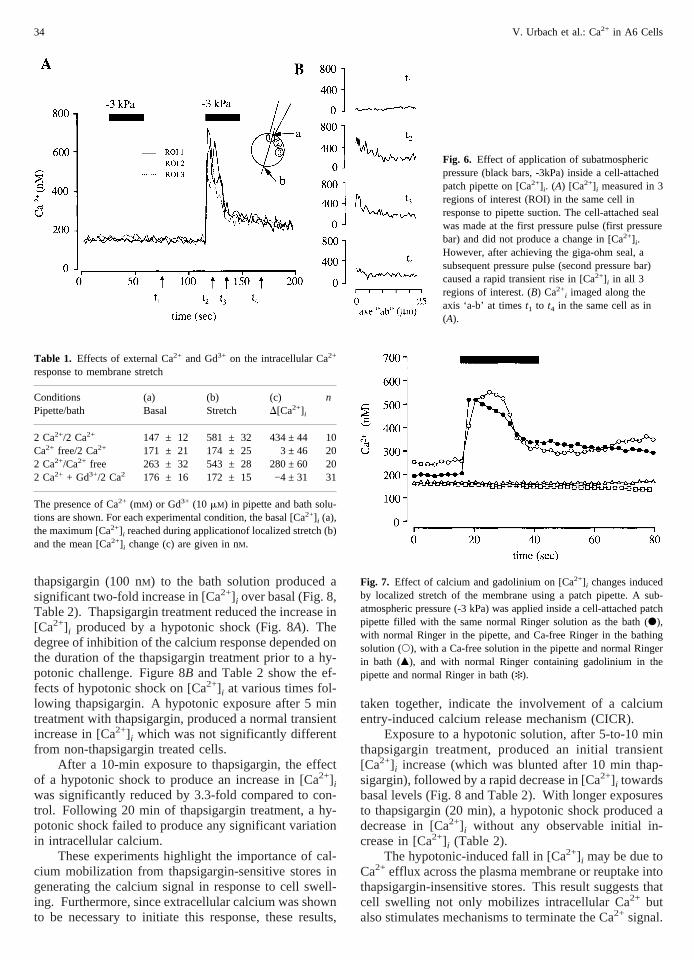
The role of external Ca2+ in the mechanosensitive cal-cium response was investigated using Ca2+-free Ringersolution in the patch pipette. The increase in [Ca2+] i nor-mally elicited by membrane stretch was not observedwhen the patch pipette contained a Ca2+-free Ringer so-lution (cells bathed in standard Ringer solution) (Fig. 7,Table 1). Thus, the stretch-induced increase in intracel-lular [Ca2+] was absolutely dependent upon the presenceof Ca2+ in the patch-pipette solution.
These results suggest the involvement of stretch-activated channels in the calcium response to membranedeformation. In addition, a highly localized Ca2+ entrythrough mechanosensitive channels appears sufficient totrigger a global cytosolic increase in Ca2+ following me-chanical stretching of the membrane patch. As shown inFig. 7 and summarized in Table 1, a twofold increase in[Ca2+] i over basal could be produced by stretching asmall area of cell membrane even when the bath solutiondid not contain Ca2+, provided Ca2+ was present in thepatch pipette.
The role of the stretch-activated channel in this re-sponse was further investigated using Gd3+. The effectof localized membrane stretch to produce an increased[Ca2+] i was completely abolished by adding Gd3+ (10mM) to the patch-pipette solution (Fig. 7, Table 1).
This results indicate that calcium entry throughstretch-activated, calcium permeable and Gd3+ -sensitivechannels triggers a powerful amplification system to pro-duce a global cytosolic change in [Ca2+] i.
THAPSIGARGIN EFFECT ON[Ca2+] i
Our finding, that exposure to a calcium-free solution orto gadolinium did not completely abolish the [Ca2+] i re-sponse to hypotonic shock, indicates that extracellularCa2+ is not the unique source for the increased [Ca2+] i
following cell swelling. Intracellular Ca2+ stores mustalso be implicated in generating the volume and mecha-nosensitive Ca2+
i signal. To test this hypothesis, we in-vestigated the effect of cell swelling on [Ca2+] i in A6cells after treatment with thapsigargin, an inhibitor of theCa-ATPase pump in endoplasmic reticulum. Addition of
Fig. 5. Gadolinium (10mM) effect on fura-2 fluorescence intensity at340 and 380 nm in response to a hypotonic shock (2/3rd strengthRinger) with Ca2+ in the bathing solution in a cell where the [Ca2+] i
level did not change. The decrease of fluorescence intensity at 340 and380 nm indicated the dilution of the dye due to the cell swelling.
33V. Urbach et al.: Ca2+ in A6 Cells
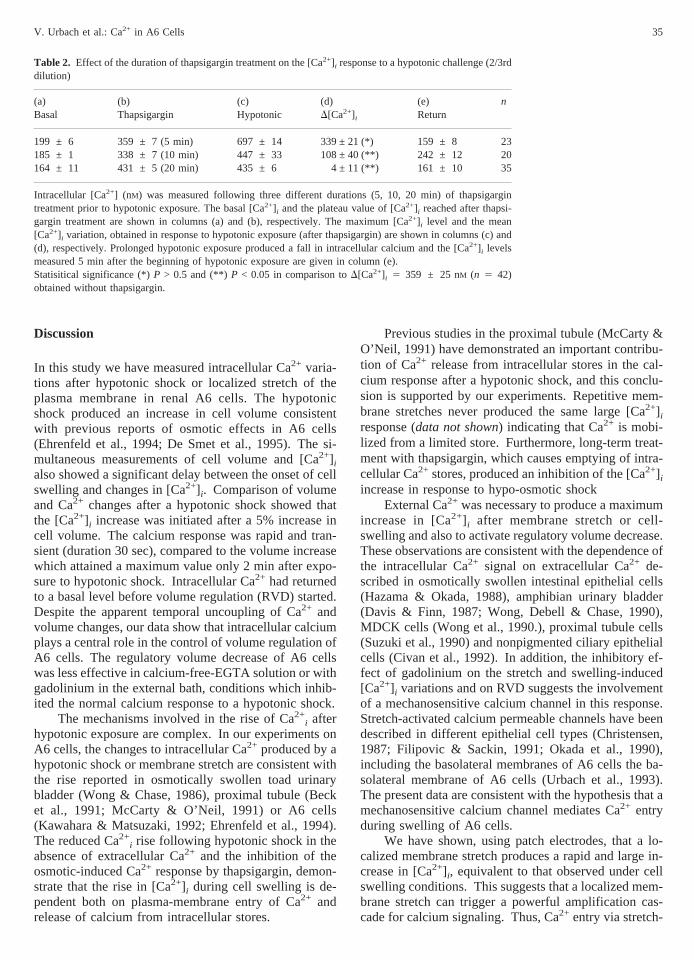
thapsigargin (100 nM) to the bath solution produced asignificant two-fold increase in [Ca2+] i over basal (Fig. 8,Table 2). Thapsigargin treatment reduced the increase in[Ca2+] i produced by a hypotonic shock (Fig. 8A). Thedegree of inhibition of the calcium response depended onthe duration of the thapsigargin treatment prior to a hy-potonic challenge. Figure 8B and Table 2 show the ef-fects of hypotonic shock on [Ca2+] i at various times fol-lowing thapsigargin. A hypotonic exposure after 5 mintreatment with thapsigargin, produced a normal transientincrease in [Ca2+] i which was not significantly differentfrom non-thapsigargin treated cells.
After a 10-min exposure to thapsigargin, the effectof a hypotonic shock to produce an increase in [Ca2+] i
was significantly reduced by 3.3-fold compared to con-trol. Following 20 min of thapsigargin treatment, a hy-potonic shock failed to produce any significant variationin intracellular calcium.
These experiments highlight the importance of cal-cium mobilization from thapsigargin-sensitive stores ingenerating the calcium signal in response to cell swell-ing. Furthermore, since extracellular calcium was shownto be necessary to initiate this response, these results,
taken together, indicate the involvement of a calciumentry-induced calcium release mechanism (CICR).
Exposure to a hypotonic solution, after 5-to-10 minthapsigargin treatment, produced an initial transient[Ca2+] i increase (which was blunted after 10 min thap-sigargin), followed by a rapid decrease in [Ca2+] i towardsbasal levels (Fig. 8 and Table 2). With longer exposuresto thapsigargin (20 min), a hypotonic shock produced adecrease in [Ca2+] i without any observable initial in-crease in [Ca2+] i (Table 2).
The hypotonic-induced fall in [Ca2+] i may be due toCa2+ efflux across the plasma membrane or reuptake intothapsigargin-insensitive stores. This result suggests thatcell swelling not only mobilizes intracellular Ca2+ butalso stimulates mechanisms to terminate the Ca2+ signal.
Fig. 6. Effect of application of subatmosphericpressure (black bars, -3kPa) inside a cell-attachedpatch pipette on [Ca2+] i. (A) [Ca2+] i measured in 3regions of interest (ROI) in the same cell inresponse to pipette suction. The cell-attached sealwas made at the first pressure pulse (first pressurebar) and did not produce a change in [Ca2+] i.However, after achieving the giga-ohm seal, asubsequent pressure pulse (second pressure bar)caused a rapid transient rise in [Ca2+] i in all 3regions of interest. (B) Ca2+
i imaged along theaxis ‘a-b’ at timest1 to t4 in the same cell as in(A).
Table 1. Effects of external Ca2+ and Gd3+ on the intracellular Ca2+
The presence of Ca2+ (mM) or Gd3+ (10 mM) in pipette and bath solu-tions are shown. For each experimental condition, the basal [Ca2+] i (a),the maximum [Ca2+] i reached during applicationof localized stretch (b)and the mean [Ca2+] i change (c) are given in nM.
Fig. 7. Effect of calcium and gadolinium on [Ca2+] i changes inducedby localized stretch of the membrane using a patch pipette. A sub-atmospheric pressure (-3 kPa) was applied inside a cell-attached patchpipette filled with the same normal Ringer solution as the bath (d),with normal Ringer in the pipette, and Ca-free Ringer in the bathingsolution (s), with a Ca-free solution in the pipette and normal Ringerin bath (m), and with normal Ringer containing gadolinium in thepipette and normal Ringer in bath (✻).
34 V. Urbach et al.: Ca2+ in A6 Cells
Discussion
In this study we have measured intracellular Ca2+ varia-tions after hypotonic shock or localized stretch of theplasma membrane in renal A6 cells. The hypotonicshock produced an increase in cell volume consistentwith previous reports of osmotic effects in A6 cells(Ehrenfeld et al., 1994; De Smet et al., 1995). The si-multaneous measurements of cell volume and [Ca2+] i
also showed a significant delay between the onset of cellswelling and changes in [Ca2+] i. Comparison of volumeand Ca2+ changes after a hypotonic shock showed thatthe [Ca2+] i increase was initiated after a 5% increase incell volume. The calcium response was rapid and tran-sient (duration 30 sec), compared to the volume increasewhich attained a maximum value only 2 min after expo-sure to hypotonic shock. Intracellular Ca2+ had returnedto a basal level before volume regulation (RVD) started.Despite the apparent temporal uncoupling of Ca2+ andvolume changes, our data show that intracellular calciumplays a central role in the control of volume regulation ofA6 cells. The regulatory volume decrease of A6 cellswas less effective in calcium-free-EGTA solution or withgadolinium in the external bath, conditions which inhib-ited the normal calcium response to a hypotonic shock.
The mechanisms involved in the rise of Ca2+i after
hypotonic exposure are complex. In our experiments onA6 cells, the changes to intracellular Ca2+ produced by ahypotonic shock or membrane stretch are consistent withthe rise reported in osmotically swollen toad urinarybladder (Wong & Chase, 1986), proximal tubule (Becket al., 1991; McCarty & O’Neil, 1991) or A6 cells(Kawahara & Matsuzaki, 1992; Ehrenfeld et al., 1994).The reduced Ca2+
i rise following hypotonic shock in theabsence of extracellular Ca2+ and the inhibition of theosmotic-induced Ca2+ response by thapsigargin, demon-strate that the rise in [Ca2+] i during cell swelling is de-pendent both on plasma-membrane entry of Ca2+ andrelease of calcium from intracellular stores.
Previous studies in the proximal tubule (McCarty &O’Neil, 1991) have demonstrated an important contribu-tion of Ca2+ release from intracellular stores in the cal-cium response after a hypotonic shock, and this conclu-sion is supported by our experiments. Repetitive mem-brane stretches never produced the same large [Ca2+] i
response (data not shown) indicating that Ca2+ is mobi-lized from a limited store. Furthermore, long-term treat-ment with thapsigargin, which causes emptying of intra-cellular Ca2+ stores, produced an inhibition of the [Ca2+] i
increase in response to hypo-osmotic shockExternal Ca2+ was necessary to produce a maximum
increase in [Ca2+] i after membrane stretch or cell-swelling and also to activate regulatory volume decrease.These observations are consistent with the dependence ofthe intracellular Ca2+ signal on extracellular Ca2+ de-scribed in osmotically swollen intestinal epithelial cells(Hazama & Okada, 1988), amphibian urinary bladder(Davis & Finn, 1987; Wong, Debell & Chase, 1990),MDCK cells (Wong et al., 1990.), proximal tubule cells(Suzuki et al., 1990) and nonpigmented ciliary epithelialcells (Civan et al., 1992). In addition, the inhibitory ef-fect of gadolinium on the stretch and swelling-induced[Ca2+] i variations and on RVD suggests the involvementof a mechanosensitive calcium channel in this response.Stretch-activated calcium permeable channels have beendescribed in different epithelial cell types (Christensen,1987; Filipovic & Sackin, 1991; Okada et al., 1990),including the basolateral membranes of A6 cells the ba-solateral membrane of A6 cells (Urbach et al., 1993).The present data are consistent with the hypothesis that amechanosensitive calcium channel mediates Ca2+ entryduring swelling of A6 cells.
We have shown, using patch electrodes, that a lo-calized membrane stretch produces a rapid and large in-crease in [Ca2+] i, equivalent to that observed under cellswelling conditions. This suggests that a localized mem-brane stretch can trigger a powerful amplification cas-cade for calcium signaling. Thus, Ca2+ entry via stretch-
Table 2. Effect of the duration of thapsigargin treatment on the [Ca2+] i response to a hypotonic challenge (2/3rddilution)
Intracellular [Ca2+] (nM) was measured following three different durations (5, 10, 20 min) of thapsigargintreatment prior to hypotonic exposure. The basal [Ca2+] i and the plateau value of [Ca2+] i reached after thapsi-gargin treatment are shown in columns (a) and (b), respectively. The maximum [Ca2+] i level and the mean[Ca2+] i variation, obtained in response to hypotonic exposure (after thapsigargin) are shown in columns (c) and(d), respectively. Prolonged hypotonic exposure produced a fall in intracellular calcium and the [Ca2+] i levelsmeasured 5 min after the beginning of hypotonic exposure are given in column (e).Statisitical significance (*)P > 0.5 and (**) P < 0.05 in comparison toD[Ca2+] i 4 359 ± 25 nM (n 4 42)obtained without thapsigargin.
35V. Urbach et al.: Ca2+ in A6 Cells
sensitive calcium channels may provide the initial cal-cium signal to produce stimulation of calcium releasefrom thapsigargin-sensitive stores (calcium-entry-induced calcium release “CICR”). The calcium sensitiv-ity of IP3-sensitive receptors of calcium stores (Lino,1990) could also be implicated in this phenomenon.CICR may also be reinforced by Ca2+
i effects on calciumentry across the plasma membrane (Calcium-ReleaseActivated Calcium entry “CRAC”), and by the positivefeedback effect of depletion of calcium stores on Ca2+
entry (capacitive calcium entry “CCE”) as proposed inexcitable and nonexcitable cells (Randriamampita &Tsien, 1993; Razani-Boroujerdi, Partridge & Sopori,1994). Cell swelling and membrane stretch may also ac-tivate other mechanosensitive transduction pathwayswhich mobilize Ca2+ from cytosolic stores. In Ehrlichcells and cardiomocytes, cell-swelling or membranestretch induces IP3 production (Dassouli et al., 1993;Svane & Hoffmann, 1992). Thus, a mechanosensitiveIP3 synthesis may act synergistically with calcium entryto stimulate calcium mobilization from intracellularstores during cell swelling, thus amplifying the calciumsignal initiated by calcium entry through stretch-sensitive channels.
In summary, we have shown that mechanical stimu-lation of a small patch of membrane can activate a globalrise in intracellular Ca2+, indicating a powerful amplifi-cation system linked to intracellular Ca2+ release mecha-nisms. We conclude that a mechanosensitive calciumentry is the pathway for Ca2+ signaling during cell swell-ing in A6 cells. However, the calcium response is tran-sient and terminated before regulatory volume decreaseoccurs. The calcium signal may, therefore, be permis-sive for RVD while other mechanosensitive events (e.g.,cytoskeleton reorganization) intervene in producing afull RVD response.
This research was funded by grants from The Wellcome Trust U.K.
(program grant 040067/Z/93) and The Cystic Fibrosis Association ofIreland.
References
Beck, J.S., Breton, S., Laprade, R., Giebisch, G. 1991. Volume regu-lation and intracellular calcium in the rabbit proximal convolutedtubule.Am. J. Physiol.260:F861–F867
Christensen, O. 1987. Mediation of cell volume regulation by Ca2+
influx through stretch-activated channels.Nature330:66–68
Civan, M.M., Peterson-Yantorno, K., Coca-Prados, M., Yantorno, R.E.1992. Regulatory volume decrease by cultured non-pigmented cili-ary epithelial cells.Exp. Eye Res.54:181–191
Dassouli, A., Sulpice, J.C., Roux, S., Crozatier, B. 1993. Stretch-induced inositol triphosphate and tetrakisphosphate production inrat cardiomyocytes.J. Mol. Cell. Cardiol.25:973–982
Davis, C.W., Finn, A.L. 1987. Interactions of sodium transport, cellvolume and calcium in frog urinary bladder.J. Gen. Physiol.89:687–702
De Smet, P., Simaels, J., Declerq, P.E., Van Driessche, W. 1995. Regu-latory Volume Decrease in cultured kidney ells (A6): Role ofAmino Acids.J. Gen. Physiol.106:525–542
Ehrenfeld, J., Raschi, C., Brochiero, E. 1994. Basolateral potassiummembrane permeability of A6 cells and cell volume reglation.J.Membrane Biol.138:181–195
Filipovic, D., Sackin, H. 1991. A calcium permeable stretch activatedcation channel in renal proximal tubule.Am. J. Phisiol.269:F119–F129
Grynkeiwicz, G., Poenie, M., Tsien, R.Y. 1985. A new generation ofcalcium indicators with greatly improved fluorescence properties.J. Biol. Chem.260:3440-3450
Hazama, A., Okada, Y. 1988. Ca2+ sensitivity of volume-regulatory K+
and Cl− channels in cultured human epithelial cells.J. Physiol.402:687–702
Henkart, M.P., Nelson, P.G. 1979. Evidence for an intracellular cal-cium store releasable by surface stimuli in fibroblasts (Lcells).J.Gen. Physiol.73:655-673
Kawahara, K., Matsuzaki, K. 1992. Activation of calcium channel byshear-stress in cultured renal distal tubule cells.Biochem. Biophys.Res. Com.184:198-205
Fig. 8. Thapsigargin (100 nM) effect on theswelling induced [Ca2+] i increase. Typical calciumresponse in a single A6 cell exposed to ahypotonic solution (2/3rd) 10 min afterthapsigargin treatment. Note the rapid decrease in[Ca2+] i induced by hypotonic shock.
36 V. Urbach et al.: Ca2+ in A6 Cells
Lang, F., Busch, G.L., Ritter, M., Volki, H., Wladegger, S., Gulbins, E.,Haussinger, D. 1998. Functional significance of cell volume regu-latory mechanisms.Physiol. Rev.78:247–306
Lino, M. 1990. Biphasic Ca2+ dependence of inositol triphosphate in-duced release in smooth muscle cells of the guinea pig taenia caeci.J. Gen. Physiol.95:1103–1122
McCarty, N., O’Neil, R.G. 1991. Calcium dependant control of volumeregulation in renal proximal tubule cells I. Swelling-activated Ca2+
entry and release.J. Membrane Biol.123:149–160McCarty, N., O’Neil, R.G. 1992. Calcium signaling in cell volume
regulation.Physiol. Rev.72:1037–1061Mooren, F.C., Kinne, R.K.H. 1994. Intracellular calcium in primary
cultures of rat renal medullary collecting duct (IMCD) cells duringvariations of extracellular osmolality.Pfluegers Arch.427:463–472
Naruse, K., Sokabe, M. 1993. Involvement of stretch-activated ionchannels in Ca2+ mobilization to mechanical stretch in endothelialcells.Am. J. Physiol.264:37–44
Okada, Y., Hazama, A., Yan, W.L. 1990. Stretch-induced activation ofCa2+-permeable ion channels is involved in the volume regulationof hypotonically swollen epithelial cells.Neurosc. Res.Suppl.12:S5–S13
Randriamampita, C., Tsien, R.Y. 1993. Empying of intracellular Ca2+
stores releases a novel small messenger that stimulates Ca2+ influx.Nature364:809–814
Razani-Boroujerdi, S., Partridge, L.D., Sopori, M.L. 1994. Intracellularcalcium signaling induced by thapsigargin in excitable and inexcit-able cells.Cell Calcium16:467–474
Ross, P.E., Cahalan, M.D. 1995. Ca2+ influx pathways mediated byswelling or stores depletion in mouse thymocytes.J. Gen. Physiol.106:415–444
Sanderson, M.J., Charles, A.C., Dirkse, E.R. 1990. Mechanical stimu-lation and intercellular communication increases intracellular Ca2+
in epithelial cells.Cell Regulation1:585–596
Suzuki, M., Kawahara, K., Ogawa, A., Morita, T., Kawaguchi, Y.,Kurihara, S., Sakai, O. 1990. [Ca2+] i rises via G protein duringregulatory volume decrease in rabbit proximal tubule cells.Am. J.Physiol.258:F690–F696
Svane, P.C., Hoffmann, E.K. 1992. Formation of inositol (1,4,5) phos-phate following hypotonic shock or agonist stimulation of theEhrlich mouse ascites tumor cell, demonstrated by HPLC.ActaPhysiol. Scand.146 (suppl.608):205
Tinel, H., Wehner, F., Sauer, H. 1994. Intracellular Ca2+ release andCa2+ influx during regulatory volume decrease in MDCK cells.Am.J. Physiol.267:F130–F138
Urbach, V., Andersen, H., Hall, J.A., Harvey, B.J. 1993. A calciumpermeable cation channel activated by membrane stretch and cellswelling in renal A6 and frog skin epithelia.J. Physiol.467:273P
Wong, S.M.E., Chase, H.S. 1986. Role of intracellular calcium in cel-lular volume regulation.Am. J. Physiol.250:C841–C852
Wong, S.M.E., Debell, M.C., Chase, H.S. 1990. Cell swelling increasesintracellular free [Ca2+] in cultured toad bladder cells.Am. J. Phys-iol. 258:F292–F296.