The paper analyses media consumption in Russia and media business strategies.The authors describe the media environment and identify the central trends typicalof the transition to digital communication in society. The research approach impliesevaluating the volume and distinguishing features of information consumptionusing the main media resources (the Internet, television, radio and print media).The information and empirical base of the research include the data of theMediascope analytical agency, the statistical data provided by the Russian FederalState Statistic Service (Rosstat) and the results of research studies performed byconsulting companies for the period of 2003-2017/2018. The paper presents thedynamics and specificity of transformation in the media environment and discussesa range of trends in media consumption: such as communication technologydevelopment; changes in the structure of media consumption; an increase in onlineadvertising; a gradual transformation of media, etc. The results obtained showthat the share of organizations and households in Russia that use the Internet intheir work is constantly growing, but this growth is uneven and heterogeneous.Our findings prove that there are age (generation) differences in using traditionaland new media, and the frequency of using information resources is changing.
Keywords: Media consumption, information, digital environment, media business,public communication
Correspondence to: Oksana V. Tretyakova, Department of Marketing and municipalmanagement, Tyumen Industrial University, 38 Volodarskogo Str., Tyumen, 625000,Russian Federation.
The crucial processes happening in mass media today are convergence, the emergence ofnew forms of media and globalization. All of them require business models of media to beadapted to the conditions of digital reality, as well as the search and choice of new strategicsolutions (Müller-Lietzkow, 2014). Digital technologies transformed the practice of mediaconsumption through rethinking the orthodox ideas of media as channels and improvedthe availability of media content on various technological platforms (Poluekhtova, 2016).The audience was granted more opportunities to choose not only the content but also theways to consume it. The practices of media consumption became more individualized andvariable, and the audience turned out to be even more fragmented.
The communication technologies applied form some kind of media environment(media space) of society. On the one hand, the transformation of the media environment isa result of the social power’s influence on introducing such communication innovation.The central avenue of innovation development in the field of mass communication is
197
198
Journal of Communication: Media Watch 10 (2)
attributed to the development of digital technologies. On the other hand, this is the mostimportant factor in social transformations, since it changes people’s lifestyles, socialpractices and, as a result, individual mindsets and the ways to perceive the world(Kolomiets, 2010). Undoubtedly, the media environment is a factor of individualization,which partly explains the growing fragmentation of society.
The multidimensional nature of the media space made social practices moreselective, dynamic and innovative. Thus, we can discover age (generational) features ofusing traditional and new forms of media; information resources are used more frequentlyand widely; preferences for the media source are transformed, etc. We support the view ofMalyuchenko (2008), who claims that, despite its relevance, the problem of developing anindividual and group culture of media consumption is still one of the most poorly studiedtopics. Yessenbekova (2015) explores the role of media culture as a source for the restorationand preservation of national traditions to give future generations the information ofhistorical and cultural past nation. Against the backdrop of media addiction expanding atan epidemic pace, the range of studies looking at the applied development of a culture ofmedia consumption and its impact on human potential is very scarce (for more details, see(Allabouche et al., 2016)).
Under these severe conditions, communication technologies are evolving andacquiring new features. Over the past decade, the structure of media consumption haschanged significantly due to some factors, such as digitalization of society life, enhancingthe availability of personal devices that facilitate access to information, etc. According tothe data of the consulting company Delloitte (2017), there is a general continuing steadygrowth in the volume of media consumption. It is typical of such resources like the Internetand video games. The opposite trend of falling media consumption is characteristic ofprint media, television and radio. The increasing time of using personal devices, such assmartphones, tablets, laptops, etc., exerts a marked effect on the trends in mediaconsumption. As a result, the proliferation of mobile devices and the growing internetconnection speed enhance the time spent by users on searching or consuming newinformation. These and other reasons highlight the special relevance of studying mediaconsumption.
One of the primary problems with the applied research on modern media is ahuge amount of data on media consumption circulating in the market (Poluekhtova, 2016).Therefore, the main purpose of the current research is to investigate the trends in mediaconsumption and media business strategies in the digital environment. To achieve thestated purpose, we aim to fulfil the following scientific tasks: to examine the mainapproaches to defining the term “media consumption”; to develop a system of indicatorsto evaluate the empirical data; to analyze media consumption in Russia and identify itsdominant trends, and to discuss the respond of media business to these changes.
Literature Review
Media consumption is viewed as a social practice of using communication means (media).The object of media consumption is a symbolic material that can be “infused” in variousmedia products: texts, musical pieces, and video products and delivered using varioustechnical (media) means (Kolomiets, 2010).
In recent years, the issue of media consumption has been addressed by suchscholars as Bakulev (2008), Vartanova (2009), Kolomiets (2010), Krivosheev and Fedunin(2000), Yessenbekova (2018a, 2018b), Muzikant (2014) et al. For instance, Kolomiets (2010)defines media consumption as a field of media sociology that embraces various practices
199
Tretyakova et al
of information product consumption. In a narrow sense, he looks at media consumptionas a practice of using media to gain information and utilize it for social interaction. Suchan interpretation allows concluding that individuals operate information to meet theirneeds and achieve their objectives.
Seufert and Wilhelm (2009) view media consumption as a “job” that an individualperforms to assign some kind of “cultural capital” to climb up the social ladder. This iswhat enhances the social baggage of the individual allowing them to achieve somerecognition. A team of US scientists (Sundar, 2015) defines media consumption as the artof using a limited number of sources (repertoires) among their wide variety. They introducea new term “egocasting,” which means choosing only those information sources that provideinformation in compliance with one’s standpoint.
Przywara (2012) explores the effect of media on public consciousness. As inthe process of media consumption individuals perceive information through the prismof only those sources that are in line with their opinion, they are unable to graspalternative information. In our view, such an influence is especially dangerous duringthe “information war,” since news agencies get an opportunity to give information acertain emotional and semantic color that is designed to attract those people who adhereto the same point of view.
It is noteworthy that the media consumption market is experiencing a noveltrend called “media multitasking” (Roberts and Foehr, 2008). This phenomenon impliesthe simultaneous use of media resources to meet one’s communication needs. The tworesearchers study the relationship between media consumption and media influence. Theyfind that an average person spends 8.5 hours a day on consuming media information,which hurts their social and economic life reducing the time of interacting within society.This thesis was first presented by American researchers (Klein et al., 1993). In their work,they point out that frequent media exposure negatively affects the psychological state ofyoung people, as well as their social behavior. The influence of media exposure frequencyon the psychological state of people is also addressed in the works by Baker and Algorta(2016), Wilmer and Chein (2016), et al. According to Hunt et al. (2018), the frequent use ofsocial media, such as Instagram, Snapchat, etc. causes depression in adolescents. Thisconclusion was confirmed during the empirical survey of respondents.
Urban (1981) analyses the relationship between the preferences of differentgenerations and the level of media consumption. Since representatives of the samegeneration exhibit similar behavioral characteristics, the author hypothesizes thatinformation perception and resources for gaining it are predetermined by the features ofthis or that generation. From the perspective of generation theory, Russia is a well-knownphenomenon for researchers (Semenova, 2001). This is due to some reasons, such as, forexample, a strong differentiation in society (Barsenkov, Vdovin, 2010). Therefore, Russia ischaracterized by not only gross digital inequality (as in the countries with an undevelopedpost-industrial economy), but also by an active struggle for access to information (as inthe countries with the most developed information economies), which is especiallyimportant when studying the digital generation.
A high level of technological literacy inherent in the digital generation allowsnot only applying the full range of Internet capabilities and its key services, regarding itas the main source of information and a platform for interaction but also setting mediaconsumption trends and formulating new basic information needs. In 2017, KantarMillward Brown (2017) published the results of a global study ‘AdReaction: EngagingGen X, Y, and Z.’
200
Journal of Communication: Media Watch 10 (2)
The data obtained during the empirical research proved that young peoplebehaved differently if compared to the older generation; however, real differences observedwere often contrasting to the stereotypes. For instance, the active TV audience amongyoung people is rather big (63%), and according to this indicator, they are not inferior tothe middle age group. At that, the audiences of Z- and Y-generations are likely to besignificantly heterogeneous. Such a conclusion is made after comparing the AdReactionresearch data and the findings of the Mediascope TV viewing evaluation. In Russia, mediaconsumption about generation differences are explored by Amzin et al. (2016), Kolomiets(2010), Nazarov et al. (2014); however, their research approach is not yet widespread.
Materials and Methods
Measuring the audience plays a special role in the industry providing media business withthe necessary data (Napoli, 2003; Webster, 2006). Digitalization of media required themethods of media measurement to be revised, as well as to resolve a range of practicalissues associated with the process of data collection, data sampling and searching forrepresentative approaches to assessing current trends. Traditional techniques of measuringthe audience of mass media are based on a classical sociological methodology of empiricalresearch. These are extensive surveys which involve large samples. The most criticizedfeature of such studies is their selective nature. As Napoli (2003) finds, the measuredaudience is only a form of an “audience product” that is produced by mass media inconcert with the measuring company. The measured audience can be viewed only as acertain estimate of the real audience’s volume. The current problem is not only due to themeasurement procedure based on a sampling, the plausibility of which can vary. Thequestion is that in the process of assessing/analyzing the audience, an advertiser dealswith three different types of it: predicted, measured and real. One can only assume thedifferences between them; however, it is rather difficult to evaluate the degree and depth ofthese differences (Vartanova, 2011).
In the context of the digital environment, one of the prospects for mediameasurements is to take advantage of the opportunity to use digital statistics in industrialmeasurement systems. In contrast to sample surveys, the new tools, such as web analyticsand PRD, allow collecting complete and detailed data. Kolomiets (2014) believes that it isnecessary to move from measuring the audience to measuring the content regardless of itsdistribution environment.
To detect the main trends in media consumption in Russia, we analyzed thevolumes and special characteristics of information consumption through the main mediasources (the Internet, television, radio and print media). To do this, we developed a systemof indicators that are divided into three types presented in Figure 1.
201
Tretyakova et al
Figure 1. Indicators of media consumption evaluation
The information-empirical base of the study includes the data of the Mediascopeanalytical agency, the statistical data of Federal State Statistics Service (Rosstat) and theresults of research studies performed by consulting companies.
Within the framework of the present study, the methods of dynamics and structureanalysis (Polyakova and Shabrova, 2015) were applied. To establish the differences instructures, the integral coefficients of structural proposed by Salai, Gatev, and Ryabtsevare applied. In the current paper, we use the Ryabtsev index, since it is the most preferablein terms of economic interpretation. It does not inflate structural changes and does notdepend on the number of gradations. The index is calculated by the formula:
22 1
22 1
( )( )p
d i d iI
d i d i
(1)
To interpret the results, the scale for assessing the significance of differences instructures proposed by V.M. Ryabtsev is used (Table 1).
To determine the indicators characterizing the measure of central distribution,it is necessary to use formulas for calculating the modal and median values in the interval:
1
0 01 1
m m
m m m m
f fM x nf f f f
(2)
Table 1. Interpretation of the values of the Ryabtsev indexCriterion Interpretation0.0000 – 0.003 Structure identity0.0031 – 0.007 Very low level of difference0.0071 – 0.150 Low level of difference0.151 – 0.300 Moderate level of difference0.301 – 0.500 A significant level of difference0.501 – 0.700 A very significant level of difference0.701 – 0.900 Opposite structures0.901 and above Absolutely opposite structures
202
Journal of Communication: Media Watch 10 (2)
The data presented above show that radio coverage of the Russian populationis gradually decreasing. The most significant decline in 2017 compared to 2013 wascharacteristic of the Southern Federal District (–21%) and the Far Eastern FederalDistrict (–20%). According to the data of Mediascope, 72% of the broadcasting timewas dedicated to music and musical programs, 6% – social programs, 5% – news, 4% –infotainment, 3% – art programs, 11% – other. Thus, we can assert that musical andinfotainment programs are the most popular among radio listeners, which can be dueto the age composition of the radio audience. The biggest group of radio listeners ispeople aged 30-39 with higher education.
Table 3 presents the changes in the number of personal computers with internetaccess by federal districts (FD).
Table 2. Radio coverage of the Russian population in 2013-2017, %Region 2013 2014 2015 2016 2017The Russian Federation, 92.2 87.9 85.8 82.6 82.5inc luding:Central FD 95.2 92,.4 90.5 89.5 88.6Northwest FD 95.9 95.0 93.4 91.9 90.7Southern FD 83.2 86.9 79.0 67.7 65.9North Caucasus FD 88.9 84.9 79.8 80,2 80.1Ural FD 90.2 84.4 86.9 83.9 81.8Siberian FD 93.2 86.4 84.0 81.5 82.2Far Eastern FD 94.9 81.1 77.9 73.9 75.6Source: the data of Rosstat
Table 3. The number of personal computers with internet access (per 100 employees)Region 2013 2014 2015 2016 2017Central FD 31 36 38 39 40Northwest FD 28 32 32 34 36Southern FD 26 25 27 28 30North Caucasus FD 21 23 25 26 28Volga FD 23 26 26 29 30Ural FD 22 25 26 28 29Siberian FD 25 28 30 31 32Far Eastern FD 24 27 30 31 32Crimean FD - 15 23 - -Source: the data of Rosstat
1
02
im
em
f SM x h
f
(3)
To determine the strength of the relationship, we apply paired Pearson correlationcoefficient (4):
1
**x y
xy x yr
(4)
Results
The evaluation of media consumption was carried out by the developed system of indicators.Table 2 presents the radio coverage of the Russian population by federal districts (FD).
203
Tretyakova et al
Table 3 demonstrates that the largest number of personal computers isconcentrated in the Central Federal District, and the smallest number – in the North CaucasusFederal District, which is attributed to a traditional form of households.
The share of organizations using the Internet in their work is gradually increasing.This trend is typical of the Central Federal District (an increase from 87.9% in 2013 to92.4% in 2017), the Northwest Federal District (93.3%) and the Far Eastern Federal District(93.3%). At the same time, internet usage decreased in organizations located in the SiberianFederal District (from 85% in 2013 to 84.2 in 2017), the Ural Federal District (88.6%), theVolga Federal District (88.7%) and the North Caucasus Federal District (85.9%).
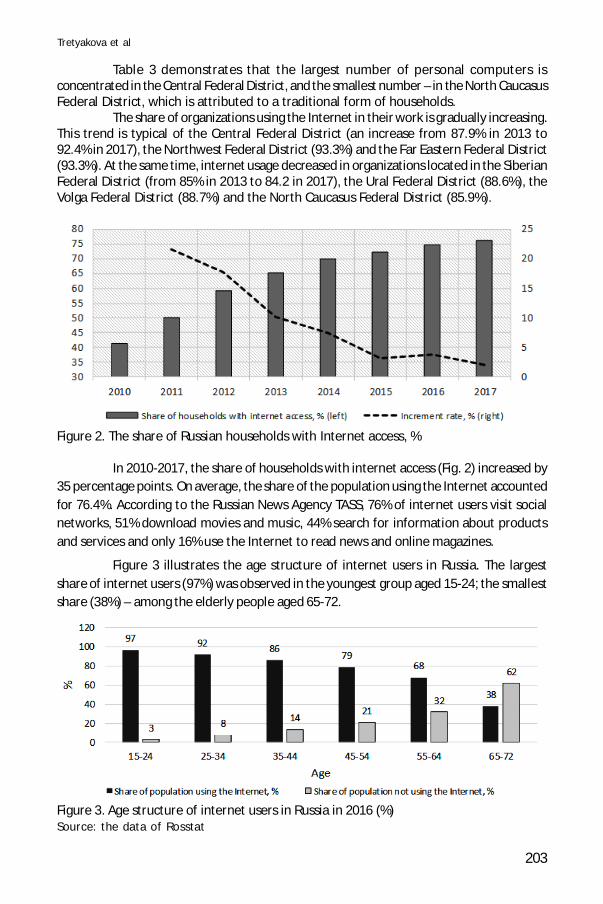
Figure 2. The share of Russian households with Internet access, %
In 2010-2017, the share of households with internet access (Fig. 2) increased by35 percentage points. On average, the share of the population using the Internet accountedfor 76.4%. According to the Russian News Agency TASS, 76% of internet users visit socialnetworks, 51% download movies and music, 44% search for information about productsand services and only 16% use the Internet to read news and online magazines.
Figure 3. Age structure of internet users in Russia in 2016 (%)Source: the data of Rosstat
Figure 3 illustrates the age structure of internet users in Russia. The largestshare of internet users (97%) was observed in the youngest group aged 15-24; the smallestshare (38%) – among the elderly people aged 65-72.
204
Journal of Communication: Media Watch 10 (2)
The statistics on Internet penetration demonstrate that today the Web is used bynot only the population who are the most adaptive to innovations, but also by thosedisplaying conservative behavior and wary of all new and unusual. The same applies topeople aged 60 and above. Such age groups need Internet usage to be considered commonpractice and be as simple as possible to start using it.
Table 4 presents the data for calculating the modal and median values of thenumber of Internet users in Russia. As seen from the Table, the modal interval matches theage group of 25-34; the median interval corresponds to the group of 35-44 years. Ourcalculations indicate that the most common age of internet users is 31 years. At that,based on the median value we can see that half of the population using the Internet isunder 39 years.
Table 4. The number of internet users in the Russian Federation in 2016
Age group The share of the population Population, thousands of The share of the population in physicalusing the Internet, % people terms, thousands of people
It is of particular interest to explore the influence of various factors on theshare of internet users. We believe that there is a significant correlation with the volumeof online advertising (Fig. 4). The graph shows that the dynamics of the development ofthe two phenomena have a similar upward trend. During the entire period under review,the percentage of the population using the Internet was gradually rising. The absoluteincrease in the period from 2003 to 2017 amounted to 66.5%. In physical terms, theabsolute increase of the Internet audience was equal to 97.8 million people; the largestabsolute increase happened in 2011 and equaled 12 million people; the smallest onewas in 2017 and amounted to 3.8 million people with an average absolute increase of 7million people a year.
Based on Rosstat data, we calculated that the absolute increase in the share ofinternet users with a fixed Internet connection in the period of 2011-2016 was 6.5% andthe average absolute increase was equal to 1.3% a year. As for the number of users with amobile internet connection, the situation is following. The absolute increase in the shareof subscribers for the period under study was 24.6%; the average absolute increase – 4.9%a year. The dynamics of both indicators looks similar, but the proportions in the totalpopulation with fixed and mobile access are very different. In 2016, the proportion of thelatter was almost four times the proportion of the fixed connection. It is worth noting thatsome users have both types of connection, which impedes data comparison.
205
Tretyakova et al
To determine the strength of the relationship between the indicators, we calculatelinear correlation coefficients to identify whether the proportion of regular internet users(x1) and frequent internet users (x2) affects the volume of online advertising (y). The sourcedata are processed in a statistics package; the calculated values are presented in Table 5.
Below we calculate the paired linear correlation coefficient to assess the strengthof the relationship between the resulting attribute and the proportion of regular internetusers.
1 0.921r We also present the calculations using a similar formula for assessing the
strength of the relationship between the resulting attribute and the proportion of frequentinternet users.
Multiple R 0,9352R square 0,8745Adjusted R square 0,8536Standard error 24,8560Observations 15
CoefficientsY-crossing -99,13Proportion of regular internet users (x1), % 6,33Proportion of frequent internet users (x2), % -4,24
Figure 4. Dynamics of the Internet audience and online advertising in 2003-2017Source: the data of Rosstat.
206
Journal of Communication: Media Watch 10 (2)
Next, we test the hypothesis about the significance of the correlation coefficientat the confidence level = 0.05. If |t| tcrit, hypothesis H0 is rejected. Calculations of tcrit areperformed using Student’s t-distribution. The mathematical formula for checking thehypotheses is the following:
0 1,2: 0H r – no correlation;
1 1,2: 0H r – significant correlation.Calculating to:
11 2 2
1
* 2 0.921* 15 2 8.507;1 1 0.921
r ntr
22 2 2
2
* 2 0.895* 15 2 7.222.1 1 0.895
r ntr
1 20,05, 13 2,164 ,critt t t
Since in both cases tcrit < t, then hypothesis H1 is accepted, which assumes thatthere is a correlation between the factor and resulting attributes. The hypothesis that thevolume of online advertising depends on the proportion of the population using the Internethas been confirmed.
In the first case, the linear correlation coefficient is equal to 0.921, which indicatesa very strong relationship between the attributes (0.9 <r1 <1). In the second case, thecorrelation coefficient is 0.895, which also indicates a strong relationship between theattributes (0.7 <r2 <0.9).
Figure 5. Dynamics of the volume of particular segments in the Russianadvertising market in 2003–2017, billion rubles
Source: the data of Rosstat
207
Tretyakova et al
Currently, there are two leading segments in the Russian advertising market, i.e.,TV and the Internet (Figure 5). The absolute increase in the first segment for 14 yearsaccounted to 139.1 billion rubles (from 31.8 to 170.9 billion rubles); the average annualincrease in the indicator is 12.0%. The absolute increase in the second segment for 14years amounted to 196.0 billion rubles (from 0.6 to 196.6 billion rubles); the averageannual increase in the indicator is 47.1%. Press and radio are the “second-tier” segments.The former demonstrates the worst dynamics since only this segment exhibits a fall in thevolume of advertising (a decrease of 14.6% as compared to the level in 2003).
The overall improvement in the volume of advertising is accompanied by thegrowing use of ad blockers: 37% of internet users in Russia block online ads (Deloitte,2018). Therefore, the business faces a question about how to return the target audienceand motivate them to stop using ad blockers. Users demonstrate disloyalty to all digitaladvertising formats. The more acceptable formats are commercials in the news feed insocial networks, static banners on websites and contextual advertising. Users display arelatively neutral attitude to native advertising, silent video banners, advertising in thetext of the article and pre-rolls. According to surveys conducted by Deloitte, TV advertisingis most effective for such categories as food products, drugs, household appliances; theInternet is especially effective for the categories of clothing, electronics and cosmetics/perfumes.
The Russian audience, if compared to the foreign one, demonstrate a morenegative attitude towards traditional advertising. For example, in Russia, 37% of respondentsof Generation Z are positive about TV advertising, whereas the average world rate is 48%.The difference in opinions of Generation Y in Russia and abroad is even more dramatic –34% and 53% respectively. Representatives of Generation X express the largest gap – 26%and 55%, respectively (Kantar Millward Brown, 2017).
To evaluate media consumption through the consumption of TV services, weanalyzed the number and the formats of available TV programs (Figure 6). We can see asubstantial decline in the proportion of people using analog terrestrial television in favorof the digital TV format. Radio is gradually becoming digital as well. The number of onlineradio listeners is growing.
Figure 6. Availability of various TV formats in Russia in 2010-2017, % Source: the data of Rosstat
208
Journal of Communication: Media Watch 10 (2)
The factors affecting the audience can be analyzed by various grounds (Sharikov,2002). These factors are covered in numerous publications by such Russian sociologistsas Kolomiets (2010), Poluekhtova (2009), Kovalev (2007), et al. At the same time, there is ascarce number of research on the external physical factors influencing the TV audience,which, among other things, embrace weather conditions.
Such factors are of profound importance for some countries, including Russia.Buzin, Korole, and Ostertag (2011) empirically revealed that weather conditions exert aninfluence on media consumption. At the same time, this impact may vary depending on theage group of the media audience. This influence is less significant than such factors as theattractiveness of the content, the number of TV channels received, etc.
The final indicator of the system developed to characterize media consumptionis the AIR index, i.e., the average number of readers per issue. According to the data of2017, among all the registered media, magazines accounted for 37%, newspapers – 28%,bulletins, and others – 5%. Thus, print media amounts to about 70% (Figure 7).
Figure 7. The share of mass media types registered in Russia(Source: the data of Rosstat)
Many experts note the decline in sales of periodicals (Lincényi and Fabuš, 2017)and their gradual transformation into the digital format. In 2018, the total number of pressconsumers in Russia amounted to about 51.4 million people (84.4%) (Web-Index, 2018).According to the survey, the main reasons behind choosing print media are the following:lack of information noise; safety and harmlessness to eyesight; the opportunity to fightagainst Internet addiction; better concentration on information.
Discussion
Nowadays, media consumption is an integral part of the modern lifestyle. Even though thequantity and diversity of media products grow every year, this sphere displays somesustainable trends that need to be studied more thoroughly. This situation is under theinfluence of a huge number of factors, the most important of which are the high rate ofchange and the ever-increasing flow of information. The fundamental shifts in the marketof media consumption in Russia are:
A growing volume of information;Instant news feed;Diverse topics of incoming and outgoing information;Simultaneous execution of several operations;A growing number of participants in information processing.
209
Tretyakova et al
The structure of media consumption is undergoing an extensive and rapid change,which requires an adequate reaction from both consumers and business. For example,personal devices have become widespread in the last decade; people receive informationnot from official sources anymore, but various applications such as Telegram, WhatsApp,Viber, VK, Instagram, etc. These programs allow not only getting information but alsosharing it. Communication trends, which stimulate interaction through chats and socialnetworks on mobile devices, are of particular importance since it affects the redistributionof media consumption. Thus, the rate of information exchange increases and mediarepresentatives should produce a faster response.
Not only mass media but also retail producers respond to the changes in thedistribution of information, the structure of media consumption and communication. Sinceprint ads do not reach consumers anymore, online contextual advertising, targeted advertisingin news feeds, etc. are becoming increasingly popular. The market of online advertising isgrowing faster and faster, and with the increasing number of Internet users, the volume ofonline ads is enhancing as well, which is also confirmed in the present study. A peculiarfeature is that the personalization method is applied by almost all business representatives,regardless of the type of their activity (Limba et al., 2018; Taneja et al., 2012).
Conclusion
The primary purpose of the present study is to discuss the main trends in media consumptionand media business strategies in the digital environment. The results show that over thelast decade the structure of media consumption has undergone serious changes. To revealthe central trends in media consumption in Russia, we analyzed the peculiarities ofconsumption of information through various media sources. We also hypothesize that thevolume of online advertising is dependent on the percentage of the population using theInternet regularly or frequently. The hypothesis was confirmed using the correlation-regression approach. The linear correlation coefficient is 0.921, which means that therelationship between the volume of online advertising and the percentage of internet usersis direct and strong. In comparison with the foreign audience, the Russian populationdemonstrates a more negative attitude towards traditional advertising.
Media consumption was evaluated by the developed system of indicators, suchas the percentage of organizations and households using the Internet, radio and televisioncoverage, the number of personal computers with Internet access, etc. We found that thepercentage of organizations and households using the Internet was gradually increasing,but unevenly and heterogeneously. On average, the share of the population using theInternet was 76.4%. The largest share of internet users (97%) was observed in the youngestgroup aged 15-24; the smallest share (38%) – among the elderly people aged 65-72. Thestatistics on Internet penetration demonstrate that today the Web is utilized by not onlythe population adoptive to innovations but also by those displaying conservative behavior.
Thus, we observe age (generation) peculiarities of using traditional and newmedia, the frequency of accessing information resources is changing, the volumes andscale of their use are growing, and media preferences are transforming. The increasingtime of using personal devices, such as smartphones, tablets, laptops, etc., exerts a markedeffect on trends in media consumption. As a result, the proliferation of mobile devices andthe growing internet speed enhance the time spent by users on searching or consumingnew information.
210
Journal of Communication: Media Watch 10 (2)
References
Allabouche, K., Diouri, O., Gaga, A., El Amrani El Idrissi, N. (2016). Mobile phones’ socialimpacts on sustainable human development: case studies, Morocco and Italy.Entrepreneurship and Sustainability Issues, 4(1), 64-73. DOI: https://doi.org/10.9770/jesi.2016.4.1(6).
Amzin, A., Galustyan, A., Gatov, V., Kastels, M., Kulchitskaya, D., Loceva, N., …Silantieva, O.(2016). How new media changed journalism. 2012–2016. Ekaterinburg: Gumanitarnyuniversitet.
Baker, D. A., Algorta, G. P. (2016). The relationship between online social networking anddepression: a systematic review of quantitative studies. Cyberpsychology, Behavior,and Social Networking, 19, 638-648. https://doi.org/10.1089/cyber.2016.0206.
Bakulev, G. P. (2008). New media: theory and practice. Moscow: KLM.Barsenkov, A. S., Vdovin, A. I. (2010). History of Russia. 1917–2009 (3rd ed.). Moscow: Aspect
Press.Buzin, V. N., Korolev, A. P., Ostertag, V. V. (2011). The influence of weather conditions on
media consumption in Russia. Sociology of Power, 7, 80-86.Deloitte (2017). Media consumption in Russia. The key trends. Retrieved from: http://
ru.investinrussia.com/data/files/media_consumption_in_russia_2017_ru.pdf.Deloitte (2018). Media consumption in Russia – 2018. Retrieved from: https://
Hunt, M. G., Marx, R., Lipson, C., Young, J. (2018). No More FOMO: Limiting Social MediaDecreases Loneliness and Depression. Journal of Social and Clinical Psychology,37(10), 751-768. https://doi.org/10.1521/jscp.2018.37.10.751.
Klein, J. D., Brown, J. D., Dykers, C., Walsh Childers, K., Oliveri, J., Porter, C. (1993). Adolescents’risky behavior and mass media use. Pediatrics, 1: 24-31.
Kolomiets, V. P. (2010). Media environment and media consumption in the modern Russiansociety. Sociological Studies, 1, 58-66.
Kovalev, P. A. (2007). The Russian TV audience. Moscow: National Business Institute.Krivosheev, M. I., Fedunin, V. G. (2000). Interactive television. Moscow: Radio i sviaz.Limba, T., Kiðkis, M., Gulevièiûtë, G., Stasiukynas, A., Plëta, T., Juozapavièiûtë, I. (2018).
Model based on qualitative criteria for internet marketing development.Entrepreneurship and Sustainability Issues, 5(3): 618-633. DOI: https://doi.org/10.9770/jesi.2018.5.3(15).
Lincényi, M., Fabuš, M. (2017). Economic trends of business actors on daily newspapermarket: case of the Slovak Republic. Entrepreneurship and Sustainability Issues, 5(1),91-104. DOI: https://doi.org/10.9770/jesi.2017.5.1(7).
Malyuchenko, G. N. (2008). Social and psychological analysis of the development ofproduction culture and media information consumption. Izvestiya of SaratovUniversity. New Series. Series: Philosophy. Psychology. Pedagogy, 8(2), 96-100.
Müller-Lietzkow, J. (2014). Medienwirtschaft “ Medienökonomie und Medienmanagementals Geschwister eines integrativen Feldes. Enzyklopädie ErziehungswissenschaftOnline: Weinheim und Basel: 1–42.
Muzykant, V. L. (2014). The social measurement of media space and its content. RUDNJournal of Sociology, 1, 114-123.
Napoli, Ph. M. (2003). Audience Economics: Media Institutions and the AudienceMarketplace. New York: Columbia University Press.
Nazarov, M. (2014). Television and the Internet: a typology of consumption in Russia.Sociological Studies, 6, 116-126.
Poluekhtova, I. A. (2009). Socio-cultural dynamics of the Russian TV audience. Moscow: ATsVI.Poluekhtova, I. A. (2016). Studying the audience and media consumption in the digital
environment: methodological and practical problems. Mediascope, 4. Retrievedfrom: http://www.mediascope.ru/2199.
Polyakova, V. V., Shabrova, N. V. (2015). The fundamentals of the theory of statistics. Ekaterinburg:Ural State University Publ.
Przywara, P. (2012). News a fakt – wokó³ relacji miêdzy medialnym obrazem œwiata arzeczywistoœci¹. Komunikacja Spo³eczna, 1, 14-23.
211
Tretyakova et al
Roberts, D. F., Foehr, U. G. (2008). Trends in media use. Future Child, 18(1), 11-37. https://doi.org/10.1353/foc.0.0000.
Rosstat (Federal State Statistics Service). Retrieved from: http://www.gks.ru.Semenova, V. V. (2001). Differentiation and consolidation of generations. In: Yadov, V. A.
(ed.). Russia: a transforming society. Moscow: Kanon-Press-Ts. Pp. 256-271.Seufert, W., Wilhelm, C. (2009). Mediennutzung und Lebensstil: Alltagsstruktur, soziales Milieu und
Sharikov, A. V. (2002). On the influence of physical factors on TV audience. Paper presentedat the 35th Conference of the Group of European audience researchers. Maribor, Slovenia.Retrieved from: http://www.mediakomitet.ru/.
Sundar, S. S. (2015). Handbook of the Psychology of Communication Technology. Hoboken, NJ:Wiley-Blackwell. https://doi.org/10.1002/9781118426456.
Taneja, H., Webster, J. G., Malthouse, E. C., Ksiazek, T. (2012). Media consumption acrossplatforms: Identifying user-defined repertoires. New Media & Society , 14(6), 951-968. https://doi.org/10.1177/1461444811436146.
Urban, C. D. (1981). Program on Information Resources Policy. Center for Information PolicyResearch, Harvard University.
Vartanova, E. L. (2009). The theory of mass media. Relevant issues. Moscow: MediaMir.Vartanova, E. L. (2011). Digital TV and transformation of media systems. On the need for
interdisciplinary approaches to the study of modern TV. Bulletin of LomonosovMoscow State University. Series: Journalism, 4, 6-26.
Web-Index 2018. Mediascope. Retrieved from: https://mediascope.net/data/.Webster, J. B. (2006). Rating Analysis. Theory and practice of Audience Research. New Jersey:
Lawrence Erlbaum.Wilmer, H. H., Chein, J. M. (2016). Mobile technology habits: patterns of association among
device usage, intertemporal preference, impulse control, and reward sensitivity.Psychonomic Bulletin and Review, 23(5), 1607-1614. https://doi.org/10.3758/s13423-016-1011-z.
Yessenbekova, U. M. (2015). Role of media culture in national historical preservation.Social Sciences (Pakistan), 10(8), 2199–2205. http://doi.org/10.3923/sscience.2015.2199.2205.
Yessenbekova, U. M. (2018a). Television in the development of information society culturein Kazakhstan. Media Watch, 9(3), 411–417. http://doi.org/10.15655/mw/2018/v9i3/49498.
Yessenbekova, U. M. (2018b). Transformation of the functions of Kazakhstan television inthe information society. Media Watch, 9(2), 203–208. http://doi.org/10.15655/mw/2018/v9i2/49387.
Oksana V. Tretyakova (Ph.D., Tyumen State Oil and Gas University, Russian Federation,2009) is an Associate Professor of the Department of Marketing and Municipal Managementin Tyumen Industrial University (Russian Federation). Her research interests arereputational management, business planning in the advertising field, tourism policy,planning, and socio-demographic trends.Sergey D. Karakozov (Doctor Habilitatus Pedagogy, Institute of Educational DevelopmentStrategy of the Russian Academy of Education, 2005), is Professor and Head of the Instituteof Mathematics and Computer Science. He is Pro-Rector of Moscow State PedagogicalUniversity. His research interests are informatization, media technology, informationresources, digital education, media and information literacy, media consumption, anddigital economics.Elena V. Voevoda (Doctor Habilitatus Pedagogy, Federal Institute for EducationalDevelopment, 2011) is Head of Department of Pedagogy and Psychology and Professor ofthe English language Department #2 in Moscow State Institute of International Relations(University) of the Ministry of Foreign Affairs Russian Federation–MGIMO University(Russian Federation). Her research interests are cross-cultural psychology, interculturalcommunication, education.