38
Communications report 2013–14 series Report 1—Australians’ digital lives MARCH 2015

Communications report2013–14 seriesReport 1—Australians’ digital lives MARCH 2015

CanberraRed Building Benjamin OfficesChan Street Belconnen ACT
PO Box 78Belconnen ACT 2616
T +61 2 6219 5555F +61 2 6219 5353
MelbourneLevel 32 Melbourne Central Tower360 Elizabeth Street Melbourne VIC
PO Box 13112Law Courts Melbourne VIC 8010
T +61 3 9963 6800F +61 3 9963 6899
SydneyLevel 5 The Bay Centre65 Pirrama Road Pyrmont NSW
PO Box Q500Queen Victoria Building NSW 1230
T +61 2 9334 7700 1800 226 667F +61 2 9334 7799
Copyright notice
http://creativecommons.org/licenses/by/3.0/au/
With the exception of coats of arms, logos, emblems, images, other third-party material or devices protected by a trademark, this content is licensed under the Creative Commons Australia Attribution 3.0 Licence.
We request attribution as: © Commonwealth of Australia (Australian Communications and Media Authority) 2015.
All other rights are reserved.
The Australian Communications and Media Authority has undertaken reasonable enquiries to identify material owned by third parties and secure permission for its reproduction. Permission may need to be obtained from third parties to re-use their material.
Written enquiries may be sent to:
Manager, Editorial and DesignPO Box 13112Law CourtsMelbourne VIC 8010Tel: 03 9963 6968Email: [email protected]

acma | iii
Executive summary 1
Snapshot of digital life in Australia
About the researchresearchacma 3
How we connect onlineGrowth in internet access devices 4Devices used most often to access the internet 5Internet at home 7More sophisticated home networking 8Internet access with mobile devices 9Mobile and online 10Mobile internet services 11
Who’s going onlineAge matters 12And so does income and education 13Offline Australians 15
What we’re doing onlineFrequency of internet use increasing 16Data downloads growing significantly 17More mobile app downloads 18Embracing cloud services 18Mobile data downloads 20What can we do with our data? 21
Embracing a digital lifeOnline activities 22Digital consumers 23Staying in touch online—our digital social life 25Digital business 26Digital workers 27
Appendix—Research methodologyData sources 28Other sources 28Data analysis 28
acma |
Contents (Continued)
Executive summary
Australians are strongly embracing the digital life. More than nine in 10 (92 per cent) adult Australians used the internet in the six months to May 2014, including 100 per cent of the 18–44 age group. While younger adults are the most active digital citizens, 68 per cent of those aged 65 and over also participate online.
The way Australians access the internet is changing—70 per cent go online with a mobile phone and 50 per cent with a tablet. But laptop and desktop computers are still the devices we most often use for this purpose. And, while the home is still the preferred place to connect to the internet, increasingly Australians are going online from alternative locations such as the workplace, wireless hotspots or a friend’s place.
The majority of online Australians (68 per cent) are now using three or more devices to access the internet, with almost a quarter (23 per cent) using five or more. In managing multiple devices at home, there is a trend towards more complex home networks, as multiple devices are connected to the internet by fixed line and Wi-Fi networks.
The level of digital engagement is also intensifying as people download increasing amounts of data, actively embrace cloud services for data storage, conduct more activities online, and connect as digital workers and digital consumers.
In the June quarter of 2014, total data downloaded in Australia grew by 53 per cent over the same quarter in 2013. Notable growth occurred in the volume of data downloaded to mobile devices, which almost doubled (increasing by 97 per cent over the June quarter 2013). In the last six months to May 2014, three in four Australians with a smartphone (75 per cent) downloaded an app on their mobile phone, with those aged 55 and over showing the largest increase in app downloads.
Participation in online communities and blogging is an area of increasing activity—now involving 54 per cent of online Australians—as is the use of cloud computing services to back up and store files online. However, Australians are using webmail less, as an increasing range of online activities competes for attention.
Australians of different ages use the internet in markedly different ways. Those aged 18–24 are much more likely to share files and content online through services such as Pinterest, Tumblr or Instagram. Backing up and storing content online is popular with Australians aged 18–44.
Digital communications are now embedded across Australian business, work and social life. Almost half of employed Australians use the internet to work away from the office. More and more people are also buying goods and services online, using the internet to conduct business, work and communicate with others via a range of communications applications.
acma |

Contents (Continued)
Despite this increasing digital engagement, over one million Australians (around six per cent) have never accessed the internet.
| acma

Snapshot of digital life in Australia This report examines Australians’ engagement with digital communications technologies and their changing communications practices.
Some of the key indicators of internet access and use are presented below.
Figure 1 A snapshot of digital life in Australia, 2014
Base: Percentage of people aged 18 and over. Sources: *ACMA-commissioned survey. Data refers to six months to May 2014. †Roy Morgan Single Source. Data refers to one or more activities undertaken online in the last four weeks, to the 12 months to June 2014. ‡Australian Bureau of Statistics (ABS). Data refers to the June quarter 2014.
acma | 7
About the researchresearchacmaAs an evidence-informed regulator, the ACMA’s research program—researchacma—underpins our work and decisions. It contributes to our strategic policy development, regulatory reviews and investigations, and helps the ACMA make media and communications work for all Australians.
researchacma has five broad areas of interest: > market developments > media content and culture > social and economic participation > citizen and consumer safeguards > regulatory best practice and development.
Australians’ digital lives contributes to the ACMA’s market developments and social and economic participation research themes, and complements the ACMA Communications report 2013–14. The communications report is an annual comprehensive overview of the changing communications and media landscape in Australia.
In this report, two main data sources are used:> Successive ACMA-commissioned surveys of Australian consumers examining
online habits and use of internet access devices, communication services and applications. The survey results typically refer to the six months to May unless otherwise stated.
> Roy Morgan Single Source data. Respondents were surveyed about their digital engagement, including internet use and activities, and online shopping habits and expenditure. The survey results refer to the financial year—that is, 12 months to June—unless otherwise stated.
Results from both data sources were analysed using descriptive analysis techniques, and by socioeconomic and demographic factors to identify areas with statistically significant patterns or differences.
This report also discusses data published by the Australian Bureau of Statistics (ABS).
8 | acma
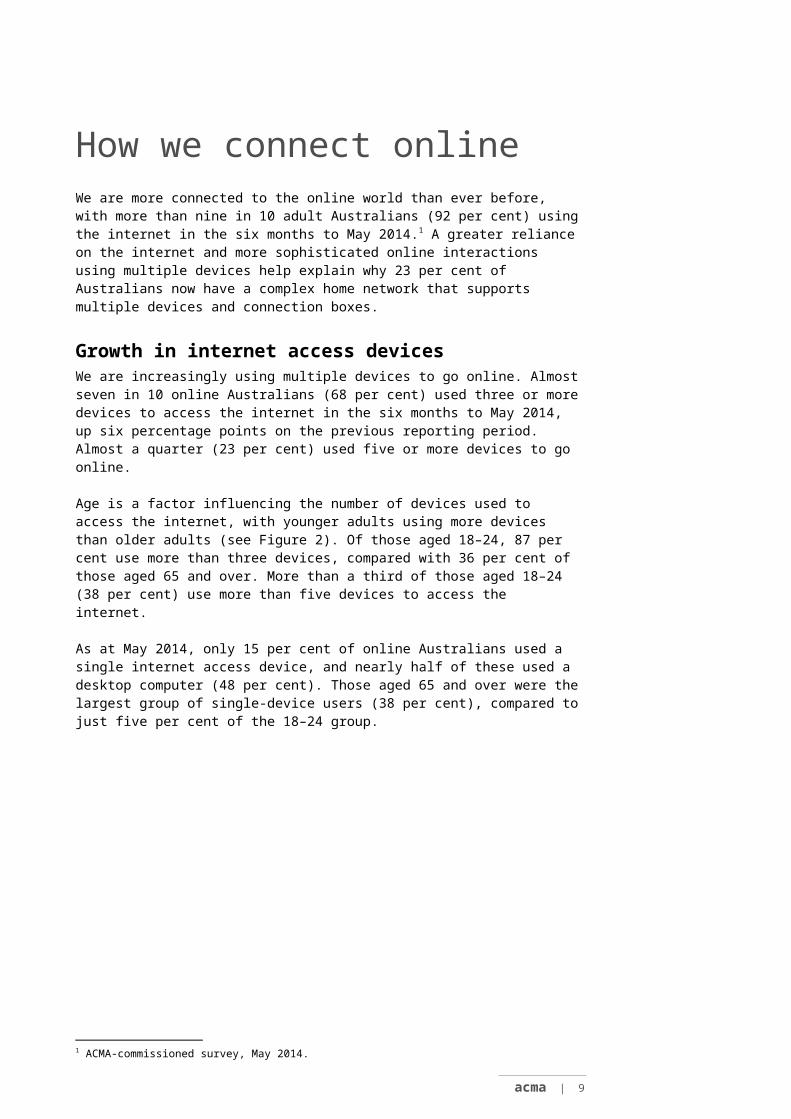
How we connect online We are more connected to the online world than ever before, with more than nine in 10 adult Australians (92 per cent) using the internet in the six months to May 2014.1 A greater reliance on the internet and more sophisticated online interactions using multiple devices help explain why 23 per cent of Australians now have a complex home network that supports multiple devices and connection boxes.
Growth in internet access devices We are increasingly using multiple devices to go online. Almost seven in 10 online Australians (68 per cent) used three or more devices to access the internet in the six months to May 2014, up six percentage points on the previous reporting period. Almost a quarter (23 per cent) used five or more devices to go online.
Age is a factor influencing the number of devices used to access the internet, with younger adults using more devices than older adults (see Figure 2). Of those aged 18–24, 87 per cent use more than three devices, compared with 36 per cent of those aged 65 and over. More than a third of those aged 18–24 (38 per cent) use more than five devices to access the internet.
As at May 2014, only 15 per cent of online Australians used a single internet access device, and nearly half of these used a desktop computer (48 per cent). Those aged 65 and over were the largest group of single-device users (38 per cent), compared to just five per cent of the 18–24 group.
Figure 2 Number of devices used to access the internet in the six months to May 2014, by age
Base: Percentage of people aged 18 and over with a home fixed-line telephone and/or mobile phone.Source: ACMA-commissioned survey, May 2014.
1 ACMA-commissioned survey, May 2014.
acma | 9

Devices used most often to access the internetTraditional devices (laptop and desktop computers) are used most often to access the internet. In the six months to May 2014, 28 per cent of online Australians said a laptop was their main device for accessing the internet, and 27 per cent a desktop computer.
The use of mobile devices was significant too. Almost a quarter (22 per cent) of online Australians used a mobile phone as their main device, while 12 per cent nominated a tablet, in the six months to May 2014 (around eight per cent were not able to confirm the main device they used).
As illustrated in Figure 3, younger adults prefer using a mobile phone to go online—it’s the device used most often by those aged 18–24 (42 per cent) and 25–34 (46 per cent). This compares to just three per cent of those aged 65 and over. Tablets are more commonly used as the main device to access the internet by people aged 35–64, compared with other age groups.
Using a laptop as the main device to connect to the internet is more evenly spread across age groups, while a desktop computer is the main access device for people aged 55 and over. Those aged 25–34 are least likely to use a desktop computer (16 per cent).
10 | acma

Figure 3 Device used most often to access the internet
Base: Percentage of people aged 18 and over.Note: Relates to device used most often to access the internet in the six months to May 2014.Source: ACMA-commissioned survey, May 2014.
acma | 11

Internet at home The home remains the main place where adult Australians go online—86 per cent used the internet at home in the last three months, while 81 per cent of Australians aged 18 and over have a home internet connection.
The vast majority of these home internet connections are some form of broadband. ADSL is the most popular connection type (63 per cent of online Australians), followed by portable Wi-Fi modems (15 per cent), cable (12 per cent) and USB modems (eight per cent). Fewer than one per cent of connections are dial-up.2
Increasingly, however, Australians are going online from locations other than the home, with internet use at a workplace, wireless hotspot, friend’s place and library on the rise (Figure 4).
The largest increase was in the use of wireless hotspots, up four percentage points between the six months to June 2013 and the six months to June 2014. At June 2014, 45 per cent of Australians aged 18 and over used the internet in their workplace, 19 per cent at wireless hotspots, 18 per cent at a friend’s place, 10 per cent at a library and eight per cent at educational institutions.
Figure 4 Where users go online
Base: Percentage of people aged 18 and over.Note: Data refers to six months to June 2013 and six months to June 2014. Source: Roy Morgan Single Source, June 2013 and 2014.
More sophisticated home networking Using more devices to connect to the internet is introducing greater complexity and sophistication to home networks. While 68 per cent of online Australians live in a house with one internet connection device (modem, router, Wi-Fi repeater or
2 Roy Morgan Single Source, June 2014.
12 | acma

gateway), 15 per cent have two and eight per cent have three or more. Nine per cent have none or don’t know.3
Different devices are connected in the household using various technologies. As expected, desktop computers are most likely to be connected using fixed-line (56 per cent of all desktops) and laptop computers via a wireless connection (86 per cent).
An assessment of home networking set-ups was undertaken using ACMA survey data, with the complexity assessed as follows: > basic—one connection box and one or two devices> multi—one connection box and three or more connected devices> complex—multiple connection boxes and multiple devices.
The research shows that Australian households are still in the early stages of using more complex home networks:> 17 per cent of Australians with internet access live in a basic network household> 51 per cent live in a multi-network household> 23 per cent live in a complex network household> nine per cent don’t know what they have in the home.
The majority of online Australians (74 per cent) have at least three devices connected to the internet at home. As Australians connect more devices and their networks become more complex, identifying and resolving service issues and, for example, malware threats can become more difficult.4
Characteristics of internet connectivity for Australian households are presented in Figure 5.
Older people—those aged 65 and over—are connecting fewer devices and are more likely to have a basic home connection. Those living in a multi-network household are more likely to be under the age of 35 and live in flats. Degree-educated males with higher household incomes are more likely to have a complex home network.
Multi-network and complex network households are more likely to use Wi-Fi in the home, and five per cent of multi-network households only use wires to connect devices to the internet.
3 ACMA-commissioned survey, May 2014.4 See, for example, ACMA fights malware on two fronts.
acma | 13

Figure 5 Characteristics of households, May 2014
Base: People aged 18 and over who have internet access. Note: Percentage of connections refers to the proportion of households.Source: ACMA-commissioned survey, May 2014.
Internet access with mobile devicesWhile laptop and desktop computers are still commonly used to access the internet, their use declined slightly over the 12 months to May 2014 (Figure 6).
An increasing number of people are opting to use portable smart devices like mobile phones and tablets to go online. In May 2014, nine in 10 adult Australians (94 per cent) had a mobile phone and 74 per cent of them had a smartphone, up from 68 per cent a year earlier.5 So it’s no surprise that using a mobile phone to access the internet is becoming increasingly popular.
An estimated 12.5 million adult Australians (70 per cent) used a mobile phone to access the internet for personal use in the six months to May 2014, up eight percentage points on the previous year. This proportion is larger than those who specified a laptop (68 per cent) or desktop computer (62 per cent) as a way to access the internet for personal use.
Tablets have also become more popular—50 per cent of Australians used a tablet to go online in the six months to May 2014, up eight percentage points from the previous year.
5 ACMA-commissioned surveys, May 2013 and 2014.
14 | acma

Figure 6 Devices used to access the internet for personal use
Base: Percentage of people aged 18 and over. Note: Relates to the devices used to access the internet for personal use in the six months to May. Source: ACMA-commissioned surveys, May 2013 and May 2014.
Mobile and onlineAs Australians go online on their mobile phones, they report increasing use of the internet from more locations, as shown in Figure 7.
The most common way of accessing the internet away from home on a mobile phone is using the mobile phone service (cellular network) (90 per cent) rather than Wi-Fi hotspots.
When at home, 81 per cent of online Australians with a smartphone use their home internet connection to go online. Seventy-nine per cent use their mobile phone service to go online at home, an increase of 10 percentage points.
Wi-Fi use also grew, with the number of mobile phone internet users taking advantage of Wi-Fi hotspots to access mobile internet away from home, increasing five percentage points on the previous year to 60 per cent. This trend is consistent with the findings outlined in the researchacma snapshot Strong signals—growing use of public Wi-Fi hotspots (November 2014).
acma | 15

Figure 7 How users go online via a mobile phone
*‘Internet connection’ refers to home internet connection using a wireless router or wireless LAN.Base: Percentage of people aged 18 and over with a mobile phone capable of 3G/4G services who accessed the internet from a mobile phone in the six months to May 2014.Source: ACMA-commissioned surveys, May 2013 and May 2014.
Mobile internet services Of the 70 per cent of adult Australians who use the internet via a mobile phone, a large proportion nominate other devices such as laptop and desktop computers and tablets as their most used device to go online (Figure 8).
In the six months to May 2014, 31 per cent of mobile phone users identified a mobile phone as their most used internet access device. This has changed from the previous reporting period when the laptop computer was the most frequently used device for mobile phone internet users (declining to 30 per cent in the current reporting period).
A tablet is the most often used internet access device for 15 per cent of those who use the internet via a mobile phone. Tablets showed strong growth as the most used device to access the internet, up three percentage points from the last reporting period.
Figure 8 Most used internet access device, by mobile phone users
Base: Percentage of people aged 18 and over. Note: Relates to device used most often by mobile phone users to access the internet in the six months to May 2014. Source: ACMA-commissioned survey, May 2013 and 2014.
16 | acma

Who’s going onlineAge mattersUse of the internet varies by age, with very nearly all of the 18–44 group (100 per cent) using the internet, compared to 94 per cent of those aged 45–64.6 Of those aged 65 and over, 68 per cent accessed the internet in the last six months, showing that older people are also embracing the digital life (Figure 9).
Figure 9 Internet use, by age, 2014
Base: Percentage of people aged 18 and over. Note: Data refers to the six months to May 2014.Source: ACMA-commissioned surveys.
Figure 10 shows that different age groups prefer different devices to go online. People aged 18–34 are much more likely to use a mobile phone to access the internet (94 per cent) than those aged 65 and over (28 per cent). However, mobile phone internet use is on the rise across all age groups, including those aged 65 and over. The use of a mobile phone by this age group to access the internet in the last six months increased seven percentage points between May 2013 and May 2014.
The use of a tablet to access the internet has also increased across all age groups. Those aged 35–44 used a tablet more than any other age group (65 per cent), up seven percentage points over the six months to May 2013. However, the largest increase (15 percentage points) was seen in the 45–54 age group. Of those aged 65 and over, more than 700,000 people (22 per cent) went online using a tablet—an increase of four percentage points on the previous reporting period.
The ACMA survey data shows a strong growth in mobile phone internet use among those aged 65 and over (Figure 10) and a decline in the use of traditional devices such as laptop and desktop computers, in line with the overall trend (refer to Figure 6). The use of a laptop computer to access the internet decreased by seven percentage points (desktop use was down one percentage point) in this older age group.
6 The proportion of this age group surveyed who have used the internet in the six months to May 2014 is 99.6 per cent, which rounds to 100 per cent.
acma | 17

Figure 10 Internet access devices, by age, six months to May
Base: Percentage of people aged 18 and over. Note: Relates to the use of devices to access the internet in the six months to May. Source: ACMA-commissioned surveys, May 2013 and 2014.
And so does income and educationIncome is another factor influencing which devices are used to access the internet. As illustrated in Figure 11, the use of traditional devices (laptop and desktop computers) increases with the level of income.
The take-up of new technologies is often slower in lower income groups, and this is particularly evident in the use of tablets, with only 30 per cent of those earning under $50,000 using a tablet to access the internet. This compares to 51 per cent using mobile phones and laptops, and 54 per cent using desktop computers (which are longer established devices).
18 | acma

Figure 11 Internet access devices, by income
Base: Percentage of people aged 18 and over. Note: Relates to the use of devices to access the internet in the six months to May 2014.Source: ACMA-commissioned survey, May 2014.
Analysis of Roy Morgan Single Source data reveals that degree-educated people, those living in metropolitan areas, and those living with parents or a partner and children are more likely to have ever accessed the internet.
For personal income, the point of difference occurs at the $35,000 mark, with those earning less than $35,000 annually significantly less likely to have accessed the internet than those who earn above $35,000 (Figure 12).
acma | 19

Figure 12 Profile differences of people who have ever used the internet, June 2014
Base: Percentage of people aged 18 and over who have ever accessed the internet. Source: Roy Morgan Single Source, June 2014.
Offline Australians While more than nine in 10 adult Australians (92 per cent) reported accessing the internet in the six months to May 2014, an estimated 1.1 million (six per cent) said they had never accessed the internet (at June 2014).7 This has nearly halved in four years, with two million (12 per cent) adult Australians reporting having never accessed the internet at June 2010.
Age and income are the main factors associated with never having accessed the internet—70 per cent of adults who are not online are aged 65 and over, while 83 per cent have an annual income of less than $30,000. Those who have never been online are also more likely to be:> people without a university degree (91 per cent of those who have never accessed
the internet compared to 47 per cent of the survey sample)> women (54 per cent compared to 51 per cent of the survey sample).
While the size of this group is diminishing over time, there remain potential implications for government and businesses who need to consider how best to communicate and deliver services to all Australians.
7 Roy Morgan Single Source, June 2014.
20 | acma

What we’re doing online This chapter explores some of the indicators of our increased digital engagement, which include more frequent internet use, the amount of data downloaded, and growth in the scope and variety of activity undertaken online.
Australians are also embracing cloud services, and the areas of growth include backing up and storing content, using cloud-based software, and file and content sharing.
Frequency of internet use increasing The frequency of online use continued to grow during 2013–14 across most age groups. From June 2013 to June 2014, the proportion of adult internet users who went online more than once a day increased by two percentage points to 10.7 million people (74 per cent).
As can be seen in Figure 13, the largest increase was in the 35–44 age group, with an estimated 2.2 million users accessing the internet more than once a day, an increase of seven percentage points on the previous year.
An estimated 1.6 million people aged 18–24 went online more than once a day—up two percentage points from June 2013. However, there was a slight decline in frequency of use for Australians aged 55–64, with an estimated 1.4 million people in this group going online more than daily—down two percentage points from the previous year. More than half of internet users aged 65 and over (972,000) go online more than once a day.
Figure 13 Frequency of internet use, by age (accessing internet more than once a day)
Base: People (‘000) who undertook one or more internet activities online in the last four weeks. Source: Roy Morgan Single Source.
acma | 21

Data downloads growing significantlyABS figures for the June 2014 quarter show that Australians continue to have an increasing appetite for data.8
For the June quarter of 2014, the total volume of data downloaded by Australian internet users increased by 53 per cent (to 1,034,959 terabytes) over the June quarter of 2013, signalling strong growth in online participation.
Fixed-line broadband continues to account for the largest proportion of total data downloaded (93 per cent). However, mobile data downloads showed the strongest growth (Figure 14). They almost doubled from the June quarter 2013 to June 2014, with an increase of 97 per cent to 38,734 terabytes. This makes mobile the fastest growing way of downloading data, while fixed-line broadband download volumes increased by 53 per cent and wireless by 20 per cent.
Figure 14 Volume of data downloaded, by Australian internet users (terabytes), June quarter 2014
Note: ‘Wireless’ includes satellite, fixed wireless, mobile wireless via a datacard, dongle, USB modem or tablet SIM card and other wireless broadband. Excludes data downloaded via mobile handsets which is reported in the mobile handset section.Source: ABS, 8153.0-Internet Activity, Australia, June 2014.
More mobile app downloadsMore Australians of all age groups are downloading apps on their mobile phones.
Of people with a 3G or 4G mobile phone, 75 per cent (9.4 million) downloaded an app in the six months to May 2014 (Figure 15). This was up from 68 per cent (8.9 million) in the six months to May 2013.
A greater proportion of younger people download apps, with 92 per cent of those aged 18–24 and 89 per cent of those aged 25–34 downloading an app in the six months to May 2014. This compares to 35 per cent of those aged 65 and over. However, those aged 55 and over are showing the largest increase in app downloads—up 13 percentage points for the 55–64 year olds and 11 percentage points for those 65 and over.
8 ABS, 8153.0-Internet Activity, Australia, June 2014.
22 | acma

Figure 15 Downloaded an app on a mobile phone in the six months to May, by age
Base: Percentage of people with a mobile phone capable of 3G/4G services.Source: ACMA-commissioned survey.
Embracing cloud services Increasing online engagement means it is easier to both create and access unprecedented amounts of data and information, and there is an ever-increasing need for convenient and accessible storage. Cloud computing—a model for enabling ubiquitous, convenient, on-demand network access to a shared pool of computing resources (for example, networks, servers, storage, applications and services) with minimal effort—can meet this need.9
In the six months to May 2014, 14.2 million adult Australians (79 per cent) used a cloud service. There has been little change since May 2013 in the overall number of Australians who have used a cloud service, but there has been an increase in the number of services they are using.10
The most popular cloud service is web-based email (85 per cent of cloud users), although its use fell by three percentage points from the previous year.
The largest growth in cloud services is for backing up and storing files and content, which increased by nine percentage points. This was followed by the use of online software such as GoogleDocs and Microsoft Office Online, which increased by five percentage points.
9 Department of Finance, ‘Australian Government Cloud Computing Policy’, October 2014. 10 Due to a change in methodology, this figure has been revised from 80 per cent as published in ACMA, Cloud computing in Australia, 2014.
acma | 23

Figure 16 Cloud computing services used, six months to May
Base: Percentage of people aged 18 and over who used a cloud service. Source: ACMA-commissioned surveys, May 2013 and 2014.
Like many new and emerging services, age influences the take-up of cloud computing services. Nearly all of the 18–24 group (98 per cent) had used a cloud service in the six months to May 2014, compared to 46 per cent of those aged 65 and over.
The type of service used is also associated with age. Australians aged 18–24 are much more likely than any other age group to share files and content online through services such as Pinterest, Tumblr or Instagram (57 per cent of cloud users in this age group). This compares with 38 per cent of cloud users aged 25–34 (the next closest group).
Backing up and storing content online is popular with cloud-using Australians aged 18–44, reaching between 53 and 55 per cent for these age groups. Almost half of those aged 65 and over who used a cloud service use online software such as GoogleDocs or Microsoft Office Online (47 per cent) but they are least likely of all age groups to share files or content using the cloud (10 per cent).
24 | acma

Figure 17 Cloud computing services, by age, six months to May 2014
Base: Percentage of people who used a cloud service in the six months to May 2014.Source: ACMA-commissioned survey, May 2014.
Mobile data downloadsDespite the notable growth in mobile data downloads, the average data allowance on mobile phone plans is still relatively small.
Nearly three-quarters (74 per cent) of adult mobile users have a monthly mobile phone data allowance of less than 2GB. Plans with 2GB or more of data make up less than a quarter (24 per cent) of all plans, while just two per cent of total data allowances on mobile plans are unlimited (Figure 18).11
According to the ABS, the average amount of data downloaded by a mobile subscriber over a three-month period (during the quarter to June 2014) was 80 times less than for a fixed-line broadband user:> 155 GB by fixed-line broadband> 1.9 GB by mobile handset.
11 Roy Morgan Single Source, June 2014.
acma | 25

Figure 18 Proportion of monthly data allowance on mobile phone, 12 months to June 2014
*‘2GB+’ refers to 2GB and more but not unlimited. Base: People aged 18 and over who have data allowance on a mobile phone. Source: Roy Morgan Single Source, June 2014.
What can we do with our data?Figure 19 shows selected examples of internet activities that can be performed with the average amount of data downloaded by subscribers during the quarter to June 2014.
Figure 19 Possible data uses, June quarter 2014
Source: ACMA (based on ABS, 8153.0-Internet Activity, Australia , for the June quarter 2014).
26 | acma

Embracing a digital lifeThe expansion of online service delivery and the growth in internet use has moved online activities from the periphery of many Australians’ lives to the centre.
The most popular online activities are evolving. The increase in popularity in social networking and entertainment activities is greater than for more traditional activities such as research and information-gathering, and banking and finance.
Australians are also embracing a digital working life, with many using the internet to work away from the office.
Online activitiesPatterns of internet use are changing as the levels of online activity increase. At June 2014, 88 per cent of online Australians engaged in online communications activities, including email, instant messaging, phone and video calls made via the internet. This was an increase of four percentage points on the previous reporting period.
Participation in online communities and blogs also increased significantly—rising 10 percentage points to 54 per cent of online Australians. This reflects an increased use of social and business networks as well as participating in online forums and posting comments about topics of interest.
Figure 20 Online in the last four weeks (at June)
Base: Percentage of people aged 18 and over who undertook one or more internet activities online in the last four weeks. Note: Includes both transactional and non-transactional activities (see Figure 22 for transactional activities only) Source: Roy Morgan Single Source.
acma | 27

Digital consumers Australians are active participants in the online economy. Online banking and finance activities increased two percentage points in the 12 months to June 2014, with 74 per cent of online users undertaking these activities in the last four weeks to June 2014 (Figure 20).
In the last four weeks to June 2014, 10.85 million Australians made an e-commerce transaction. This was an increase of 10 per cent, up from 9.90 million in the last four weeks to June 2013.12
In the three months to June 2014, 62 per cent of internet users (9.1 million) made a purchase online; 46 per cent (6.7 million) were more frequent users—making an online purchase in the last four weeks. Slightly more women (49 per cent) than men (42 per cent) bought a product online in the last four weeks to June 2014.
12 Roy Morgan Single Source, June 2014.
28 | acma

Age has a big impact on online purchasing—the age groups between 25 and 54 are the most likely to buy online (between 66 and 72 per cent). While the figure is significantly lower for those aged 65 and over, almost 900,000 people (46 per cent) in this older age group bought a product online in the three months to June 2014.
Figure 21 Online purchase made in the last three months
Base: People who undertook one or more internet activities in the last four weeks. Note: m=million.Source: Roy Morgan Single Source, June 2014.
People with more experience using the internet are more likely to purchase online. For example, 71 per cent of Australians who have used the internet for 10 or more years had made a purchase in the last four weeks. This is compared to 60 per cent for those who have used the internet between five and nine years, and 40 per cent for those who have used the internet between three and five years.
Australians are shopping on multiple devices, including mobile phones and tablets. While the level of e-commerce use of these devices has not reached that of personal computers, they are becoming increasingly important platforms for both shopping and banking.
At June 2014, 22 per cent of online Australians used a mobile phone to bank online, up three percentage points from June 2013. There was also an increase in the number of Australians who shopped online via a mobile phone (14 per cent), up from 10 per cent in June 2013. Tablets are also being used for online banking (10 per cent) and shopping (nine per cent). While the majority of people still use desktop and personal computers for these activities, the proportion who use more traditional devices is not growing (see Figure 22).
acma | 29

Figure 22 Online activities, by device
*2013 data for tablet not available.Base: Percentage of people aged 18 and over who undertook one or more internet activity in the last four weeks. Note: Includes transaction-based activities only.Source: Roy Morgan Single Source.
Nearly half of adult Australian online shoppers (46 per cent) spent between $100 and $500 online in the four weeks to June 2014, while one in 10 spent over $1,000: > 35 per cent spent under $100> 46 per cent spent between $100 and under $500> nine per cent spent between $500 and under $1,000> 10 per cent spent $1,000 or over.
Figure 23 illustrates the main categories of online expenditure by Australians aged 18 and over.
Figure 23 Categories of online expenditure (four weeks to June 2014)
Base: Percentage of people aged 18 and over who bought one or more products online in the last four weeks.Source: Roy Morgan Single Source, June 2014.
30 | acma

Staying in touch online—our digital social lifeAn estimated 6.2 million adult Australians (35 per cent) used a communications application to either make phone or video calls, or send messages, in the six months to May 2014. Younger people are setting the trend, with over half of those aged 18–34 using such applications (increasing from 51 to 55 per cent over the year). This compares to 12 per cent of those aged 65 and over.
Facebook, Skype, FaceTime, Viber and Apple iMessage are the top five communications applications Australians used as at May 2014. The most popular are the more established applications such as Facebook and Skype—reaching 69 per cent of communications application users—followed by the video chat application FaceTime (46 per cent). Viber and Apple iMessage are used by 40 and 38 per cent, respectively.
Age influences which communications application is used (see Figure 24). Facebook is most popular among those aged 18–24, with nine in 10 communications application users in this age group using it (89 per cent), followed by Skype (72 per cent). For most of those aged 65 and over who use communications applications, Skype is preferred (74 per cent). The next closest application for this age group is Facebook, used by 29 per cent.
Skype as a communications application is more broadly accepted by different age groups, ranging between 61 and 76 per cent of communication application users aged 18 to 65 and over. By comparison, take-up of Facebook and Apple iMessage generally diminish with age. For example, 54 per cent of those aged 18–24 use Apple iMessage, in comparison with just 11 per cent of those aged 65 and over.
Figure 24 Communications applications used, by age, six months to May 2014
Base: Percentage of people who used applications to make phone calls, video calls or send messages. Source: ACMA-commissioned survey, May 2014.
acma | 31

Digital business Australian businesses are also embracing digital communications technology. The ABS reports 93 per cent of organisations had an internet connection in 2012–13.
Larger businesses are more likely to have an internet connection—99.8 per cent of businesses employing 200 or more people are online, compared to 91 per cent of those employing 0–4 people. Almost all internet-enabled businesses have broadband as their main type of internet connection (99.6 per cent).13
Data from the ABS shows businesses are also increasingly using a web and social media presence to conduct business. In 2012–13, nearly half of businesses (47 per cent) had a web presence, reaching 98 per cent for businesses with 200 or more employees. Use of social media for business has also increased, with 26 per cent of businesses having a social media presence in 2012–13, an eight percentage point increase on 2011–12. Again, larger businesses are more likely to have a social media presence (64 per cent).14
Digital workers Digital connectivity makes it easier for people to work in multiple locations. In May 2014, an estimated 5.7 million adult Australians aged 18 and over were ‘digital workers’, who:> use the internet to work away from the office outside ‘standard working hours’> are ‘teleworkers’, who work away from the office, substituting coming into the office
for part or all of the day.15
Digital workers make up 49 per cent of the total number of employed Australians (Figure 25), increasing to 59 per cent of employees aged 35–44 and a notable 41 per cent of those aged 65 and over. Level of education is a factor—69 per cent of employees with a university qualification use the internet to work away from their main place of employment, compared to 27 per cent of employed people with primary or secondary education.
Two-thirds (66 per cent) of digital workers reside in the capital cities of Sydney, Melbourne, Brisbane, Adelaide and Perth.
Figure 25 Digital workers, May 2014
13 ABS, 8166.0–Summary of IT Use and Innovation in Australian Business, 2012–13, Australia, June 2014.14 ibid.15 ACMA, Home is where the work is, October 2013.
32 | acma
Base: Persons aged 18 and over who are employed. Source: ACMA-commissioned survey, May 2014.
Nearly half (48 per cent) of digital workers have a formal agreement in place. This equates to nearly a quarter (24 per cent) of those who are employed.16
Of digital workers, 18 per cent operate a home-based business, which equates to 15 per cent of employed Australians aged 18 and over.
16 ACMA-commissioned survey, May 2014.
acma | 33

Appendix—Research methodologyData sourcesThe data contained in this report is from two main data sources:
ACMA-commissioned surveyThe ACMA-commissioned survey of consumers was conducted by Newspoll Research in May 2014. The sample was taken from the Australian population aged 18 and over. The ACMA survey was conducted in May 2012, 2013 and 2014 with samples of 2,205, 2,408 and 1,800 respectively.
The ACMA conducted computer-assisted telephone interviewing (CATI) to both fixed-line and mobile phone numbers. The quota sample for 2014 included two subsets: > fixed-line sample of n=1,440> mobile phone sample of n=360.
Roy Morgan Single SourceRoy Morgan Research (Roy Morgan Single Source product)—data generally covers changes occurring from July 2013 to June 2014 unless otherwise specified.The research samples were as follows:> July 2013 to June 2014, aged 18 and over: some 24,732> July 2012 to June 2013, aged 18 and over: some 19,365> July 2011 to June 2012, aged 18 and over: some 19,798.
Australian populationTotal population estimates for Australian adults aged 18 years and over are:> 18,147,174 (Roy Morgan Single source—average from July 2013 to June 2014)—
based on ABS data 6202.0 Labour Force, Australia> 17,896,525 (ACMA-commissioned survey—May 2014)—based on ABS data
3101.0 Australian Demographic Statistics, March 2014.
Other sourcesPlease refer to footnotes listed throughout the report for other information sources used in this publication.
Data analysis Results from both data sets were analysed using descriptive analysis techniques, and by socioeconomic and demographic factors, to identify areas with significant patterns or differences.
34 | acma


