Telemarketing statistics: April 2016 To give stakeholders and other citizens better insights, we present this statistical breakdown of the Do Not Call Register Act compliance and investigations work. Where compliance activities or investigations are ongoing, or have not been published, the ACMA is generally unable to give detail of the entities and issues involved for individual matters or otherwise make comment. Figure 1: DNCR Act – Complaints received per month May-15 Jun-15 Jul-15 Aug-15 Sep-15 Oct-15 Nov-15 Dec-15 Jan-16 Feb-16 Mar-16 Apr-16 0 500 1000 1500 2000 2500 1512 1635 1702 1610 1532 2027 2001 1369 1456 1950 2054 2272 Do Not Call Complaints *The number of complaints received in previous months may be revised from those previously reported. Figure 2: DNCR Act –warning letters to businesses sent per month 1
Transcript
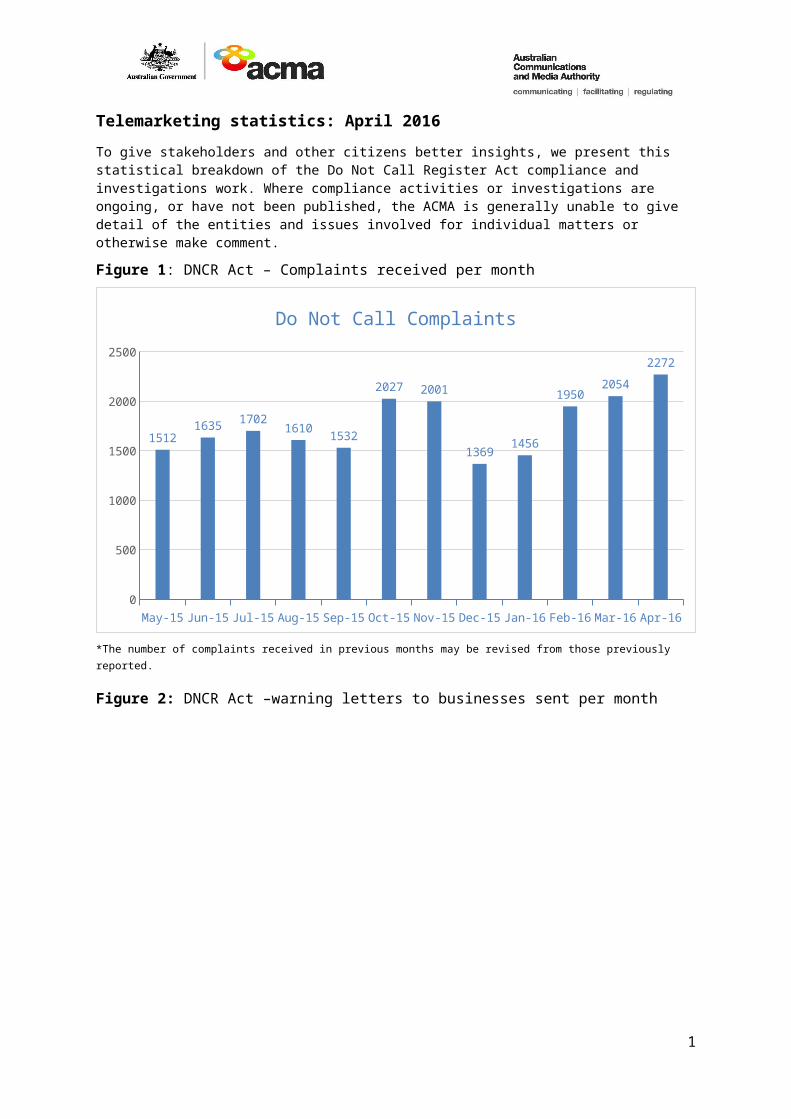
Telemarketing statistics: April 2016To give stakeholders and other citizens better insights, we present this statistical breakdown of the Do Not Call Register Act compliance and investigations work. Where compliance activities or investigations are ongoing, or have not been published, the ACMA is generally unable to give detail of the entities and issues involved for individual matters or otherwise make comment.
Figure 1: DNCR Act – Complaints received per month
* Advisory and informal warning letters represent an informal approach to compliance issues. Previous months may be revised from those previously reported. Note: Zero advisory/informal letters were sent in September 2015 – November 2015 due to a major IT transition.
1
Figure 3: DNCR Act - Current investigations as at 30 April 2016
44
DNCR Act: current investigations* as at 30 April 2016
Section 11(1) – calling numbers on register
Possible contraventions of the Telemarketing & Research Calls Industry Standard
*investigations can involve more than one issue
Figure 4: DNCR Act – Investigations finalised per month as at 30 April 2016
Apr-15
May-15
Jun-15Jul-1
5
Aug-15
Sep-15
Oct-15
Nov-15
Dec-15
Jan-16
Feb-16
Mar-16
Apr-16
0
1
2
1
0 0 0 0 0 0 0
2
0 0
1
0
DNCR Act: investigations finalised per month as at 30 April 2016*