Medicaid Mills: Fact or fiction by Janet B. Mitchell and Jerry Cromwell Physician nonparticipation in Medicaid programs not only will restrict access of the poor to mainstream medicine but will also encourage the development of large Medicaid prac- tices (LMPs). Policymakers have become increasingly con- cerned that these settings may be "Medicaid mills" in which low quality care is provided. Using HCFA survey data, this study examined the characteristics of LMPs, defined as prac- tices in which at least 30 percent of the patients are eligible for Medicaid. Nearly 60 percent of all Medicaid patients treated in private practices are seen in these LMPs (14.5 percent of all practices). Most LMPs do not appear to be Medicaid mills. LMP physi- cians earn what other physicians make at best; often they earn less. Nor is there any widespread abuse of ancillary services, skimping on auxiliary staff, or excessive markups over costs, all characteristic of Medicaid mills. Visit lengths are shorter in LMPs, but only by a minute or two. A substantial "credentials gap" does exist, however; the Medicaid market is dominated by less qualified physicians. LMP physicians tend to be older, non-board certified, and graduates of foreign medical schools. Recent investigations by Senator Frank Moss have spotlighted fraud and abuse in large Medicaid prac- tices. The Moss committee report provides a colorful, distressing portrait of Medicaid mills (U.S. Senate Special Committee on Aging, 1976). While fraudulent behavior and low quality care certainly were characteristic of these facilities, findings are limited to the handful of practices actually visited. In par- ticular, we have no way of determining whether such behavior is characteristic of large Medicaid practices (LMPs) generally. A high percentage distribution of Medicaid patients cannot be considered prima facie evidence of a mill, a point we return to in detail later in this paper. Poor quality of care in large Medicaid practices is allegedly a function of a lack of physician credentials, a high caseload, and excessive use of ancillary ser- vices, such as laboratory services and X-rays. The Moss report and a 1970 Senate Finance Committee report provide some evidence of ancillary overprescrip- tion. LMP physicians are generally believed to have less specialized training or less adequate training than other physicians. In particular, they have been described as disproportionately older (Kavaler, 1969), general practitioners (Sloan, Cromwell, and Mitchell, 1978; Jones and Hamburger, 1976), foreign medical graduates (Studnicki et al., 1976; Sloan, Cromwell, and Mitchell, 1978), and lacking hospital affiliations (Kavaler, 1969; Bloom, 1968). Finally, LMP physician caseloads have been described as exceedingly high, seriously limiting the amount of time the physi- cian spends with any one patient (Bloom, 1968). These descriptive studies suggest that large Medicaid practices are run by poorly trained but wealthy physicians who spend inadequate time with patients and overprescribe tests and procedures. Based on these studies, we cannot determine whether such behavior is characteristic of all large Medicaid practices, or whether it is limited to only a few true "Medicaid mills." Only one study used a national sam- ple, but it did not examine the question of large Medicaid practices directly (Sloan, Cromwell, and Mitchell, 1978). The remaining studies were based on a few, selected practices, usually in the same two cities, Chicago and New York. Perhaps most important, these studies generally had no other physician practices for comparison purposes. It is thus almost impossible to determine how many laboratory tests and injections are too many, whether office visits are too short, or whether practice loads are excessively high. The survey data presented in this paper enable us to com- pare large Medicaid practices with other physician This work was supported by HCFA Contract No. 500-78-0051 HEALTH CARE FINANCING REVIEW/SUMMER 1980 37
Transcript
Medicaid Mills Fact or fiction
by Janet B Mitchell and Jerry Cromwell
Physician nonparticipation in Medicaid programs not only will restrict access of the poor to mainstream medicine but will also encourage the development of large Medicaid pracshytices (LMPs) Policymakers have become increasingly conshycerned that these settings may be Medicaid mills in which low quality care is provided Using HCFA survey data this study examined the characteristics of LMPs defined as pracshytices in which at least 30 percent of the patients are eligible for Medicaid Nearly 60 percent of all Medicaid patients treated in private practices are seen in these LMPs (145 percent of all practices)
Most LMPs do not appear to be Medicaid mills LMP physishycians earn what other physicians make at best often they earn less Nor is there any widespread abuse of ancillary services skimping on auxiliary staff or excessive markups over costs all characteristic of Medicaid mills Visit lengths are shorter in LMPs but only by a minute or two A substantial credentials gap does exist however the Medicaid market is dominated by less qualified physicians LMP physicians tend to be older non-board certified and graduates of foreign medical schools
Recent investigations by Senator Frank Moss have spotlighted fraud and abuse in large Medicaid pracshytices The Moss committee report provides a colorful distressing portrait of Medicaid mills (US Senate Special Committee on Aging 1976) While fraudulent behavior and low quality care certainly were characteristic of these facilities findings are limited to the handful of practices actually visited In parshyticular we have no way of determining whether such behavior is characteristic of large Medicaid practices (LMPs) generally A high percentage distribution of Medicaid patients cannot be considered prima facie evidence of a mill a point we return to in detail later in this paper
Poor quality of care in large Medicaid practices is allegedly a function of a lack of physician credentials a high caseload and excessive use of ancillary sershyvices such as laboratory services and X-rays The Moss report and a 1970 Senate Finance Committee report provide some evidence of ancillary overprescripshytion LMP physicians are generally believed to have less specialized training or less adequate training than other physicians In particular they have been described as disproportionately older (Kavaler 1969) general practitioners (Sloan Cromwell and Mitchell 1978 Jones and Hamburger 1976) foreign medical
graduates (Studnicki et al 1976 Sloan Cromwell and Mitchell 1978) and lacking hospital affiliations (Kavaler 1969 Bloom 1968) Finally LMP physician caseloads have been described as exceedingly high seriously limiting the amount of time the physishycian spends with any one patient (Bloom 1968)
These descriptive studies suggest that large Medicaid practices are run by poorly trained but wealthy physicians who spend inadequate time with patients and overprescribe tests and procedures Based on these studies we cannot determine whether such behavior is characteristic of all large Medicaid practices or whether it is limited to only a few true Medicaid mills Only one study used a national samshyple but it did not examine the question of large Medicaid practices directly (Sloan Cromwell and Mitchell 1978) The remaining studies were based on a few selected practices usually in the same two cities Chicago and New York Perhaps most important these studies generally had no other physician practices for comparison purposes It is thus almost impossible to determine how many laboratory tests and injections are too many whether office visits are too short or whether practice loads are excessively high The survey data presented in this paper enable us to comshypare large Medicaid practices with other physician
This work was supported by HCFA Contract No 500-78-0051
HEALTH CARE FINANCING REVIEWSUMMER 1980 37
practices on a national basis for the first time In particular this paper sought to answer the question Are large Medicaid practices Medicaid mills
Data Sources
The primary data base for this analysis is the 1976 physician survey conducted by the National Opinion Research Center (NORC) for the Health Care Financing Administration (HCFA)1 This survey was a nationally representative sample of 3842 physicians in 15 specialties All physicians were in private practice and the vast majority (958 percent) were office-based Group practices with 10 or more physicians were exshycluded from the sampling frame2
An extensive questionnaire was administered to all physicians by telephone This questionnaire yielded data on practice costs work effort size and type of practice physician income and fees All information was based on physicians reports
Measurement error may be present if physicians refused to participate in the survey or if their informashytion was inaccurate or incomplete Given the negative publicity surrounding large Medicaid practices physishycians with such practices might be reluctant particishypants It is unlikely however that any significant nonresponse bias has been introduced for several reasons First the explicit objective of the survey was not to investigate such practices and in fact included only a single question on the extent of Medicaid parshyticipation Second analysis of the NORC-HCFA survey from the preceding year had found that physicians who did not respond did not differ from cooperating physicians in characteristics believed to be associated with large Medicaid practices such as specialty board-certification and foreign medical graduate (FMG) status (Sloan Cromwell and Mitchell 1978) Finally statistical weights associated with the 1976 sample include adjustments for nonresponse
Another source of potential error is the extent of under- or over-reporting by physicians who did take part in the survey Two areas of particular concern are physician net incomes and work effort Questionnaire data on physician net incomes and hours of work were used to assess the accuracy of survey responses (American Medical Association 1979) Specialty-specific means from the two sources were quite comshyparable Non-participation and non-response among physicians operating true Medicaid mills is still likely even given the validation procedures How serious a bias this creates is unknown
Three additional data sources were merged with the physician survey for this analysis Biographical inforshymation on individual survey physicians including such
1Data collection actually took place in 1977 cost and income data refer to the previous calendar year hence its designation as a 1976 survey All other data such as fees and visits refer to the actual year in which they were obtained (1977)
2Practices of this size include only six percent of all physishycians nationwide (AMA 1979) The practices exposed in the Moss committee report would not necessarily have been excluded by this particular sampling criterion Those mills were staffed by a range of health care providers only a few of whom were actually physicians
data as physician age board certification and medical school was obtained from the AMA Masterfile Demographic characteristics were obtained from the Area Resource File Two community variables per capita income and physician-population ratios were obtained from a more up-to-date source the AMAs Physician Distribution and Medical Licensure in the US 1976
Overview of Large Medicaid Practices
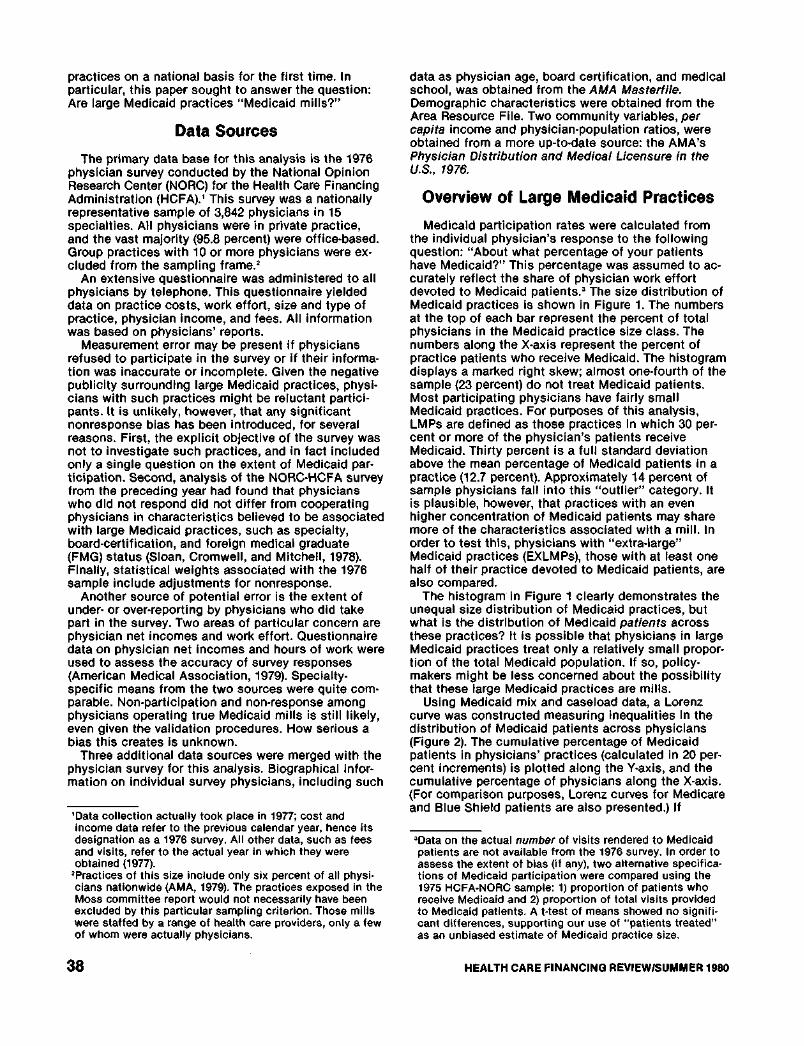
Medicaid participation rates were calculated from the individual physicians response to the following question About what percentage of your patients have Medicaid This percentage was assumed to acshycurately reflect the share of physician work effort devoted to Medicaid patients3 The size distribution of Medicaid practices is shown in Figure 1 The numbers at the top of each bar represent the percent of total physicians in the Medicaid practice size class The numbers along the X-axis represent the percent of practice patients who receive Medicaid The histogram displays a marked right skew almost one-fourth of the sample (23 percent) do not treat Medicaid patients Most participating physicians have fairly small Medicaid practices For purposes of this analysis LMPs are defined as those practices in which 30 pershycent or more of the physicians patients receive Medicaid Thirty percent is a full standard deviation above the mean percentage of Medicaid patients in a practice (127 percent) Approximately 14 percent of sample physicians fall into this outlier category It is plausible however that practices with an even higher concentration of Medicaid patients may share more of the characteristics associated with a mill In order to test this physicians with extra-large Medicaid practices (EXLMPs) those with at least one half of their practice devoted to Medicaid patients are also compared
The histogram in Figure 1 clearly demonstrates the unequal size distribution of Medicaid practices but what is the distribution of Medicaid patients across these practices It is possible that physicians in large Medicaid practices treat only a relatively small proporshytion of the total Medicaid population If so policy-makers might be less concerned about the possibility that these large Medicaid practices are mills
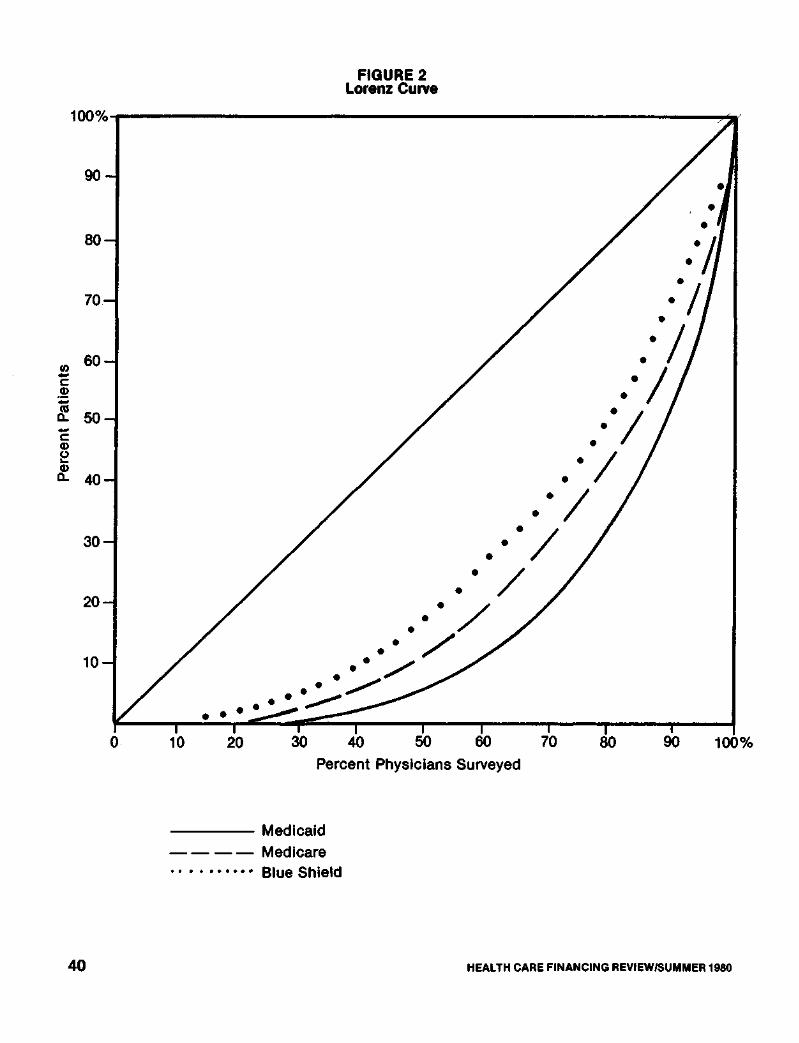
Using Medicaid mix and caseload data a Lorenz curve was constructed measuring inequalities in the distribution of Medicaid patients across physicians (Figure 2) The cumulative percentage of Medicaid patients in physicians practices (calculated in 20 pershycent increments) is plotted along the Y-axis and the cumulative percentage of physicians along the X-axis (For comparison purposes Lorenz curves for Medicare and Blue Shield patients are also presented) If
3Data on the actual number of visits rendered to Medicaid patients are not available from the 1976 survey In order to assess the extent of bias (if any) two alternative specificashytions of Medicaid participation were compared using the 1975 HCFA-NORC sample 1) proportion of patients who receive Medicaid and 2) proportion of total visits provided to Medicaid patients A t-test of means showed no signifishycant differences supporting our use of patients treated as an unbiased estimate of Medicaid practice size
HEALTH CARE FINANCING REVIEWSUMMER 1980 38
FIGURE 1 Medicaid Participation Rate for All
Physicians
Percent Medicaid Patients
HEALTH CARE FINANCING REVIEWSUMMER 1980 3 9
Per
cent
Pat
ient
s FIGURE 2
Lorenz Curve
Percent Physicians Surveyed
Medicaid Medicare Blue Shield
4 0 HEALTH CARE FINANCING REVIEWSUMMER 1980
Medicaid patients were perfectly distributed across practices all would be small Medicaid practices (SMPs) and the Lorenz curve would coincide with the straight diagonal line In fact the observed distribushytion indicates considerable unevenness in the distribushytion of Medicaid patients Three-quarters of sample physicians care for only 26 percent of the total Medicaid population Almost one-third (318 percent) of all Medicaid patients on the other hand are treated by 55 percent of the physicians A small number of physicians appear to have assumed responsibility for a large proportion of the nations poor
The Gini Index of Concentration provides a sumshymary statistic of the extent of inequality shown by the Lorenz curve and is calculated as the ratio of the area between the diagonal and curved line to that of the total triangle It ranges from zero to one with zero representing complete equality (that is the curved line lies on the diagonal) and one perfect inequality The Gini coefficient for Medicaid patients is 06520 indishycating considerable maldistribution By contrast the Gini coefficient for physician distribution is 01558 (Morrow 1977) indicating that physicians are much more evenly distributed across the population genshyerally than are Medicaid patients across physicians For reference we note that the distribution of both Blue Shield and Medicare is more even than Medicaid although significant inequalities still remain The Gini coefficients for Blue Shield and Medicare patients are 04649 and 05419 respectively
The Lorenz curve suggests that LMP physicians not only devote a large proportion of their practice to
Medicaid but that they also see the majority of all Medicaid patients treated in private practices The EXLMPs alone see 318 percent of all Medicaid recipshyients and together with other LMP physicians they provide care to over one-half of this Medicaid pool (584 percent) Analysis of these LMPs is certainly warshyranted for policy purposes If even a minority of them are in fact Medicaid mills the quality of care will be diminished for a very large number of public patients
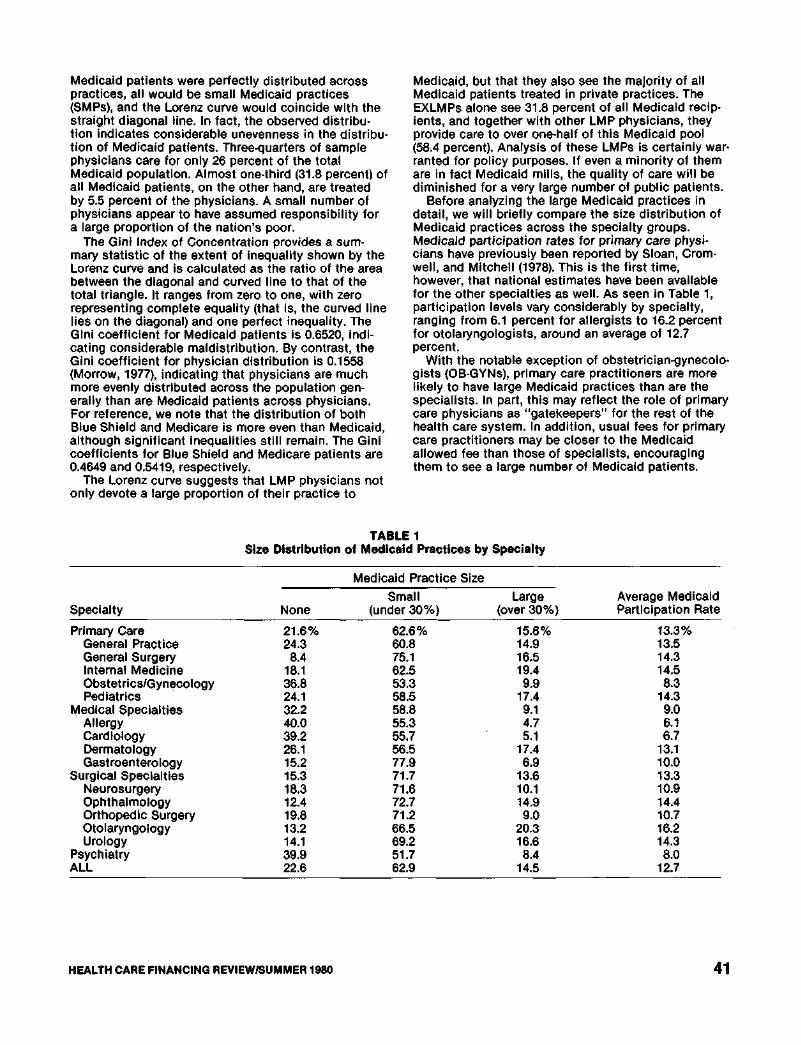
Before analyzing the large Medicaid practices in detail we will briefly compare the size distribution of Medicaid practices across the specialty groups Medicaid participation rates for primary care physishycians have previously been reported by Sloan Cromshywell and Mitchell (1978) This is the first time however that national estimates have been available for the other specialties as well As seen in Table 1 participation levels vary considerably by specialty ranging from 61 percent for allergists to 162 percent for otolaryngologists around an average of 127 percent
With the notable exception of obstetrician-gynecoloshygists (OB-GYNs) primary care practitioners are more likely to have large Medicaid practices than are the specialists In part this may reflect the role of primary care physicians as gatekeepers for the rest of the health care system In addition usual fees for primary care practitioners may be closer to the Medicaid allowed fee than those of specialists encouraging them to see a large number of Medicaid patients
TABLE 1 Size Distribution of Medicaid Practices by Specialty
Medicaid Practice Size
Small Large Average Medicaid Specialty None (under 30) (over 30) Participation Rate
Primary Care 216 626 158 133 General Practice 243 608 149 135 General Surgery 84 751 165 143 Internal Medicine 181 625 194 145 ObstetricsGynecology 368 533 99 83 Pediatrics 241 585 174 143
Both medical and surgical specialists have undergone additional years of professional training and can (and do) command high fees for their sershyvices Human capital theory would hypothesize that all specialists regardless of specialty type would find Medicaid fee schedules relatively less attractive and hence be less likely to participate In spite of this the two groups differ markedly in their mean levels of Medicaid participation Medical specialists are twice as likely as their surgical colleagues not to participate in Medicaid (322 percent vs 153 percent) and likeshywise have far fewer LMPs Surgical specialists on the other hand more closely resemble primary care practishytioners in their average willingness to treat Medicaid patients
The descriptive and multivariate analyses of large Medicaid practices that follow are limited to the five major specialties generalfamily practice general surgery internal medicine OB-GYN and pediatrics (with an unweighted sample size of 1796) These specialties constitute over one-half of office-based patient care physicians nationwide Primary care physicians also provide access to ambulatory medical care an area of great concern to Federal policy makers Finally it is these physicians who have been most frequently identified as running Medicaid mills
Comparisons and statistical tests of LMPs may vary as a function of the physician group used as a refershyence point By the very fact of their nonparticipation physicians with no Medicaid patients are a unique group they are a small group relative to SMP physishycians and they tend to be older and politically more conservative (Sloan Cromwell and Mitchell 1978) Physicians with SMPs on the other hand can be conshysidered a modal form of medical practice and one that policymakers want to encourage In both descriptive and multivariate analyses LMP physicians (and those with extra-large Medicaid practices) will be contrasted with SMP physicians
Descriptive Analysis of Large Medicaid Practices
PRACTICE LOCATION
Large Medicaid practices are often considered an urban phenomenon located primarily in the ghettos of our largest cities This image however does not square with the facts Table 2 displays the size of Medicaid practice by geographic location large (greater than 14 million) small and non-metropolitan area high (greater than 7 percent) and low Medicaid population as a share of total county population and
TABLE 2 Geographic Location by Size of Medicaid Practice1
(percentage distributions)
Medicaid Practice Size
Location None Small Large Extra-Large
Large Metropolitan 490259 378594 393107 32240 High Medicaid 101323 51481 5690 139106 Low Medicaid 389246 327617 337110 18327
Small Metropolitan 360199 381628 385110 48764 High Medicaid 1673 53702 48108 113117 Low Medicaid 344216 328617 337110 37456
Region North East 277214 293655 9236 54096 North Central 212215 233683 16483 8219 South 382277 275577 314117 19733 West 128134 199599 429223 18243 1Percentages to the left of the slash (I) sum to 100 within each column Percentages to the right sum by row
4 2 HEALTH CARE FINANCING REVIEWSUMMER 1980
region of the country4 Both SMPs and LMPs exhibit the same distribution across large and small metropolitan areas while EXLMPs are actually more prevalent in small metropolitan areas EXLMPs thereshyfore are more likely than SMPs to be in small cities which is certainly unexpected Nearly one out of every five LMPs and EXLMPs furthermore is located in a non-metropolitan or rural area Most LMPs are not located in the large industrial cities in the North but rather in the South and West The EXLMPs however are primarily located in the Northeast as expected
PHYSICIAN INCOMES
One of the biggest concerns of policymakers is the incomes enjoyed by physicians in LMPs The presumption is that many are making extraordinary incomes taking advantage of a fully insured but medically unsophisticated population After adjusting for specialty and geographic cost-of-living differences however there is little evidence to support these claims no salient pattern exists as Medicaid particishypation increases There are no significant differences in mean net incomes between SMP and LMP physishycians General practitioners general surgeons and inshyternists with EXLMPs actually earn significantly less the average EXLMP general practitioner earns $44447 compared with $56841 for his SMP colleague OB-GYNs and pediatricians have net incomes comparable to their SMP peers A small number of LMP physicians do earn unusually high incomes which is surprising given the generally low Medicaid fee schedules This group was identified for additional analyses which are presented in a later section
Adjusting income for work effort does not alter the overall conclusion that LMP and EXLMP physicians as a whole are not enjoying extraordinary returns If anything hourly earnings are lower in practices serving large numbers of Medicaid patients This is particularly true of general practitioners in LMPs and EXLMPs whose earnings per hour are (respectively) four to seven dollars less than those in SMPs Even though LMP and EXLMP physicians report incomes and earnings per hour no greater than in other pracshytices (and often lower) one could still argue that these hourly earnings are unjustified given their background and training a point addressed in the following section
PHYSICIAN CREDENTIALS
Physicians who specialize in Medicaid patients have been characterized as having fewer credentials on average than other physicians To the extent that these physicians have less or inadequate training Medicaid recipients in their practices may be receiving lower quality care LMP and EXLMP physicians do have fewer credentials on average than do SMP physishycians but these differences are not linear with respect
4The size distribution of Medicaid practices across geographic areas will vary as a function of private demand physician supply and the eligibility and reimbursement procedures of State Medicaid programs For a detailed exposition of the economic theory of large Medicaid pracshytices and econometric analysis see Mitchell and Cromwell 1979
to size of Medicaid practice General practitioners dominate the extra-large Medicaid practices almost three-fifths of physicians in these practices (592 pershycent) are general practitioners as compared with only 399 percent of the SMPs By contrast the LMPs inshyclude a significantly higher proportion of internists (305 percent) than do SMPs (209 percent) Both LMP and EXLMP physicians are significantly less likely to be board-certified (321 percent and 159 percent) comshypared with 428 percent for SMPs
Twice as many FMGs are found in LMPs as in SMPs one out of every five physicians with a large Medicaid practice was trained outside the US Using a more restrictive definition of Third World FMGs5 LMPs include three times as many FMGs 145 percent versus 48 percent Surprisingly the extra-large Medicaid practices do not include any more FMGs however defined than do the SMPs
Some policymakers have expressed concern that large Medicaid practice physicians are older and that this may detract from the quality of care not because these physicians are incompetent but simply because they have not been trained in the newer medical techshynology Similarly physicians without hospital affiliashytions may provide less up-to-date care if they are unable to admit their patients to the hospital Only EXLMP physicians appear to fit this characterization they are significantly more likely to be 60 years of age or older (461 percent compared with 288 percent of SMPs) and less likely to be affiliated with a hospital (5 percent vs 15 percent)
Earlier we introduced the possibility that LMP physicians may be enjoying incomes that if not exshycessive compared to other physicians were relatively high given their background and training To test this hypothesis adjusted hourly earnings of all primary care physicians were regressed on the list of physishycian credentials (including age) and other exogenous variables that might affect returns to labor6 Residuals from this regression should reflect returns over-andshyabove those attributable either to the background and training of the physician or to location choice Holding both credentials and economic factors constant there is no evidence that the LMP or EXLMP physicians as a group earn extraordinary incomes In fact just the opposite is the case physicians with Medicaid-dominated practices earn significantly less per hour worked than their peers who see a smaller number of Medicaid patients all else being equal
CASELOAD AND WORK EFFORT
Physician caseloads have been a major concern in large Medicaid practices for two reasons First relatively high volume in these practices suggests that many Medicaid visits may be of marginal benefit or even unnecessary Any such induced demand by
5As some foreign medical schools are generally believed to have better curricula than others we distinguish Third World FMGs from other FMGs The Third World FMG is defined here as a graduate from a non-Western European non-English speaking country Graduates from Mexican schools are excluded as many are American citizens
6This list was drawn from Sloan (1974) For a theoretical discussion of the hours worked equation the reader is referred to his work
HEALTH CARE FINANCING REVIEWSUMMER 1980 43
physicians will clearly drive up Medicaid expenditures Second high LMP volume may be achieved through shorter physician contacts thus lowering quality of care for Medicaid recipients
Physicians in both LMPs and EXLMPs make signifishycantly more visits in toto than do those in SMPs approximately 10 percent more on average (Table 3) Allocation of total visits also varies across visit cateshygories Physicians in EXLMPs are less hospital based than those in SMPs providing significantly fewer visits in inpatient settings and more in their offices Both LMP and EXLMP physicians however allocate a significantly higher proportion of their caseload to emergency room and clinic visits Absolute ERclinic visits are also significantly higher in LMPs and EXLMPs 144 and 145 visits per week compared with 93 in SMPs This is somewhat disturbing as a major Medicaid policy objective is to discourage the utilizashytion of institutional sources of ambulatory care
LMP and EXLMP physicians clearly have higher caseloads but for policy purposes this would not matshyter if they worked longer hours As seen in Table 3 however there are no differences in total hours by size of Medicaid practice Are patients hurried through the physicians office on an assembly line basis Table 3 suggests they are not Physicians in large Medicaid practices do spend less time with office patients but the differences are trivial office visits are only two minutes shorter on average Furthermore the length of visit in extra-large Medicaid practices is no different than in SMPs7
7Lengths of visit could systematically vary by patient class that is the LMP physician might spend less time with Medicaid patients than private patients but still achieve mean visit lengths comparable to those of SMPs Of course this becomes increasingly difficult as the Medicaid share of the practice grows Regression analysis by Sloan and Lorant (1976) furthermore has also found that the pershycent of practice Medicaid has no impact on length-of-visit
GROSS REVENUES COSTS AND MARKUPS
Besides the natural concern over the quality and continuity of care afforded Medicaid patients in LMPs there is a general feeling expressed in Congressional testimony and elsewhere that significant numbers of LMP physicians are financially abusing the system If this is the case it is not reflected in physician net inshycome as we have already shown High markups and gross billings however remain a concern
Table 4 presents gross revenues costs and net revenues (or markups) per visit for the five primary care specialties by extent of Medicaid participation Both gross revenues per visit and markups fall as exshytent of Medicaid participation increases Excluding high income LMPs LMP markups are only 82 percent of SMP markups ($912$ 1119) EXLMP markups are only 58 percent as much ($651$1119) Including high income LMPs the average LMPSMP markup ratio is 86 percent LMP markups as a whole are lower primarily because of lower gross revenues per visit not lower costs Average costs per visit in LMPs are 96 percent of costs in SMPs but gross revenues per visit are only 90 percent EXLMP gross revenues per visit are even lower (only 68 percent of SMPs) A breakdown by specialty shows essentially the same pattern of declining gross revenues and markups as Medicaid participation rises
ANCILLARY SERVICES
The excessive use of ancillary services is an identishyfying characteristic of Medicaid mills Although it is not possible to determine the medical necessity of the ancillaries provided in large Medicaid practices we can compare the frequency with which they are ordered to SMPs The HCFA survey asked each physishycian to estimate the percent of office visits for which
TABLE 3 Caseload Visit Locus and Work Effort by Size of Medicaid Practice
Effort Per Week
Total Visits Percentage1
Office Inpatient Operations Emergency RoomClinic Nursing Home House Calls
Total Patient Care Hours Length of Office Visit (minutes)
Size of Medicaid Practice
Small Large Extra Large None (under 30) (30-49) (50 or more)
1571 1693 18813 18593
708 616 606 6932
218 286 2554 1972
18 22 27 102
26 52 713 773
14 16 304 16 16 07 05 07
472 515 526 513 220 196 1783 197
1May not sum to 100 due to rounding 2Significant from SMP mean at 1 confidence level 3Significant from SMP mean at 5 confidence level 4Significant from SMP mean at 10 confidence level
4 4 HEALTH CARE FINANCING REVIEWSUMMER 1980
he or she ordered four types of services laboratory tests injections or immunizations X-rays and office surgery
Evidence that large and extra-large Medicaid pracshytices order excessive ancillaries is ambiguous at best Higher utilization rates by one specialty are often offshyset by lower rates for another specialty General surgeons and OB-GYNs with large Medicaid practices order significantly more tests but internists and pediatricians prescribe significantly fewer EXLMP physicians furthermore use laboratory services at the same rate as their colleagues in small Medicaid pracshytices Injections however appear to be used at exshyceedingly high rates in both LMPs and EXLMPs relative to SMPs This prescribing behavior is shared by all specialty groups except pediatricians but is most pronounced among internists EXLMP internists order injections for almost one-half of all their office patients (452 percent) a rate almost three times that of SMPs (162 percent)
There are no differences in X-ray utilization by size of Medicaid practice and differences in office surgical rates are inconsistent once broken down by specialty General practitioners and internists in LMPs perform significantly more procedures while surgeons and EXLMP pediatricians perform fewer The absolute levels of office surgery are generally low however in all groups
INPUTS
In addition to his or her own time the primary inputs to the physicians practice are auxiliary staff such as clerical and nursing personnel Physicians vary considerably however in the number and type of such personnel and in the effectiveness with which they employ them If large Medicaid practices are more efficient in their use of auxiliary staff this may explain their higher practice volume By delegating tasks to clerical and nursing staff these physicians may increase their total productivity (visits per physishycian hour) and lower average costs per visit Altershynatively large Medicaid practices may skimp on such inputs in order to lower practice costs and increase physician net revenues
LMPs employ significantly more nonphysician pershysonnel notably clerks LPNs and nurse practitioners 26 on average compared with 21 for SMPs Their higher use of LPNs may partially explain why LMP physicians see more patients per hour while more clerical personnel may be necessary to handle the added administrative work associated with Medicaid reimbursement The EXLMPs however do not employ significantly more clerks than SMPs suggesting that they either find Medicaid administrative procedures less onerous or that they have become more proficient in obtaining payment Although total staff-to-physician ratios are not higher in EXLMPs these practices do use significantly more nursing personnel both RNs
TABLE 4 Gross Revenues Costs and Markups Per Visit by Specialty by Size of Medicaid Practice
Medicaid practice Size
SpecialtyIncome or Cost Category None Small Large1 Extra-Large1
General Practitioner GRV $1622 $1413 $1128 $ 926
CV 731 538 424 449 NET RV 891 876 704 476
General Surgeon GRV 2593 2096 2246 1429
CV 789 622 890 644 NET RV 1804 1474 1356 785
Internist GRV 1876 1841 1324 2040
CV 637 640 580 758 NET RV 1239 1201 744 1282
OB-GYN GRV 2002 2325 2203 1578
CV 748 834 871 654 NET RV 1254 1491 1332 924
Pediatrician GRV 1587 1179 1200 908
CV 528 450 487 439 NET RV 1059 729 713 469
Total GRV 1794 1718 1531 1175
CV 699 599 619 524 NET RV 1095 1119 912 651
1Excludes high income Medicaid practices (over $80000) GRV = gross revenues per visit
CV = practice costs per visit NET RV = net revenues per visit (markups)
HEALTH CARE FINANCING REVIEWSUMMER 1980 45
and LPNs This suggests that EXLMP physicians may delegate more medical tasks than other physicians
Discriminant Analysis of Large Versus Small Medicaid Practices
Physicians with a large proportion of Medicaid pashytients appear to differ from SMP physicians in signifishycant ways such as credentials caseload practice style and net incomes Many of these characteristics are interrelated however and cross-tabular analysis does not adequately adjust for this If large Medicaid practices are truly different from smaller Medicaid practices in ways that affect quality of care we should be able to statistically distinguish between the two groups
How might we identify Medicaid mills from large Medicaid practices generally First it seems reasonable to assume that Medicaid mill physicians are successful at what they do That is we would exshypect them to be earning higher incomes on average Second the process of medical care will be signifishycantly poorer in mills as measured by shorter visit lengths higher rates of ancillary utilization and fewer inputs While Medicaid mills may be run by less well-trained physicians this is not a necessary condition for a mill Nevertheless for policy purposes we are concerned about a relative lack of training in LMPs as this will restrict access by the poor to specialized sershyvices If LMPs (and EXLMPs) are a unique group then a discriminant function with these variables (income process measures of quality and credentials) should distinguish them from other physician practices Discriminant analysis is used to analyze two groups of practices small and large Medicaid practices (Nonshyparticipants are omitted from this analysis) Since practice characteristics are often different in LMPs and EXLMPs we will derive two discriminant funcshytions 1) where LMPs are defined as practices with 30 percent or more Medicaid patients (which we will call MILL1 for identification purposes) and 2) LMPs defined as at least 50 percent Medicaid patients vershysus all other Medicaid practices (MILL2)
Three sets of discriminating variables are included with each function income process measures of quality and credentials In order to adjust for differshyences in hours worked the income variable is defined as the physicians imputed hourly wage (MDWAGE) Physicians in large Medicaid practices are hypotheshysized to be distinguished by their higher net earnings all else being equal
If large Medicaid practices tend to be mills then they should be characterized by lower quality care on all dimensions In particular physicians in these pracshytices should spend less time with patients order more ancillary services and employ fewer aides The variable LOV the length of time spent with each office patient is measured in fractions of an hour The variables TEST SHOT XRAY and SURG are specified as the percent of office patients for whom the physishycian ordered laboratory tests injections X-rays and office surgery respectively AIDE is the number of auxiliary staff employed in the practice and is exshypressed as fulltime equivalents per physician
Physician credentials include specialty board-certification FMG status age and hospital affiliashytions These variables are included in part as adjustshyments for the process measures variations in ancillary utilization for example between the two groups may reflect differences in specialty mix Physician credenshytials are also of analytical interest in their own right LMP physicians should be distinguishable from their colleagues as older general practitioners and foreign medical graduates without board certification or hospital affiliation Specialty is specified as four dummy variables GS IM OB and PED for general surgeons internists OB-GYNs and pediatricians respectively General practitioners constitute the omitted category BOARD and FMG both assume the value of one if the physician is board-certified or if he or she is a Third World FMG The variables MDAGE and HOSAFIL are set equal to one if the physician is 60 years or older and if he or she lacks hospital affiliations respectively
EMPIRICAL FINDINGS
Means of the discriminating variables and the results of the analysis are presented in Table 5 The statistically significant coefficients associated with many of the variables indicate that both functions do discriminate between the two groups A negative sign indicates that large Medicaid practices share a parshyticular characteristic for example more FMGs and that this characteristic distinguished them from smaller Medicaid practices
MDWAGE the physicians imputed net hourly wage is a significant discriminatory variable in both funcshytions Regardless of how we define large Medicaid practices physicians in these practices are distinshyguished from smaller Medicaid practices by their lower per hour earnings
Six process measures of quality were included in the analysis If large Medicaid practices were mills providing poor quality care then the four ancillary sershyvice variables (TEST SHOT XRAY and SURG) should have significant negative coefficients and the coeffishycients for the input variables (LOV and AIDE) should have significant positive signs Based on prior expectations LMPs have only a single mill-like characshyteristic physicians in these practices do order signifishycantly more injections The relative magnitude of this variable nevertheless indicates that SHOT is a powershyful discriminatory variable Unmeasured casemix variashytions might account for some of this difference although specialty does provide a partial adjustment Nevertheless the fact that only one of six quality measures is suggestive of poor care in LMPs conshytradicts the general notion that mills and large Medicaid practices are synonymous
Credentials however clearly separate the LMP physician from his SMP counterpart In the first discriminant function we see that large Medicaid practices are characterized by their higher proportion of specialists These specialists tend to be less qualified than those in SMPs however in terms of FMG status and board certification When we define LMPs as at least 50 percent Medicaid (MILL2) LMPs
HEALTH CARE FINANCING REVIEWSUMMER 1980 46
do not differ from other practices in their mix except for fewer internists Again they are less likely to be run by board-certified physicians The FMG variable is also significant but with the opposite sign LMPs however defined are run by older physicians without hospital affiliations Nevertheless their relative lack of credentials does not qualify them as mill operators instead many are undoubtedly running LMPs by default rather than by design These may be aging general practitioners for example who have become isolated in inner-city or rural areas by historical forces and now serve a primarily low-income population
High Income LMPs Are They Medicaid Mills
While it does not appear that most LMPs are Medicaid mills there is a class of LMPs which deserves special attention namely that where physishycians earn unusually high incomes (HILMPs) HILMPs
were defined as those in which physicians reported net incomes of $80000 or more Considering the presumably lower Medicaid fees they receive for a large percentage of their patients how do they manage to enjoy incomes so much higher than other LMPs with similar revenue constraints Even more puzzling is why their incomes are over 50 percent higher than the average income of a physician operating a small Medicaid practice when the latter should be receiving higher fees Clearly LMP physishycians at the tail of the income distribution are either much more productive than the average physician receive unusually high fees generate a much larger number of profitable ancillary services or cut costs inshyappropriately Does this subset of all LMPs comprise the Medicaid mills so often maligned in Congressional testimony A separate analysis of these practices may shed further light on the behavior of LMPs and the need for specific public action
TABLE 5 Discriminant Analysis Results for Small Versus Large Medicaid Practices
RC = 029 RC = 024 1F-ratio insufficient for entry 2Associated chi-square statistic significant at 1 percent level 3F-ratio significant at 10 percent level 4F-ratio significant at 5 percent level 5F-ratio significant at 1 percent level
HEALTH CARE FINANCING REVIEWSUMMER 1980 4 7
Table 6 provides some summary data on HILMPs contrasting them with SMPs and other LMPs8 Comshypared to their colleagues HILMP physicians are older and much more likely to be foreign trained but surshyprisingly more specialized While 399 percent of SMPs are run by general practitioners only 136 pershycent of HILMPs do not specialize General surgeons and internists are disproportionately represented in the HILMP group 721 percent versus 413 percent of SMPs and 395 percent of the other LMPs
Although specialists generally see fewer patients per week and spend more time with each one the HILMP group sees 15 percent more patients per week (Table 6) Most of the extra visits are provided in the hospital which is consistent with the HILMP specialty mix Particularly striking are the significantly shorter visit lengths HILMP physicians spend 34 minutes less with their office patients compared to SMP physicians
TABLE 6 Summary Characteristics HILMPs vs SMPs and
Other LMPs
Medicaid Practice Size Characteristic SMPs LMPs HILMPs
Foreign Medical Graduate 122 Third World FMG 48
206 89
2291
1802
Board Certification 428 286 368 MD is 60 years or older 288 Total Visits 1692
337 1905
4312
20622
Length of Office Visit (mins) 196
Net Income $60571 188
$57007 1623
$964471
Imputed Hourly Wage $2440 $2193 $37491
1Significant from SMP mean at 10 confidence level 2Significant from SMP mean at 5 confidence level 3Significant from SMP mean at 1 confidence level
As HILMPs were originally identified by their conshyspicuous incomes it is not surprising that net incomes in this group are $36000 higher on average than in SMPs HILMP incomes ranged from $101453 for general practitioners to $92592 for pediatricians As physician hours do not vary between groups the imputed hourly wage varies directly with income and is consistent across all specialties although insignifishycant for OB-GYNs This is true even after earnings were adjusted using the hours worked equation described earlier Holding demand physician competishytion and credentials constant HILMP physicians still earn significantly more than physicians with a small Medicaid caseload
How can we explain the greater earning power of these HILMP physicians Part of the answer unshydoubtedly lies in their heavier caseloads which they achieve by shortening the length of patient contacts The high incomes of these physicians are also exshyplained by the higher Medicaid fees they enjoy $1051 for an office visit on average compared with $844 for SMPs and $836 for other LMPs Sixty percent of
8For more detailed specialty-specific comparisons the reader is referred to Mitchell and Cromwell (1979)
HILMPs are located in the South where State Medishycaid programs tend to employ more generous reimshybursement procedures in determining allowable fees
Policy Implications
Although some HILMPs have mill-like characterisshytics LMPs generally cannot be considered Medicaid mills as described by Senator Moss Nevertheless a primary goal of the Medicaid program the integration of the poor into mainstream medicine has not been completely attained Davis and Reynolds (1976) have shown that unadjusted utilization rates may overestishymate the impact of Medicaid in improving access of the poor to health care It is also necessary to adjust for health status the poor tend to be sicker and hence require disproportionately more services Our findings suggest another dimension of Medicaid access that needs to be considered the credentials of the provider
Medicaid beneficiaries appear to constitute a secondary market served by less qualified physicians Increases in physician supply may widen this gap even further as competition for private patients squeezes out the less well trained physicians the FMG and the older GP To make what they feel is a decent living these marginal practitioners may have to see a larger and larger number of Medicaid pashytients Current policies which set Medicaid fees at or well below those of other insurers simply reinforce this two-tiered form of medicine Access to ambulashytory care whatever the background of the physician may be better than no care at all it may even be adeshyquate but it is not equal
We really know very little about the impact of basic program elements on the quantity and quality of physishycian services under Medicaid From our previous research we do know that raising Medicaid fee schedshyules does increase participation on average (Sloan Cromwell and Mitchell 1978) Reducing payment delays and streamlining overall administration has a similar effect More liberal benefits and eligibility reshyquirements on the other hand actually encourage the development of LMPs (Mitchell and Cromwell 1979) but we know almost nothing about the welfare losses associated with limited coverage
The success of such changes in the Medicaid proshygram may depend on the local distribution of the poor the distribution of physicians and the financial attracshytiveness of the private market For example if physishycians and the poor are fairly evenly distributed across the population then higher Medicaid fees could significantly improve access without fostering undesirable kinds of LMPs If however the poor are highly segregated (as in many urban ghettos) higher fees may only result in larger and larger Medicaid practices Additional research is needed on the elements of the Medicaid program which foster the growth of LMPs
Because of the Moss investigations LMPs have been subject to a blanket criticism which essentially makes serving the poor a disreputable occupation Exshyposes may discourage illegal behavior but they may also have the unintended side effect of discouraging
HEALTH CARE FINANCING REVIEWSUMMER 1980 48
altruistic physicians from expanding their practices in underserved areas Current fraud and abuse activities furthermore do not address the credentials gap they focus only on the over-utilizers Program reform on the other hand should improve both access and quality of care as more qualified physicians will be attracted to the Medicaid market providing the poor with an alternative to Medicaid mills
Acknowledgment
The authors gratefully acknowledge the support of their HCFA project officer Benson Dutton and the fine programshyming assistance of Deborah Hamill
References
American Medical Association Profile of Medical Practice Chicago AMA Center for Health Services Research and Development 1979
Bloom Lawrence S et al Medicaid in Cook County Present Status and Future Prospects Inquiry 513-23 June 1968
Davis Karen and Roger Reynolds The Impact of Medicare and Medicaid on Access to Medical Care pp 391-425 in Richard N Rosett ed The Role of Health Insurance in the Health Services Sector NY National Bureau of Economic Research 1976
Jones M W and B Hamburger A Survey of Physician Parshyticipation in and Dissatisfaction with the Medi-Cal Program The Western Journal of Medicine 124 75-83 January 1976
Kavaler F Medicaid in New York Utopianism and Bare Knuckles in Public Health People Providers and Payment Telling It How It Is American Journal of Public Health 59 820-5 May 1969
Mitchell Janet B and Jerry Cromwell Large Medicaid Pracshytices Are They Medicaid Mills Final report submitted to the Health Care Financing Administration October 1979
Morrow James S Toward a More Normative Assessment of Maldistribution The Gini Index Inquiry 14 278-92 September 1977
Sloan Frank A A Microanalysis of Physicians Hours of Work Decisions pp 302-25 in Mark Perlman ed The Economics of Health and Medical Care London MacMillan 1974
Sloan Frank A and John H Lorant The Allocation of Physishycians Services Evidence on Length-of-Visit Quarterly Review of Economics and Business 16 3-103 Autumn 1976
Sloan Frank A Jerry Cromwell and Janet B Mitchell Private Physicians and Public Programs Lexington MA DC Heath 1978
Studnicki James et al Foreign Medical Graduates and Maryland Medicaid New England Journal of Medicine 294 1153-7 May 20 1976
US Senate Special Committee on Aging Subcommittee on Long Term Care Fraud and Abuse Among Practitioners Parshyticipating in the Medicaid Program Washington DC Government Printing Office August 1976
US Senate Committee on Finance Medicare and Medicaid Problems Issues and Alternatives Washington DC Government Printing Office February 9 1970
HEALTH CARE FINANCING REVIEWSUMMER 1980 4 9
practices on a national basis for the first time In particular this paper sought to answer the question Are large Medicaid practices Medicaid mills
Data Sources
The primary data base for this analysis is the 1976 physician survey conducted by the National Opinion Research Center (NORC) for the Health Care Financing Administration (HCFA)1 This survey was a nationally representative sample of 3842 physicians in 15 specialties All physicians were in private practice and the vast majority (958 percent) were office-based Group practices with 10 or more physicians were exshycluded from the sampling frame2
An extensive questionnaire was administered to all physicians by telephone This questionnaire yielded data on practice costs work effort size and type of practice physician income and fees All information was based on physicians reports
Measurement error may be present if physicians refused to participate in the survey or if their informashytion was inaccurate or incomplete Given the negative publicity surrounding large Medicaid practices physishycians with such practices might be reluctant particishypants It is unlikely however that any significant nonresponse bias has been introduced for several reasons First the explicit objective of the survey was not to investigate such practices and in fact included only a single question on the extent of Medicaid parshyticipation Second analysis of the NORC-HCFA survey from the preceding year had found that physicians who did not respond did not differ from cooperating physicians in characteristics believed to be associated with large Medicaid practices such as specialty board-certification and foreign medical graduate (FMG) status (Sloan Cromwell and Mitchell 1978) Finally statistical weights associated with the 1976 sample include adjustments for nonresponse
Another source of potential error is the extent of under- or over-reporting by physicians who did take part in the survey Two areas of particular concern are physician net incomes and work effort Questionnaire data on physician net incomes and hours of work were used to assess the accuracy of survey responses (American Medical Association 1979) Specialty-specific means from the two sources were quite comshyparable Non-participation and non-response among physicians operating true Medicaid mills is still likely even given the validation procedures How serious a bias this creates is unknown
Three additional data sources were merged with the physician survey for this analysis Biographical inforshymation on individual survey physicians including such
1Data collection actually took place in 1977 cost and income data refer to the previous calendar year hence its designation as a 1976 survey All other data such as fees and visits refer to the actual year in which they were obtained (1977)
2Practices of this size include only six percent of all physishycians nationwide (AMA 1979) The practices exposed in the Moss committee report would not necessarily have been excluded by this particular sampling criterion Those mills were staffed by a range of health care providers only a few of whom were actually physicians
data as physician age board certification and medical school was obtained from the AMA Masterfile Demographic characteristics were obtained from the Area Resource File Two community variables per capita income and physician-population ratios were obtained from a more up-to-date source the AMAs Physician Distribution and Medical Licensure in the US 1976
Overview of Large Medicaid Practices
Medicaid participation rates were calculated from the individual physicians response to the following question About what percentage of your patients have Medicaid This percentage was assumed to acshycurately reflect the share of physician work effort devoted to Medicaid patients3 The size distribution of Medicaid practices is shown in Figure 1 The numbers at the top of each bar represent the percent of total physicians in the Medicaid practice size class The numbers along the X-axis represent the percent of practice patients who receive Medicaid The histogram displays a marked right skew almost one-fourth of the sample (23 percent) do not treat Medicaid patients Most participating physicians have fairly small Medicaid practices For purposes of this analysis LMPs are defined as those practices in which 30 pershycent or more of the physicians patients receive Medicaid Thirty percent is a full standard deviation above the mean percentage of Medicaid patients in a practice (127 percent) Approximately 14 percent of sample physicians fall into this outlier category It is plausible however that practices with an even higher concentration of Medicaid patients may share more of the characteristics associated with a mill In order to test this physicians with extra-large Medicaid practices (EXLMPs) those with at least one half of their practice devoted to Medicaid patients are also compared
The histogram in Figure 1 clearly demonstrates the unequal size distribution of Medicaid practices but what is the distribution of Medicaid patients across these practices It is possible that physicians in large Medicaid practices treat only a relatively small proporshytion of the total Medicaid population If so policy-makers might be less concerned about the possibility that these large Medicaid practices are mills
Using Medicaid mix and caseload data a Lorenz curve was constructed measuring inequalities in the distribution of Medicaid patients across physicians (Figure 2) The cumulative percentage of Medicaid patients in physicians practices (calculated in 20 pershycent increments) is plotted along the Y-axis and the cumulative percentage of physicians along the X-axis (For comparison purposes Lorenz curves for Medicare and Blue Shield patients are also presented) If
3Data on the actual number of visits rendered to Medicaid patients are not available from the 1976 survey In order to assess the extent of bias (if any) two alternative specificashytions of Medicaid participation were compared using the 1975 HCFA-NORC sample 1) proportion of patients who receive Medicaid and 2) proportion of total visits provided to Medicaid patients A t-test of means showed no signifishycant differences supporting our use of patients treated as an unbiased estimate of Medicaid practice size
HEALTH CARE FINANCING REVIEWSUMMER 1980 38
FIGURE 1 Medicaid Participation Rate for All
Physicians
Percent Medicaid Patients
HEALTH CARE FINANCING REVIEWSUMMER 1980 3 9
Per
cent
Pat
ient
s FIGURE 2
Lorenz Curve
Percent Physicians Surveyed
Medicaid Medicare Blue Shield
4 0 HEALTH CARE FINANCING REVIEWSUMMER 1980
Medicaid patients were perfectly distributed across practices all would be small Medicaid practices (SMPs) and the Lorenz curve would coincide with the straight diagonal line In fact the observed distribushytion indicates considerable unevenness in the distribushytion of Medicaid patients Three-quarters of sample physicians care for only 26 percent of the total Medicaid population Almost one-third (318 percent) of all Medicaid patients on the other hand are treated by 55 percent of the physicians A small number of physicians appear to have assumed responsibility for a large proportion of the nations poor
The Gini Index of Concentration provides a sumshymary statistic of the extent of inequality shown by the Lorenz curve and is calculated as the ratio of the area between the diagonal and curved line to that of the total triangle It ranges from zero to one with zero representing complete equality (that is the curved line lies on the diagonal) and one perfect inequality The Gini coefficient for Medicaid patients is 06520 indishycating considerable maldistribution By contrast the Gini coefficient for physician distribution is 01558 (Morrow 1977) indicating that physicians are much more evenly distributed across the population genshyerally than are Medicaid patients across physicians For reference we note that the distribution of both Blue Shield and Medicare is more even than Medicaid although significant inequalities still remain The Gini coefficients for Blue Shield and Medicare patients are 04649 and 05419 respectively
The Lorenz curve suggests that LMP physicians not only devote a large proportion of their practice to
Medicaid but that they also see the majority of all Medicaid patients treated in private practices The EXLMPs alone see 318 percent of all Medicaid recipshyients and together with other LMP physicians they provide care to over one-half of this Medicaid pool (584 percent) Analysis of these LMPs is certainly warshyranted for policy purposes If even a minority of them are in fact Medicaid mills the quality of care will be diminished for a very large number of public patients
Before analyzing the large Medicaid practices in detail we will briefly compare the size distribution of Medicaid practices across the specialty groups Medicaid participation rates for primary care physishycians have previously been reported by Sloan Cromshywell and Mitchell (1978) This is the first time however that national estimates have been available for the other specialties as well As seen in Table 1 participation levels vary considerably by specialty ranging from 61 percent for allergists to 162 percent for otolaryngologists around an average of 127 percent
With the notable exception of obstetrician-gynecoloshygists (OB-GYNs) primary care practitioners are more likely to have large Medicaid practices than are the specialists In part this may reflect the role of primary care physicians as gatekeepers for the rest of the health care system In addition usual fees for primary care practitioners may be closer to the Medicaid allowed fee than those of specialists encouraging them to see a large number of Medicaid patients
TABLE 1 Size Distribution of Medicaid Practices by Specialty
Medicaid Practice Size
Small Large Average Medicaid Specialty None (under 30) (over 30) Participation Rate
Primary Care 216 626 158 133 General Practice 243 608 149 135 General Surgery 84 751 165 143 Internal Medicine 181 625 194 145 ObstetricsGynecology 368 533 99 83 Pediatrics 241 585 174 143
Both medical and surgical specialists have undergone additional years of professional training and can (and do) command high fees for their sershyvices Human capital theory would hypothesize that all specialists regardless of specialty type would find Medicaid fee schedules relatively less attractive and hence be less likely to participate In spite of this the two groups differ markedly in their mean levels of Medicaid participation Medical specialists are twice as likely as their surgical colleagues not to participate in Medicaid (322 percent vs 153 percent) and likeshywise have far fewer LMPs Surgical specialists on the other hand more closely resemble primary care practishytioners in their average willingness to treat Medicaid patients
The descriptive and multivariate analyses of large Medicaid practices that follow are limited to the five major specialties generalfamily practice general surgery internal medicine OB-GYN and pediatrics (with an unweighted sample size of 1796) These specialties constitute over one-half of office-based patient care physicians nationwide Primary care physicians also provide access to ambulatory medical care an area of great concern to Federal policy makers Finally it is these physicians who have been most frequently identified as running Medicaid mills
Comparisons and statistical tests of LMPs may vary as a function of the physician group used as a refershyence point By the very fact of their nonparticipation physicians with no Medicaid patients are a unique group they are a small group relative to SMP physishycians and they tend to be older and politically more conservative (Sloan Cromwell and Mitchell 1978) Physicians with SMPs on the other hand can be conshysidered a modal form of medical practice and one that policymakers want to encourage In both descriptive and multivariate analyses LMP physicians (and those with extra-large Medicaid practices) will be contrasted with SMP physicians
Descriptive Analysis of Large Medicaid Practices
PRACTICE LOCATION
Large Medicaid practices are often considered an urban phenomenon located primarily in the ghettos of our largest cities This image however does not square with the facts Table 2 displays the size of Medicaid practice by geographic location large (greater than 14 million) small and non-metropolitan area high (greater than 7 percent) and low Medicaid population as a share of total county population and
TABLE 2 Geographic Location by Size of Medicaid Practice1
(percentage distributions)
Medicaid Practice Size
Location None Small Large Extra-Large
Large Metropolitan 490259 378594 393107 32240 High Medicaid 101323 51481 5690 139106 Low Medicaid 389246 327617 337110 18327
Small Metropolitan 360199 381628 385110 48764 High Medicaid 1673 53702 48108 113117 Low Medicaid 344216 328617 337110 37456
Region North East 277214 293655 9236 54096 North Central 212215 233683 16483 8219 South 382277 275577 314117 19733 West 128134 199599 429223 18243 1Percentages to the left of the slash (I) sum to 100 within each column Percentages to the right sum by row
4 2 HEALTH CARE FINANCING REVIEWSUMMER 1980
region of the country4 Both SMPs and LMPs exhibit the same distribution across large and small metropolitan areas while EXLMPs are actually more prevalent in small metropolitan areas EXLMPs thereshyfore are more likely than SMPs to be in small cities which is certainly unexpected Nearly one out of every five LMPs and EXLMPs furthermore is located in a non-metropolitan or rural area Most LMPs are not located in the large industrial cities in the North but rather in the South and West The EXLMPs however are primarily located in the Northeast as expected
PHYSICIAN INCOMES
One of the biggest concerns of policymakers is the incomes enjoyed by physicians in LMPs The presumption is that many are making extraordinary incomes taking advantage of a fully insured but medically unsophisticated population After adjusting for specialty and geographic cost-of-living differences however there is little evidence to support these claims no salient pattern exists as Medicaid particishypation increases There are no significant differences in mean net incomes between SMP and LMP physishycians General practitioners general surgeons and inshyternists with EXLMPs actually earn significantly less the average EXLMP general practitioner earns $44447 compared with $56841 for his SMP colleague OB-GYNs and pediatricians have net incomes comparable to their SMP peers A small number of LMP physicians do earn unusually high incomes which is surprising given the generally low Medicaid fee schedules This group was identified for additional analyses which are presented in a later section
Adjusting income for work effort does not alter the overall conclusion that LMP and EXLMP physicians as a whole are not enjoying extraordinary returns If anything hourly earnings are lower in practices serving large numbers of Medicaid patients This is particularly true of general practitioners in LMPs and EXLMPs whose earnings per hour are (respectively) four to seven dollars less than those in SMPs Even though LMP and EXLMP physicians report incomes and earnings per hour no greater than in other pracshytices (and often lower) one could still argue that these hourly earnings are unjustified given their background and training a point addressed in the following section
PHYSICIAN CREDENTIALS
Physicians who specialize in Medicaid patients have been characterized as having fewer credentials on average than other physicians To the extent that these physicians have less or inadequate training Medicaid recipients in their practices may be receiving lower quality care LMP and EXLMP physicians do have fewer credentials on average than do SMP physishycians but these differences are not linear with respect
4The size distribution of Medicaid practices across geographic areas will vary as a function of private demand physician supply and the eligibility and reimbursement procedures of State Medicaid programs For a detailed exposition of the economic theory of large Medicaid pracshytices and econometric analysis see Mitchell and Cromwell 1979
to size of Medicaid practice General practitioners dominate the extra-large Medicaid practices almost three-fifths of physicians in these practices (592 pershycent) are general practitioners as compared with only 399 percent of the SMPs By contrast the LMPs inshyclude a significantly higher proportion of internists (305 percent) than do SMPs (209 percent) Both LMP and EXLMP physicians are significantly less likely to be board-certified (321 percent and 159 percent) comshypared with 428 percent for SMPs
Twice as many FMGs are found in LMPs as in SMPs one out of every five physicians with a large Medicaid practice was trained outside the US Using a more restrictive definition of Third World FMGs5 LMPs include three times as many FMGs 145 percent versus 48 percent Surprisingly the extra-large Medicaid practices do not include any more FMGs however defined than do the SMPs
Some policymakers have expressed concern that large Medicaid practice physicians are older and that this may detract from the quality of care not because these physicians are incompetent but simply because they have not been trained in the newer medical techshynology Similarly physicians without hospital affiliashytions may provide less up-to-date care if they are unable to admit their patients to the hospital Only EXLMP physicians appear to fit this characterization they are significantly more likely to be 60 years of age or older (461 percent compared with 288 percent of SMPs) and less likely to be affiliated with a hospital (5 percent vs 15 percent)
Earlier we introduced the possibility that LMP physicians may be enjoying incomes that if not exshycessive compared to other physicians were relatively high given their background and training To test this hypothesis adjusted hourly earnings of all primary care physicians were regressed on the list of physishycian credentials (including age) and other exogenous variables that might affect returns to labor6 Residuals from this regression should reflect returns over-andshyabove those attributable either to the background and training of the physician or to location choice Holding both credentials and economic factors constant there is no evidence that the LMP or EXLMP physicians as a group earn extraordinary incomes In fact just the opposite is the case physicians with Medicaid-dominated practices earn significantly less per hour worked than their peers who see a smaller number of Medicaid patients all else being equal
CASELOAD AND WORK EFFORT
Physician caseloads have been a major concern in large Medicaid practices for two reasons First relatively high volume in these practices suggests that many Medicaid visits may be of marginal benefit or even unnecessary Any such induced demand by
5As some foreign medical schools are generally believed to have better curricula than others we distinguish Third World FMGs from other FMGs The Third World FMG is defined here as a graduate from a non-Western European non-English speaking country Graduates from Mexican schools are excluded as many are American citizens
6This list was drawn from Sloan (1974) For a theoretical discussion of the hours worked equation the reader is referred to his work
HEALTH CARE FINANCING REVIEWSUMMER 1980 43
physicians will clearly drive up Medicaid expenditures Second high LMP volume may be achieved through shorter physician contacts thus lowering quality of care for Medicaid recipients
Physicians in both LMPs and EXLMPs make signifishycantly more visits in toto than do those in SMPs approximately 10 percent more on average (Table 3) Allocation of total visits also varies across visit cateshygories Physicians in EXLMPs are less hospital based than those in SMPs providing significantly fewer visits in inpatient settings and more in their offices Both LMP and EXLMP physicians however allocate a significantly higher proportion of their caseload to emergency room and clinic visits Absolute ERclinic visits are also significantly higher in LMPs and EXLMPs 144 and 145 visits per week compared with 93 in SMPs This is somewhat disturbing as a major Medicaid policy objective is to discourage the utilizashytion of institutional sources of ambulatory care
LMP and EXLMP physicians clearly have higher caseloads but for policy purposes this would not matshyter if they worked longer hours As seen in Table 3 however there are no differences in total hours by size of Medicaid practice Are patients hurried through the physicians office on an assembly line basis Table 3 suggests they are not Physicians in large Medicaid practices do spend less time with office patients but the differences are trivial office visits are only two minutes shorter on average Furthermore the length of visit in extra-large Medicaid practices is no different than in SMPs7
7Lengths of visit could systematically vary by patient class that is the LMP physician might spend less time with Medicaid patients than private patients but still achieve mean visit lengths comparable to those of SMPs Of course this becomes increasingly difficult as the Medicaid share of the practice grows Regression analysis by Sloan and Lorant (1976) furthermore has also found that the pershycent of practice Medicaid has no impact on length-of-visit
GROSS REVENUES COSTS AND MARKUPS
Besides the natural concern over the quality and continuity of care afforded Medicaid patients in LMPs there is a general feeling expressed in Congressional testimony and elsewhere that significant numbers of LMP physicians are financially abusing the system If this is the case it is not reflected in physician net inshycome as we have already shown High markups and gross billings however remain a concern
Table 4 presents gross revenues costs and net revenues (or markups) per visit for the five primary care specialties by extent of Medicaid participation Both gross revenues per visit and markups fall as exshytent of Medicaid participation increases Excluding high income LMPs LMP markups are only 82 percent of SMP markups ($912$ 1119) EXLMP markups are only 58 percent as much ($651$1119) Including high income LMPs the average LMPSMP markup ratio is 86 percent LMP markups as a whole are lower primarily because of lower gross revenues per visit not lower costs Average costs per visit in LMPs are 96 percent of costs in SMPs but gross revenues per visit are only 90 percent EXLMP gross revenues per visit are even lower (only 68 percent of SMPs) A breakdown by specialty shows essentially the same pattern of declining gross revenues and markups as Medicaid participation rises
ANCILLARY SERVICES
The excessive use of ancillary services is an identishyfying characteristic of Medicaid mills Although it is not possible to determine the medical necessity of the ancillaries provided in large Medicaid practices we can compare the frequency with which they are ordered to SMPs The HCFA survey asked each physishycian to estimate the percent of office visits for which
TABLE 3 Caseload Visit Locus and Work Effort by Size of Medicaid Practice
Effort Per Week
Total Visits Percentage1
Office Inpatient Operations Emergency RoomClinic Nursing Home House Calls
Total Patient Care Hours Length of Office Visit (minutes)
Size of Medicaid Practice
Small Large Extra Large None (under 30) (30-49) (50 or more)
1571 1693 18813 18593
708 616 606 6932
218 286 2554 1972
18 22 27 102
26 52 713 773
14 16 304 16 16 07 05 07
472 515 526 513 220 196 1783 197
1May not sum to 100 due to rounding 2Significant from SMP mean at 1 confidence level 3Significant from SMP mean at 5 confidence level 4Significant from SMP mean at 10 confidence level
4 4 HEALTH CARE FINANCING REVIEWSUMMER 1980
he or she ordered four types of services laboratory tests injections or immunizations X-rays and office surgery
Evidence that large and extra-large Medicaid pracshytices order excessive ancillaries is ambiguous at best Higher utilization rates by one specialty are often offshyset by lower rates for another specialty General surgeons and OB-GYNs with large Medicaid practices order significantly more tests but internists and pediatricians prescribe significantly fewer EXLMP physicians furthermore use laboratory services at the same rate as their colleagues in small Medicaid pracshytices Injections however appear to be used at exshyceedingly high rates in both LMPs and EXLMPs relative to SMPs This prescribing behavior is shared by all specialty groups except pediatricians but is most pronounced among internists EXLMP internists order injections for almost one-half of all their office patients (452 percent) a rate almost three times that of SMPs (162 percent)
There are no differences in X-ray utilization by size of Medicaid practice and differences in office surgical rates are inconsistent once broken down by specialty General practitioners and internists in LMPs perform significantly more procedures while surgeons and EXLMP pediatricians perform fewer The absolute levels of office surgery are generally low however in all groups
INPUTS
In addition to his or her own time the primary inputs to the physicians practice are auxiliary staff such as clerical and nursing personnel Physicians vary considerably however in the number and type of such personnel and in the effectiveness with which they employ them If large Medicaid practices are more efficient in their use of auxiliary staff this may explain their higher practice volume By delegating tasks to clerical and nursing staff these physicians may increase their total productivity (visits per physishycian hour) and lower average costs per visit Altershynatively large Medicaid practices may skimp on such inputs in order to lower practice costs and increase physician net revenues
LMPs employ significantly more nonphysician pershysonnel notably clerks LPNs and nurse practitioners 26 on average compared with 21 for SMPs Their higher use of LPNs may partially explain why LMP physicians see more patients per hour while more clerical personnel may be necessary to handle the added administrative work associated with Medicaid reimbursement The EXLMPs however do not employ significantly more clerks than SMPs suggesting that they either find Medicaid administrative procedures less onerous or that they have become more proficient in obtaining payment Although total staff-to-physician ratios are not higher in EXLMPs these practices do use significantly more nursing personnel both RNs
TABLE 4 Gross Revenues Costs and Markups Per Visit by Specialty by Size of Medicaid Practice
Medicaid practice Size
SpecialtyIncome or Cost Category None Small Large1 Extra-Large1
General Practitioner GRV $1622 $1413 $1128 $ 926
CV 731 538 424 449 NET RV 891 876 704 476
General Surgeon GRV 2593 2096 2246 1429
CV 789 622 890 644 NET RV 1804 1474 1356 785
Internist GRV 1876 1841 1324 2040
CV 637 640 580 758 NET RV 1239 1201 744 1282
OB-GYN GRV 2002 2325 2203 1578
CV 748 834 871 654 NET RV 1254 1491 1332 924
Pediatrician GRV 1587 1179 1200 908
CV 528 450 487 439 NET RV 1059 729 713 469
Total GRV 1794 1718 1531 1175
CV 699 599 619 524 NET RV 1095 1119 912 651
1Excludes high income Medicaid practices (over $80000) GRV = gross revenues per visit
CV = practice costs per visit NET RV = net revenues per visit (markups)
HEALTH CARE FINANCING REVIEWSUMMER 1980 45
and LPNs This suggests that EXLMP physicians may delegate more medical tasks than other physicians
Discriminant Analysis of Large Versus Small Medicaid Practices
Physicians with a large proportion of Medicaid pashytients appear to differ from SMP physicians in signifishycant ways such as credentials caseload practice style and net incomes Many of these characteristics are interrelated however and cross-tabular analysis does not adequately adjust for this If large Medicaid practices are truly different from smaller Medicaid practices in ways that affect quality of care we should be able to statistically distinguish between the two groups
How might we identify Medicaid mills from large Medicaid practices generally First it seems reasonable to assume that Medicaid mill physicians are successful at what they do That is we would exshypect them to be earning higher incomes on average Second the process of medical care will be signifishycantly poorer in mills as measured by shorter visit lengths higher rates of ancillary utilization and fewer inputs While Medicaid mills may be run by less well-trained physicians this is not a necessary condition for a mill Nevertheless for policy purposes we are concerned about a relative lack of training in LMPs as this will restrict access by the poor to specialized sershyvices If LMPs (and EXLMPs) are a unique group then a discriminant function with these variables (income process measures of quality and credentials) should distinguish them from other physician practices Discriminant analysis is used to analyze two groups of practices small and large Medicaid practices (Nonshyparticipants are omitted from this analysis) Since practice characteristics are often different in LMPs and EXLMPs we will derive two discriminant funcshytions 1) where LMPs are defined as practices with 30 percent or more Medicaid patients (which we will call MILL1 for identification purposes) and 2) LMPs defined as at least 50 percent Medicaid patients vershysus all other Medicaid practices (MILL2)
Three sets of discriminating variables are included with each function income process measures of quality and credentials In order to adjust for differshyences in hours worked the income variable is defined as the physicians imputed hourly wage (MDWAGE) Physicians in large Medicaid practices are hypotheshysized to be distinguished by their higher net earnings all else being equal
If large Medicaid practices tend to be mills then they should be characterized by lower quality care on all dimensions In particular physicians in these pracshytices should spend less time with patients order more ancillary services and employ fewer aides The variable LOV the length of time spent with each office patient is measured in fractions of an hour The variables TEST SHOT XRAY and SURG are specified as the percent of office patients for whom the physishycian ordered laboratory tests injections X-rays and office surgery respectively AIDE is the number of auxiliary staff employed in the practice and is exshypressed as fulltime equivalents per physician
Physician credentials include specialty board-certification FMG status age and hospital affiliashytions These variables are included in part as adjustshyments for the process measures variations in ancillary utilization for example between the two groups may reflect differences in specialty mix Physician credenshytials are also of analytical interest in their own right LMP physicians should be distinguishable from their colleagues as older general practitioners and foreign medical graduates without board certification or hospital affiliation Specialty is specified as four dummy variables GS IM OB and PED for general surgeons internists OB-GYNs and pediatricians respectively General practitioners constitute the omitted category BOARD and FMG both assume the value of one if the physician is board-certified or if he or she is a Third World FMG The variables MDAGE and HOSAFIL are set equal to one if the physician is 60 years or older and if he or she lacks hospital affiliations respectively
EMPIRICAL FINDINGS
Means of the discriminating variables and the results of the analysis are presented in Table 5 The statistically significant coefficients associated with many of the variables indicate that both functions do discriminate between the two groups A negative sign indicates that large Medicaid practices share a parshyticular characteristic for example more FMGs and that this characteristic distinguished them from smaller Medicaid practices
MDWAGE the physicians imputed net hourly wage is a significant discriminatory variable in both funcshytions Regardless of how we define large Medicaid practices physicians in these practices are distinshyguished from smaller Medicaid practices by their lower per hour earnings
Six process measures of quality were included in the analysis If large Medicaid practices were mills providing poor quality care then the four ancillary sershyvice variables (TEST SHOT XRAY and SURG) should have significant negative coefficients and the coeffishycients for the input variables (LOV and AIDE) should have significant positive signs Based on prior expectations LMPs have only a single mill-like characshyteristic physicians in these practices do order signifishycantly more injections The relative magnitude of this variable nevertheless indicates that SHOT is a powershyful discriminatory variable Unmeasured casemix variashytions might account for some of this difference although specialty does provide a partial adjustment Nevertheless the fact that only one of six quality measures is suggestive of poor care in LMPs conshytradicts the general notion that mills and large Medicaid practices are synonymous
Credentials however clearly separate the LMP physician from his SMP counterpart In the first discriminant function we see that large Medicaid practices are characterized by their higher proportion of specialists These specialists tend to be less qualified than those in SMPs however in terms of FMG status and board certification When we define LMPs as at least 50 percent Medicaid (MILL2) LMPs
HEALTH CARE FINANCING REVIEWSUMMER 1980 46
do not differ from other practices in their mix except for fewer internists Again they are less likely to be run by board-certified physicians The FMG variable is also significant but with the opposite sign LMPs however defined are run by older physicians without hospital affiliations Nevertheless their relative lack of credentials does not qualify them as mill operators instead many are undoubtedly running LMPs by default rather than by design These may be aging general practitioners for example who have become isolated in inner-city or rural areas by historical forces and now serve a primarily low-income population
High Income LMPs Are They Medicaid Mills
While it does not appear that most LMPs are Medicaid mills there is a class of LMPs which deserves special attention namely that where physishycians earn unusually high incomes (HILMPs) HILMPs
were defined as those in which physicians reported net incomes of $80000 or more Considering the presumably lower Medicaid fees they receive for a large percentage of their patients how do they manage to enjoy incomes so much higher than other LMPs with similar revenue constraints Even more puzzling is why their incomes are over 50 percent higher than the average income of a physician operating a small Medicaid practice when the latter should be receiving higher fees Clearly LMP physishycians at the tail of the income distribution are either much more productive than the average physician receive unusually high fees generate a much larger number of profitable ancillary services or cut costs inshyappropriately Does this subset of all LMPs comprise the Medicaid mills so often maligned in Congressional testimony A separate analysis of these practices may shed further light on the behavior of LMPs and the need for specific public action
TABLE 5 Discriminant Analysis Results for Small Versus Large Medicaid Practices
RC = 029 RC = 024 1F-ratio insufficient for entry 2Associated chi-square statistic significant at 1 percent level 3F-ratio significant at 10 percent level 4F-ratio significant at 5 percent level 5F-ratio significant at 1 percent level
HEALTH CARE FINANCING REVIEWSUMMER 1980 4 7
Table 6 provides some summary data on HILMPs contrasting them with SMPs and other LMPs8 Comshypared to their colleagues HILMP physicians are older and much more likely to be foreign trained but surshyprisingly more specialized While 399 percent of SMPs are run by general practitioners only 136 pershycent of HILMPs do not specialize General surgeons and internists are disproportionately represented in the HILMP group 721 percent versus 413 percent of SMPs and 395 percent of the other LMPs
Although specialists generally see fewer patients per week and spend more time with each one the HILMP group sees 15 percent more patients per week (Table 6) Most of the extra visits are provided in the hospital which is consistent with the HILMP specialty mix Particularly striking are the significantly shorter visit lengths HILMP physicians spend 34 minutes less with their office patients compared to SMP physicians
TABLE 6 Summary Characteristics HILMPs vs SMPs and
Other LMPs
Medicaid Practice Size Characteristic SMPs LMPs HILMPs
Foreign Medical Graduate 122 Third World FMG 48
206 89
2291
1802
Board Certification 428 286 368 MD is 60 years or older 288 Total Visits 1692
337 1905
4312
20622
Length of Office Visit (mins) 196
Net Income $60571 188
$57007 1623
$964471
Imputed Hourly Wage $2440 $2193 $37491
1Significant from SMP mean at 10 confidence level 2Significant from SMP mean at 5 confidence level 3Significant from SMP mean at 1 confidence level
As HILMPs were originally identified by their conshyspicuous incomes it is not surprising that net incomes in this group are $36000 higher on average than in SMPs HILMP incomes ranged from $101453 for general practitioners to $92592 for pediatricians As physician hours do not vary between groups the imputed hourly wage varies directly with income and is consistent across all specialties although insignifishycant for OB-GYNs This is true even after earnings were adjusted using the hours worked equation described earlier Holding demand physician competishytion and credentials constant HILMP physicians still earn significantly more than physicians with a small Medicaid caseload
How can we explain the greater earning power of these HILMP physicians Part of the answer unshydoubtedly lies in their heavier caseloads which they achieve by shortening the length of patient contacts The high incomes of these physicians are also exshyplained by the higher Medicaid fees they enjoy $1051 for an office visit on average compared with $844 for SMPs and $836 for other LMPs Sixty percent of
8For more detailed specialty-specific comparisons the reader is referred to Mitchell and Cromwell (1979)
HILMPs are located in the South where State Medishycaid programs tend to employ more generous reimshybursement procedures in determining allowable fees
Policy Implications
Although some HILMPs have mill-like characterisshytics LMPs generally cannot be considered Medicaid mills as described by Senator Moss Nevertheless a primary goal of the Medicaid program the integration of the poor into mainstream medicine has not been completely attained Davis and Reynolds (1976) have shown that unadjusted utilization rates may overestishymate the impact of Medicaid in improving access of the poor to health care It is also necessary to adjust for health status the poor tend to be sicker and hence require disproportionately more services Our findings suggest another dimension of Medicaid access that needs to be considered the credentials of the provider
Medicaid beneficiaries appear to constitute a secondary market served by less qualified physicians Increases in physician supply may widen this gap even further as competition for private patients squeezes out the less well trained physicians the FMG and the older GP To make what they feel is a decent living these marginal practitioners may have to see a larger and larger number of Medicaid pashytients Current policies which set Medicaid fees at or well below those of other insurers simply reinforce this two-tiered form of medicine Access to ambulashytory care whatever the background of the physician may be better than no care at all it may even be adeshyquate but it is not equal
We really know very little about the impact of basic program elements on the quantity and quality of physishycian services under Medicaid From our previous research we do know that raising Medicaid fee schedshyules does increase participation on average (Sloan Cromwell and Mitchell 1978) Reducing payment delays and streamlining overall administration has a similar effect More liberal benefits and eligibility reshyquirements on the other hand actually encourage the development of LMPs (Mitchell and Cromwell 1979) but we know almost nothing about the welfare losses associated with limited coverage
The success of such changes in the Medicaid proshygram may depend on the local distribution of the poor the distribution of physicians and the financial attracshytiveness of the private market For example if physishycians and the poor are fairly evenly distributed across the population then higher Medicaid fees could significantly improve access without fostering undesirable kinds of LMPs If however the poor are highly segregated (as in many urban ghettos) higher fees may only result in larger and larger Medicaid practices Additional research is needed on the elements of the Medicaid program which foster the growth of LMPs
Because of the Moss investigations LMPs have been subject to a blanket criticism which essentially makes serving the poor a disreputable occupation Exshyposes may discourage illegal behavior but they may also have the unintended side effect of discouraging
HEALTH CARE FINANCING REVIEWSUMMER 1980 48
altruistic physicians from expanding their practices in underserved areas Current fraud and abuse activities furthermore do not address the credentials gap they focus only on the over-utilizers Program reform on the other hand should improve both access and quality of care as more qualified physicians will be attracted to the Medicaid market providing the poor with an alternative to Medicaid mills
Acknowledgment
The authors gratefully acknowledge the support of their HCFA project officer Benson Dutton and the fine programshyming assistance of Deborah Hamill
References
American Medical Association Profile of Medical Practice Chicago AMA Center for Health Services Research and Development 1979
Bloom Lawrence S et al Medicaid in Cook County Present Status and Future Prospects Inquiry 513-23 June 1968
Davis Karen and Roger Reynolds The Impact of Medicare and Medicaid on Access to Medical Care pp 391-425 in Richard N Rosett ed The Role of Health Insurance in the Health Services Sector NY National Bureau of Economic Research 1976
Jones M W and B Hamburger A Survey of Physician Parshyticipation in and Dissatisfaction with the Medi-Cal Program The Western Journal of Medicine 124 75-83 January 1976
Kavaler F Medicaid in New York Utopianism and Bare Knuckles in Public Health People Providers and Payment Telling It How It Is American Journal of Public Health 59 820-5 May 1969
Mitchell Janet B and Jerry Cromwell Large Medicaid Pracshytices Are They Medicaid Mills Final report submitted to the Health Care Financing Administration October 1979
Morrow James S Toward a More Normative Assessment of Maldistribution The Gini Index Inquiry 14 278-92 September 1977
Sloan Frank A A Microanalysis of Physicians Hours of Work Decisions pp 302-25 in Mark Perlman ed The Economics of Health and Medical Care London MacMillan 1974
Sloan Frank A and John H Lorant The Allocation of Physishycians Services Evidence on Length-of-Visit Quarterly Review of Economics and Business 16 3-103 Autumn 1976
Sloan Frank A Jerry Cromwell and Janet B Mitchell Private Physicians and Public Programs Lexington MA DC Heath 1978
Studnicki James et al Foreign Medical Graduates and Maryland Medicaid New England Journal of Medicine 294 1153-7 May 20 1976
US Senate Special Committee on Aging Subcommittee on Long Term Care Fraud and Abuse Among Practitioners Parshyticipating in the Medicaid Program Washington DC Government Printing Office August 1976
US Senate Committee on Finance Medicare and Medicaid Problems Issues and Alternatives Washington DC Government Printing Office February 9 1970
HEALTH CARE FINANCING REVIEWSUMMER 1980 4 9
altruistic physicians from expanding their practices in underserved areas Current fraud and abuse activities furthermore do not address the credentials gap they focus only on the over-utilizers Program reform on the other hand should improve both access and quality of care as more qualified physicians will be attracted to the Medicaid market providing the poor with an alternative to Medicaid mills
Acknowledgment
The authors gratefully acknowledge the support of their HCFA project officer Benson Dutton and the fine programshyming assistance of Deborah Hamill
References
American Medical Association Profile of Medical Practice Chicago AMA Center for Health Services Research and Development 1979
Bloom Lawrence S et al Medicaid in Cook County Present Status and Future Prospects Inquiry 513-23 June 1968
Davis Karen and Roger Reynolds The Impact of Medicare and Medicaid on Access to Medical Care pp 391-425 in Richard N Rosett ed The Role of Health Insurance in the Health Services Sector NY National Bureau of Economic Research 1976
Jones M W and B Hamburger A Survey of Physician Parshyticipation in and Dissatisfaction with the Medi-Cal Program The Western Journal of Medicine 124 75-83 January 1976
Kavaler F Medicaid in New York Utopianism and Bare Knuckles in Public Health People Providers and Payment Telling It How It Is American Journal of Public Health 59 820-5 May 1969
Mitchell Janet B and Jerry Cromwell Large Medicaid Pracshytices Are They Medicaid Mills Final report submitted to the Health Care Financing Administration October 1979
Morrow James S Toward a More Normative Assessment of Maldistribution The Gini Index Inquiry 14 278-92 September 1977
Sloan Frank A A Microanalysis of Physicians Hours of Work Decisions pp 302-25 in Mark Perlman ed The Economics of Health and Medical Care London MacMillan 1974
Sloan Frank A and John H Lorant The Allocation of Physishycians Services Evidence on Length-of-Visit Quarterly Review of Economics and Business 16 3-103 Autumn 1976
Sloan Frank A Jerry Cromwell and Janet B Mitchell Private Physicians and Public Programs Lexington MA DC Heath 1978
Studnicki James et al Foreign Medical Graduates and Maryland Medicaid New England Journal of Medicine 294 1153-7 May 20 1976
US Senate Special Committee on Aging Subcommittee on Long Term Care Fraud and Abuse Among Practitioners Parshyticipating in the Medicaid Program Washington DC Government Printing Office August 1976
US Senate Committee on Finance Medicare and Medicaid Problems Issues and Alternatives Washington DC Government Printing Office February 9 1970