38
Medical Council of Canada Evaluating Examination (MCCEE) 2018 MCCEE Annual Technical Report
Medical Council of Canada Evaluating Examination (MCCEE)
2018MCCEE Annual Technical Report
Medical Council of Canada Qualifying Examination (MCCQE) Part I
2 018MCCQE Part IAnnual Technical Report
Medica l Counc i l o f Canada
MCCEE Annual Techn ica l Repor t | 2018 2
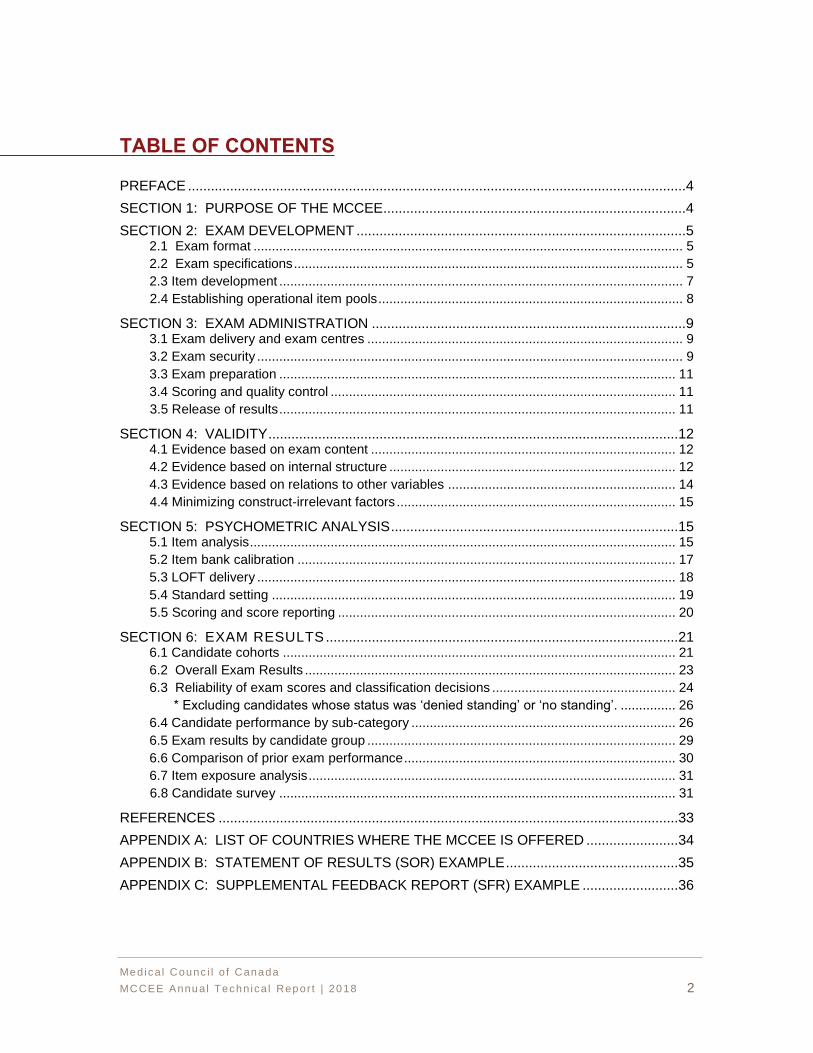
PREFACE .................................................................................................................................. 4
SECTION 1: PURPOSE OF THE MCCEE ............................................................................... 4
SECTION 2: EXAM DEVELOPMENT ...................................................................................... 5 2.1 Exam format ..................................................................................................................... 5
2.2 Exam specifications .......................................................................................................... 5
2.3 Item development .............................................................................................................. 7
2.4 Establishing operational item pools ................................................................................... 8
SECTION 3: EXAM ADMINISTRATION .................................................................................. 9 3.1 Exam delivery and exam centres ...................................................................................... 9
3.2 Exam security .................................................................................................................... 9
3.3 Exam preparation ............................................................................................................ 11
3.4 Scoring and quality control .............................................................................................. 11
3.5 Release of results ............................................................................................................ 11
SECTION 4: VALIDITY ........................................................................................................... 12 4.1 Evidence based on exam content ................................................................................... 12
4.2 Evidence based on internal structure .............................................................................. 12
4.3 Evidence based on relations to other variables .............................................................. 14
4.4 Minimizing construct-irrelevant factors ............................................................................ 15
SECTION 5: PSYCHOMETRIC ANALYSIS ........................................................................... 15 5.1 Item analysis .................................................................................................................... 15
5.2 Item bank calibration ....................................................................................................... 17
5.3 LOFT delivery .................................................................................................................. 18
5.4 Standard setting .............................................................................................................. 19
5.5 Scoring and score reporting ............................................................................................ 20
SECTION 6: EXAM RESULTS ............................................................................................ 21 6.1 Candidate cohorts ........................................................................................................... 21
6.2 Overall Exam Results ..................................................................................................... 23
6.3 Reliability of exam scores and classification decisions .................................................. 24
* Excluding candidates whose status was ‘denied standing’ or ‘no standing’. ............... 26
6.4 Candidate performance by sub-category ........................................................................ 26
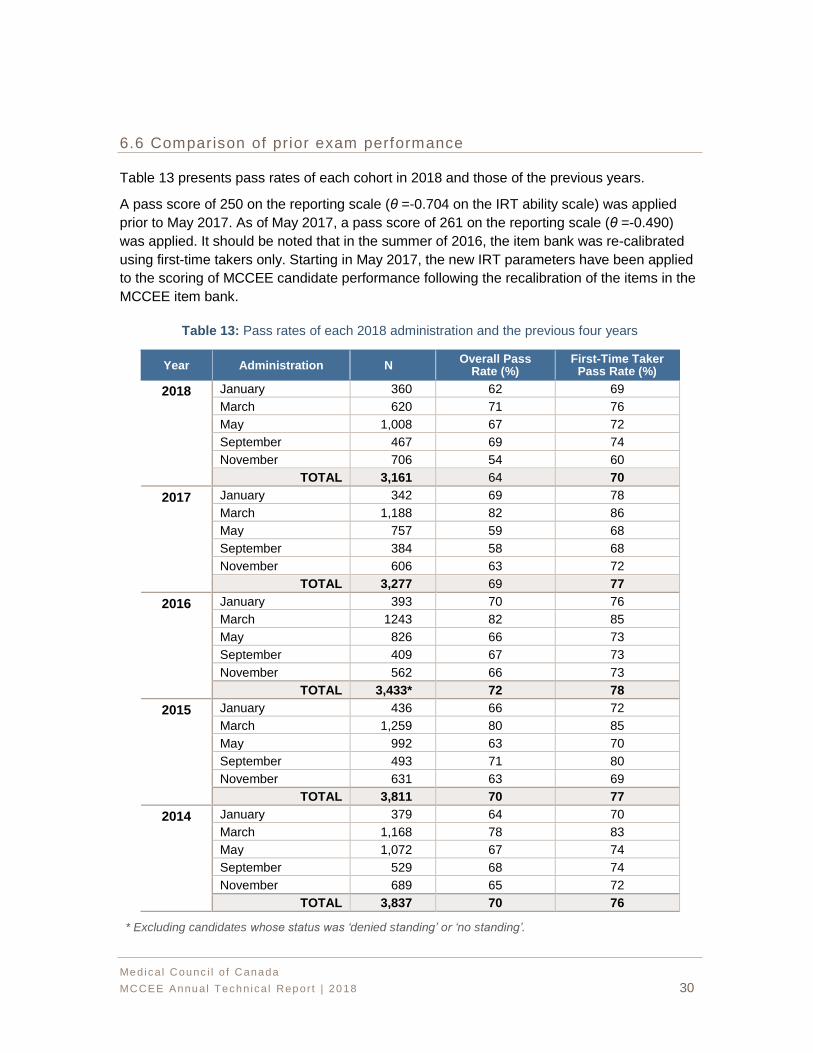
6.5 Exam results by candidate group .................................................................................... 29
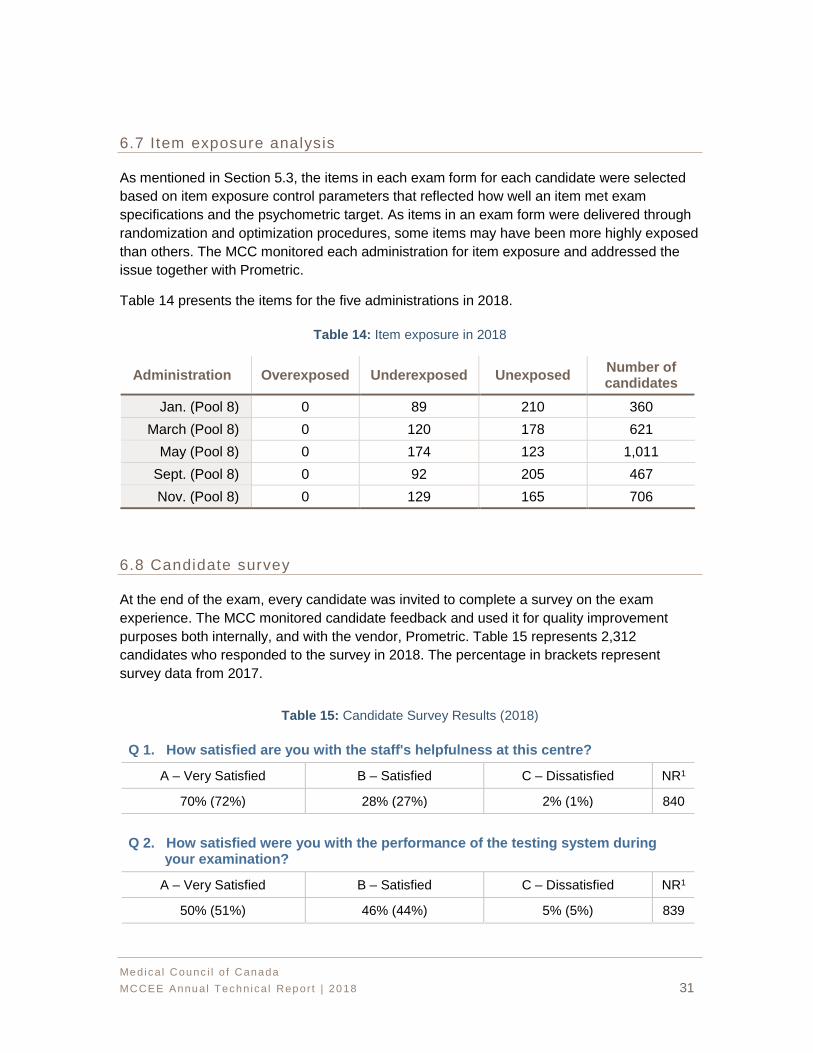
6.6 Comparison of prior exam performance .......................................................................... 30
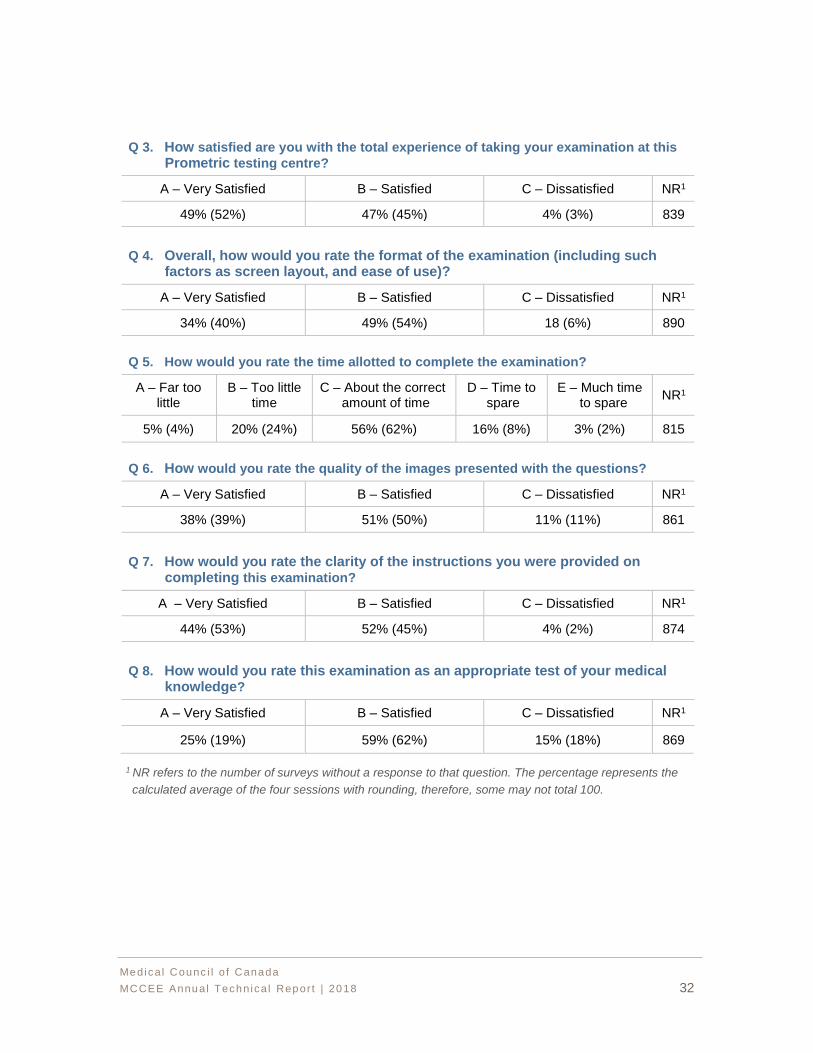
6.7 Item exposure analysis .................................................................................................... 31
6.8 Candidate survey ............................................................................................................ 31
REFERENCES ........................................................................................................................ 33
APPENDIX A: LIST OF COUNTRIES WHERE THE MCCEE IS OFFERED ........................ 34
APPENDIX B: STATEMENT OF RESULTS (SOR) EXAMPLE ............................................. 35
APPENDIX C: SUPPLEMENTAL FEEDBACK REPORT (SFR) EXAMPLE ......................... 36
TABLE OF CONTENTS
Medica l Counc i l o f Canada
MCCEE Annual Techn ica l Repor t | 2018 3
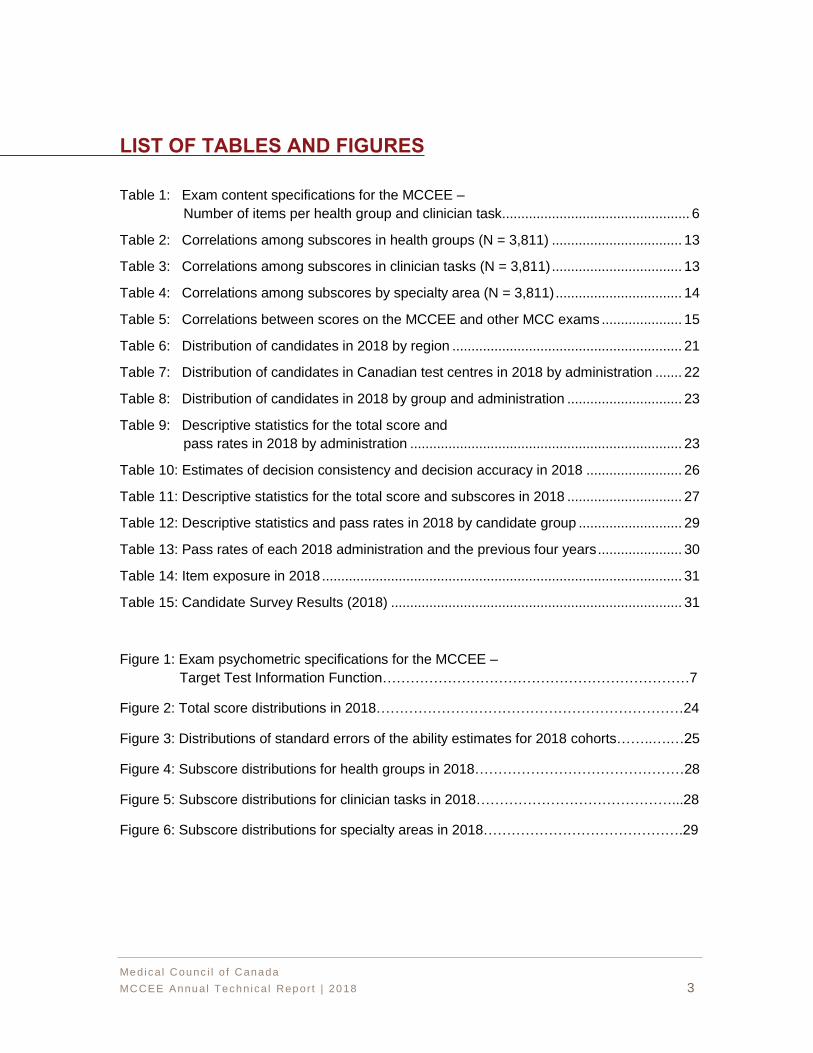
Table 1: Exam content specifications for the MCCEE –
Number of items per health group and clinician task................................................. 6
Table 2: Correlations among subscores in health groups (N = 3,811) .................................. 13
Table 3: Correlations among subscores in clinician tasks (N = 3,811) .................................. 13
Table 4: Correlations among subscores by specialty area (N = 3,811) ................................. 14
Table 5: Correlations between scores on the MCCEE and other MCC exams ..................... 15
Table 6: Distribution of candidates in 2018 by region ............................................................ 21
Table 7: Distribution of candidates in Canadian test centres in 2018 by administration ....... 22
Table 8: Distribution of candidates in 2018 by group and administration .............................. 23
Table 9: Descriptive statistics for the total score and
pass rates in 2018 by administration ....................................................................... 23
Table 10: Estimates of decision consistency and decision accuracy in 2018 ......................... 26
Table 11: Descriptive statistics for the total score and subscores in 2018 .............................. 27
Table 12: Descriptive statistics and pass rates in 2018 by candidate group ........................... 29
Table 13: Pass rates of each 2018 administration and the previous four years ...................... 30
Table 14: Item exposure in 2018 .............................................................................................. 31
Table 15: Candidate Survey Results (2018) ............................................................................ 31
Figure 1: Exam psychometric specifications for the MCCEE –
Target Test Information Function…………………………………………………………7
Figure 2: Total score distributions in 2018…………………………………………………………24
Figure 3: Distributions of standard errors of the ability estimates for 2018 cohorts……..….…25
Figure 4: Subscore distributions for health groups in 2018………………………………………28
Figure 5: Subscore distributions for clinician tasks in 2018……………………………………...28
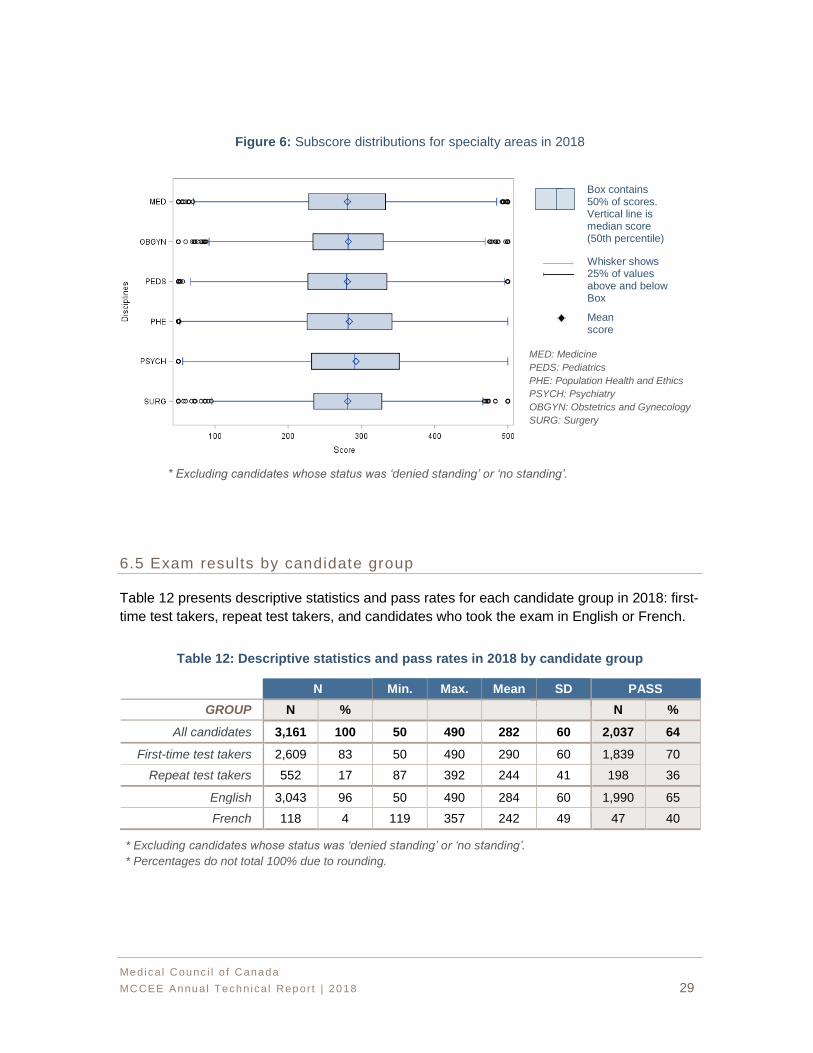
Figure 6: Subscore distributions for specialty areas in 2018…………………………………….29
LIST OF TABLES AND FIGURES
Medica l Counc i l o f Canada
MCCEE Annual Techn ica l Repor t | 2018 4
PREFACE
This report summarizes the main characteristics of the Medical Council of Canada Evaluating
Examination (MCCEE) and candidate performance on the exam in 2018. Sections 1 to 5
describe the exam’s purpose, format, content development, administration, scoring and score
reporting. These sections also provide validity evidence in support of score interpretation,
reliability and errors of measurement, and other psychometric characteristics. Section 6
summarizes candidate performances for the five administrations in 2018 and includes
historical data for reference purposes. The report is intended to serve as technical
documentation and reference materials for the Evaluating Examination Committee (EEC), test
committee members, Medical Council of Canada (MCC) staff, MCC stakeholders, and
members of the public.
SECTION 1: PURPOSE OF THE MCCEE
The MCCEE is a four-hour, computer-based exam offered in both English and French in over
80 countries worldwide. Beginning in 2018, the MCCEE was no longer a prerequisite for
International Medical Graduates (IMGs) to challenge the MCCQE Part I and the National
Assessment Collaboration (NAC) Examination. This change to candidate eligibility for the
MCCQE Part I and NAC Examination was in advance of the elimination of the MCCEE and in
anticipation of the international launch and delivery of the MCCQE Part I in 2019. As of
January 2019, the MCCEE will no longer be offered and international medical graduates and
students will be able to apply to the MCCQE Part I and NAC Examination directly without first
having to take the MCCEE.
The MCCEE is a screening examination that assessed the basic medical knowledge and
problem solving of a candidate at a level comparable to a minimally competent medical
student completing his or her medical education in Canada and about to enter supervised
practice.
The EEC, formally named the Evaluating Examination Composite Committee (EECC) prior to
2018, was responsible for overseeing the MCCEE, including the development of the exam,
the maintenance of its content, ruling on special cases and reconsiderations, and the
approval of results.
Medica l Counc i l o f Canada
MCCEE Annual Techn ica l Repor t | 2018 5
SECTION 2: EXAM DEVELOPMENT
2.1 Exam format
The MCCEE consisted of 180 Multiple-Choice Questions (MCQs) including 150 operational
items1 (scored items) and 30 pilot items (new, non-scored items pretested for future use). The
items covered child health, maternal health, adult health (including gynecology, medicine, and
surgery), mental health and population health and ethics. A number of items in the exam also
focused on general practice.
Each item listed five possible answers of which only one was correct. The MCCEE was
administered using a computer-based, Linear-On-the-Fly-Test (LOFT) model and was
delivered by Prometric, a test delivery provider. With the LOFT design, a unique exam form
was assembled in real-time where items were selected from a large pool of operational items
based on exam specifications for each candidate. More detailed explanations of the LOFT
design are provided in Section 5.3.
2.2 Exam specif ications
The exam specifications for the MCCEE defined the content and psychometric specifications
for each exam form. The content specifications included the content domains to be tested, a
sampling plan for the content domains (the proportion of items per content area) and total
exam length (total number of items). The psychometric specifications included the desired
psychometric properties of the items (number of items for each level of difficulty), target
standard error of ability estimates and an overall target test information function for each
exam. The exam specifications were created and adopted by the EECC between 2008 and
2009 during a one-week retreat of the EECC and the Australian Medical Council (AMC).
During the workshop, the EECC and the AMC devised a realistic representation (percentage-
wise) by health group and clinician task, of what physicians would encounter in their practice
on a daily basis, which, in turn, became the exam specifications.
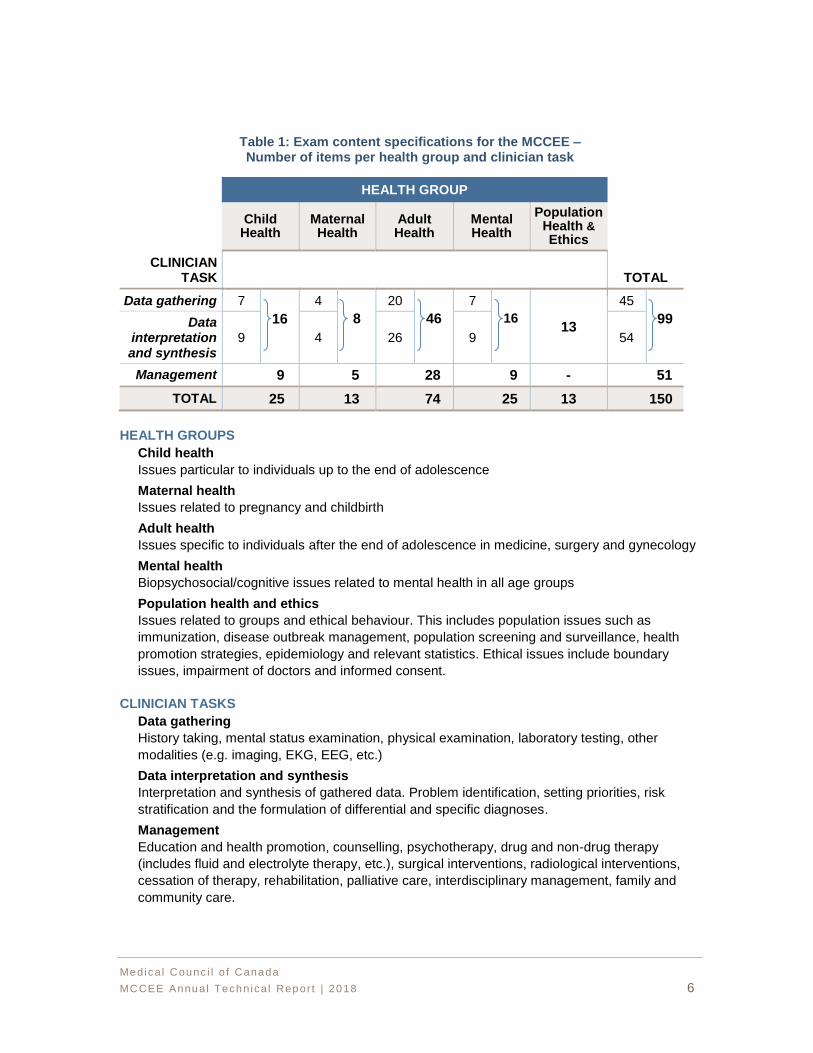
Table 1 outlines the content specifications, including the definitions of the various health
groups and clinician tasks.
1 The term “question” and “item” are used interchangeably in this report and should be treated synonymously.
Medica l Counc i l o f Canada
MCCEE Annual Techn ica l Repor t | 2018 6
Table 1: Exam content specifications for the MCCEE – Number of items per health group and clinician task
Child Health
Maternal Health
Adult Health
Mental Health
Population Health & Ethics
CLINICIAN TASK TOTAL
Data gathering 7
16
4
8
20
46
7
16 13
45
99 Data interpretation and synthesis
9 4 26 9 54
Management 9 5 28 9 - 51
TOTAL 25 13 74 25 13 150
HEALTH GROUPS
Child health
Issues particular to individuals up to the end of adolescence
Maternal health
Issues related to pregnancy and childbirth
Adult health
Issues specific to individuals after the end of adolescence in medicine, surgery and gynecology
Mental health
Biopsychosocial/cognitive issues related to mental health in all age groups
Population health and ethics
Issues related to groups and ethical behaviour. This includes population issues such as
immunization, disease outbreak management, population screening and surveillance, health
promotion strategies, epidemiology and relevant statistics. Ethical issues include boundary
issues, impairment of doctors and informed consent.
CLINICIAN TASKS
Data gathering
History taking, mental status examination, physical examination, laboratory testing, other
modalities (e.g. imaging, EKG, EEG, etc.)
Data interpretation and synthesis
Interpretation and synthesis of gathered data. Problem identification, setting priorities, risk
stratification and the formulation of differential and specific diagnoses.
Management
Education and health promotion, counselling, psychotherapy, drug and non-drug therapy
(includes fluid and electrolyte therapy, etc.), surgical interventions, radiological interventions,
cessation of therapy, rehabilitation, palliative care, interdisciplinary management, family and
community care.
HEALTH GROUP
Medica l Counc i l o f Canada
MCCEE Annual Techn ica l Repor t | 2018 7
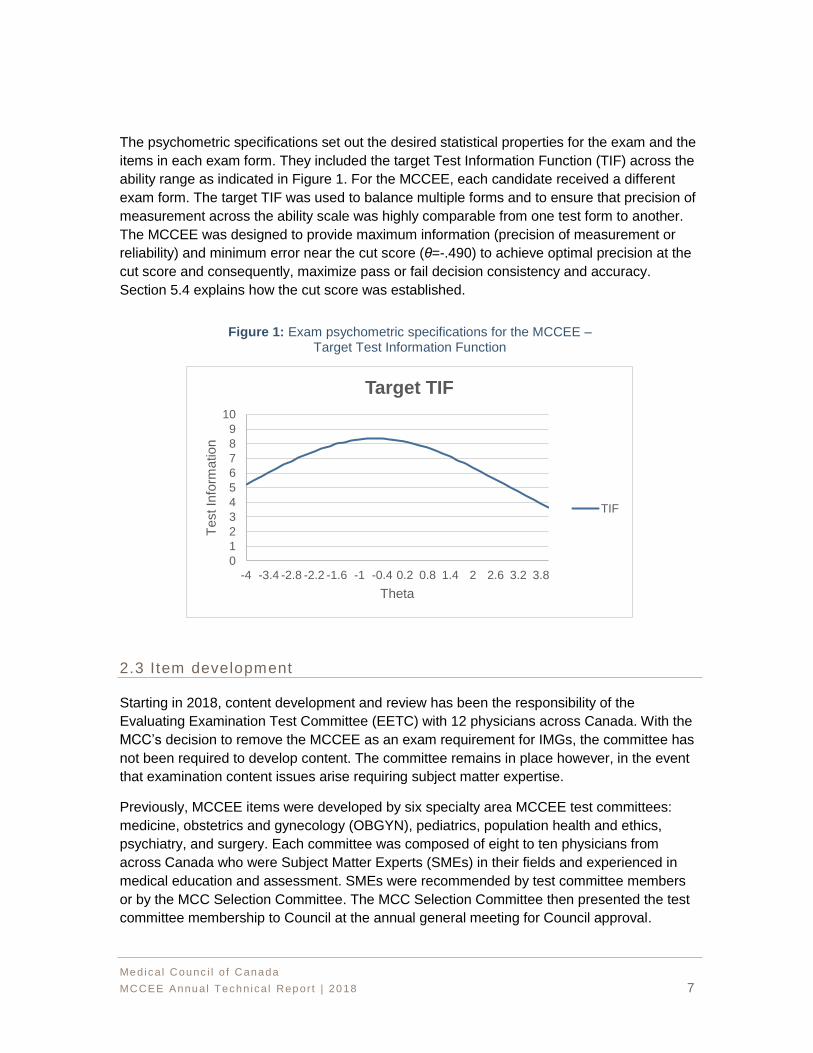
The psychometric specifications set out the desired statistical properties for the exam and the
items in each exam form. They included the target Test Information Function (TIF) across the
ability range as indicated in Figure 1. For the MCCEE, each candidate received a different
exam form. The target TIF was used to balance multiple forms and to ensure that precision of
measurement across the ability scale was highly comparable from one test form to another.
The MCCEE was designed to provide maximum information (precision of measurement or
reliability) and minimum error near the cut score (θ=-.490) to achieve optimal precision at the
cut score and consequently, maximize pass or fail decision consistency and accuracy.
Section 5.4 explains how the cut score was established.
Figure 1: Exam psychometric specifications for the MCCEE – Target Test Information Function
2.3 Item development
Starting in 2018, content development and review has been the responsibility of the
Evaluating Examination Test Committee (EETC) with 12 physicians across Canada. With the
MCC’s decision to remove the MCCEE as an exam requirement for IMGs, the committee has
not been required to develop content. The committee remains in place however, in the event
that examination content issues arise requiring subject matter expertise.
Previously, MCCEE items were developed by six specialty area MCCEE test committees:
medicine, obstetrics and gynecology (OBGYN), pediatrics, population health and ethics,
psychiatry, and surgery. Each committee was composed of eight to ten physicians from
across Canada who were Subject Matter Experts (SMEs) in their fields and experienced in
medical education and assessment. SMEs were recommended by test committee members
or by the MCC Selection Committee. The MCC Selection Committee then presented the test
committee membership to Council at the annual general meeting for Council approval.
0
1
2
3
4
5
6
7
8
9
10
-4 -3.4 -2.8 -2.2 -1.6 -1 -0.4 0.2 0.8 1.4 2 2.6 3.2 3.8
Test In
form
ation
Theta
Target TIF
TIF
Medica l Counc i l o f Canada
MCCEE Annual Techn ica l Repor t | 2018 8
In the past, test committee membership included representation from both official language
groups (English and French), number of years teaching and practicing, and geographic
representation from across Canada. Test items were developed and reviewed in accordance
with professional standards (American Educational Research Association [AERA], American
Psychological Association [APA] & National Council on Measurement in Education [NCME],
2014; Linn, 2006) and rigorous Quality Assurance (QA) processes. Each test committee
convened once per year in Ottawa at which time MCQs were written, classified, peer-
reviewed and approved for piloting. The MCC’s Test Development Officer (TDO), in
conjunction with the Test Committee Chair, offered guidance to test committee members as
they developed items to address known content gaps. Development was focused on creating
items with a range of difficulty levels, updating items to reflect new medical terminology (e.g.,
DSM-5, new medical practice/treatments, etc.), adding items required to meet exam
specifications and/or creating items to fill content gaps in the item bank.
All new and approved items from each test committee were reviewed and approved for
piloting by the EECC (a multi-disciplinary committee composed of the chairs and vice-chairs
of the six discipline test committees). The EECC conducted an overall review of items for bias
and sensitivity to ensure the test items and stimuli were fair for the candidates. Once all
content was approved, all items were sent for editorial review by MCC’s examination content
editors prior to being sent for translation. Approved pilot items were then included on a pilot
form. Newly-created items were piloted before they were used as operational items on any
examination form. Each pilot form contained 30 items, with five items from each discipline.
Though all pilot items were embedded in the operational exam, they did not count toward the
candidate’s final score. Pilot items were analyzed and calibrated when enough data had
been collected. Items that did not perform as expected were returned to the test committee for
review/revision and were later re-pilotedApproximately 400 to 500 items were piloted across
the five MCCEE administrations each year.
2.4 Establishing operational item pools
Typically, the EEC met yearly to establish and approve a pool of 1,500 operational items
drawn from the MCCEE item bank (see Section 5.2). This year, the committee did not meet
as the decision was made to use the same operational pool for the final three MCCEE
administrations of 2018.
For the operation item pool, the TDO, using the item pool assembly tool in the item bank,
selected all items not used in the prior pool and added them to a pool of available items for
establishing a new operational item pool using the exam specifications. The goal was to
create a unique pool each time, however, to meet the content and psychometric
specifications, the MCC allowed for some overlap across pools.
The EEC then performed a final medical proofing and QA check of all item content and
ensured that the scoring key was correct. If an item was no longer valid, a replacement item
was chosen from a pre-selected set of potential replacements from the item bank. Each
Medica l Counc i l o f Canada
MCCEE Annual Techn ica l Repor t | 2018 9
replacement item met the specifications of the discarded item with respect to content area
(e.g., health group, clinician task, etc.) and difficulty level.
SECTION 3: EXAM ADMINISTRATION
3.1 Exam delivery and exam centres
In 2018, the MCCEE was offered in January, March, May, September and
October/November. Each session consisted of a two- to three-week testing window.
Prometric was the vendor sourced by the MCC to deliver the MCCEE globally.
Eligible candidates were able to self-schedule their exams through the Prometric website.
There are more than 500 Prometric test centres in approximately 80 countries. Scheduling
was done on a first-come, first-served basis.
A list of countries where the MCCEE was offered appears in Appendix A.
3.2 Exam security
“Security is a major concern for test administration” (Downing, 2006, p.1). The MCC has a
comprehensive approach to address exam security. This includes: registration, content
development, content transfer, test publishing and delivery, exam sites, the secure transfer of
results back to the MCC for scoring, and results analysis. This “chain of security” is required
during test production and widens even more during larger-scale test administrations
(Downing, 2006, p.15).
Registration:
In physiciansapply.ca, MCC’s online registration portal, only authenticated and eligible
candidates were permitted to register for the exam. Once registered, candidates received an
“Authorization To Test” (ATT) identification number that was required by Prometric to
schedule an exam. These initial registration processes validated that only approved test
takers could register and attempt an exam.
Content development:
The MCC communicated regularly with SMEs about the importance and priority of exam
content security. All SMEs were required to sign a Code of Business Conduct with the MCC.
Examination content was developed during on-site meetings at the MCC’s headquarters
through a secure item banking software developed and stored internally. Content writers,
when required to work remotely, logged onto the MCC servers using a secure two-step
Medica l Counc i l o f Canada
MCCEE Annual Techn ica l Repor t | 2018 10
authentication process.
Secure test publishing processes and protocols have been well established with Prometric
and test centre guidelines (test delivery) and were reviewed with them prior to each testing
window to ensure that results were processed in a secure environment.
Content transfer:
Content was transferred between the MCC and Prometric using a secure File Transfer
Protocol (FTP). The content resided in the secure Prometric environment while staff ran
necessary analysis testing the delivery algorithms and reporting on any blueprint
inconsistencies revealed during this simulation.
The MCC staff logged into a secure Prometric system to review the content for any errors or
formatting issues. When all content issues were resolved and blueprint simulations validated,
the examination became ready for delivery on Prometric’s secure platform.
Test publishing and delivery:
Test publishing processes, using the LOFT delivery method, limited the exposure of the entire
MCCEE item bank. From a test security perspective, this delivery method administered only a
portion of the pre-selected item pool and a unique form to each candidate.
Exam sites:
The uniform design of the Prometric labs worldwide delivered a consistent exam environment
where security is of highest priority. Upon arrival, each candidate was asked to secure their
personal belongings (including smartphones and other transmitting devices) in a locker prior
to entering the testing room. All candidates were required to provide government issued
identification to confirm their identity. As the candidate was checked into the Prometric
registration system, site staff was required to confirm that the presented candidate matched
the photo identification supplied by the MCC. All candidates were then screened for electronic
devices, either with a physical wand or by passing through a full-body scanner. Additionally,
candidates were monitored throughout the exam by site staff, passing through the exam
centre and through video surveillance.
Proctors at every Prometric testing centre have been professionally trained to identify
potential test security breaches and each location is monitored with advanced security
equipment, and subject to multiple random security audits.
During an active examination session, daily Centre Procedure Reports (CPRs) were sent to
the MCC for evaluation and investigation, along with the appropriate investigative materials
available from Prometric (videos, documentation from the proctor, etc.).
Exam results and analysis:
At the conclusion of an examination, candidate results were transferred to the MCC via a
secure FTP and processed in the MCC’s secure scoring environment.
Medica l Counc i l o f Canada
MCCEE Annual Techn ica l Repor t | 2018 11
The MCC staff analyzed candidate performance by exam date over each testing window,
searching for evidence of any content exposure and/or security breaches. In addition, the
MCC monitored various social media websites in search of disclosure of test content and
investigated if any security breach was identified.
3.3 Exam preparat ion
Online materials have been available to help candidates prepare for the MCCEE. These
resources included a demonstration of exam format, computer navigation, self-assessment
tools, a list of reference manuals by specialty area, and the MCC Objectives. Candidates
could access all resources on the MCC’s website at mcc.ca/examinations/mccee/
preparation-resources. Since the last MCCEE took place on November 11, 2018, resources
on this page are being offered for information/reference purposes only.
3.4 Scoring and quality control
The Evaluation Bureau (EB) used a number of technological systems and scoring
applications to perform an initial QA and data validation. Once it was determined the data met
the established QA requirements, the final scoring was completed by the EB and exam
results were analyzed and summarized in a report by Psychometrics and Assessment
Services (PAS).
The MCCEE results were reported on a standard score scale ranging from 50 to 500. The
pass score was 250 before May 2017 and has been 261 beginning with the May 2017
administration (please refer to Section 5.4 for details regarding standard setting). Before
scores were released, exam results were reviewed and approved by the EEC.
3.5 Release of results
Approximately six to eight weeks following the last day of the exam session, the EEC met to
review performance on the exam, address administrative issues, rule on special candidate
cases and approve exam results. Starting in September 2017, this committee has deemed
exam results auto-approved if exam psychometric performance fell within the established
parameters for auto-approval. Any special cases that required the EEC’s review were brought
to the EEC for discussion and decision. The MCC then granted candidates access to their
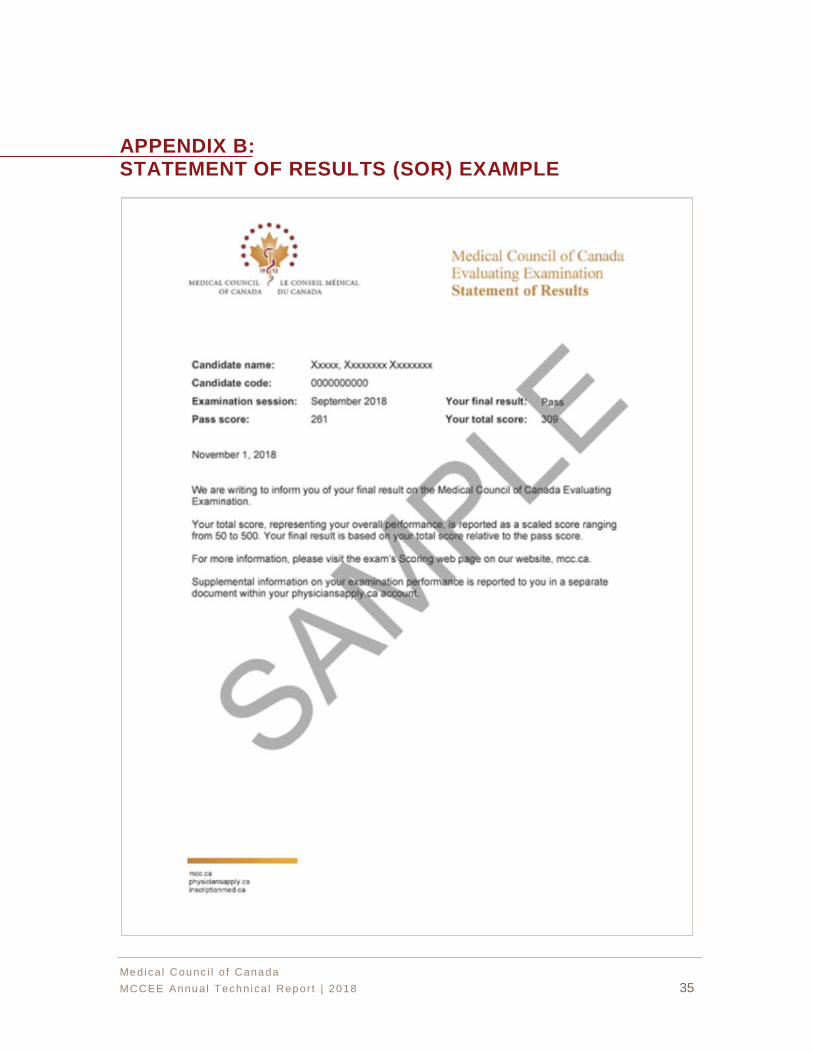
final result (pass or fail) and total score through their physiciansapply.ca accounts. Shortly
thereafter, each candidate had access to the Statement of Results (SOR), the official results
document, and the Supplemental Feedback Report (SFR), providing information on their
relative strengths and weaknesses by health group, clinician task, and specialty area.
Samples of an SOR and an SFR are available in Appendix B and C, respectively.
Medica l Counc i l o f Canada
MCCEE Annual Techn ica l Repor t | 2018 12
SECTION 4: VALIDITY
“Validity refers to the degree to which evidence and theory support the interpretation of test
scores entailed by proposed uses of tests” (American Educational Research Association
[AERA], American Psychological Association [APA] & National Council on Measurement in
Education [NCME], 2014). Test validation requires gathering and integrating evidence from
multiple sources to develop a validity argument that supports intended uses and
interpretations of scores and to rule out threats to validity (Messick, 1989, 1994).
The validation of the MCCEE has been an ongoing process of gathering evidence in support
of the interpretation of exam scores as one of the indicators of a candidate’s basic medical
knowledge in the principal specialty areas of medicine. Validity considerations have been
incorporated into exam design, exam specifications, item development, exam assembly,
psychometric quality, exam administration, and results reporting.
4.1 Evidence based on exam content
During the course of exam content development, care was taken to ensure the exam was
relevant to Undergraduate Medical Education (UGME) and to the requirements for entry into
postgraduate training in Canada. As indicated in Section 2, the MCCEE items were
developed based on exam content specifications carefully defined by committee members
who ensured the exam content reflected the basic medical knowledge and problem solving of
a candidate at a level comparable to a minimally competent medical student completing his or
her medical education in Canada and about to enter supervised practice. As the MCCEE was
designed for IMGs who may be less familiar with the Canadian practice environment,
particular attention was paid to ensuring the exam was free of content such as medical
practice, therapeutics, and legal/ethical issues specific to Canada.
Various test committees in the MCC are involved in developing test items. Regular content
development workshops are conducted to train committee members on professional test
development guidelines and on drafting items that reflect the knowledge and skills
emphasized in the exam specifications for each content area. The draft items are reviewed,
edited, and finalized by test committee members, TDOs, and editors. The items are initially
developed in English and then translated into French by professional translators whose work
is vetted by TDOs and editors. In addition, an analysis is performed after each exam
administration to ensure that all exam forms assembled during an administration comply with
the exam content specifications. These rigorous approaches all helped ensure content validity
of the MCCEE.
4.2 Evidence based on internal structure
As each candidate received a different (but comparable) set of items, a factor analysis could not
be conducted to examine the factor structure of the exam. However, the internal structure of the
Medica l Counc i l o f Canada
MCCEE Annual Techn ica l Repor t | 2018 13
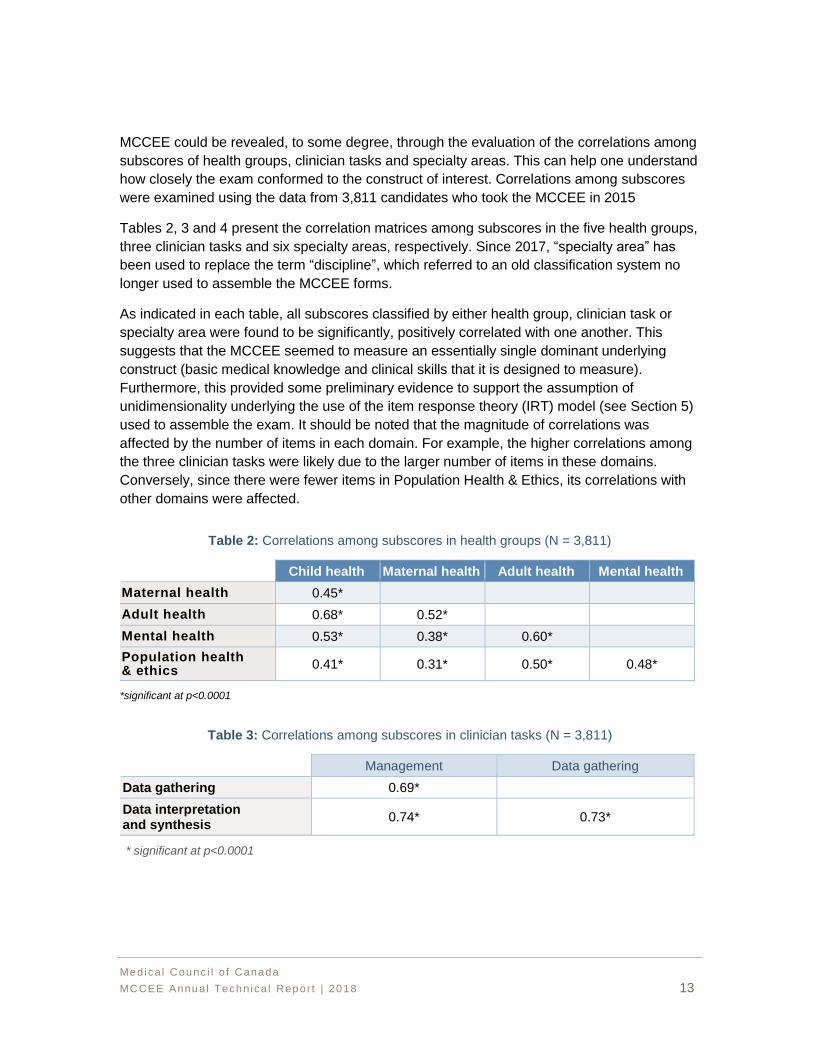
MCCEE could be revealed, to some degree, through the evaluation of the correlations among
subscores of health groups, clinician tasks and specialty areas. This can help one understand
how closely the exam conformed to the construct of interest. Correlations among subscores
were examined using the data from 3,811 candidates who took the MCCEE in 2015
Tables 2, 3 and 4 present the correlation matrices among subscores in the five health groups,
three clinician tasks and six specialty areas, respectively. Since 2017, “specialty area” has
been used to replace the term “discipline”, which referred to an old classification system no
longer used to assemble the MCCEE forms.
As indicated in each table, all subscores classified by either health group, clinician task or
specialty area were found to be significantly, positively correlated with one another. This
suggests that the MCCEE seemed to measure an essentially single dominant underlying
construct (basic medical knowledge and clinical skills that it is designed to measure).
Furthermore, this provided some preliminary evidence to support the assumption of
unidimensionality underlying the use of the item response theory (IRT) model (see Section 5)
used to assemble the exam. It should be noted that the magnitude of correlations was
affected by the number of items in each domain. For example, the higher correlations among
the three clinician tasks were likely due to the larger number of items in these domains.
Conversely, since there were fewer items in Population Health & Ethics, its correlations with
other domains were affected.
Table 2: Correlations among subscores in health groups (N = 3,811)
Child health Adult health Mental health
Maternal health 0.45*
Adult health 0.68* 0.52*
Mental health 0.53* 0.38* 0.60*
Population health & ethics
0.41* 0.31* 0.50* 0.48*
*significant at p<0.0001
Table 3: Correlations among subscores in clinician tasks (N = 3,811)
Management Data gathering
Data gathering 0.69*
Data interpretation and synthesis
0.74* 0.73*
* significant at p<0.0001
Maternal health
Medica l Counc i l o f Canada
MCCEE Annual Techn ica l Repor t | 2018 14
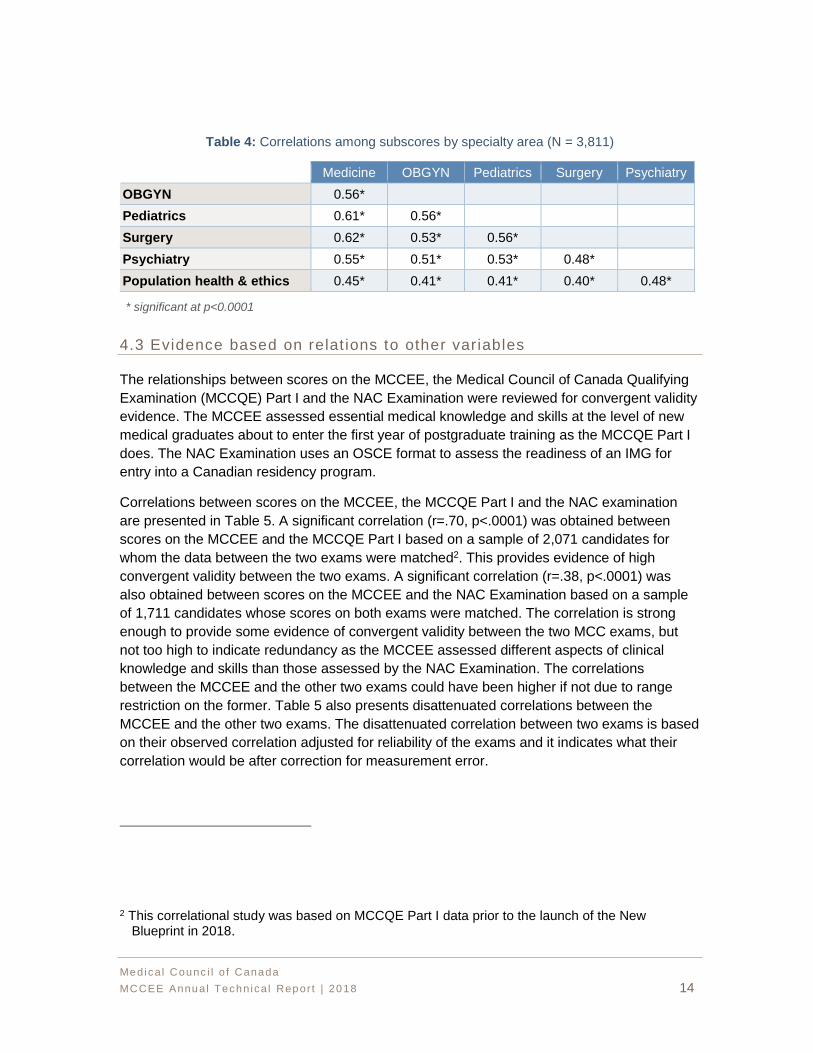
Table 4: Correlations among subscores by specialty area (N = 3,811)
Medicine OBGYN Pediatrics Surgery Psychiatry
OBGYN 0.56*
Pediatrics 0.61* 0.56*
Surgery 0.62* 0.53* 0.56*
Psychiatry 0.55* 0.51* 0.53* 0.48*
Population health & ethics 0.45* 0.41* 0.41* 0.40* 0.48*
* significant at p<0.0001
4.3 Evidence based on relat ions to other variables
The relationships between scores on the MCCEE, the Medical Council of Canada Qualifying
Examination (MCCQE) Part I and the NAC Examination were reviewed for convergent validity
evidence. The MCCEE assessed essential medical knowledge and skills at the level of new
medical graduates about to enter the first year of postgraduate training as the MCCQE Part I
does. The NAC Examination uses an OSCE format to assess the readiness of an IMG for
entry into a Canadian residency program.
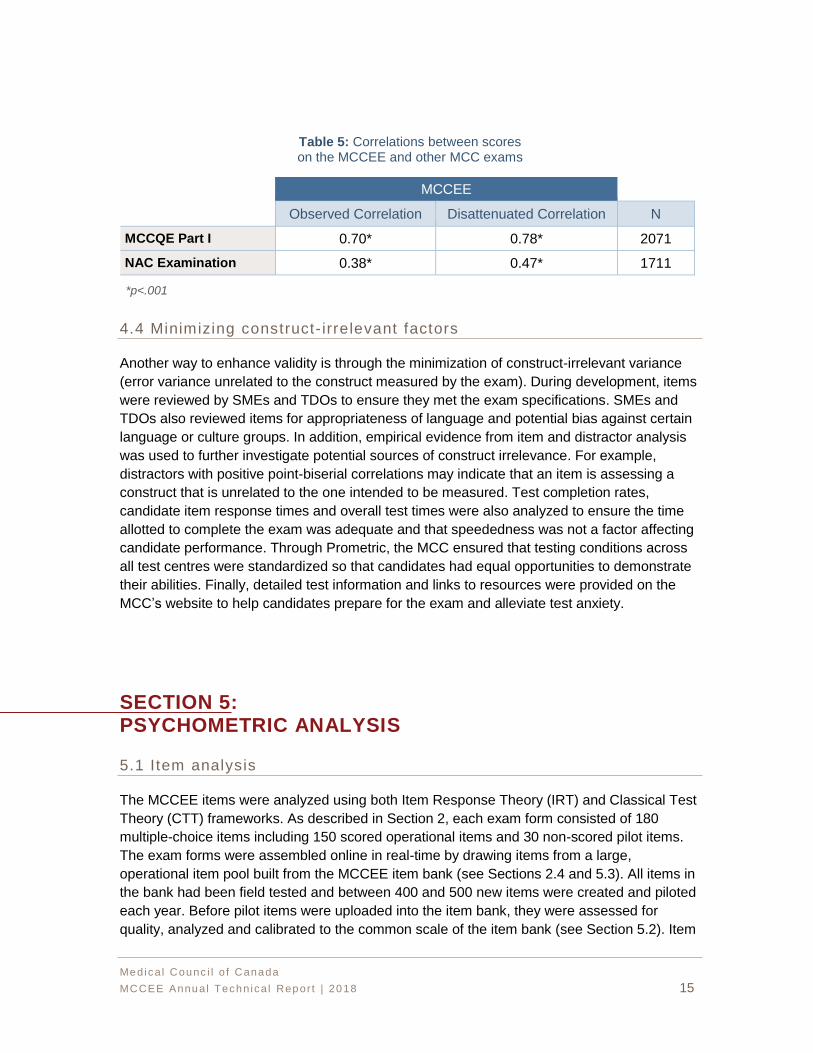
Correlations between scores on the MCCEE, the MCCQE Part I and the NAC examination
are presented in Table 5. A significant correlation (r=.70, p<.0001) was obtained between
scores on the MCCEE and the MCCQE Part I based on a sample of 2,071 candidates for
whom the data between the two exams were matched2. This provides evidence of high
convergent validity between the two exams. A significant correlation (r=.38, p<.0001) was
also obtained between scores on the MCCEE and the NAC Examination based on a sample
of 1,711 candidates whose scores on both exams were matched. The correlation is strong
enough to provide some evidence of convergent validity between the two MCC exams, but
not too high to indicate redundancy as the MCCEE assessed different aspects of clinical
knowledge and skills than those assessed by the NAC Examination. The correlations
between the MCCEE and the other two exams could have been higher if not due to range
restriction on the former. Table 5 also presents disattenuated correlations between the
MCCEE and the other two exams. The disattenuated correlation between two exams is based
on their observed correlation adjusted for reliability of the exams and it indicates what their
correlation would be after correction for measurement error.
2 This correlational study was based on MCCQE Part I data prior to the launch of the New Blueprint in 2018.
Medica l Counc i l o f Canada
MCCEE Annual Techn ica l Repor t | 2018 15
Table 5: Correlations between scores on the MCCEE and other MCC exams
MCCEE
Observed Correlation Disattenuated Correlation N
MCCQE Part I 0.70* 0.78* 2071
NAC Examination 0.38* 0.47* 1711
*p<.001
4.4 Minimizing construct- irrelevant factors
Another way to enhance validity is through the minimization of construct-irrelevant variance
(error variance unrelated to the construct measured by the exam). During development, items
were reviewed by SMEs and TDOs to ensure they met the exam specifications. SMEs and
TDOs also reviewed items for appropriateness of language and potential bias against certain
language or culture groups. In addition, empirical evidence from item and distractor analysis
was used to further investigate potential sources of construct irrelevance. For example,
distractors with positive point-biserial correlations may indicate that an item is assessing a
construct that is unrelated to the one intended to be measured. Test completion rates,
candidate item response times and overall test times were also analyzed to ensure the time
allotted to complete the exam was adequate and that speededness was not a factor affecting
candidate performance. Through Prometric, the MCC ensured that testing conditions across
all test centres were standardized so that candidates had equal opportunities to demonstrate
their abilities. Finally, detailed test information and links to resources were provided on the
MCC’s website to help candidates prepare for the exam and alleviate test anxiety.
SECTION 5: PSYCHOMETRIC ANALYSIS
5.1 Item analysis
The MCCEE items were analyzed using both Item Response Theory (IRT) and Classical Test
Theory (CTT) frameworks. As described in Section 2, each exam form consisted of 180
multiple-choice items including 150 scored operational items and 30 non-scored pilot items.
The exam forms were assembled online in real-time by drawing items from a large,
operational item pool built from the MCCEE item bank (see Sections 2.4 and 5.3). All items in
the bank had been field tested and between 400 and 500 new items were created and piloted
each year. Before pilot items were uploaded into the item bank, they were assessed for
quality, analyzed and calibrated to the common scale of the item bank (see Section 5.2). Item
Medica l Counc i l o f Canada
MCCEE Annual Techn ica l Repor t | 2018 16
analysis involved computing a set of statistics based on both IRT and CTT. These statistics
provided information about item difficulty, item discrimination and distractor performance
(incorrect answer choice). Problematic items were identified and sent back to appropriate test
committees for evaluation and revision, if required.
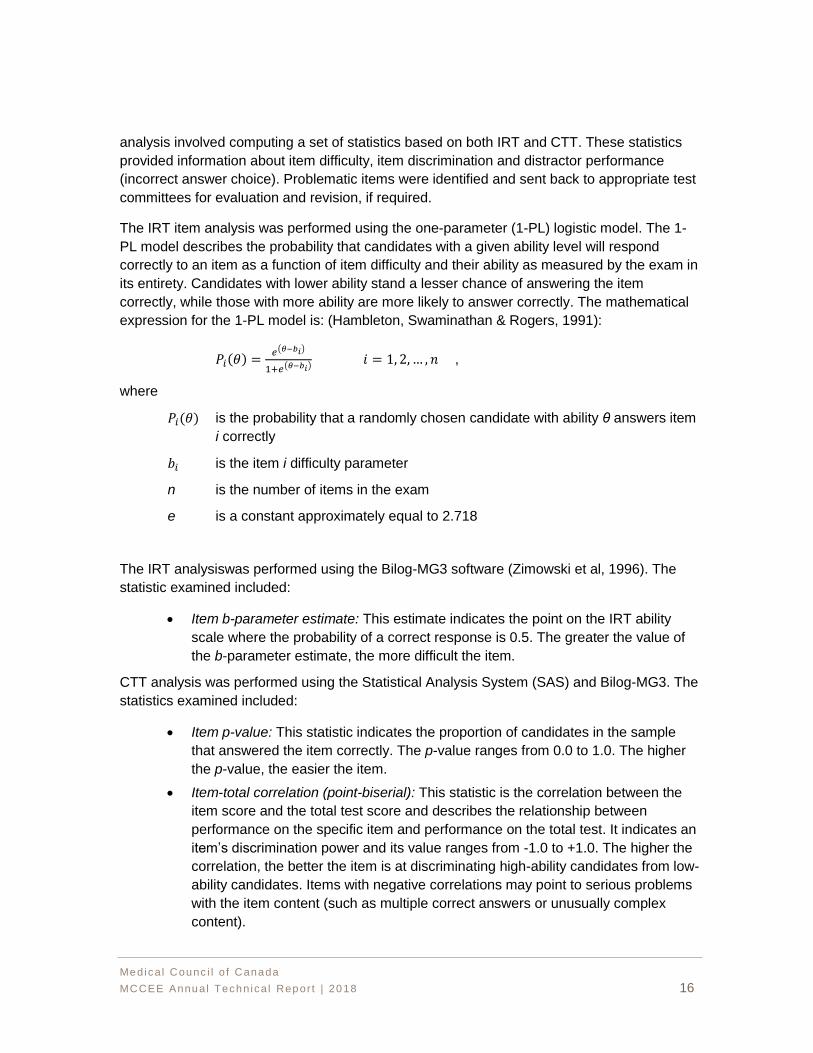
The IRT item analysis was performed using the one-parameter (1-PL) logistic model. The 1-
PL model describes the probability that candidates with a given ability level will respond
correctly to an item as a function of item difficulty and their ability as measured by the exam in
its entirety. Candidates with lower ability stand a lesser chance of answering the item
correctly, while those with more ability are more likely to answer correctly. The mathematical
expression for the 1-PL model is: (Hambleton, Swaminathan & Rogers, 1991):
𝑃𝑖(𝜃) =𝑒(𝜃−𝑏𝑖)
1+𝑒(𝜃−𝑏𝑖) 𝑖 = 1, 2, … , 𝑛 ,
where
𝑃𝑖(𝜃) is the probability that a randomly chosen candidate with ability θ answers item
i correctly
𝑏𝑖 is the item i difficulty parameter
n is the number of items in the exam
e is a constant approximately equal to 2.718
The IRT analysiswas performed using the Bilog-MG3 software (Zimowski et al, 1996). The
statistic examined included:
• Item b-parameter estimate: This estimate indicates the point on the IRT ability
scale where the probability of a correct response is 0.5. The greater the value of
the b-parameter estimate, the more difficult the item.
CTT analysis was performed using the Statistical Analysis System (SAS) and Bilog-MG3. The
statistics examined included:
• Item p-value: This statistic indicates the proportion of candidates in the sample
that answered the item correctly. The p-value ranges from 0.0 to 1.0. The higher
the p-value, the easier the item.
• Item-total correlation (point-biserial): This statistic is the correlation between the
item score and the total test score and describes the relationship between
performance on the specific item and performance on the total test. It indicates an
item’s discrimination power and its value ranges from -1.0 to +1.0. The higher the
correlation, the better the item is at discriminating high-ability candidates from low-
ability candidates. Items with negative correlations may point to serious problems
with the item content (such as multiple correct answers or unusually complex
content).
Medica l Counc i l o f Canada
MCCEE Annual Techn ica l Repor t | 2018 17
• The proportion of candidates choosing each answer option, including both the
correct answer and incorrect answers (distractors) is also provided. It is desirable
to have each answer option chosen by at least a few candidates.
• Distractor-total correlation: This statistic is the correlation between a distractor and
the total test, and describes the relationship between selecting an incorrect
response for a specific item and performance on the entire test. A very low or
negative value is desirable as more low ability candidates are expected to select
these incorrect responses.
Each statistic provides some information about the characteristics of an item from an
empirical perspective. These statistics were used to evaluate each item’s psychometric
quality and help detect any potential content-related issues. Items that fell into the following
categories were not included in an item pool and were flagged for further review:
• p-value < .05 or p-value > .95
• Point-biserial < .05
• b-parameter < -5.5, or b-parameter > 5.5
5.2 Item bank calibration
The MCCEE item bank was calibrated and scaled using the 1-PL IRT model described above.
Prior to 2013, the items in the bank were calibrated using the item responses of all test takers
gathered up to the time when the calibration was performed. In April 2013, following best
practice, the item bank was recalibrated using only the item responses of first-time test takers
between 2008 and 2012 (repeaters were excluded from the calibration sample). For the
purpose of establishing a new scale for the bank, a concurrent calibration was implemented
where b-parameters for all items (previously banked items and pilot items) were estimated
simultaneously using the Bilog-MG3 software (Zimowski et al, 1996). Concurrent calibration
places item parameters on a common scale so that ability estimates from different
administrations are comparable (Kang & Peterson, 2009; Kim, 2006; Kim, 2007). In 2016, the
item bank was updated and recalibrated using candidate response data from January 2013 to
May 2016. A Fixed-Parameter Calibration (FPC) with Simple Transformation Prior Update
(STPU) method (Kim, 2006) was used to link the scale of the new bank to the scale of the
previous bank of items. Some items were excluded due to low discrimination power and/or
because they were too easy or too difficult. The remaining items, along with their statistics,
were uploaded to the bank.
In the past, pilot items needed to be calibrated and scaled to the common bank scale once
adequate data became available for these items. Due to the LOFT design, item exposure
rates vary widely across items. To obtain an adequate sample size for the purposes of IRT
calibration and scaling of pilot items, item responses from multiple administrations were
combined excluding:
Medica l Counc i l o f Canada
MCCEE Annual Techn ica l Repor t | 2018 18
• Items with fewer than 100 responses as these may result in unstable parameter
estimates
• Items with a p-value equal to zero (nobody answered the item correctly) or a p-
value equal to one (everybody answered the item correctly) as parameters cannot
be estimated (no variance)
A common-item, non-equivalent groups design was used, where all the operational items (i.e.,
counting items) were treated as anchor items to link the pilot items to the bank. Bilog-MG3
was first used to estimate b-parameter estimates for all items in separate calibrations. The
new and banked b-parameter estimates for the anchor items were then used to estimate
slope and intercept values using the IRT Mean-Mean (Kolen & Brennan, 2004) method to
enable a linear transformation to put the b-parameter estimates of the pilot items on the scale
of the bank. After scaling, pilot items that met psychometric criteria were added to the item
bank for future use.
For the purpose of LOFT test delivery as described in Section 5.3, items in the bank were
classified into four difficulty levels based on their b-parameter estimates, with level 1
representing the easiest level and level 4 the most difficult level:
• Level 1: b ≤ -2.25
• Level 2: -2.25 < b ≤ -0.75
• Level 3: -0.75 < b ≤ 0.75
• Level 4: b > 0.75
5.3 LOFT del ivery
As indicated in Section 1, the MCCEE was administered using a computer-based, LOFT
design and was delivered securely by Prometric, a test service provider. With the LOFT
design, an exam form was constructed in real-time by selecting items from a large pool of
operational items each time a candidate took the exam. Test security was enhanced because
of the large number of forms the LOFT process can assemble. Each form was constrained by
exam content specifications and psychometric criteria (test information target, item difficulty,
and item exposure parameters). Although each candidate received a unique set of items,
scores from all exams were comparable as all items in the pool were pre-calibrated and linked
to a common scale established for the item bank from which the operational pool was drawn.
The cut score was equivalent across exam forms.
When submitting items to Prometric to be used on an exam, the MCC provided the following
information:
• The exam specifications including the upper and lower boundaries for each
content category (minimum and maximum number of items allowed per content
category), plus a weight (0-1.00) for each category. The weight value represents
the proportion of the items from that category that should be included on the
exam.
Medica l Counc i l o f Canada
MCCEE Annual Techn ica l Repor t | 2018 19
• A large pool of items with IRT b-parameter estimates and their associated content
categories
• The classification of item difficulty level ranging from one to four
• A list of enemy items (list of any two items that should not be included on the
same exam form because their content overlaps or could provide answer clues to
each other)
• A psychometric target for test information and standard errors of ability estimates
(see Section 2.2, Figure 1)
• A list of pilot items assembled in six to seven packets of 30 items to be presented
along with the operational items
• The length of the exam including the number of operational items and the number
of non-scored pilot items
Based on this information, Prometric calculated an exposure control parameter for each
operational item in the pool. The exposure control parameter represents the probability that
an item will be selected for an exam. Items that best meet both the content specifications and
the psychometric targets will have higher exposure control parameters than items that are
less optimal at meeting these constraints. Items are selected for a candidate’s exam from a
large pool of items through randomization and optimization procedures. Items with higher
exposure control parameters have a higher likelihood of being included in an exam form.
It is possible for some items to be exposed more often. This occurs especially in smaller
categories in which certain items may have higher values toward meeting the psychometric
target than other items in that category. To avoid overexposure of items, it is important that
there be a sufficient number of items in all categories to prevent oversampling and
overexposing some items.
The MCC monitored item exposure for each administration of the MCCEE and worked closely
with Prometric to address any related issues. For a given administration, items were
considered:
• “Overexposed” when seen by more than 50 per cent of candidates
• “Underexposed” when seen by at least one candidate but less than 5 per cent of
candidates
• “Not exposed” when not seen by any candidates
5.4 Standard sett ing
Every few years, the MCC brought together a panel of Canadian physicians to define an
acceptable level of performance and establish the pass score for the MCCEE through a
standard-setting exercise. The panel then recommended its pass score to the EECC for
approval.
Medica l Counc i l o f Canada
MCCEE Annual Techn ica l Repor t | 2018 20
In November 2016, the MCC conducted a rigorous standard-setting exercise with a diverse
panel of 21 physicians from across the country. The method used is called the Bookmark
Method, which has been widely used for MCQ exams. Following the standard-setting
exercise, the panel recommended a pass score of 261 on the most recent reporting scale of
50-500. This pass score was reviewed and approved by the EECC.
The pass score of 261 was applied starting with the May 2017 session of the MCCEE and
remained in place until the last session of the MCCEE.
Prior to May 2017, the pass score for the MCCEE was 250 on the reporting scale ranging
from of 50 to 500. For candidates who took the MCCEE prior to May 2017, their final result
(pass or fail) remains valid.
5.5 Scoring and score report ing
The 150 operational items that each candidate answered on the MCCEE were scored, but the
30 pilot items included in exam forms were not. The candidate ability θ was estimated using a
1-PL IRT model with a Bayes Expected A Posteriori (EAP) procedure. Proficiency estimates
were scaled to have a mean of 0 and standard deviation of 1.0. The banked b-parameter
estimates were used to estimate each candidate’s ability score θ along with their item
response patterns.
Theoretically, the values of θ can range from -∞ to +∞, but practically, most of the θ values
typically ranged from -3.0 to +3.0. To make it easier to communicate exam scores to
candidates and other test users, the estimated θ score was linearly transformed onto a
reporting scale to eliminate decimals and negative numbers. The reporting scale used for the
MCCEE ranged from 50 to 500 with a standard deviation of 50. Transformed scores that were
below 50 were adjusted to 50 and scores above 500 were adjusted to 500.
The θ cut score of -0.490 converted to a reported scale score of 261. Each candidate’s
estimated θ score was converted to a reported score using the following equation:
Reported score (rounded) = 50 * (θ + 0.490) + 261
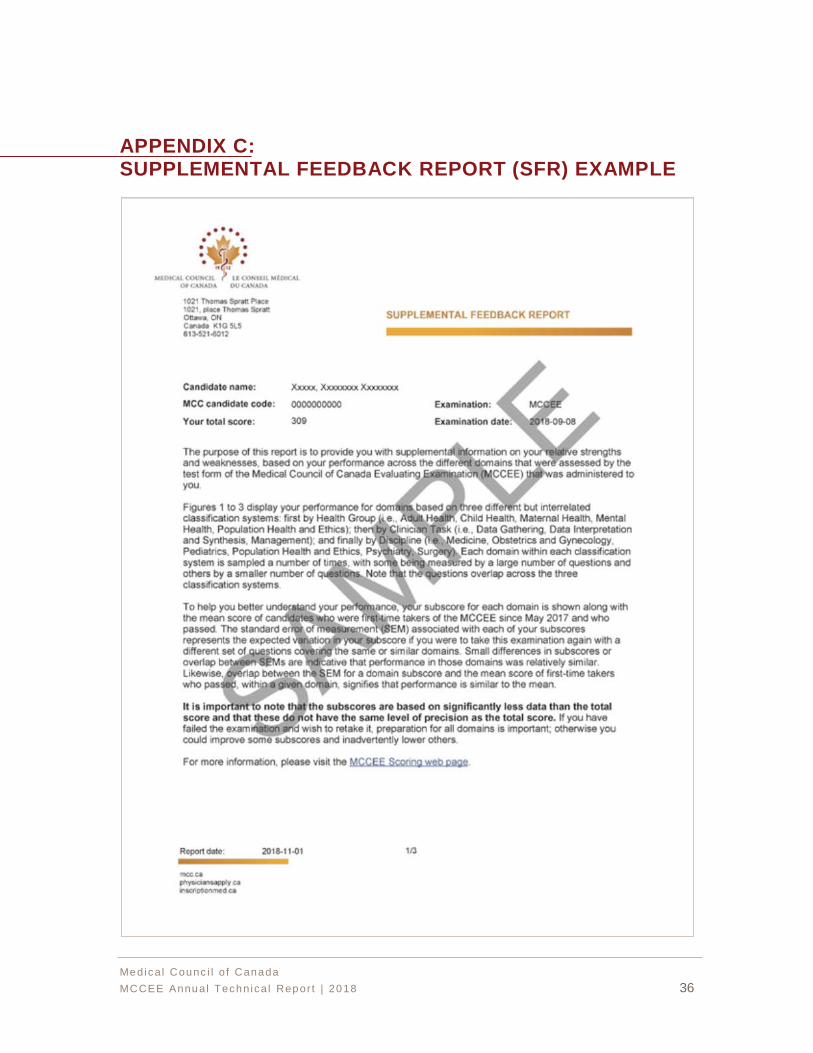
In addition to providing candidates with their total score in the SOR, the MCC also provided
supplemental graphical feedback via the SFR on the candidates’ performance on the health
group, clinician task and specialty area sub-categories to help them understand their
strengths and weaknesses as assessed by the MCCEE. It is important to note that subscores
had lower measurement precision than total scores as there were fewer items. The subscores
were provided to individual candidates for feedback only and were not meant to be used by
organizations for selection decision-making.
Medica l Counc i l o f Canada
MCCEE Annual Techn ica l Repor t | 2018 21
SECTION 6: EXAM RESULTS
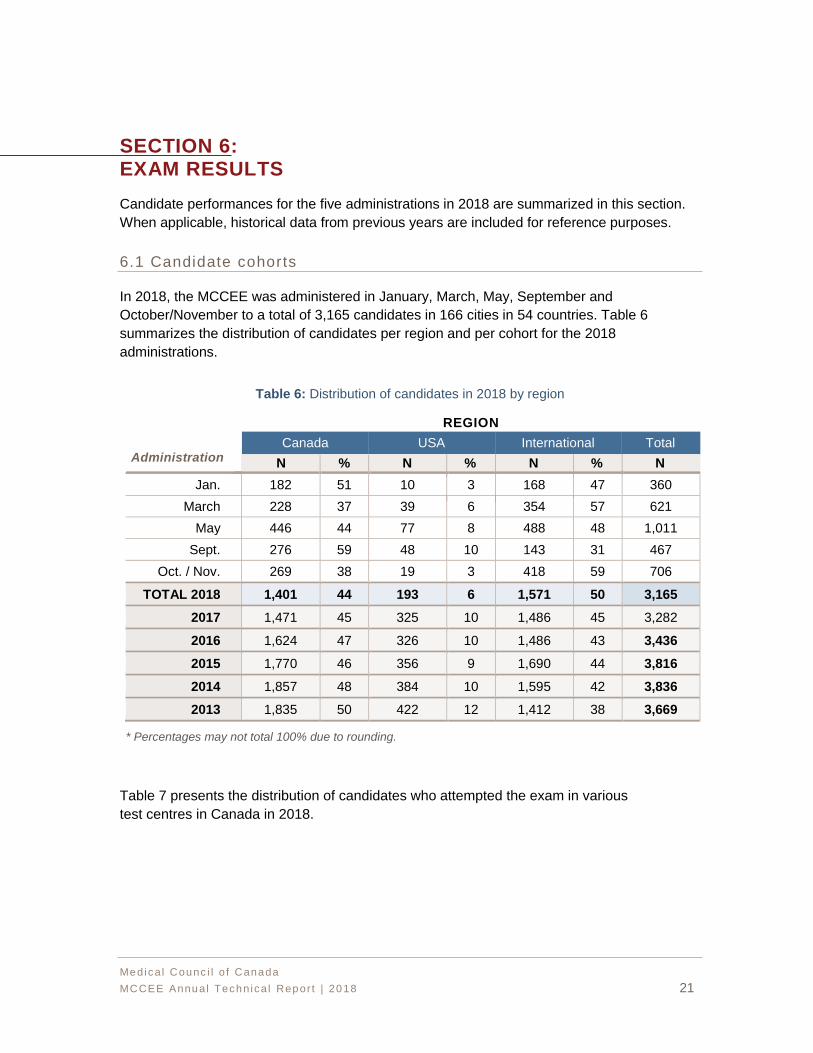
Candidate performances for the five administrations in 2018 are summarized in this section.
When applicable, historical data from previous years are included for reference purposes.
6.1 Candidate cohorts
In 2018, the MCCEE was administered in January, March, May, September and
October/November to a total of 3,165 candidates in 166 cities in 54 countries. Table 6
summarizes the distribution of candidates per region and per cohort for the 2018
administrations.
Table 6: Distribution of candidates in 2018 by region
Administration
REGION
Canada USA International Total
N % N % N % N
Jan. 182 51 10 3 168 47 360
March 228 37 39 6 354 57 621
May 446 44 77 8 488 48 1,011
Sept. 276 59 48 10 143 31 467
Oct. / Nov. 269 38 19 3 418 59 706
TOTAL 2018 1,401 44 193 6 1,571 50 3,165
2017 1,471 45 325 10 1,486 45 3,282
2016 1,624 47 326 10 1,486 43 3,436
2015 1,770 46 356 9 1,690 44 3,816
2014 1,857 48 384 10 1,595 42 3,836
2013 1,835 50 422 12 1,412 38 3,669
* Percentages may not total 100% due to rounding.
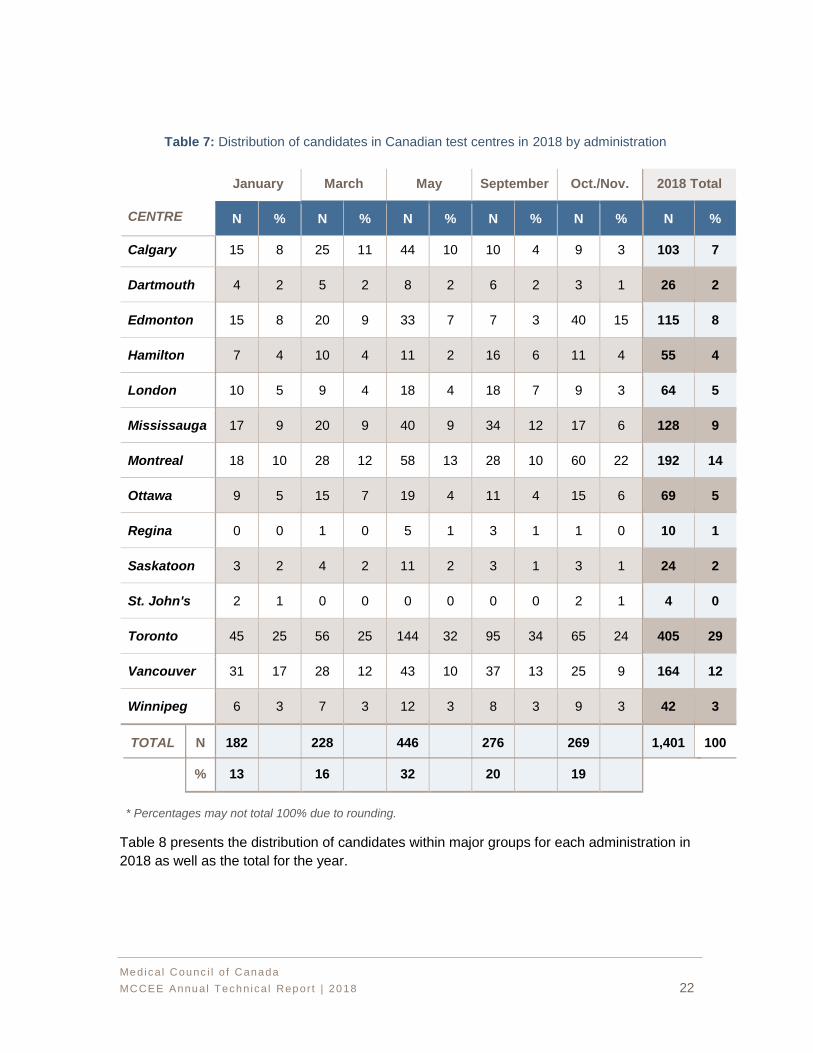
Table 7 presents the distribution of candidates who attempted the exam in various
test centres in Canada in 2018.
% 13 16 32 20 19
Medica l Counc i l o f Canada
MCCEE Annual Techn ica l Repor t | 2018 22
Table 7: Distribution of candidates in Canadian test centres in 2018 by administration
CENTRE
January March May September Oct./Nov. 2018 Total
N % N % N % N % N % N %
Calgary 15 8 25 11 44 10 10 4 9 3 103 7
Dartmouth 4 2 5 2 8 2 6 2 3 1 26 2
Edmonton 15 8 20 9 33 7 7 3 40 15 115 8
Hamilton 7 4 10 4 11 2 16 6 11 4 55 4
London 10 5 9 4 18 4 18 7 9 3 64 5
Mississauga 17 9 20 9 40 9 34 12 17 6 128 9
Montreal 18 10 28 12 58 13 28 10 60 22 192 14
Ottawa 9 5 15 7 19 4 11 4 15 6 69 5
Regina 0 0 1 0 5 1 3 1 1 0 10 1
Saskatoon 3 2 4 2 11 2 3 1 3 1 24 2
St. John's 2 1 0 0 0 0 0 0 2 1 4 0
Toronto 45 25 56 25 144 32 95 34 65 24 405 29
Vancouver 31 17 28 12 43 10 37 13 25 9 164 12
Winnipeg 6 3 7 3 12 3 8 3 9 3 42 3
TOTAL N 182 228 446 276 269 1,401 100
* Percentages may not total 100% due to rounding.
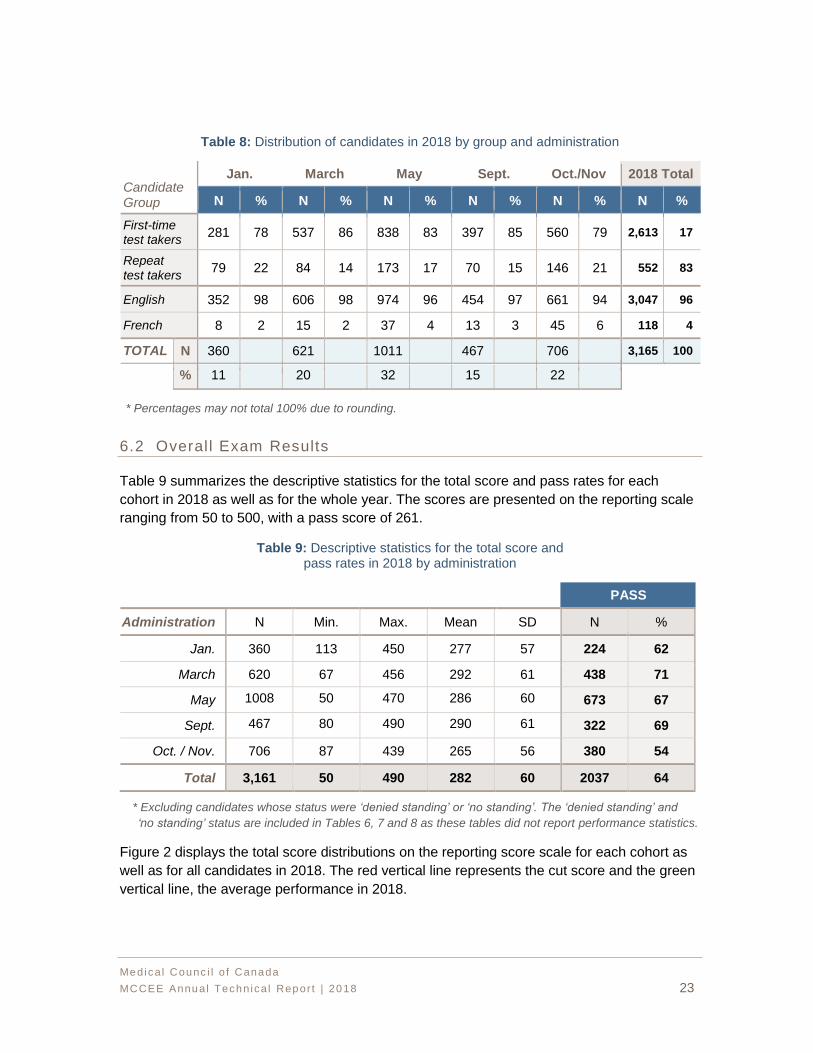
Table 8 presents the distribution of candidates within major groups for each administration in
2018 as well as the total for the year.
Medica l Counc i l o f Canada
MCCEE Annual Techn ica l Repor t | 2018 23
Table 8: Distribution of candidates in 2018 by group and administration
Candidate Group
Jan. March May Sept. Oct./Nov 2018 Total
N % N % N % N % N % N %
First-time test takers
281 78 537 86 838 83 397 85 560 79 2,613 17
Repeat test takers
79 22 84 14 173 17 70 15 146 21 552 83
English 352 98 606 98 974 96 454 97 661 94 3,047 96
French 8 2 15 2 37 4 13 3 45 6 118 4
TOTAL N 360 621 1011 467 706 3,165 100
% 11 20 32 15 22
* Percentages may not total 100% due to rounding.
6.2 Overal l Exam Results
Table 9 summarizes the descriptive statistics for the total score and pass rates for each
cohort in 2018 as well as for the whole year. The scores are presented on the reporting scale
ranging from 50 to 500, with a pass score of 261.
Table 9: Descriptive statistics for the total score and pass rates in 2018 by administration
PASS
Administration N Min. Max. Mean SD N %
Jan. 360 113 450 277 57 224 62
March 620 67 456 292 61 438 71
May 1008 50 470 286 60 673 67
Sept. 467 80 490 290 61 322 69
Oct. / Nov. 706 87 439 265 56 380 54
Total 3,161 50 490 282 60 2037 64
* Excluding candidates whose status were ‘denied standing’ or ‘no standing’. The ‘denied standing’ and
‘no standing’ status are included in Tables 6, 7 and 8 as these tables did not report performance statistics.
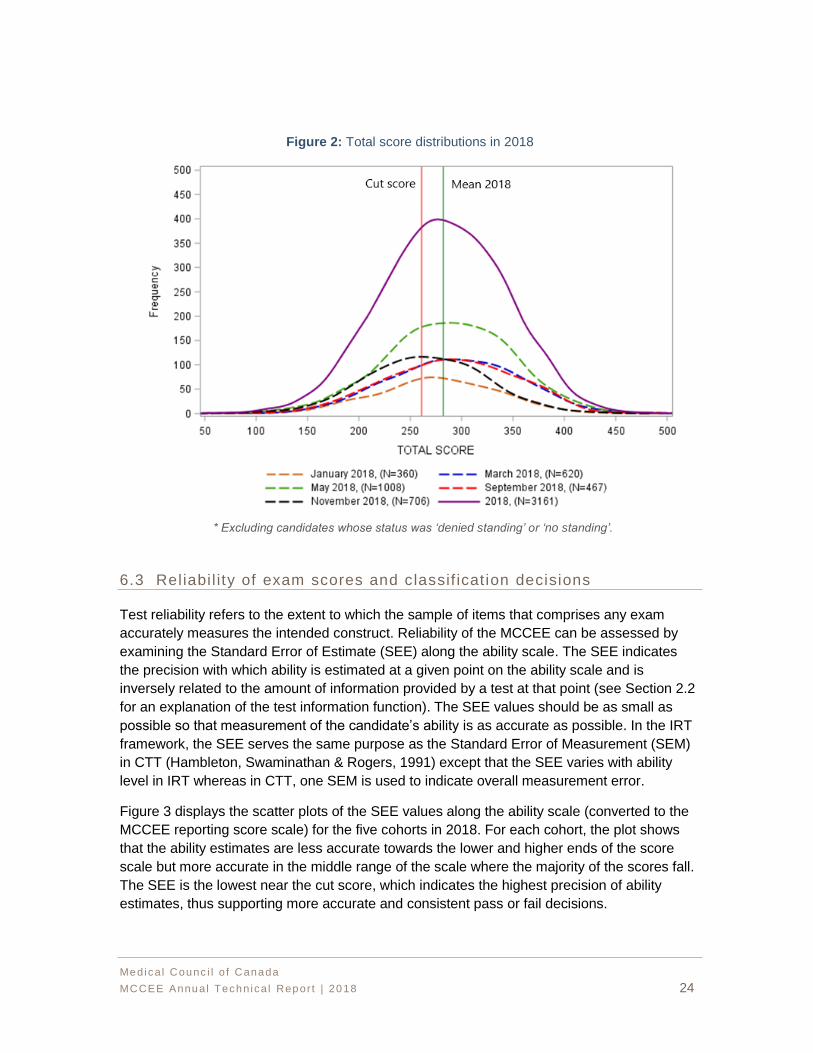
Figure 2 displays the total score distributions on the reporting score scale for each cohort as
well as for all candidates in 2018. The red vertical line represents the cut score and the green
vertical line, the average performance in 2018.
Medica l Counc i l o f Canada
MCCEE Annual Techn ica l Repor t | 2018 24
Figure 2: Total score distributions in 2018
* Excluding candidates whose status was ‘denied standing’ or ‘no standing’.
6.3 Reliabi l ity of exam scores and classif icat ion decisions
Test reliability refers to the extent to which the sample of items that comprises any exam
accurately measures the intended construct. Reliability of the MCCEE can be assessed by
examining the Standard Error of Estimate (SEE) along the ability scale. The SEE indicates
the precision with which ability is estimated at a given point on the ability scale and is
inversely related to the amount of information provided by a test at that point (see Section 2.2
for an explanation of the test information function). The SEE values should be as small as
possible so that measurement of the candidate’s ability is as accurate as possible. In the IRT
framework, the SEE serves the same purpose as the Standard Error of Measurement (SEM)
in CTT (Hambleton, Swaminathan & Rogers, 1991) except that the SEE varies with ability
level in IRT whereas in CTT, one SEM is used to indicate overall measurement error.
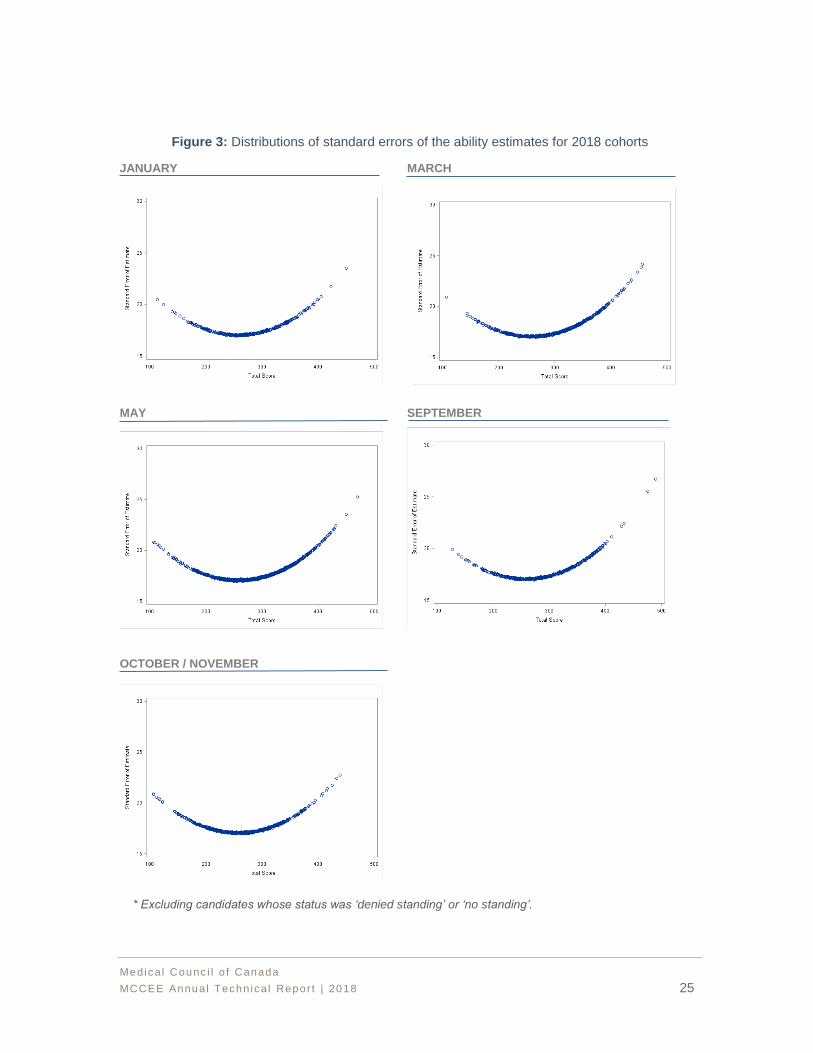
Figure 3 displays the scatter plots of the SEE values along the ability scale (converted to the
MCCEE reporting score scale) for the five cohorts in 2018. For each cohort, the plot shows
that the ability estimates are less accurate towards the lower and higher ends of the score
scale but more accurate in the middle range of the scale where the majority of the scores fall.
The SEE is the lowest near the cut score, which indicates the highest precision of ability
estimates, thus supporting more accurate and consistent pass or fail decisions.
Medica l Counc i l o f Canada
MCCEE Annual Techn ica l Repor t | 2018 25
Figure 3: Distributions of standard errors of the ability estimates for 2018 cohorts
JANUARY MARCH
MAY SEPTEMBER
OCTOBER / NOVEMBER
* Excluding candidates whose status was ‘denied standing’ or ‘no standing’.
Medica l Counc i l o f Canada
MCCEE Annual Techn ica l Repor t | 2018 26
A critical concern for a high-stakes exam such as the MCCEE is the pass or fail decision.
Reliability of the MCCEE can also be assessed by examining the consistency and accuracy of
pass or fail decisions based on exam scores. Decision consistency and decision accuracy
can be estimated using the Livingston and Lewis (1995) procedure, which is used in many
high-stakes testing programs. Decision consistency is an estimate of the agreement between
the pass or fail classifications on potential parallel forms of the exam. Decision accuracy is an
estimate of the agreement between the pass or fail classifications based on observed exam
scores and those that would be based on their true score (expected average score if the
candidate could be tested an infinite number of times).
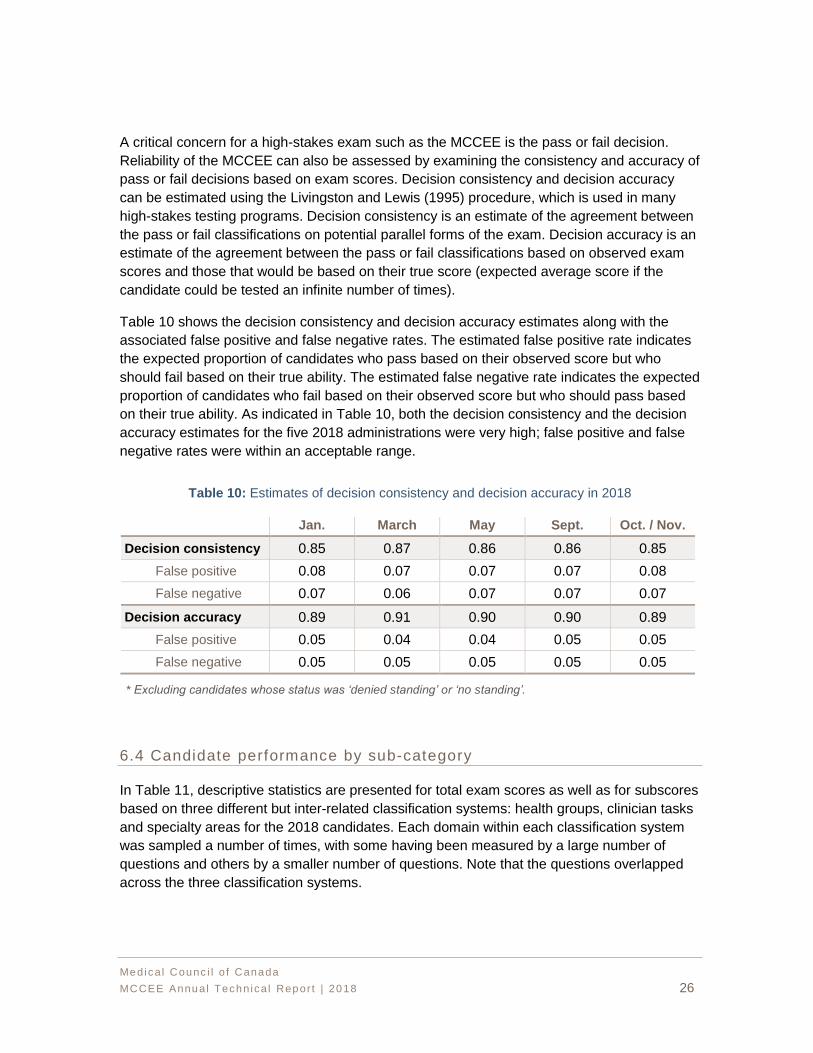
Table 10 shows the decision consistency and decision accuracy estimates along with the
associated false positive and false negative rates. The estimated false positive rate indicates
the expected proportion of candidates who pass based on their observed score but who
should fail based on their true ability. The estimated false negative rate indicates the expected
proportion of candidates who fail based on their observed score but who should pass based
on their true ability. As indicated in Table 10, both the decision consistency and the decision
accuracy estimates for the five 2018 administrations were very high; false positive and false
negative rates were within an acceptable range.
Table 10: Estimates of decision consistency and decision accuracy in 2018
Jan. March May Sept. Oct. / Nov.
Decision consistency 0.85 0.87 0.86 0.86 0.85
False positive 0.08 0.07 0.07 0.07 0.08
False negative 0.07 0.06 0.07 0.07 0.07
Decision accuracy 0.89 0.91 0.90 0.90 0.89
False positive 0.05 0.04 0.04 0.05 0.05
False negative 0.05 0.05 0.05 0.05 0.05
* Excluding candidates whose status was ‘denied standing’ or ‘no standing’.
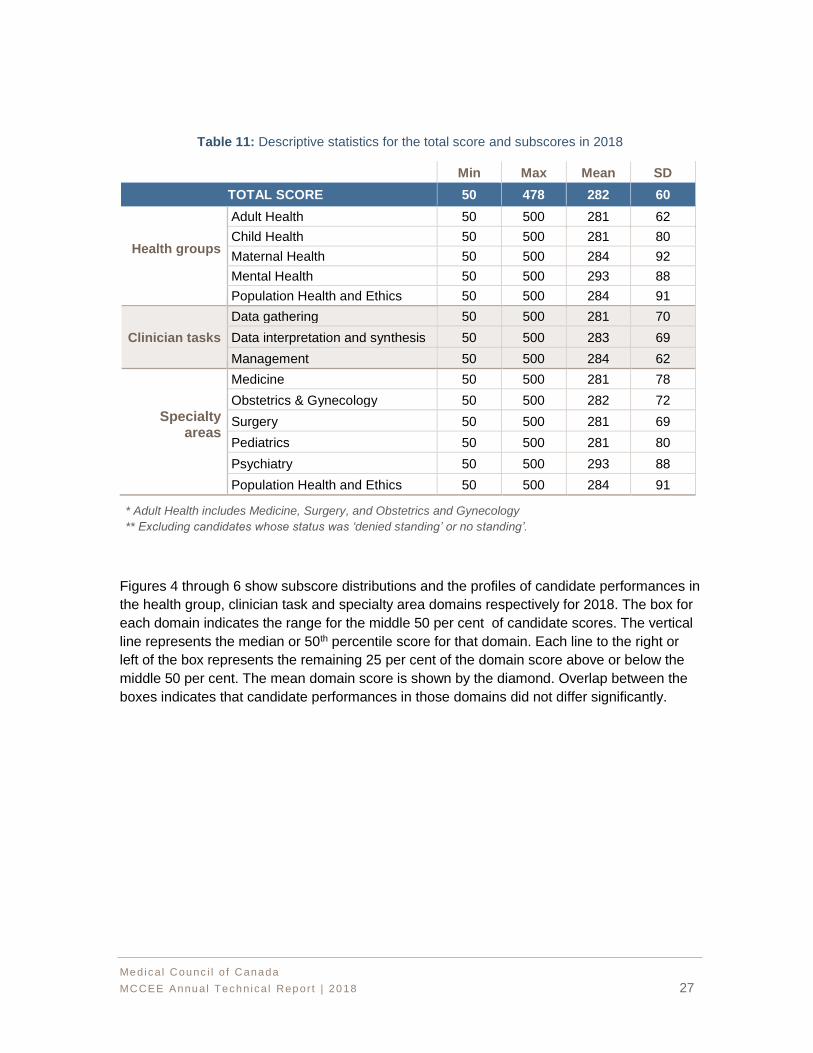
6.4 Candidate performance by sub-category
In Table 11, descriptive statistics are presented for total exam scores as well as for subscores
based on three different but inter-related classification systems: health groups, clinician tasks
and specialty areas for the 2018 candidates. Each domain within each classification system
was sampled a number of times, with some having been measured by a large number of
questions and others by a smaller number of questions. Note that the questions overlapped
across the three classification systems.
Medica l Counc i l o f Canada
MCCEE Annual Techn ica l Repor t | 2018 27
Table 11: Descriptive statistics for the total score and subscores in 2018
Min Max Mean SD
TOTAL SCORE 50 478 282 60
Health groups
Adult Health 50 500 281 62
Child Health 50 500 281 80
Maternal Health 50 500 284 92
Mental Health 50 500 293 88
Population Health and Ethics 50 500 284 91
Clinician tasks
Data gathering 50 500 281 70
Data interpretation and synthesis 50 500 283 69
Management 50 500 284 62
Specialty areas
Medicine 50 500 281 78
Obstetrics & Gynecology 50 500 282 72
Surgery 50 500 281 69
Pediatrics 50 500 281 80
Psychiatry 50 500 293 88
Population Health and Ethics 50 500 284 91
* Adult Health includes Medicine, Surgery, and Obstetrics and Gynecology
** Excluding candidates whose status was ‘denied standing’ or no standing’.
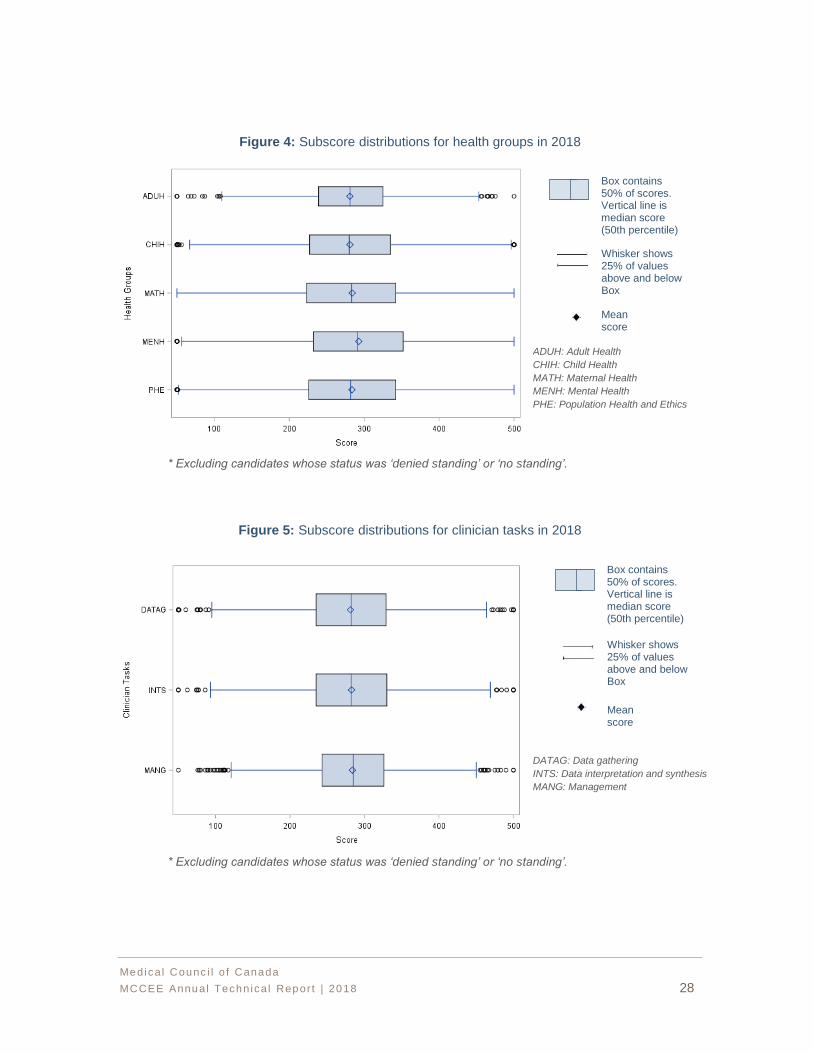
Figures 4 through 6 show subscore distributions and the profiles of candidate performances in
the health group, clinician task and specialty area domains respectively for 2018. The box for
each domain indicates the range for the middle 50 per cent of candidate scores. The vertical
line represents the median or 50th percentile score for that domain. Each line to the right or
left of the box represents the remaining 25 per cent of the domain score above or below the
middle 50 per cent. The mean domain score is shown by the diamond. Overlap between the
boxes indicates that candidate performances in those domains did not differ significantly.
Medica l Counc i l o f Canada
MCCEE Annual Techn ica l Repor t | 2018 28
Figure 4: Subscore distributions for health groups in 2018
* Excluding candidates whose status was ‘denied standing’ or ‘no standing’.
Figure 5: Subscore distributions for clinician tasks in 2018
* Excluding candidates whose status was ‘denied standing’ or ‘no standing’.
Box contains 50% of scores. Vertical line is median score (50th percentile)
Whisker shows 25% of values above and below Box
Mean score
Box contains 50% of scores. Vertical line is median score (50th percentile)
Whisker shows 25% of values above and below Box
Mean score
ADUH: Adult Health
CHIH: Child Health
MATH: Maternal Health
MENH: Mental Health
PHE: Population Health and Ethics
DATAG: Data gathering
INTS: Data interpretation and synthesis
MANG: Management
Medica l Counc i l o f Canada
MCCEE Annual Techn ica l Repor t | 2018 29
Figure 6: Subscore distributions for specialty areas in 2018
* Excluding candidates whose status was ‘denied standing’ or ‘no standing’.
6.5 Exam results by candidate group
Table 12 presents descriptive statistics and pass rates for each candidate group in 2018: first-
time test takers, repeat test takers, and candidates who took the exam in English or French.
Table 12: Descriptive statistics and pass rates in 2018 by candidate group
N Min. Max. Mean SD PASS
GROUP N % N %
All candidates 3,161 100 50 490 282 60 2,037 64
First-time test takers 2,609 83 50 490 290 60 1,839 70
Repeat test takers 552 17 87 392 244 41 198 36
English 3,043 96 50 490 284 60 1,990 65
French 118 4 119 357 242 49 47 40
* Excluding candidates whose status was ‘denied standing’ or ‘no standing’.
* Percentages do not total 100% due to rounding.
Box contains 50% of scores. Vertical line is median score (50th percentile)
Whisker shows 25% of values above and below Box
Mean score
MED: Medicine
PEDS: Pediatrics
PHE: Population Health and Ethics
PSYCH: Psychiatry
OBGYN: Obstetrics and Gynecology
SURG: Surgery
Medica l Counc i l o f Canada
MCCEE Annual Techn ica l Repor t | 2018 30
6.6 Comparison of prior exam performance
Table 13 presents pass rates of each cohort in 2018 and those of the previous years.
A pass score of 250 on the reporting scale (θ =-0.704 on the IRT ability scale) was applied
prior to May 2017. As of May 2017, a pass score of 261 on the reporting scale (θ =-0.490)
was applied. It should be noted that in the summer of 2016, the item bank was re-calibrated
using first-time takers only. Starting in May 2017, the new IRT parameters have been applied
to the scoring of MCCEE candidate performance following the recalibration of the items in the
MCCEE item bank.
Table 13: Pass rates of each 2018 administration and the previous four years
Year Administration N Overall Pass
Rate (%) First-Time Taker
Pass Rate (%)
2018 January 360 62 69
March 620 71 76
May 1,008 67 72
September 467 69 74
November 706 54 60
TOTAL 3,161 64 70
2017 January 342 69 78
March 1,188 82 86
May 757 59 68
September 384 58 68
November 606 63 72
TOTAL 3,277 69 77
2016 January 393 70 76
March 1243 82 85
May 826 66 73
September 409 67 73
November 562 66 73
TOTAL 3,433* 72 78
2015 January 436 66 72
March 1,259 80 85
May 992 63 70
September 493 71 80
November 631 63 69
TOTAL 3,811 70 77
2014 January 379 64 70
March 1,168 78 83
May 1,072 67 74
September 529 68 74
November 689 65 72
TOTAL 3,837 70 76
* Excluding candidates whose status was ‘denied standing’ or ‘no standing’.
Medica l Counc i l o f Canada
MCCEE Annual Techn ica l Repor t | 2018 31
6.7 Item exposure analysis
As mentioned in Section 5.3, the items in each exam form for each candidate were selected
based on item exposure control parameters that reflected how well an item met exam
specifications and the psychometric target. As items in an exam form were delivered through
randomization and optimization procedures, some items may have been more highly exposed
than others. The MCC monitored each administration for item exposure and addressed the
issue together with Prometric.
Table 14 presents the items for the five administrations in 2018.
Table 14: Item exposure in 2018
Administration Overexposed Underexposed Unexposed Number of candidates
Jan. (Pool 8) 0 89 210 360
March (Pool 8) 0 120 178 621
May (Pool 8) 0 174 123 1,011
Sept. (Pool 8) 0 92 205 467
Nov. (Pool 8) 0 129 165 706
6.8 Candidate survey
At the end of the exam, every candidate was invited to complete a survey on the exam
experience. The MCC monitored candidate feedback and used it for quality improvement
purposes both internally, and with the vendor, Prometric. Table 15 represents 2,312
candidates who responded to the survey in 2018. The percentage in brackets represent
survey data from 2017.
Table 15: Candidate Survey Results (2018)
Q 1. How satisfied are you with the staff's helpfulness at this centre?
A – Very Satisfied B – Satisfied C – Dissatisfied NR1
70% (72%) 28% (27%) 2% (1%) 840
Q 2. How satisfied were you with the performance of the testing system during your examination?
A – Very Satisfied B – Satisfied C – Dissatisfied NR1
50% (51%) 46% (44%) 5% (5%) 839
Medica l Counc i l o f Canada
MCCEE Annual Techn ica l Repor t | 2018 32
Q 3. How satisfied are you with the total experience of taking your examination at this
Prometric testing centre?
A – Very Satisfied B – Satisfied C – Dissatisfied NR1
49% (52%) 47% (45%) 4% (3%) 839
Q 4. Overall, how would you rate the format of the examination (including such factors as screen layout, and ease of use)?
A – Very Satisfied B – Satisfied C – Dissatisfied NR1
34% (40%) 49% (54%) 18 (6%) 890
Q 5. How would you rate the time allotted to complete the examination?
A – Far too little
B – Too little time
C – About the correct amount of time
D – Time to spare
E – Much time to spare
NR1
5% (4%) 20% (24%) 56% (62%) 16% (8%) 3% (2%) 815
Q 6. How would you rate the quality of the images presented with the questions?
A – Very Satisfied B – Satisfied C – Dissatisfied NR1
38% (39%) 51% (50%) 11% (11%) 861
Q 7. How would you rate the clarity of the instructions you were provided on completing this examination?
A – Very Satisfied B – Satisfied C – Dissatisfied NR1
44% (53%) 52% (45%) 4% (2%) 874
Q 8. How would you rate this examination as an appropriate test of your medical knowledge?
A – Very Satisfied B – Satisfied C – Dissatisfied NR1
25% (19%) 59% (62%) 15% (18%) 869
1 NR refers to the number of surveys without a response to that question. The percentage represents the
calculated average of the four sessions with rounding, therefore, some may not total 100.
Medica l Counc i l o f Canada
MCCEE Annual Techn ica l Repor t | 2018 33
REFERENCES
American Educational Research Association, American Psychological Association, & National
Council on Measurement in Education. (2014). Standards for educational and
psychological testing. Washington, DC: American Educational Research Association.
Downing, S.M. & Haladyna, T.M. (2006). Handbook of test development. Lawrence Erlbaum
Associates.
Hambleton, R., Swaminathan, H., & Rogers, J. (1991). Fundamentals of item response
theory. Newbury Park, CA: Sage Publications Inc.
Kang, T. & Peterson, N. S. (2009). Linking Item Parameters to a Base Scale. ACT Research
Report Series 2009-2.
Kim, S. (2006). A comparative study of IRT fixed parameter calibration methods. Journal of
Educational Measurement, 43, 355-381.
Kim, J. (2007). A comparison of calibration methods and proficiency estimators for creating
IRT vertical scales. PhD (Doctor of Philosophy) thesis, University of Iowa, 2007.
Kolen, M. J., & Brennan, R. L., (2004). Test equating, scaling, and linking: methods and
practice. (2nd ed.) New York, NY: Springer.
Linn, R. L., (2006). The standards for educational and psychological testing: Guidance in test
development. In S.M. Downing & T.M. Haladyna (Eds.), Handbook of test
development (1st ed., pp. 27-38). Mahwah, NJ, US: Lawrence Erlbaum Associates
Publishers.
Livingston, S. A. & Lewis, C. (1995). Estimating the consistency and accuracy of classification
based on test scores. Journal of Educational Measurement, 32, 179-197.
Messick, S. (1989). Validity. In Educational Measurement (3rd ed., p. 610). Macmillan USA.
Zimowski, M., Muraki, E., Mislevy, R., & Bock, D. (1996). BILOG-MG3. SSI Inc.
Medica l Counc i l o f Canada
MCCEE Annual Techn ica l Repor t | 2018 34
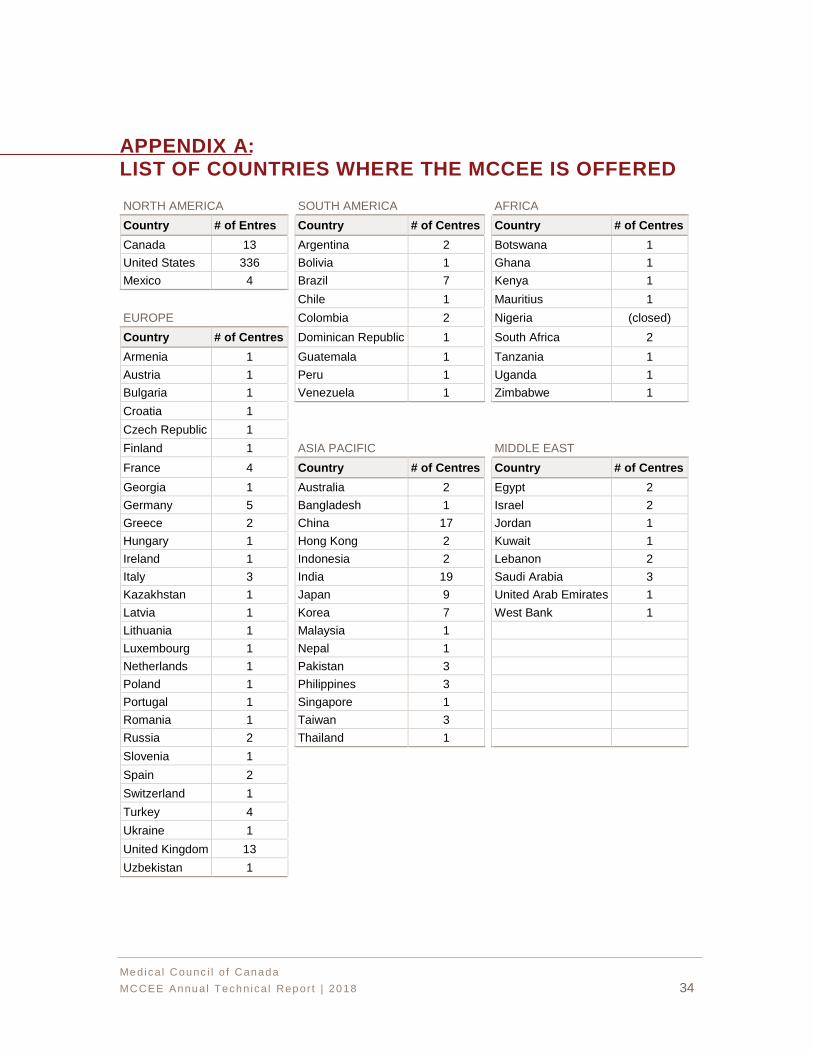
APPENDIX A: LIST OF COUNTRIES WHERE THE MCCEE IS OFFERED
NORTH AMERICA SOUTH AMERICA AFRICA
Country # of Entres Country # of Centres Country # of Centres
Canada 13 Argentina 2 Botswana 1
United States 336 Bolivia 1 Ghana 1
Mexico 4 Brazil 7 Kenya 1
Chile 1 Mauritius 1
EUROPE Colombia 2 Nigeria (closed)
Country # of Centres Dominican Republic 1 South Africa 2
Armenia 1 Guatemala 1 Tanzania 1
Austria 1 Peru 1 Uganda 1
Bulgaria 1 Venezuela 1 Zimbabwe 1
Croatia 1
Czech Republic 1
Finland 1 ASIA PACIFIC MIDDLE EAST
France 4 Country # of Centres Country # of Centres
Georgia 1 Australia 2 Egypt 2
Germany 5 Bangladesh 1 Israel 2
Greece 2 China 17 Jordan 1
Hungary 1 Hong Kong 2 Kuwait 1
Ireland 1 Indonesia 2 Lebanon 2
Italy 3 India 19 Saudi Arabia 3
Kazakhstan 1 Japan 9 United Arab Emirates 1
Latvia 1 Korea 7 West Bank 1
Lithuania 1 Malaysia 1
Luxembourg 1 Nepal 1
Netherlands 1 Pakistan 3
Poland 1 Philippines 3
Portugal 1 Singapore 1
Romania 1 Taiwan 3
Russia 2 Thailand 1
Slovenia 1
Spain 2
Switzerland 1
Turkey 4
Ukraine 1
United Kingdom 13
Uzbekistan 1
Medica l Counc i l o f Canada
MCCEE Annual Techn ica l Repor t | 2018 35
APPENDIX B: STATEMENT OF RESULTS (SOR) EXAMPLE
Medica l Counc i l o f Canada
MCCEE Annual Techn ica l Repor t | 2018 36
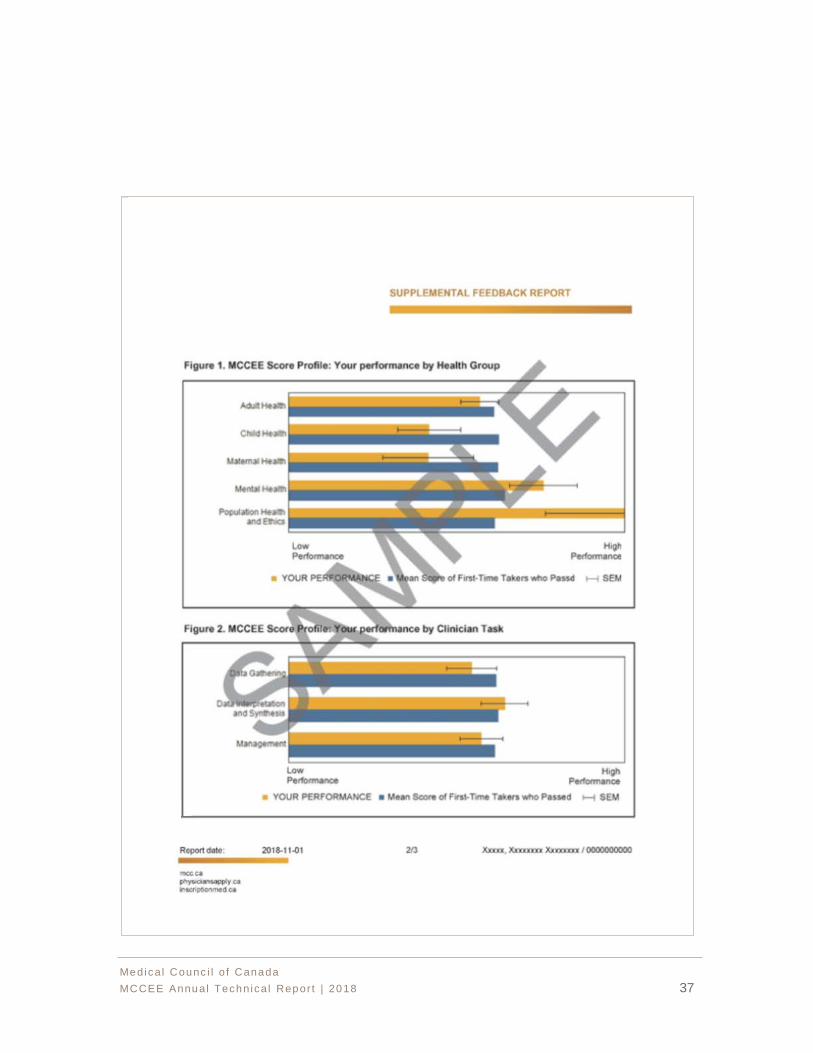
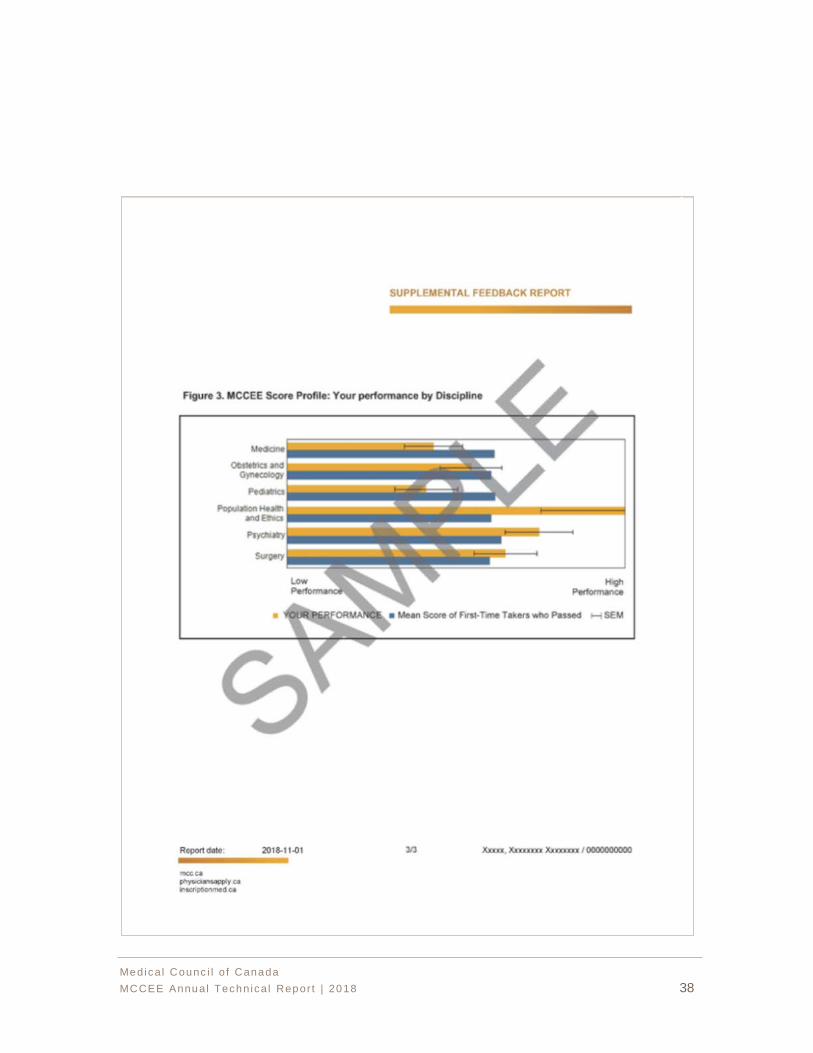
APPENDIX C: SUPPLEMENTAL FEEDBACK REPORT (SFR) EXAMPLE
Medica l Counc i l o f Canada
MCCEE Annual Techn ica l Repor t | 2018 37
Medica l Counc i l o f Canada
MCCEE Annual Techn ica l Repor t | 2018 38


