24
Medical hyperspectral imaging: a review Guolan Lu Baowei Fei Downloaded From: http://biomedicaloptics.spiedigitallibrary.org/ on 01/13/2015 Terms of Use: http://spiedl.org/terms

Medical hyperspectral imaging: areview
Guolan LuBaowei Fei
Downloaded From: http://biomedicaloptics.spiedigitallibrary.org/ on 01/13/2015 Terms of Use: http://spiedl.org/terms
Medical hyperspectral imaging: a review
Guolan Lua and Baowei Feia,b,c,d,*aEmory University and Georgia Institute of Technology, The Wallace H. Coulter Department of Biomedical Engineering, Atlanta, Georgia 30322bEmory University, School of Medicine, Department of Radiology and Imaging Sciences, Atlanta, Georgia 30329cEmory University, Department of Mathematics & Computer Science, Atlanta, Georgia 30322dEmory University, Winship Cancer Institute, Atlanta, Georgia 30322
Abstract. Hyperspectral imaging (HSI) is an emerging imaging modality for medical applications, especially indisease diagnosis and image-guided surgery. HSI acquires a three-dimensional dataset called hypercube, withtwo spatial dimensions and one spectral dimension. Spatially resolved spectral imaging obtained by HSI pro-vides diagnostic information about the tissue physiology, morphology, and composition. This review paperpresents an overview of the literature on medical hyperspectral imaging technology and its applications.The aim of the survey is threefold: an introduction for those new to the field, an overview for those workingin the field, and a reference for those searching for literature on a specific application. © The Authors. Published by
SPIE under a Creative Commons Attribution 3.0 Unported License. Distribution or reproduction of this work in whole or in part requires full attribution
of the original publication, including its DOI. [DOI: 10.1117/1.JBO.19.1.010901]
Keywords: medical hyperspectral imaging; tissue optics; quantitative imaging; image analysis and classification; cancer detection anddiagnosis; image-guided surgery.
Paper 130356VRR received May 21, 2013; revised manuscript received Dec. 6, 2013; accepted for publication Dec. 13, 2013; pub-lished online Jan. 20, 2014.
1 IntroductionHyperspectral imaging (HSI), also called imaging spectrom-eter,1 originated from remote sensing and has been exploredfor various applications by NASA.2 With the advantage ofacquiring two-dimensional images across a wide range ofelectromagnetic spectrum, HSI has been applied to numerousareas, including archaeology and art conservation,3,4 vegetationand water resource control,5,6 food quality and safety control,7,8
forensic medicine,9,10 crime scene detection,11,12 biomedi-cine,13,14 etc.
As an emerging imaging modality for medical applications,HSI offers great potential for noninvasive disease diagnosis andsurgical guidance. Light delivered to biological tissue undergoesmultiple scattering from inhomogeneity of biological structuresand absorption primarily in hemoglobin, melanin, and wateras it propagates through the tissue.15,16 It is assumed that theabsorption, fluorescence, and scattering characteristics of tissuechange during the progression of disease.17 Therefore, thereflected, fluorescent, and transmitted light from tissue capturedby HSI carries quantitative diagnostic information about tissuepathology.17–20 In recent years, advances in hyperspectral cam-eras, image analysis methods, and computational power make itpossible for many exciting applications in the medical field.
In the following, we aim to introduce and explain medicalhyperspectral imaging (MHSI) technology and to give an over-view of the literature on MHSI hardware, software, and appli-cations. This survey covers literature from fall 1988 to spring2013. We start at the basics with the mechanisms of HSI andits current development status. We then classify MHSI basedon its acquisition mode, spectral range and spatial resolution,measurement mode, dispersive devices, detector arrays, andcombination with other techniques. Image analysis methodsfor MHSI are summarized with an emphasis on preprocessing,
feature extraction and selection, and classification methods.The section on applications refers to the available literature ondisease diagnosis and surgery guidance. These applicationsmainly cover the ultraviolet (UV), visible (VIS), and near-infra-red (near-IR or NIR) regions. Interested readers can refer toother review papers for more applications in mid-infrared(mid-IR or MIR) regions.21,22 Finally, we conclude with a dis-cussion on the achievements of the past years and some futurechallenges.
2 Tissue OpticsThe propagation of light within tissue is a significant problem inmedical applications and in the development of diagnostic meth-ods. Therefore, this section is dedicated to a brief review of thelight tissue interaction mechanisms, optical processes involvedin HSI, and useful diagnostic information provided by HSI.
Light entering biological tissue undergoes multiple scatteringand absorption events as it propagates across the tissue.23
Biological tissues are heterogeneous in composition with spatialvariations in optical properties.24 Scattering occurs where thereis a spatial variation in the refractive index.24 In cellular media,the important scatters are the subcellular organelles, with theirsize running from <100 nm to 6 μm. For example, mitochondriaare the dominant scatterers among the organelles. The structureof a lipid membrane and lipid folds running inside gives mito-chondria a high optical contrast to the surrounding cytoplasmand produces the observed strong scattering effects. Theshape and size of the cells vary among different tissue typeswith dimensions of a few microns and larger.24 The scatteringproperties of support tissues composed of cells and extracellularproteins (elastin and collagen, etc.) are caused by the small-scaleinhomogeneities and the large-scale variations in the structuresthey form.
The penetration depth of light into biological tissues dependson how strongly the tissue absorbs light. Most tissues are suffi-ciently weak absorbers to permit significant light penetration*Address all correspondence to: Baowei Fei, E-mail: [email protected]
Journal of Biomedical Optics 010901-1 January 2014 • Vol. 19(1)
Journal of Biomedical Optics 19(1), 010901 (January 2014) REVIEW
Downloaded From: http://biomedicaloptics.spiedigitallibrary.org/ on 01/13/2015 Terms of Use: http://spiedl.org/terms
within the therapeutic window, ranging from 600 to 1300 nm.24
Within the therapeutic window, scattering is over absorption, sothe propagating light becomes diffuse. Tissue absorption is afunction of molecular composition. Molecules absorb photonswhen the photons’ energy matches an interval between internalenergy states, and the transition between quantum states obeysthe selection rules for the species. During absorption processing,transitions between two energy levels of a molecule that arewell defined at specific wavelengths could serve as a spectralfingerprint of the molecule for diagnostic purposes.24,25 Forexample, absorption spectra characterize the concentrationand oxygen saturation of hemoglobin, which reveals two hall-marks of cancer: angiogenesis and hypermetabolism.16 Tissuecomponents absorbing light are called chromophores. Someof the most important chromophores for visible wavelengthsare blood and melanin, of which the absorption coefficientdecreases monotonically with the increasing wavelength. Theprimary absorbers for UV wavelengths are protein and aminoacids, while the important absorbing chromophore for IR wave-lengths is water.26
Light absorbed by tissue constituents is either converted toheat or radiated in the form of luminescence, including fluores-cence and phosphorescence.18,24,27 Fluorescence that originatesfrom endogenous fluorescent chromophores is also called auto-fluorescence. Incident light, typically in the UV or VIS region,excites the tissue molecules and induces fluorescence emission.The majority of the endogenous fluorophores are associatedwith the structural matrix of tissue or with various cellular met-abolic pathways.24,28 The most common fluorophores in thestructural matrix are collagen and elastin, while the predominantfluorophores involved in cellular metabolism are the nicotin-amide adenine dinucleotide (NADH), flavin adenine dinucleo-tide (FAD), and lipopigments.29 These intrinsic fluorophoresexhibit different strengths and cover spectral ranges in theUV and VIS regions. For example, fluorescence from collagenor elastin using excitation between 300 and 400 nm shows broademission bands between 400 and 600 nm, which can be used todistinguish various types of tissues, e.g., epithelial and connec-tive tissue.30 Cells in different disease states often have differentstructures or undergo different rates of metabolism, which resultin different fluorescence emission spectra. Therefore, fluores-cence imaging makes it possible to investigate tissues for diag-nosis of diseases in real time without administrating exogenousfluorescent agents.24 Various exogenous fluorophores have alsobeen created and studied for biological diagnostics using HSI,29
but this review will mainly discuss the intrinsic fluorescence.
Incident light can be directly reflected on the surface of thetissue or be scattered due to random spatial variations in tissuedensity (membranes, nuclei, etc.) and then be remitted to thetissue surface.27 Light becomes randomized in direction dueto multiple scattering, and this is known as diffuse reflectance,which provides information about scattering and absorbingcomponents deep within the tissue.31 The measured reflectancesignal represents light that has sampled a variety of sampl-ing depths within the tissue and is, therefore, an averagemeasure of the properties over a certain volume of tissue.31
Knowledge of the origin of the scattering and absorption signalswould facilitate accurate modeling and interpretation of thereflectance data. The reflectance signal measured from epithelialtissue is determined by the structural and biochemical propertiesof the tissue; therefore, changes in optical properties can beused to noninvasively probe the tissue microenvironment.31
Alterations in tissue morphology, including hyperplasia, nuclearcrowding, degradation of collagen in the extracellular matrix bymatrix metalloproteinases, and increased nuclear/cytoplasmicratio, which are associated with disease progression, can affectthe scattering signals. As diseases progress, hemoglobin absorp-tion may be affected by angiogenesis and tissue hypoxia, etc.Therefore, changes in the disease states should lead to corre-sponding changes in the patterns of light reflected from thetissue.
Reflectance imaging can detect local changes in scatteringand absorption properties of tissue, and fluorescence imagingcan probe changes in the biochemical composition of tissueby revealing levels of endogenous fluorophores.32 MultimodalHSI combining reflectance and fluorescence has been investi-gated for cancer diagnosis.19,33 Furthermore, the HSI systemcan be adapted to other existing techniques, such as microscopeand colposcope, to provide complementary information ina more accurate and reliable manner. Transmission HSI micro-scope is one example of these combinatory technologies and hasbeen used in tissue pathology.
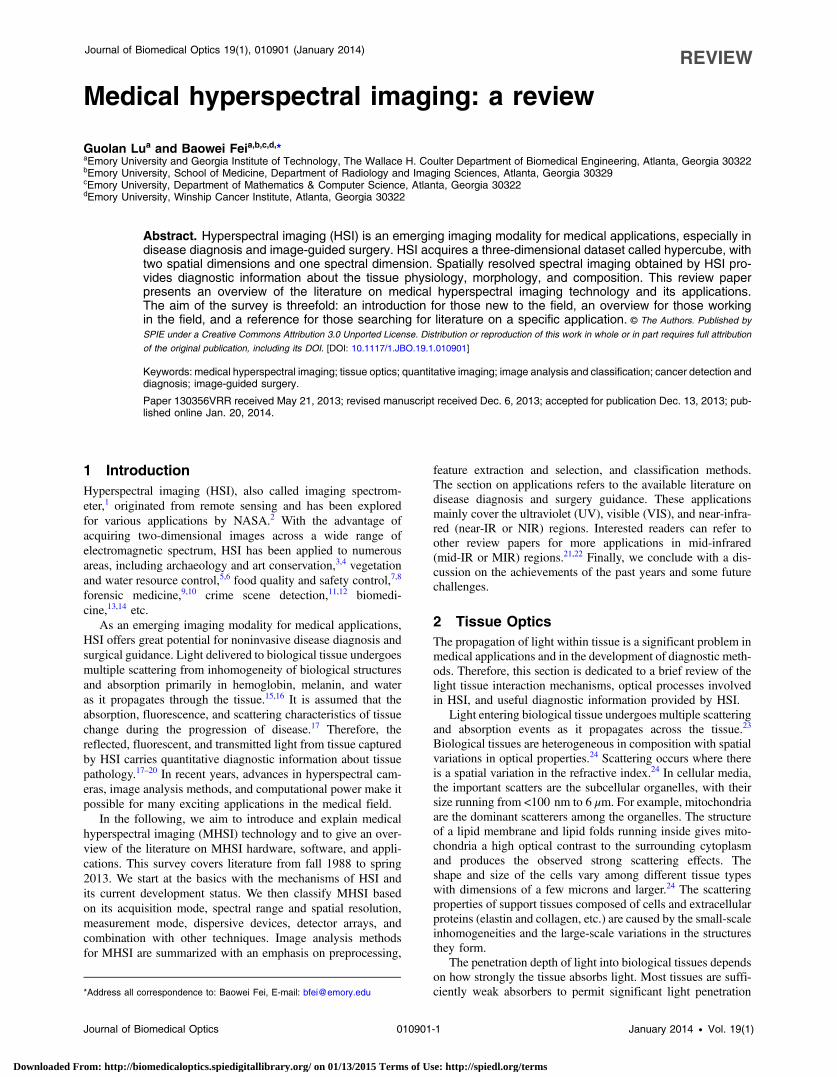
3 Hardware and SystemsHSI is a hybrid modality that combines imaging and spectros-copy. By collecting spectral information at each pixel of atwo-dimensional (2-D) detector array, HSI generates a three-dimensional (3-D) dataset of spatial and spectral information,known as hypercube (shown in Fig. 1). With spatial information,the source of each spectrum on samples can be located, whichmakes it possible to probe more completely the light interactionswith pathology. The spectral signature of each pixel in the
Fig. 1 Comparison between hypercube and RGB image. Hypercube is three-dimensional dataset of atwo-dimensional image on each wavelength. The lower left is the reflectance curve (spectral signature) ofa pixel in the image. RGB color image only has three image bands on red, green, and blue wavelengthsrespectively. The lower right is the intensity curve of a pixel in the RGB image.
Journal of Biomedical Optics 010901-2 January 2014 • Vol. 19(1)
Lu and Fei: Medical hyperspectral imaging: a review
Downloaded From: http://biomedicaloptics.spiedigitallibrary.org/ on 01/13/2015 Terms of Use: http://spiedl.org/terms

images enables HSI to identify various pathological conditions.HSI generally covers a contiguous portion of the light spectrumwith more spectral bands (up to a few hundreds) and higherspectral resolution than multispectral imaging (such as RGBcolor cameras). Therefore, HSI has the potential to capturethe subtle spectral differences under different pathologicalconditions, while multispectral imaging may miss significantspectral information for diagnostics. The difference betweena hypercube and an RGB color image is illustrated in Fig. 1.Among all the MHSI systems investigated in the literature,the majority of the systems are prototypes consisting of theoff-the-shelf components, rather than commercialized systems.
An HSI system is mainly composed of the light source,wavelength dispersion devices, and area detectors. To illustratethe mechanisms of the HSI system, the principle of a typicalpushbroom HSI system is shown in Fig. 2 as an example. Atissue sample illuminated by the light source is projectedthrough a front lens into an entrance slit, which only passeslight from a narrow line. After collimation, a dispersive device(such as a prism, grating, etc.) splits the light into a series ofnarrow spectral bands that are then focused onto a detectorarray. Slit width controls the amount of light entering thespectrograph. In this way, for each pixel interval along theline defined by the slit, a corresponding spectrum is projectedon a column of the detector array. Thus, each line of the targetedarea on a tissue sample is projected as a 2-D image onto thedetector, with one spatial dimension and one spectral dimension.By scanning over the tissue specimen or moving the cameraacross the tissue sample in a pushbroom or line-scanning fash-ion, an HSI camera collects 2-D images for adjacent lines, cre-ating a hypercube with two spatial dimensions and one spectraldimension.
3.1 Medical Hyperspectral Imaging Systems
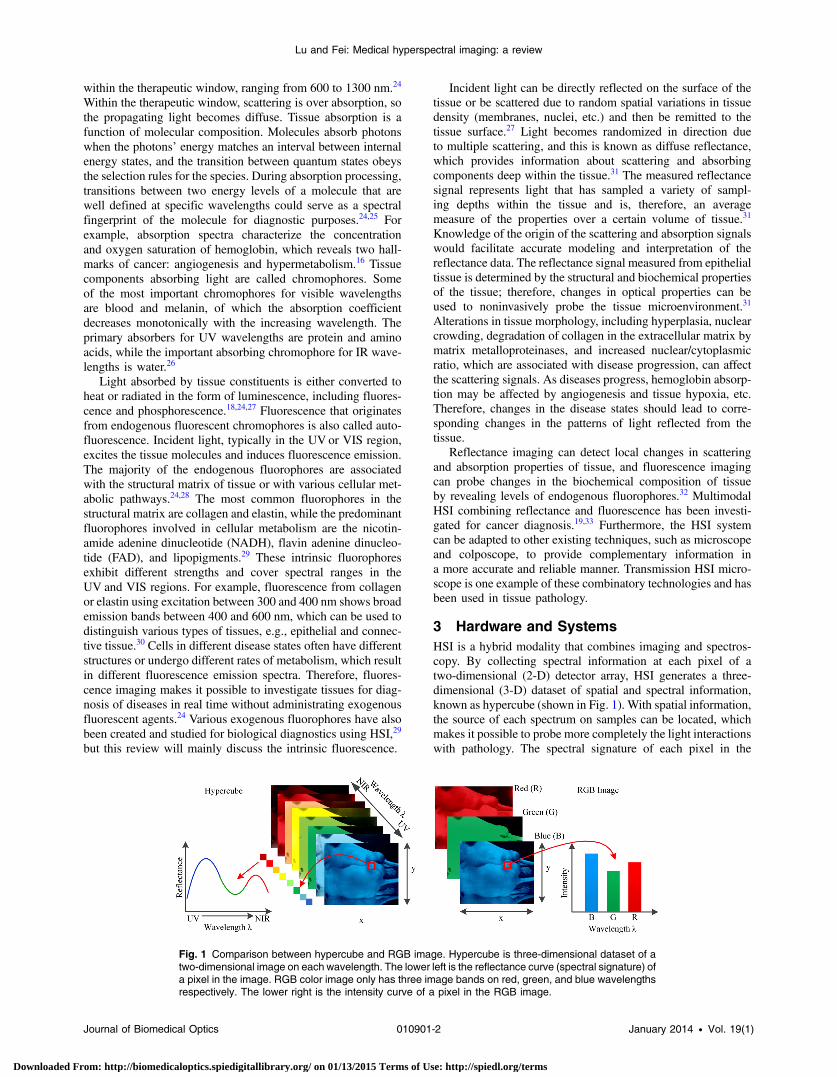
There are many different ways of classifying HSI systems, suchas by image acquisition mode, spectral ranges and spectralresolution, measurement mode, the type of dispersive devices,the type of detector arrays. These classification methods will bediscussed in Secs. 3.1.1–3.1.5. Table 1 summarizes the represen-tative HSI systems and their medical applications.
3.1.1 Acquisition mode
The fundamental classification scheme of HSI systems is basedon the acquisition mode, i.e., how spectral and spatial informa-tion is acquired.61 The conventional HSI system involves two
scanning methods: spatial scanning and spectral scanning.Spatial scanning methods generate hyperspectral images byacquiring a complete spectrum for each pixel in the case ofwhiskbroom (point-scanning) instruments or line of pixels inpushbroom (line-scanning) instruments, and then spatiallyscanning through the scene. Spectral scanning methods, alsocalled staring or area-scanning imaging, involves capturingthe whole scene with 2-D detector arrays in a single exposureand then stepping through wavelengths to complete the datacube. Spectral scanning approaches usually store images inband-sequential format, which compromises performancebetween spatial and spectral information, while spatial scanningstores images either in the form of band interleaved by pixel orband interleaved by line, both of which perform well in spatialand spectral analysis. Whiskbroom and pushbroom HSI do notprovide live display of spectral images, which is calculated fromthe spectra after the completion of the spatial scanning of thecorresponding area. Staring HSI scanning through wavelengthto build the hypercube has the advantage of displaying live spec-tral images, which is essential for aiming and focusing.17 Staringimaging is suitable for stationary applications, such as samplesunder hyperspectral microscope. Pushbroom and staring imag-ing modes are two of the most frequently used methods in theliterature.
Fourier transform infrared imaging (FTIR) is another type ofHSI system combining a Fourier transform spectrometer anda focal plane array (FPA).62,63 FTIR collects a series of imagesas a function of interferometer optical path difference, and thespectral images are then transformed to frequency domain asthe final hypercube by fast Fourier transform. In this way,FTIR spectra are recorded for every spatial location in theimage plane in parallel.62 The formation of the signal and propa-gation of noise from detector array data collection to the finalhyperspectral data cube is significantly different from whiskb-room and pushbroom HSI.63 In the literature, mid-wavelengthinfrared HSI used in medical domain are all FTIR.36,60,62–73
These serial acquisition systems can only collect a fraction ofthe full data cube at a single instant in time and must trade offcritical imaging parameters, such as speed, image size, resolu-tion, and/or signal-to-noise ratio.49 Therefore, various new HSItechniques have been developed to overcome these problems.Bernhardt utilized an HSI system with rotational spectrotomog-raphy to detect all available photons from an object whileobtaining enough information to reconstruct the data cube.74
Johnson et al.44 used a computed tomographic imaging spec-trometer (CTIS) to capture both spatial and spectral informationin a single frame without moving parts or narrow-band (NB)
Fig. 2 Schematic diagram of a pushbroom hyperspectral imaging system.
Journal of Biomedical Optics 010901-3 January 2014 • Vol. 19(1)
Lu and Fei: Medical hyperspectral imaging: a review
Downloaded From: http://biomedicaloptics.spiedigitallibrary.org/ on 01/13/2015 Terms of Use: http://spiedl.org/terms
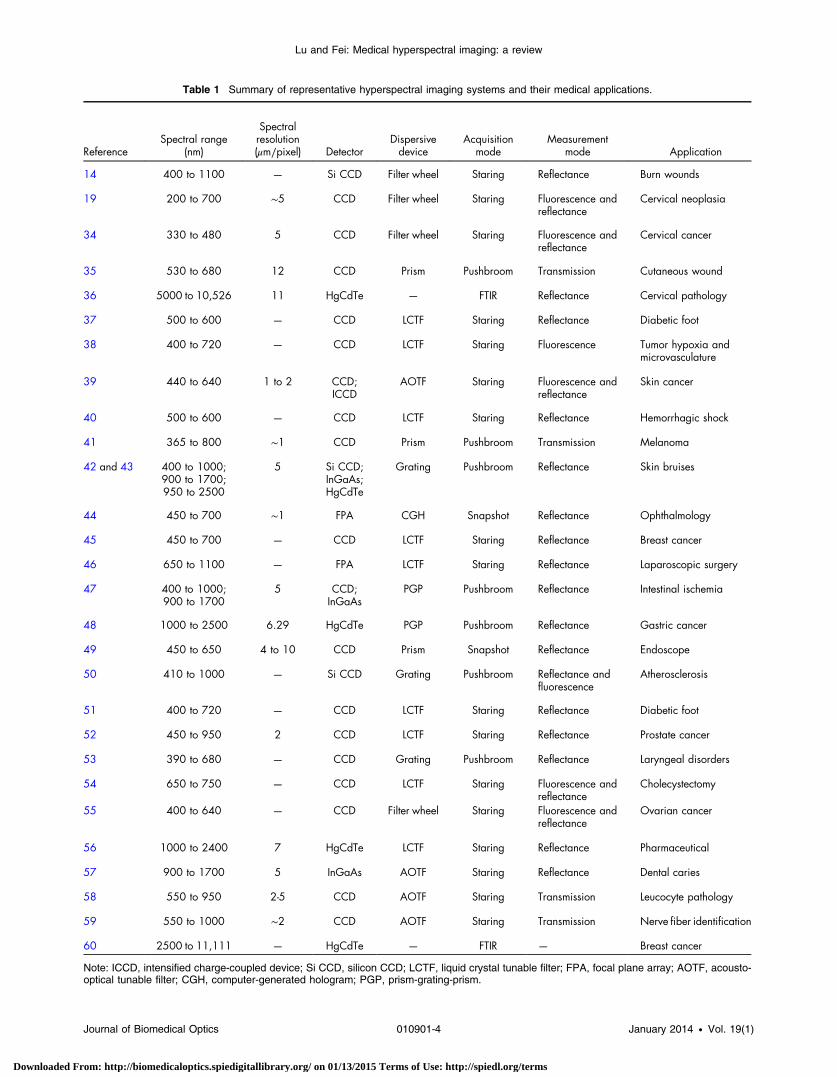
Table 1 Summary of representative hyperspectral imaging systems and their medical applications.
ReferenceSpectral range
(nm)
Spectralresolution(μm∕pixel) Detector
Dispersivedevice
Acquisitionmode
Measurementmode Application
14 400 to 1100 — Si CCD Filter wheel Staring Reflectance Burn wounds
19 200 to 700 ∼5 CCD Filter wheel Staring Fluorescence andreflectance
Cervical neoplasia
34 330 to 480 5 CCD Filter wheel Staring Fluorescence andreflectance
Cervical cancer
35 530 to 680 12 CCD Prism Pushbroom Transmission Cutaneous wound
36 5000 to 10,526 11 HgCdTe — FTIR Reflectance Cervical pathology
37 500 to 600 — CCD LCTF Staring Reflectance Diabetic foot
38 400 to 720 — CCD LCTF Staring Fluorescence Tumor hypoxia andmicrovasculature
39 440 to 640 1 to 2 CCD;ICCD
AOTF Staring Fluorescence andreflectance
Skin cancer
40 500 to 600 — CCD LCTF Staring Reflectance Hemorrhagic shock
41 365 to 800 ∼1 CCD Prism Pushbroom Transmission Melanoma
42 and 43 400 to 1000;900 to 1700;950 to 2500
5 Si CCD;InGaAs;HgCdTe
Grating Pushbroom Reflectance Skin bruises
44 450 to 700 ∼1 FPA CGH Snapshot Reflectance Ophthalmology
45 450 to 700 — CCD LCTF Staring Reflectance Breast cancer
46 650 to 1100 — FPA LCTF Staring Reflectance Laparoscopic surgery
47 400 to 1000;900 to 1700
5 CCD;InGaAs
PGP Pushbroom Reflectance Intestinal ischemia
48 1000 to 2500 6.29 HgCdTe PGP Pushbroom Reflectance Gastric cancer
49 450 to 650 4 to 10 CCD Prism Snapshot Reflectance Endoscope
50 410 to 1000 — Si CCD Grating Pushbroom Reflectance andfluorescence
Atherosclerosis
51 400 to 720 — CCD LCTF Staring Reflectance Diabetic foot
52 450 to 950 2 CCD LCTF Staring Reflectance Prostate cancer
53 390 to 680 — CCD Grating Pushbroom Reflectance Laryngeal disorders
54 650 to 750 — CCD LCTF Staring Fluorescence andreflectance
Cholecystectomy
55 400 to 640 — CCD Filter wheel Staring Fluorescence andreflectance
Ovarian cancer
56 1000 to 2400 7 HgCdTe LCTF Staring Reflectance Pharmaceutical
57 900 to 1700 5 InGaAs AOTF Staring Reflectance Dental caries
58 550 to 950 2-5 CCD AOTF Staring Transmission Leucocyte pathology
59 550 to 1000 ∼2 CCD AOTF Staring Transmission Nerve fiber identification
60 2500 to 11,111 — HgCdTe — FTIR — Breast cancer
Note: ICCD, intensified charge-coupled device; Si CCD, silicon CCD; LCTF, liquid crystal tunable filter; FPA, focal plane array; AOTF, acousto-optical tunable filter; CGH, computer-generated hologram; PGP, prism-grating-prism.
Journal of Biomedical Optics 010901-4 January 2014 • Vol. 19(1)
Lu and Fei: Medical hyperspectral imaging: a review
Downloaded From: http://biomedicaloptics.spiedigitallibrary.org/ on 01/13/2015 Terms of Use: http://spiedl.org/terms

filters, and with high optical throughput, which is well suited forhuman retina imaging with constantly moving eyes. Trade-offproblems between imaging acquisition rate and signal through-put in scanning-based techniques also lead to the developmentof image mapping spectroscopy (IMS),49,75–77 which capturesthe whole data cube in a single snapshot without compromisingimage resolution, speed, optical throughput, or intensive post-processing. The IMS is one of the first real-time, nonscanningtechniques capable of meeting the needs of out-of-the-labchemical imaging.77
3.1.2 Spectral range and spectral resolution
Spectral range refers to the wavelength regions covered by HSIsystems. MHSI systems can cover UV, VIS, NIR, and mid-IRspectral ranges based on different medical applications. Themost widely used spectral range in the literature falls in VISand NIR regions. NIR spectral imaging relies on overtoneand combination vibrational bands and low-energy electronictransitions in this region, while MIR imaging records theabsorbance of light at the vibrational and rotational frequenciesof the atoms within the molecule.22 The MIR absorbance spec-trum contains rich information about the genomics, proteomics,and metabolomics of a cell. However, water absorbs mid-IRlight strongly and masks vibrational absorption of other impor-tant molecules, such as proteins, lipids, amino acids, carbohy-drates, and other molecules within the sample.78 Table 2 definesthe spectral range from UV to mid-IR (200 to 25,000 nm).78
Visible light penetrates only 1 to 2 mm below the skin andthus obtains information from the subpapillary,79 while lightin the NIR region penetrates deeper into the tissue than VISor mid-IR radiation.21 NIR light is preferred for surgical guid-ance due to its deep penetration into the tissue, which can helpthe surgeon see through connective tissue for visualizing criticalanatomical structures of interest that are not visible anddetecting molecules with detectible spectra.46–80 By expandinglight beyond the visual spectrum, additional information can beobtained to further characterize the cells of interest.81
Spectral resolution of an HSI system refers to the absolutelimit of the ability of separating two adjacent monochromaticspectral features emitted by a point in the image.82 Spectralresolution measures the narrowest spectral feature that can beresolved by an HSI system. High spectral resolution allowsaccurate reconstruction of the true spectral profile of an emittinglight from all points in the tested sample. Another importantparameter of an HSI system is spectral bandwidth, which isdefined as the full width at half maximum.82 HSI systemswith higher spectral resolution and narrower bandwidth poten-tially provide more accurate spectral signature of the sample.
3.1.3 Measurement mode
Based on the optical properties of biological tissue, HSI systemscan work on reflectance, fluorescence, and transmission modesacross the UV, VIS, and NIR regions of the electromagneticspectrum. Majority of the HSI systems in the literature wereimplemented on the reflectance mode, which measures thereflectance spectral of samples. In reflection measurement,the detector and the light source are on the same side of the sam-ple, which is assumed to be thick and incapable of transmis-sion.22 In many cases, fluorescence and reflectance modes areemployed together to identify biomolecular and morphologicindicators of various tumors.19,34,83 In transmission mode,light is transmitted through tissue samples from a light sourceplaced below the sample holder and recorded by an imagingspectrograph placed above the sample. Transmission mode isusually used when hyperspectral systems are integrated withmicroscopes to measure light intensity transmitted throughsamples.35,41,59,84–86
3.1.4 Dispersive devices
Dispersive devices are the core element of an HSI system, whichare either located between the light source and the sample forexcitation wavelength selection or between the sample and thedetector arrays for emission wavelength dispersion. There aremany types of optical and electro-optical dispersive devices,which can perform spectral dispersion or selection in HSI sys-tems. The commonly used dispersive devices in the literaturecan be divided into three classes: (1) monochromators: prismand diffraction grating, (2) optical bandpass filters: eitherfixed filter or tunable filters, and (3) single-shot imagers. Themechanisms, advantages, and disadvantages of these dispersivedevices are described below.
Monochromator. Monochromators separate polychromaticor white light into its constituent spectrum of colors. Thereare two types of monochromators, i.e., prism and diffraction gra-ting, which are the core components in pushbroom HSI systems.Prism disperses light because of the change of the refractiveindex of the prism material, which varies with the wavelengthof incident light, and then causes the incident light of differentwavelengths to leave the prism at different angles. A diffractiongrating consists of reflecting or transmitting elements spaced ata distance comparable to the wavelength of the light underinvestigation. With lines or grooves ruled on the surface, gratingis able to diffract incident light and modify the electric fieldamplitude or phase, or both, of the incident electromagneticwave.87 Prism has very high light throughput and low scatterover the spectral range of VIS and NIR, and is free from over-lapping spectral orders that cause complications in grating.However, optical designs based on prism tend to be more com-plex than grating because of the nonlinear scanning dispersionof the prism.
Prism-grating-prism (PGP) is a direct vision dispersive com-ponent that allows small, low-cost HSI spectrographs for indus-try and research applications in the spectral range of 320 to2700 nm. It consists of a specially designed, volume transmis-sion grating cemented between two almost identical prisms,with short- and long-pass filters placed between the gratingand prism to block unwanted wavelengths and avoid surfacereflections.88 Khoobehi et al.89 used an HSI system incorporatedwith a PGP structure in the spectral range of 410 to 950 nm to
Table 2 Spectral range definitions.
Short name Full name Spectral range (nm)
UV Ultraviolet 200 to 400
VIS Visible 400 to 780
NIR/near-IR Near-infrared 780 to 2500
MIR/mid-IR Mid-infrared 2500 to 25,000
Journal of Biomedical Optics 010901-5 January 2014 • Vol. 19(1)
Lu and Fei: Medical hyperspectral imaging: a review
Downloaded From: http://biomedicaloptics.spiedigitallibrary.org/ on 01/13/2015 Terms of Use: http://spiedl.org/terms

measure retinal oxygen saturation. PGP covering VIS and NIRspectral regions have been integrated into a series of commer-cialized hyperspectral systems to provide high diffraction effi-ciency and good spectral linearity.90 PGP has been employed fornumerous medical applications.47,48,85,91–96
Optical bandpass filter. Optical bandpass filters are eitherfixed or tunable and are widely used in area-scanning HSI sys-tems. Fixed bandpass filters, such as interference filters, areusually placed in a filter wheel that rotates either in front ofdetector arrays or in front of the light source to transmit thewavelength of interest while rejecting light out of the passband. Filter wheels are usually incorporated in multispectralsystems because they contain no more than 10 bandpassfilters.14,55,97–100 Although filter wheels are convenient touse, they suffer from disadvantages of narrow spectral range,low resolution, slow speed of wavelength switching, mechani-cal vibration from moving parts, and image misregistration dueto filter movement.82 Tunable filters are commonly used in thearea-scanning HSI systems, which can be electronically con-trolled without moving parts and at high tuning speeds.101
Liquid crystal tunable filter (LCTF) and acousto-optical tuna-ble filter (AOTF) are predominantly utilized in most MHSIsystems because of their high image quality and rapid tuningspeed over a broad spectral range. LCTFs are generally built bya stack of polarizers and tunable retardation liquid crystalplates.101 LCTFs work from the VIS to NIR region. AOTFsconsist of a crystal in which radio frequency acoustic wavesare used to separate a single wavelength from incidentlight.101 AOTFs operate at a broader wavelength range fromUV to IR. AOTFs also have faster tuning speeds thanLCTFs. However, the image quality of AOTF is relativelypoor due to their acousto-optic operating principles.
Single-shot imager. Single shot imagers, such as a com-puter-generated hologram (CGH), are used to disperse lightin snapshot HSI systems.44,76,102 CGH consists of cells of squarepixels that are arrayed to form a 2-D grating. CGH enables CTISto capture both spatial and spectral information in a singleframe.
3.1.5 Detector arrays
A detector array or detector FPA is an assemblage of individualdetectors located at the focal plane of an imaging system.103
In HSI, FPA includes 2-D arrays that are designed to measurethe intensity of light transmitted by dispersive devices by con-verting radiation energy into electrical signals. Detectors canwork in a wide spectral range of electromagnetic spectrumbased on their spectral responses and application requirements.Selection of a suitable FPA is one of the most importantsteps in the development of spectrometer.104 Many parametersthat characterize the performance of detector arrays, such as sig-nal-to-noise ratio, dynamic range, spectral quantum efficiency,linearity, and so on,103 need to be considered when choosinga suitable FPA because the performance of the detector arraysdirectly determines the image quality.
Charge-coupled devices. The most widely used detectorarrays in the literature are charge-coupled devices (CCDs)because of their high quantum yield and very low dark current.CCDs consist of many photodiodes that are composed of light-sensitive materials, such as silicon (Si), indium gallium arsenide
(InGaAs), indium antimonite, and mercury cadmium telluride(HgCdTe). Based on the spectral response of these materials,the working wavelength range of CCDs varies from UV toNIR. Cooling CCDs can lower the operating temperature ofthe detectors and, therefore, reduce dark-current noise. Twotechnologies currently available for cooling IR and VIS detec-tors are mechanical cryocoolers and thermoelectric coolers.103
Thermoelectrically cooled CCDs perform well in MHSI sys-tems.98,105–107
Silicon CCDs are mostly used in the VIS and NIR regions inMHSI systems14,42,50,105–107 due to their high resolution, rela-tively inexpensive cost, and acceptable quantum efficiency inthe spectral range.
The InGaAs photodiodes made of indium arsenide (InAs)and gallium arsenide (GaAs) extend applications well intothe short-wavelength infrared (SWIR, ∼780 to 1100 nm)with high quantum efficiency across this region. StandardInGaAs (InAs 53% and GaAs 47%) detectors are sensitive inthe 900 to 1700 wavelength region. InGaAs detectors arewell suited for medical applications in NIR and SWIRregions.42,57,96 Te-cooled InGaAs photodiode arrays are utilizedin order to minimize dark noise.57 HgCdTe detectors coveringboth MWIR have been employed in cancer diagnosis,71 lymphnode imaging,68 and assessment of homogeneity distribution inoral pharmaceutical solid dosage forms.56
Intensified CCD and electron multiplying CCD. Whileregular CCD arrays that require sufficient light and exposureto ensure high-quality images are suited for hyperspectral reflec-tance and transmittance imaging, high-performance detectorarrays such as intensified CCD (ICCD) and electron multiplyingCCD (EMCCD) are usually used to detect weak signals for low-light applications, such as fluorescence imaging and Raman im-aging. Martin et al.83 developed a dual-modality HSI system,which utilized CCD color cameras for reflection detectionand ICCD for fluorescence detection for medical diagnosis.108
Vo-Dinh et al.109 proposed a hyperspectral Raman imaging sys-tem that integrated ICCD with a spectrograph to detect Ramansignals for biological imaging. Li et al.110 developed a 3-D mul-tispectral fluorescence optical tomography imaging system thattook fluorescence pictures by EMCCD.
Photomultiplier tube arrays. Photomultiplier tube (PMT)arrays are another type of detector that generates an electricoutput after a photon strikes in photocathode in just a fewnanoseconds. PMT arrays offer faster speed than CCD andcomplementary metal oxide semiconductor (CMOS); therefore,they have been employed to replace CCD in order to meetthe fast scan-time requirement of the HSI systems.111
Complementary metal oxide semiconductor. Despite theadvantages of low cost and low power supply, CMOS detectorshave higher dark current and noise than CCD detectors, whichhas limited their use in HSI systems. In the literature, one systemdesigned for biomedical applications contains CMOS detectorsworking in the 550 to 1000 nm wavelength range.112
3.1.6 Combination with other techniques
An HSI system has been combined with many other techniques,such as laparoscope,46 colposcope,34 fundus camera,76,113,114 andRaman scattering,115 in order to leverage the key benefits of eachinstrument individually and provide more useful information for
Journal of Biomedical Optics 010901-6 January 2014 • Vol. 19(1)
Lu and Fei: Medical hyperspectral imaging: a review
Downloaded From: http://biomedicaloptics.spiedigitallibrary.org/ on 01/13/2015 Terms of Use: http://spiedl.org/terms

disease diagnosis and treatment. The most common combina-tion is with microscope35,38,85,116–121 or confocal microscope,122
which has been proved useful in the investigation of the spectralproperties of tissue.
Epifluorescence microscopes and imaging spectrometers areoften coupled to form an HSI microscope. Tsurui et al.116 pro-posed an HSI system consisting of an epifluorescence micro-scope and an imaging spectrometer to capture and classifycomplete fluorescent emission spectra from multiple fluoro-phores simultaneously from typical biomolecular samples, iden-tify the location of the emission, and build libraries to enableautomatic analysis in subsequent acquisitions. Schultz et al.123
developed a prototype HSI microscope combining a standardepifluorescence microscope and an imaging spectrograph tocapture and identify different spectral signatures present in anoptical field during a single-pass evaluation. However, themajor limitation with these systems is their small fields ofview (FOVs), thus requiring image tiling for tissue-sectionimaging. In order to increase the FOV, Constantinou et al.124
integrated a confocal scanning macroscope with a prototypeHSI mode called a hyperspectral macroscope (HSM), whichallows imaging of entire microscope slides in a single FOV,avoiding the need to tile multiple images together. In confocalfluorescence microscopy, the scanning mechanism of HSM im-aging must trade off between image signal-to-noise ratio andphotobleaching.
4 Image AnalysisImage analysis enables the extraction of diagnostically usefulinformation from a large medical hyperspectral dataset at thetissue, cellular, and molecular levels and is, therefore, criticalfor disease screening, diagnosis, and treatment. Hypercubewith high spatial and spectral resolution may potentially containmore diagnostic information. However, high spatial and spectraldimensions also make it difficult to perform automatic analysisof hyperspectral data. In particular, it is complex in manyaspects: (1) high data redundancy due to high correlation inthe adjacent bands, (2) variability of hyperspectral signatures,and (3) curse of dimensionality.125 With abundant spatial andspectral information available, advanced image classificationmethods for hyperspectral datasets are required to extract,unmix, and classify relevant spectral information. The goal isnot only to discriminate between different tissues (such ashealthy and malignant tissue) and provide diagnostic maps,but also to decompose mixtures into the spectra of pure molecu-lar constituents and correlate these molecular fingerprints (bio-markers) with disease states. Although hyperspectral imageanalysis methods have been intensively investigated in theremote sensing area, their development and application in medi-cal domain lag far behind. The relationships between spectralfeatures and underlying biomedical mechanisms are not wellunderstood. The basic steps for hyperspectral image analysisgenerally involve preprocessing, feature extraction and featureselection, and classification or unmixing.
4.1 Data Preprocessing
HSI preprocessing mainly involves data normalization andimage registration. Gaussian filter was also used in the literatureto smooth spectral signatures and reduce the noise effect.108
Data normalization converts or normalizes hyperspectralradiance observations to reflectance93–126 or absorbance127,128
values that describe the intrinsic properties of biological
samples. Such normalization also reduces system noise andimage artifacts arising from uneven surface illumination orlarge redundant information in the subbands of hyperspectralimagery, and better prepares data for further analysis. Twomost commonly used normalization methods are as follows:
4.1.1 Reflectance
CCD arrays used in HSI systems generally have dark currenteven without light shining on it. Dark current is dependenton temperature and is proportional to integration time. So, toconvert raw intensity into reflectance, reference and dark imagesare taken before acquiring sample images. The reference imageis taken with a standard reflectance surface placed in the scene,and the dark current is measured by keeping the camera shutterclosed. Currently, the widely used standard reflectance surface isthe National Institute of Standards and Technology certified99% Spectralon white diffuse reflectance target. The raw datawere then corrected using the following equation:93,126
Iref ¼Iraw − IdarkIwhite − Idark
; (1)
where Iref is the calculated reflectance value, Iraw is the raw dataradiance value of a given pixel, and Idark and Iwhite are the darkcurrent and the white reference intensity of the given pixel,respectively.
4.1.2 Optical density or absorbance
The absorbance Iabs is usually calculated by taking the ratio ofthe sample images (Iraw) with respect to a reference image(Iref).
127,128
Iabs ¼ − logIrawIref
: (2)
The reference material provides a measure of the instrumentresponse function, and therefore, the method effectively ratiosout the instrument response function from the resultant opticaldensity image set.
Image registration finds a geometric transformation of multi-ple images of the same scene taken at different wavelengths. Thecorrespondence between the images is maximized when animage pair is correctly aligned. To obtain accurate spectral infor-mation for each pixel, image registration may be necessary tospatially align all spectral band images within one hypercubeor between different hypercubes. Kong et al.108 utilized mutualinformation (MI) as a metric for searching the offset of the bandimages along the horizontal axis, and an image pair with maxi-mum MI shows the best match between a reference image andan input image. Each band image was spatially coregistered toeliminate the spectral offset caused during the image acquisitionprocedure. Panasyuk et al.45 performed image registration asa preprocessing step to account for slight motion during theimaging of anesthetized mice. Lange et al.129 developed anelastic image registration algorithm to match reflectance andfluorescence images to compensate for soft tissue movementduring the acquisition of reflectance and fluorescence imagecubes. A detailed description of image registration algorithmsis beyond the scope of this paper. Interested readers maycheck relevant references to identify a suitable approach fora specific study.
Journal of Biomedical Optics 010901-7 January 2014 • Vol. 19(1)
Lu and Fei: Medical hyperspectral imaging: a review
Downloaded From: http://biomedicaloptics.spiedigitallibrary.org/ on 01/13/2015 Terms of Use: http://spiedl.org/terms
4.2 Feature Extraction and Selection
The goal of feature extraction and selection is to obtain the mostrelevant information from the original data and represent thatinformation in a lower-dimensionality space. For hyperspectraldatasets, a larger number of spectral bands may potentially makethe discrimination between more detailed classes possible. Butdue to the curse of dimensionality, too many spectral bands usedin classification may decrease the classification accuracy.125
Moreover, not all of the intensities measured at a given wave-length are important for understanding the underlying character-istics of biological tissue17 since the reflectance or fluorescencefeatures of biological tissue is wavelength dependent. Therefore,it is important to perform feature extraction and selection toextract the most relevant diagnostic information and processthe dataset more efficiently and accurately. In hyperspectraldatasets, each pixel can be represented in the form of an N-dimensional vector, where N is the number of the spectralbands. Such pixel-based representation has been widely usedfor hyperspectral image processing tasks. This method treatshyperspectral data as unordered listings of spectral measure-ments without particular spatial arrangement,130 which mayresult in a salt-and-pepper look for the classification map.Therefore, feature extraction methods incorporating both spatialand spectral information have been investigated intensively inthe remote sensing area to improve classification accuracy.Recent advances of spatial-spectral classification have beensummarized in Ref. 131.
To exploit the information in these datasets effectively,dimensionality reduction methods are required to extract themost useful information, reduce the dimensionality of the data-sets, and handle highly correlated bands. Methods of dimension-ality reduction can be divided into two categories: featureextraction and band selection. The most widely used dimension-ality reduction method for medical hyperspectral datasetanalysis is principle component analysis (PCA). PCA reducesredundant information in the bands of hyperspectral imagerywhile preserving as much of the variance in the high-dimen-sional space as possible. Assume a hypercube consists of Nspectral images, and each image has a dimension of m × n;;then each image hasM ¼ m × n pixels, and the i’th pixel withinan image can be represented as a spectra vector xi ¼½xi1; xi2; · · · ; xiN �T , i ¼ 1; 2; · · · ;M. Therefore, each hypercubecan be represented as an N ×M matrix, where X ¼ðx1; x2; · · · ; xMÞ. The steps to compute the PCA transform ofthe N ×M matrix are as follows:132
1. Center the matrix as X̄ ¼ ½x1 − μ; x2 − μ; · · · ; xM − μ�,where μ ¼ 1
M
PMi¼1 x
i is the mean spectral vector of allpixels.
2. Compute the covariance matrix Σ ¼1M
PMi¼1ðxi − μÞðxi − μÞT ¼ X̄X̄T .
3. Decompose the covariance matrix as Σ ¼ UΛUT ,where Λ ¼ diagðλ1; λ2; · · · ; λNÞ is a diagonal matrixwith eigenvalues in the diagonal entries, andU ¼ ½u1; u2; · · · ; uN �T is an orthonormal matrixcomposed of the corresponding eigenvectorsu1; u2; · · · ; uN .
4. Sort the eigenvalues and eigenvectors in descendingorder, and the first K eigenvectors UK ¼ðu1; u2; · · · ; uKÞ are used to approximate the original
images: zi ¼ ½zi1; zi2; · · · ; ziK�T ¼ UTKx
i, where vectorzi, i ¼ ½1; 2; · · · M� will form the first K bands ofthe PCA images.
PCA of hyperspectral image data can highlight the relative dis-tributions of differentmolecular componentmixtures,46,133 identifykey discriminative features,19,134 and estimate spectrum in thespectroscopic data.86 PCA is optimal in the sense of minimizingthe mean square error. However, PCA transforms the originaldata toasubspacespannedbyeigenvectors,whichmakes itdifficultto interpret the biological meaning after transformation.
Several PCA variants, such as minimum noise fraction(MNF) and independent component analysis (ICA) are alsoused for feature extraction and dimensionality reduction.MNF transform is essentially two cascaded PCA transforma-tions for reducing the spectra dimensionality and separatingnoise from the image data.50 ICA is also a useful extensionof PCA by making the spectral features as independent as pos-sible. The key idea of the ICA assumes that data are linearlymixed by a set of separate independent sources and demixthese signal sources according to their statistical independencymeasured by mutual information.135
4.3 Classification
Hyperspectral image classification methods applied in the medi-cal area mainly include pixel and subpixel classification basedon the type of pixel information used. Pixel-wise classificationcan be parametric or nonparametric. Parametric classifiers gen-erally assume normal distribution for the data, which is oftenviolated in practice.136 Nonparametric methods, such as supportvector machines (SVMs) and artificial neural networks (ANN)are widely used in medical hyperspectral image processing. Thesubpixel method assumes the spectral value of each pixel to be alinear or nonlinear combination of pure components. Pixel- andsubpixel-based methods can be supervised or unsupervised.Commonly used supervised classification methods includeSVMs, ANN, spectral information divergence (SID), and spec-tral angle mapper (SAM). The following sections will discusssome of these methods in detail.
4.3.1 Support vector machines
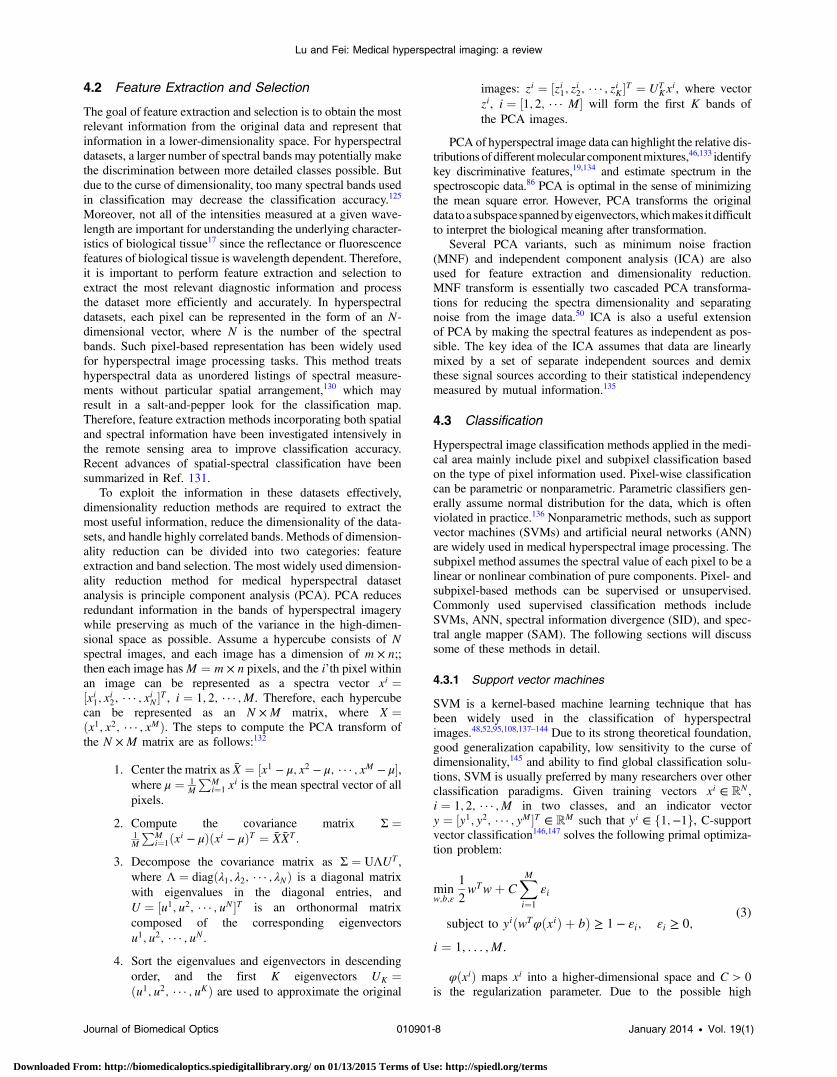
SVM is a kernel-based machine learning technique that hasbeen widely used in the classification of hyperspectralimages.48,52,95,108,137–144 Due to its strong theoretical foundation,good generalization capability, low sensitivity to the curse ofdimensionality,145 and ability to find global classification solu-tions, SVM is usually preferred by many researchers over otherclassification paradigms. Given training vectors xi ∈ RN ,i ¼ 1; 2; · · · ;M in two classes, and an indicator vectory ¼ ½y1; y2; · · · ; yM�T ∈ RM such that yi ∈ f1;−1g, C-supportvector classification146,147 solves the following primal optimiza-tion problem:
minw;b;ε
1
2wTwþ C
XMi¼1
εi
subject to yiðwTφðxiÞ þ bÞ ≥ 1 − εi; εi ≥ 0;
i ¼ 1; : : : ;M:
(3)
φðxiÞ maps xi into a higher-dimensional space and C > 0is the regularization parameter. Due to the possible high
Journal of Biomedical Optics 010901-8 January 2014 • Vol. 19(1)
Lu and Fei: Medical hyperspectral imaging: a review
Downloaded From: http://biomedicaloptics.spiedigitallibrary.org/ on 01/13/2015 Terms of Use: http://spiedl.org/terms
dimensionality of the vector variable w, usually we solve thefollowing dual problem:
minα
1
2αTQα − eTα subject to yTα ¼ 0; 0 ≤ αi ≤ C;
i ¼ 1; : : : ;M: (4)
e ¼ ½1; : : : ; 1�T is the vector of all ones, Q is an M byM positive semidefinite matrix, Qij ≡ yiyjKðxi; xjÞ, andKðxi; xjÞ ≡ φðxiÞTφðxjÞ is the kernel function.
After Eq. (4) is solved, using the primal-dual relationship, theoptimal w satisfies
w ¼XMi¼1
yiαiφðxiÞ: (5)
So, for a new test point x, the decision function is
sgnðwTφðxÞ þ bÞ ¼ sgn
�XMi¼1
yiαiKðxi; xÞ þ b
�: (6)
SVM has been proved to perform well for classifying hyper-spectral data.137 In the processing of medical hyperspectral data,SVM has also been explored for various classification tasks.Melgani and Bruzzone137 investigated the effectiveness ofSVMs in the classification of hyperspectral remote sensingdata. It was found that SVMs were much more effective thanradial-basis function (RBF) neural networks and the K-nearestneighbor classifier in terms of classification accuracy, computa-tional time, and stability to parameter settings. Kong et al.108
chose Gaussian RBF kernel as the kernel function for SVMand learned the SVM parameters from 100 training sampleschosen randomly from each of the normal and tumor classes.For testing, 2036 (normal) and 517 (tumor) samples wereused. Experimental results showed that the spatial filteringenhanced the performance, which resulted in an overall accu-racy of 86%, while the use of the original data had an accuracyof 83%.
In our group, we used SVMs for various tissue classificationtasks. In Ref. 52, Akbari et al. extracted and evaluated the spec-tral signatures of both cancerous and normal tissue and usedleast squares SVMs to classify prostate cancer tissue intumor-bearing mice and on pathology slides. In Ref. 140,they created a library of spectral signatures for different tissuesand discriminated between cancerous and noncancerous tissuesin lymph nodes and lung tissues with SVMs. In Ref. 95, Akbariet al. constructed a library of spectral signatures from hyperspec-tral images of abdominal organs, arteries, and veins, and thendifferentiated between them using SVMs. In Ref. 48, they uti-lized least squares kernel SVMs to classify normal tissues andtumors based on their standard deviation and normalized differ-ence index of spectral signature.
4.3.2 Artificial neural networks
Neural network is another supervised classification methodthat has been adopted by many researchers,92,96,100,136 due toits nonparametric nature, arbitrary decision boundary, etc.Multilayer perceptron (MLP) is the most popular type of neuralnetwork in image classification.136 It is a feed-forward networktrained by the backpropagation algorithm. Monteiro et al.93
implemented both single-layer perceptron (SLP) and MLP assupervised classifiers. The MLP notably generated the clearestvisualization of the calendar’s number under the blood.Although the SLP was also able to learn a good visualization,the output presented more noise.
4.3.3 Spectral information divergence
SID models the spectrum of a hyperspectral image pixel as aprobability distribution in order to measure the discrepancyof probable behaviors between two spectra. Guan et al.58
used the SID technique to segment pathological white bloodcells (WBCs) into four components: nucleus, cytoplasm, eryth-rocytes, and background. The SID method could not onlydistinguish different parts with similar gray values, e.g., inthe case of cytoplasm and erythrocyte, but also segment WBCsaccurately in spite of their irregular shapes and sizes.
4.3.4 Spectral angle mapper
SAM determines the spectral similarity by calculating the anglebetween the spectra and treating them as vectors in a space withdimensionality equal to the number of wavelengths. Martinet al.53 employed SAM algorithm to map the spectral similaritybetween image spectra and cluster spectra in order to performsupervised classification, and they found that SAM disregardedspecific surface irregularities of the vocal cords that naturally ledto inhomogeneous reflections in every patient. Li et al.59 usedthe SAM algorithm to identify the nerve fibers from the molecu-lar hyperspectral images of nerve sections according to thedifference of the spectral signatures of different parts.
4.3.5 Spectral unmixing
One of the confounding factors in analyzing hyperspectralimages is that the spectra at many pixels are actually mixturesof the spectra of the pure constituents. Spectral unmixing is asubpixel analysis method, which decomposes a mixed pixelinto a collection of distinct spectra or endmembers, and a setof fractional abundances that indicate the proportion of eachendmember.148 Spectral unmixing algorithms can be supervisedor unsupervised. Supervised spectral unmixing relies on theprior knowledge about the reflectance patterns of candidate sur-face materials, while unsupervised unmixing aims to identify theendmembers and mixtures directly from the data without anyuser interaction.149 Many unmixing algorithms that were com-monly used in the remote sensing area have been explored inmedical HSI. Berman et al.71 implemented an unmixing method,i.e., iterated constrained endmembers, for hyperspectral data ofcervical tissue. They identified cellular and morphological fea-tures as a prelude to construct a library of biologically interpret-able endmembers. In another study, Constantinou et al.124
applied linear unmixing to hyperspectral images in order toremove autofluorescent signal contribution. It was consideredthat hyperspectral spatial spectrum is a combination of auto-fluorescence spectrum and other fluorescence spectrum ofobject tissues such as tumors. By decompositing the acquiredspectra into different ones, autofluorescent signals can beremoved or reduced. Sorg et al.38 performed spectral mixtureanalysis by utilizing a spectral angle-mapping technique inorder to classify pixels as expressing green fluorescent protein(GFP) or red fluorescent protein (RFP).
Journal of Biomedical Optics 010901-9 January 2014 • Vol. 19(1)
Lu and Fei: Medical hyperspectral imaging: a review
Downloaded From: http://biomedicaloptics.spiedigitallibrary.org/ on 01/13/2015 Terms of Use: http://spiedl.org/terms
5 Medical ApplicationsHSI is able to deliver nearly real-time images of biomarkerinformation, such as oxyhemoglobin and deoxyhemoglobin,and provide assessment of tissue pathophysiology based onthe spectral characteristics of different tissue.45 Therefore,HSI is increasingly being used for medical diagnosis andimage-guided surgery. For example, HSI has been applied tothe diagnosis of hemorrhagic shock,40,150 the assessment ofperipheral artery disease,151 early detection of dental caries,57
fast characterization of kidney stone types,96 detection of laryn-geal disorders,53 and so on. In the following section, we focus onthe applications of HSI to cancer, cardiac disease, retinal dis-ease, diabetic foot, shock, tissue pathology, and image-guidedsurgery.
5.1 Disease Diagnosis
HSI has tremendous potential in disease screening, detection,and diagnosis because it is able to detect biochemical changesdue to disease development, such as cancer cell metabo-lism.19,34,152 In the literature, a variety of studies have usedHSI techniques to augment existing diagnostic methods or toprovide more efficient alternatives. In this section, diseases,such as different types of cancer, cardiac disease, ischemic tis-sue, skin burn, retinal disease, diabetes, kidney disease, andso on, are investigated by various HSI systems.
5.1.1 Cancers
The rational for cancer detection by optical imaging lies in thefact that biochemical and morphological changes associatedwith lesions alter the absorption, scattering, and fluorescenceproperties; therefore, optical characteristics of tissue can inturn provide valuable diagnostic information. For example, opti-cal absorption can reveal angiogenesis and increased metabolicactivity by quantifying the concentration of hemoglobin andoxygen saturation.16 Kortum et al.153 used optical spectroscopyto detect neoplasia and reported that (1) the increased metabolicactivity affects mitochondrial fluorophores and changes thefluorescence properties in precancerous tissue and (2) fluores-cence and reflectance spectra contain complementary informa-tion that was useful for precancer detection.
Compared to optical spectroscopy that measures tissuespectra point-by-point, HSI is able to capture images of alarge area of tissue and has exhibited great potential in thediagnosis of cancer in the cervix,19,34,81,154 breast,45,155
colon,66,84,117,118,142,156–159 gastrointestine,160,161 skin,41,97 ovary,55
urothelial carcinoma,162 prostate,52 esophagea,163 trachea,164
oral tissue,20,32,165,166 tongue,126 lymph nodes,72 and brain.98
HSI cancer studies have been performed in the followingmajor aspects: (1) recognizing protein biomarkers and genomicalterations on individual tumor cells in vitro,167 (2) analyzing themorphological and structural properties of cancer histologicalspecimens to classify the cancer grades, (3) examining the tissuesurface to identify precancerous and malignant lesions in vivo,and (4) measuring the tissue blood volume and blood oxygena-tion to quantify the tumor angiogenesis and tumor metabolism.The following section briefly summarizes the research worksthat have been performed for certain types of cancers withoutcovering all the above-mentioned cancers.
Cervical cancer. Cervical cancer was once one of the mostcommon causes of cancer death in American women. Pap smear
tests, the current screening method for cervical cancer, arebased on optical techniques and offer an effective method foridentifying precancerous and potentially precancerous changesin cervical cells and tissue.168 However, the Pap smear testhas been reported to have a false positive rate of 15 to 40%.It has also been reported that in normal cervical tissue, collagenand crosslinks exhibit bright fluorescence in the stroma overa wide range of excitation wavelengths, while in cervicalprecancers, stromal fluorescence is strongly decreased.154
Studies also showed that both reflectance and fluorescence spec-troscopy can detect increased angiogenesis, which accompaniesprecancer.169
In vivo study: A combination of fluorescence and reflectanceimaging has been shown to be able to interrogate the cervix tis-sue in vivo. Ferris et al.19 performed a clinical study on a diversepopulation of women with varying disease and nondisease stateswith an MHSI system covering the UV and VIS regions, andmeasured tissue fluorescence and reflectance of the cervical epi-thelium on the ectocervix. This system employs both fluores-cence and reflectance tissue excitation with a multichannelspectrograph capable of hyperspectral resolution of ∼5 nm
and spatial resolution of the ectocervix of ∼1 mm. They showedthat the system could discriminate high-grade cervical lesionsfrom less-severe lesions and normal cervical tissue, and coulddetect cervical cancer precursors at a rate greater than thatobtained by a simultaneously collected Pap smear. It was con-cluded that fluorescence and reflectance mapping of cervicalneoplasia may have some value as a colposcopy adjunct.
Later, multispectral digital colposcope (MDC) was builtto incorporate multispectral imaging with colposcope byBenavides et al.34 in order to measure the autofluorescenceand reflectance images of the cervix. It was concluded thatMDC could provide significant diagnostic information for dis-crimination between cervical intraepithelial neoplasia lesionsand normal cervical tissues, and that excitation wavelengthsacross the spectral range of 330 to 360 nm and 440 to470 nm appeared important in cervical cancer diagnosis.
Histology study: Besides the in vivo studies, HSI on cervicalcancer histology slides also showed promising results. Siddiqiet al.81 successfully improved the overall efficiency and objec-tivity in Pap test diagnosis by utilizing an HSI system coupledwith microscope. They identified normal, low-grade, and high-grade H&E-stained cervical cells on TriPath liquid-based Paptest slides, squamous cell carcinoma (SCC) cells, as well asatypical squamous cells based on their unique spectra profiles.It was found that cervical cells with varying degrees of dysplasiademonstrated different spectra, which could be due to thechange in the quantity and organization of the chromatin. Itwas also found that H&E and Pap stain were designed onlyfor visual spectrum and that the use of IR and UV spectralrange may further enhance the efficacy of HSI. Wood et al.67
employed FTIR to collect spectra of glandular and squamousepithelium, and of the cervical transformation from the H&E-stained cervical samples. They performed multivariate statisticalanalysis of the FTIR spectra to distinguish different tissue typesand found the amide I and II regions to be very important incorrelating anatomical and histopathological features in tissueto spectral clusters.
Breast cancer. Breast cancer is the leading cause of cancerdeaths among American women.170 An inadequate supply ofoxygen in tumor cells leads to hypoxia, which has been
Journal of Biomedical Optics 010901-10 January 2014 • Vol. 19(1)
Lu and Fei: Medical hyperspectral imaging: a review
Downloaded From: http://biomedicaloptics.spiedigitallibrary.org/ on 01/13/2015 Terms of Use: http://spiedl.org/terms
shown to be of prognostic value in clinical trials involving radi-ation, chemotherapy, and surgery.
In vivo study: Sorg et al.38 applied HSI to acquire serialspatial maps of blood oxygenation in terms of hemoglobinsaturation at the microvascular level on the mouse mammarycarcinoma in vivo. RFP was used to identify mouse mammarycarcinoma cells, while hypoxia-driven GFP was used to identifythe hypoxic fraction. Their studies may improve the treatmentand protocols to address or exploit tumor behavior.
Histology study: Boucheron et al.155 acquired multispectralimages with 29 spectral bands, spaced 10 nm within therange of 420 to 700 nm, from 58 H&E-stained breast cancerbiopsy samples and then classified the nuclei of breast cancercells with the multispectral image bands, or the constructedRGB imagery, or single image bands. They found that multi-spectral imagery for routine H&E-stained histopathologyprovided minimal additional spectral information for the pixel-level nuclear classification task than standard RGB imagerydid. However, their result was limited to the classification ofnuclei in breast histology within the spectral range of 420 to700 nm with small number of wavelength bands. Kumaret al.60 applied FTIR on histopathological specimens of breastcancer with different histological grades. FTIR spectral changesclose to and far from carcinoma were reported. PCA was per-formed to analyze the data. Their preliminary study suggestedthat FTIR spectral features present in the 5882 to 6250 nm couldbe used as spectral markers for identification of cancer-inducedmodifications in collagen.
Skin cancer. Two types of skin cancer have been investigatedusing MHSI: melanoma and Kaposi’s sarcoma (KS). Melanomais the most life-threatening form of skin cancer, which is respon-sible for ∼75% of skin cancer deaths in 2012.170 KS is a highlyvascularized tumor that causes cutaneous lesions.
In vivo human study: Hattery et al.97 built a six-band multi-spectral NIR imaging system to identify thermal signatures ofblood volume on patients with KS and who were startinganti-angiogenesis therapy. Results showed that relative spatialtissue blood volume and blood oxygen saturation valuescould be used as indicators of tumor angiogenesis and tumormetabolism.
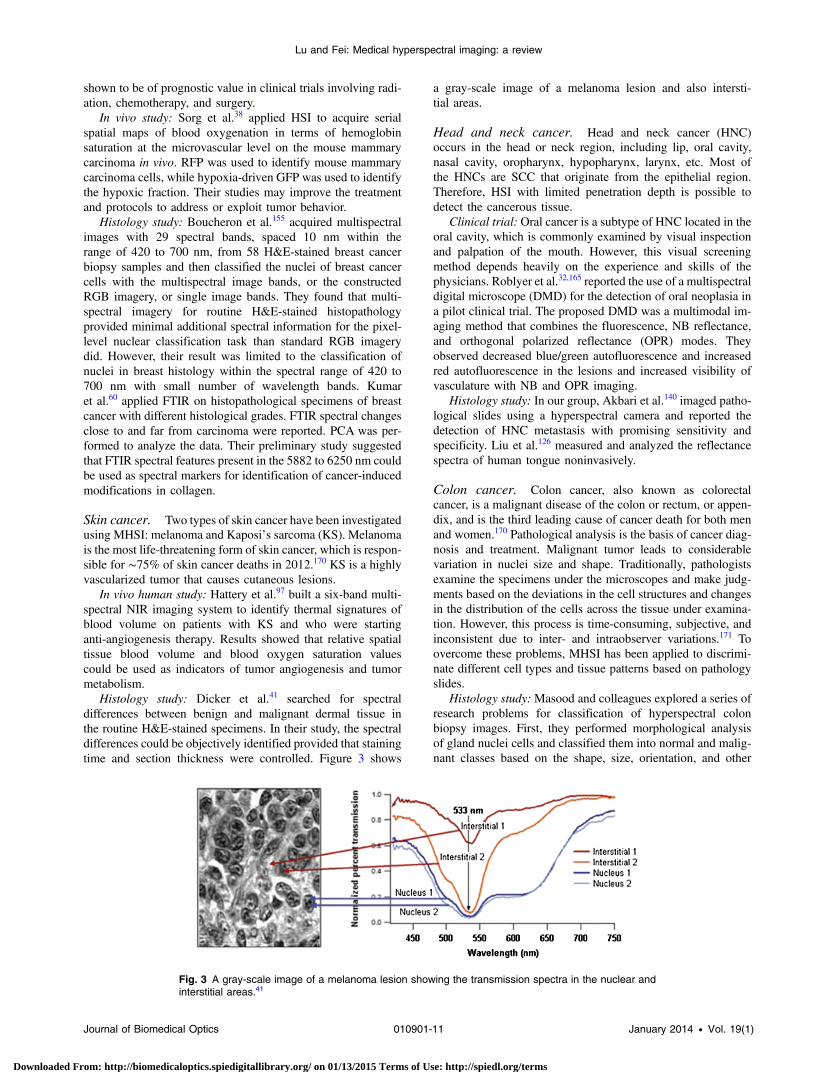
Histology study: Dicker et al.41 searched for spectraldifferences between benign and malignant dermal tissue inthe routine H&E-stained specimens. In their study, the spectraldifferences could be objectively identified provided that stainingtime and section thickness were controlled. Figure 3 shows
a gray-scale image of a melanoma lesion and also intersti-tial areas.
Head and neck cancer. Head and neck cancer (HNC)occurs in the head or neck region, including lip, oral cavity,nasal cavity, oropharynx, hypopharynx, larynx, etc. Most ofthe HNCs are SCC that originate from the epithelial region.Therefore, HSI with limited penetration depth is possible todetect the cancerous tissue.
Clinical trial: Oral cancer is a subtype of HNC located in theoral cavity, which is commonly examined by visual inspectionand palpation of the mouth. However, this visual screeningmethod depends heavily on the experience and skills of thephysicians. Roblyer et al.32,165 reported the use of a multispectraldigital microscope (DMD) for the detection of oral neoplasia ina pilot clinical trial. The proposed DMD was a multimodal im-aging method that combines the fluorescence, NB reflectance,and orthogonal polarized reflectance (OPR) modes. Theyobserved decreased blue/green autofluorescence and increasedred autofluorescence in the lesions and increased visibility ofvasculature with NB and OPR imaging.
Histology study: In our group, Akbari et al.140 imaged patho-logical slides using a hyperspectral camera and reported thedetection of HNC metastasis with promising sensitivity andspecificity. Liu et al.126 measured and analyzed the reflectancespectra of human tongue noninvasively.
Colon cancer. Colon cancer, also known as colorectalcancer, is a malignant disease of the colon or rectum, or appen-dix, and is the third leading cause of cancer death for both menand women.170 Pathological analysis is the basis of cancer diag-nosis and treatment. Malignant tumor leads to considerablevariation in nuclei size and shape. Traditionally, pathologistsexamine the specimens under the microscopes and make judg-ments based on the deviations in the cell structures and changesin the distribution of the cells across the tissue under examina-tion. However, this process is time-consuming, subjective, andinconsistent due to inter- and intraobserver variations.171 Toovercome these problems, MHSI has been applied to discrimi-nate different cell types and tissue patterns based on pathologyslides.
Histology study:Masood and colleagues explored a series ofresearch problems for classification of hyperspectral colonbiopsy images. First, they performed morphological analysisof gland nuclei cells and classified them into normal and malig-nant classes based on the shape, size, orientation, and other
Fig. 3 A gray-scale image of a melanoma lesion showing the transmission spectra in the nuclear andinterstitial areas.41
Journal of Biomedical Optics 010901-11 January 2014 • Vol. 19(1)
Lu and Fei: Medical hyperspectral imaging: a review
Downloaded From: http://biomedicaloptics.spiedigitallibrary.org/ on 01/13/2015 Terms of Use: http://spiedl.org/terms
geometrical attributes of the cellular components. From this,they concluded that HSI has enough discriminatory power todistinguish normal and malignant biopsy tissues.117 Second,they selected a single band that was considered to contain suf-ficient textural information. Then they classified colon biopsysamples into benign and malignant classes based on the texturalinformation extracted from the single band and achieved a rea-sonable classification result.142,158 Third, they compared theclassification result of a single band with 3-D spectral/spatialanalysis, and the former achieved comparable accuracy forSVM-based classification of 32 hyperspectral images of colonbiopsy samples.118,159
While Masood mainly focused on classifying the colonbiopsy tissue into benign and malignant types, Maggioni et al.84
provided evidence that with a hyperspectral microscope, theH&E-stained microarray sections of the colon tissue could beclassified into normal, benign (adenoma), and malignant(carcinoma).
Traditional microscope has a limited field of view; therefore,multiple images must be taken and tiled together to form a com-plete image of the entire tissue specimen, which is time-consum-ing and can introduce artifacts in the composite image. Toaddress these issues, Constantinou et al.124 developed a confocalscanning macroscope integrated with a prototype HSI mode todetect fluorescently labeled antibodies and remove autofluores-cence in paraffin-embedded, formalin-fixed tissues with linearunmixing method. The system was evaluated in the xenografttissue of a mouse model with human colonic adenocarcinoma.The prototype MHSI had the ability to simultaneously imagemultiple fluorescently labeled tissue-specific markers in largebiological samples in a time- and cost-efficient way.
5.1.2 Heart and circulatory pathology
Heart disease continues to be the leading cause of death for bothmen and women in the United States. Each year, one in everyfour deaths in the United States is caused by heart disease. HSIhas been explored in heart and circulatory pathology both in vivo(animal and human studies) and in vitro.
In vivo study. Peripheral arterial disease (PAD) involves theatherosclerotic occlusion of the arterial circulation to lowerextremity,172 which may lead to rest pain, lower extremity ulcer-ation, and even limb amputation.151 Effective diagnostic andprognostic technologies are necessary for earlier detectionand treatment to avoid unnecessary complications and interven-tions. However, traditional methods, such as ankle-brachialindex, Doppler waveform analysis, segmental limb pressure,etc., did not provide high specificity and sensitivity for the pre-diction of the healing of tissue loss in PAD patients.151 HSIhas the capacity of noninvasively measuring oxyhemoglobinand deoxyhemoglobin concentrations to create an anatomicoxygenation map.173,174 Chin et al.151 scanned patients withand without PAD with a visible HSI system and acquired theconcentration of oxyhemoglobin and deoxyhomoglobin.Experiments showed that HSI might be useful in detectingdifferences in oxygenation levels in the lower extremities ofpatients with and without PAD. Their data also suggestedthat HSI may be a useful tool for the diagnosis and evaluationof patients with PAD.
In vitro study. Coronary artery disease is a leading cause ofdeath and morbidity worldwide.175 It arises from atherosclerosisthrough a slowly progressing lesion formation and luminalnarrowing of arteries. Upon plaque rupture and thrombosis,
cardiovascular disease, such as acute coronary syndrome, myo-cardial infarction, or stroke, is likely to happen. Thoroughknowledge of the properties of both the lesion and the adjacentvessel wall is required for the diagnosis of atherosclerosis andthe determination of the right time for intervention, choice oftreatment, and assessment of prognosis.50 The standard methodfor diagnosing and evaluating atherosclerosis is angiography,which is limited to the detection of stenotic plaques.50
Reflectance and fluorescence spectroscopies have been exploredas diagnostic tools for atherosclerosis, such as distinguishingfibrous plaque from healthy arterial wall,176 identifying athero-sclerotic regions in arteries,177 and superficial foam cells in coro-nary plaques prone to erosion in vivo.178 However, it wasobserved that most of the advanced lesions had a central regionsurrounded by an outer rim or shoulder-region of the plaque,which is considered a weak spot in vulnerable lesions.50 Thespatial variation of plaque makes it difficult for conventional sin-gle-point spectroscopic measurements to classify a plaque cor-rectly. HSI holds great promise for diagnosis of atherosclerosisby probing a large area of tissue under investigation and provid-ing spectral information for each pixel in the area of interest.Larsen et al.50 collected hyperspectral reflectance and fluores-cence data from excised aorta samples in vitro, using bothwhite-light and UV illuminations. Plaque features, such as lipidsand calcifications, could be identified from white-light reflec-tance and UV-excited fluorescence hyperspectral images, andHSI was shown to identify the complexity and large hetero-geneity of such plaques as compared to the histology.
5.1.3 Retinal diseases
The delicate nature of the eye usually precludes invasive biopsyor mechanical access to the retina. Therefore, current diagnosisof retinal disease relies strongly upon optical imaging meth-ods.179 An HSI system is usually integrated with a fundus cam-era to enable optical imaging of the eyes. Early in 1999, Cohenet al.179 reported the use of HSI for mapping wavelength-resolved reflectivity across a 2-D scene in order to quantify reti-nal images and hence offer possibility for both early detectionand monitoring of the effectiveness of therapy. Khoobehi et al.89
attached a fundus camera to an HSI for monitoring relative spa-tial changes in retinal oxygen saturation. The integrated systemcan be adapted to measure and map relative oxygen saturation inretinal structures and the optic nerve head in nonhuman primateeyes. Hirohara et al.113 measured the intensities of differentwavelengths of light that were transmitted through the artery,vein, and the area surrounding these vessels and reflected out.A hyperspectral fundus imaging camera was used to capture andanalyze the spectral absorptions of the vessels.
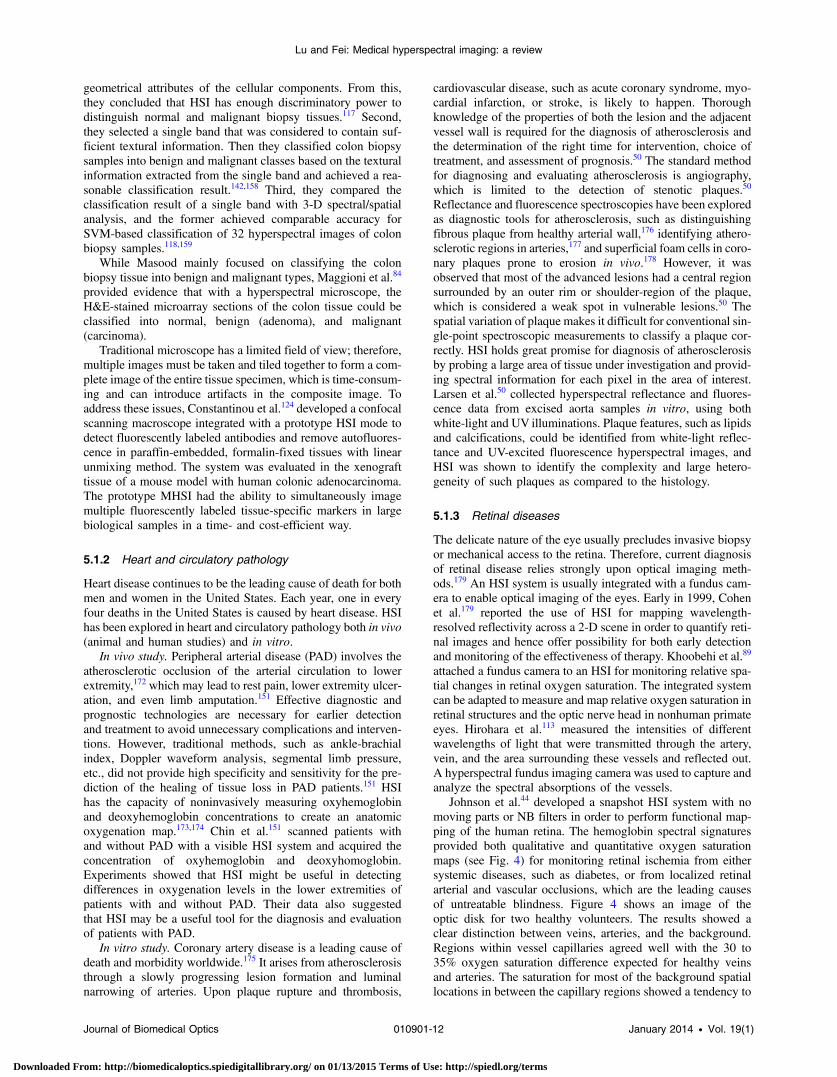
Johnson et al.44 developed a snapshot HSI system with nomoving parts or NB filters in order to perform functional map-ping of the human retina. The hemoglobin spectral signaturesprovided both qualitative and quantitative oxygen saturationmaps (see Fig. 4) for monitoring retinal ischemia from eithersystemic diseases, such as diabetes, or from localized retinalarterial and vascular occlusions, which are the leading causesof untreatable blindness. Figure 4 shows an image of theoptic disk for two healthy volunteers. The results showed aclear distinction between veins, arteries, and the background.Regions within vessel capillaries agreed well with the 30 to35% oxygen saturation difference expected for healthy veinsand arteries. The saturation for most of the background spatiallocations in between the capillary regions showed a tendency to
Journal of Biomedical Optics 010901-12 January 2014 • Vol. 19(1)
Lu and Fei: Medical hyperspectral imaging: a review
Downloaded From: http://biomedicaloptics.spiedigitallibrary.org/ on 01/13/2015 Terms of Use: http://spiedl.org/terms

be within the 90 to 100% regime. This was consistent with thesubjects being healthy.44 This system is capable of acquiringa complete spatial-spectral image cube of 450 to 700 nmwith 50 bands in ∼3 ms and without motion artifacts or pixelmisregistration. This approach is ideal for exploring the poten-tial of retinal applications since the eye is constantly moving andoften requires snapshot camera operation.
Age-related macular-degeneration (AMD) is a major causeof blindness in the elderly, and the prevalence of the diseaseincreases exponentially with every decade after age 50.180
Cell protein cytochrome-c has been identified as a key signalingmolecule in the degeneration processes and apoptosis.Schweizer et al.121 developed an HSI system to collect spectro-scopic data, which provided information about the oxidativestate of cytochrome-c during oxidative stress for detection ofAMD. Fawzi et al.76 applied CTIS to quantify the macular pig-ment (MP) in a group of healthy eyes in vivo. They successfullyrecovered the detailed spectral absorption curves for MP in vivothat correspond to physically realistic retinal distributions.
5.1.4 Diabetic foot
Diabetic foot ulceration is a major complication of diabetes, anddiabetic patients have up to a 25% lifetime risk of developinga foot ulcer.181 If untreated, diabetic foot ulcers may become
infected and require total or partial amputation of the affectedlimb. Changes in the large vessels and microcirculation ofthe diabetic foot are important in the development of diabeticfoot ulceration and subsequent failure to heal existing ulcers.Greenman et al.37 used an MHSI system to investigate the hemo-globin saturation (SHSIO2) in the forearm and foot. It was foundthat tissue SHSIO2 was reduced in the skin of patients with dia-betes. Khaodhiar et al.182 carried on a clinical study of 10 type 1diabetic patients with 21 foot ulcer sites, 13 type 1 diabeticpatients without ulcers, and 14 nondiabetic control subjects.MHSI predicted diabetic foot ulcer healing with a sensitivityof 93% and specificity of 86%. Tissue oxy- and deoxyhemoglo-bin on the upper and lower extremity distant from the ulcer wereused to quantify the tissue in the study. Yudovsky et al.183
reviewed how HSI between 450 and 700 nm could be usedto assess the risk of diabetic foot ulcer development and to pre-dict the likelihood of healing noninvasively. Two methods weredescribed to analyze the in vivo hyperspectral measurements.The first method was based on the modified Beer-Lambertlaw and produced a map of oxyhemoglobin and deoxyhemoglo-bin concentrations in the dermis of the foot. The second wasbased on a two-layer optical model of skin. It could retrievenot only oxyhemoglobin and deoxyhemoglobin concentrations,but also epidermal thickness and melanin concentration alongwith skin scattering properties. It could detect changes in the
Fig. 4 Spatial oxygen saturation maps. (a) Oxygen saturation map of 29-year-old healthy male. Vascularseparation from the background is seen as well as reasonable saturation values for veins versus arteries.(b) Zero-order color image. (c) Oxygen saturation map of 58-year-old healthy male. (d) Zero-order colorimages.44
Journal of Biomedical Optics 010901-13 January 2014 • Vol. 19(1)
Lu and Fei: Medical hyperspectral imaging: a review
Downloaded From: http://biomedicaloptics.spiedigitallibrary.org/ on 01/13/2015 Terms of Use: http://spiedl.org/terms

diabetic foot and help predict and understand ulceration mech-anisms. In another study, the same group51 reported the use ofa hyperspectral tissue oximetry in predicting the risk of diabeticfoot ulcer formation with a sensitivity and specificity of 95 and80%, respectively. A later study184 found that epidermal thick-ening and decrease in oxyhemoglobin concentration could alsobe detected prior to ulceration at preulcerative sites.
5.1.5 Shock
As the body’s largest and most accessible organ, the skin oftenmanifested changes in the systemic circulation, which is impor-tant for the diagnosis of patients in shock. MHSI offers a newand exciting means of measuring both the spatial and temporalvariations in skin hemodynamics.
Gillies et al.128 evaluated the ability of MHSI to depict andquantify the cutaneous manifestations of shock using a porcinemodel. Shock was induced by chest trauma followed by hem-orrhage. Quantitative and qualitative changes were observedin the level of skin oxygenation during shock and recovery.A mottled pattern of oxygen saturation was observed duringhemorrhagic shock instead of during hypovolemic shock or fol-lowing resuscitation. The study showed that noninvasive imag-ing of skin oxygen saturation could potentially be useful inmonitoring the response of the microvasculature to shock andsubsequent treatment. Variation in cutaneous blood flow distri-bution and hemoglobin saturation measured by MHSI may offernew insights into the pathophysiology and treatment of shock.
Skin color changes and mottling are frequently describedsigns of hemorrhagic shock (HEM). Cancio et al.40 developeda noninvasive, noncontact HSI system to quantify and depict thesurface tissue saturation of oxygen (SHSIO2) for each pixel in aregion of interest. A study of 17 female pigs showed lineardecreases in both mean SHSIO2 and oxyhemoglobin (HbO2) val-ues with blood loss, which were reversed by resuscitation. HSIis a promising noninvasive and noncontact tool for quantifyingchanges in skin oxygenation during HEM and resuscitation.
5.1.6 Others
By recording the variations in the percentages of oxygen satu-ration of hemoglobin, optical methods are able to monitor thevisible and near-IR spectral properties of the blood. Zuzaket al.105,106 measured the changes in the spatial distribution ofregional tissue oxygenation during vascular occlusion and reper-fusion. This method was able to noninvasively visualize and dif-ferentiate between normal and ischemic tissue. This approachmay have a variety of applications in surgical and diagnosticprocedures. In the same group, a visible-reflectance HSI systemwas introduced to quantify the percentage of HbO2 as an indexof skin tissue perfusion. The HSI system demonstrated (1) a sig-nificant decline in the percentage of HbO2 in skin tissue whenblood flow is reduced after inhibition of forearm nitride oxidesynthesis and (2) restoration of HbO2 toward basal values withimproved blood flow during inhalation of nitride oxide.185 In aclinical study,107 the same group used a visible reflectance HSIsystem to examine a model of vascular dysfunction involvingboth ischemia and reactive hyperemia during tissue perfusion.The method was based on oxyhemoglobin and deoxyhemoglobin signals from spectral images in the 525- to 645-nmregion. It was able to visualize the spatial distribution of percent-ages of oxyhemoglobin and deoxyhemoglobin in the specificskin tissue areas.
Another important application of HSI in histopathologicalexamination of tissue is a combination of hyperspectral instru-ments with other techniques, such as microscope, macroscope,micromachined angular filter array, or snapshot fiber bundle.Huebschman et al.186 took advantage of the continuous spectrumcollected for each image pixel by a hyperspectral microscopysystem to scan and analyze pathology tissue samples. Thosesamples were stained with four standard fluorochromes attachedto specific antibodies, typically across the wavelength range of420 to 785 nm, with the longest wavelength markers emitting inthe spectral region where the human eye was not sensitive.Begin et al.115 presented a wavelength-swept approach to coher-ent anti-Stokes Raman scattering microscopy. The system wasespecially well suited for experiments on thick tissue, wherescattering played an important role. It bridged an importantgap between fundamental research microscopy tools and clini-cally useful instruments by combining the context of imagingwith the richness of spectroscopic information. Vasefi et al.187
proposed an innovative MHSI technology called angulardomain spectroscopic imaging that retained submillimeter spa-tial resolution as well as high spectral resolution through tissuespecimens up to 3 mm thick (cross-section diagram of tissuesample is shown in Fig. 5). Khoobehi et al.188 developed aninnovative snapshot HSI system that detected the whole spec-trum of hemoglobin using the single light exposure capabilityof a fundus camera. It was able to record the hemoglobin sig-nature of the retinal arteries, veins, and retina tissue. Sowaet al.127 revealed that differences in tissue reflectance correlateswith the varying degrees of tissue perfusion immediately follow-ing surgical elevation of the reversed McFarlane skin flap.
5.2 Surgical Guidance
The success of surgery highly depends on a surgeon’s ability tosee, feel, and make judgments to identify the lesion and its mar-gins.189 MHSI holds the potential to extend a surgeon’s vision atthe molecular, cellular, and tissue levels. The ability of MHSI asan intraoperative visual aid tool has been explored in manysurgeries.
First, MHSI could help surgeons to visualize the surgical bedunder the blood. Visual inspection is critical in microsurgery.However, the inevitable presence of blood spilling over the sur-gical field is a large visual obstacle to a successful surgery.Therefore, NIR HSI spectrograph was utilized to visualizetissues submerged in a blood layer that could not be seen withthe naked eye.93,190
Second, MHSI could facilitate residual tumor detection.45
Surgery remains the foundation of cancer treatment, with thecentral objective of maximizing the removal of the tumor, with-out harming adjacent normal tissue. However, cancerous tissueis often indistinguishable from healthy tissue in the operatingroom, which leads to the high mortality rates from recurrenttumors. The rationale of residual tumor detection by MHSIlies in the fact that MHSI is able to distinguish the spectraldifference of the normal and cancerous tissue in nearly realtime during the procedure.45
Third, MHSI could monitor the tissue oxygen saturationduring surgery. Tissue blood flow or oxygenation is a positiveindicator of viable tissue, which might be otherwise sacrificedwhen removing tumor with little guidance. It has been shown inRef. 191 that HSI could monitor the tissue at a rate of 3 framesper second and, thus, could detect dynamic changes in bloodflow and capture unexpected events during surgery.
Journal of Biomedical Optics 010901-14 January 2014 • Vol. 19(1)
Lu and Fei: Medical hyperspectral imaging: a review
Downloaded From: http://biomedicaloptics.spiedigitallibrary.org/ on 01/13/2015 Terms of Use: http://spiedl.org/terms
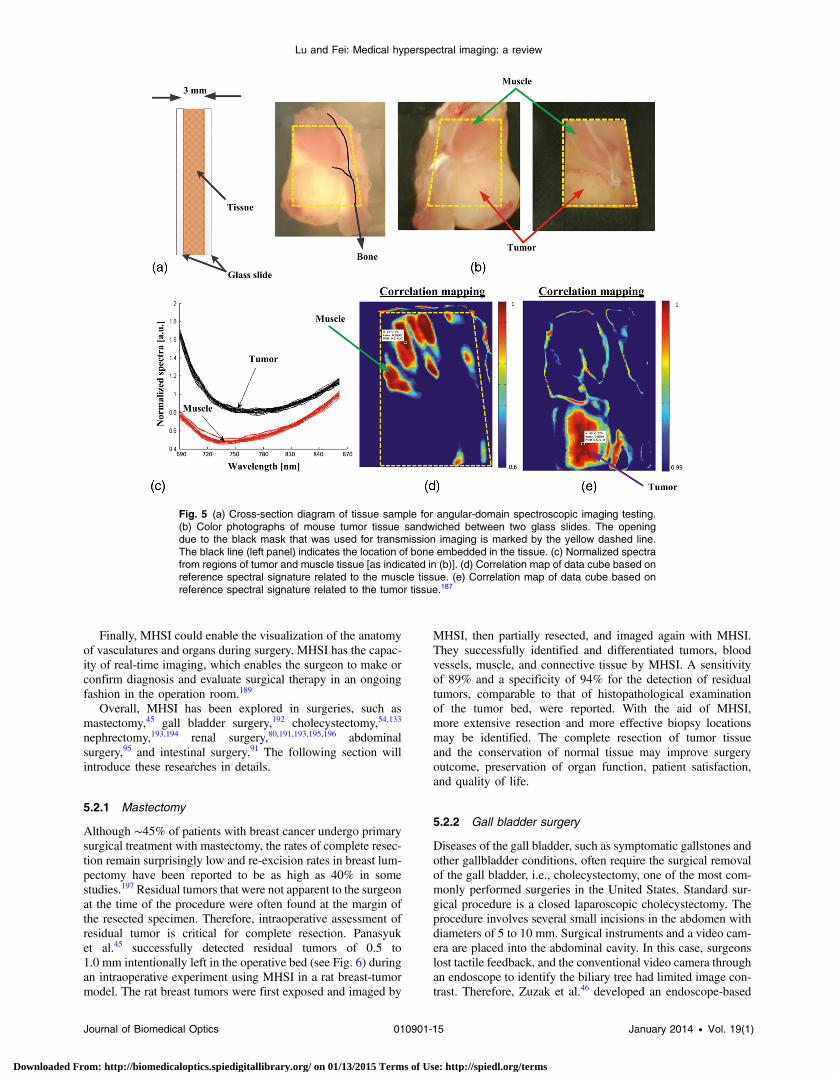
Finally, MHSI could enable the visualization of the anatomyof vasculatures and organs during surgery. MHSI has the capac-ity of real-time imaging, which enables the surgeon to make orconfirm diagnosis and evaluate surgical therapy in an ongoingfashion in the operation room.189
Overall, MHSI has been explored in surgeries, such asmastectomy,45 gall bladder surgery,192 cholecystectomy,54,133
nephrectomy,193,194 renal surgery,80,191,193,195,196 abdominalsurgery,95 and intestinal surgery.91 The following section willintroduce these researches in details.
5.2.1 Mastectomy
Although ∼45% of patients with breast cancer undergo primarysurgical treatment with mastectomy, the rates of complete resec-tion remain surprisingly low and re-excision rates in breast lum-pectomy have been reported to be as high as 40% in somestudies.197 Residual tumors that were not apparent to the surgeonat the time of the procedure were often found at the margin ofthe resected specimen. Therefore, intraoperative assessment ofresidual tumor is critical for complete resection. Panasyuket al.45 successfully detected residual tumors of 0.5 to1.0 mm intentionally left in the operative bed (see Fig. 6) duringan intraoperative experiment using MHSI in a rat breast-tumormodel. The rat breast tumors were first exposed and imaged by
MHSI, then partially resected, and imaged again with MHSI.They successfully identified and differentiated tumors, bloodvessels, muscle, and connective tissue by MHSI. A sensitivityof 89% and a specificity of 94% for the detection of residualtumors, comparable to that of histopathological examinationof the tumor bed, were reported. With the aid of MHSI,more extensive resection and more effective biopsy locationsmay be identified. The complete resection of tumor tissueand the conservation of normal tissue may improve surgeryoutcome, preservation of organ function, patient satisfaction,and quality of life.
5.2.2 Gall bladder surgery
Diseases of the gall bladder, such as symptomatic gallstones andother gallbladder conditions, often require the surgical removalof the gall bladder, i.e., cholecystectomy, one of the most com-monly performed surgeries in the United States. Standard sur-gical procedure is a closed laparoscopic cholecystectomy. Theprocedure involves several small incisions in the abdomen withdiameters of 5 to 10 mm. Surgical instruments and a video cam-era are placed into the abdominal cavity. In this case, surgeonslost tactile feedback, and the conventional video camera throughan endoscope to identify the biliary tree had limited image con-trast. Therefore, Zuzak et al.46 developed an endoscope-based
Fig. 5 (a) Cross-section diagram of tissue sample for angular-domain spectroscopic imaging testing.(b) Color photographs of mouse tumor tissue sandwiched between two glass slides. The openingdue to the black mask that was used for transmission imaging is marked by the yellow dashed line.The black line (left panel) indicates the location of bone embedded in the tissue. (c) Normalized spectrafrom regions of tumor and muscle tissue [as indicated in (b)]. (d) Correlation map of data cube based onreference spectral signature related to the muscle tissue. (e) Correlation map of data cube based onreference spectral signature related to the tumor tissue.187
Journal of Biomedical Optics 010901-15 January 2014 • Vol. 19(1)
Lu and Fei: Medical hyperspectral imaging: a review
Downloaded From: http://biomedicaloptics.spiedigitallibrary.org/ on 01/13/2015 Terms of Use: http://spiedl.org/terms

HSI system to identify the anatomy and molecular content oftissue during a laparoscopic surgery on swine. The studyshowed the utility of near-IR laparoscopic HSI for noninvasiveinterrogation and identification of tissues based on their chemi-cal composition in a real-time intraoperative manner and with-out radioactive contrast agent. They found that lipids absorbinglight at 930 nm could be used as an inherent biomarker for im-aging the lipid-containing bile ducts connecting the gall bladder,the location of which the surgeon needs to identify before cut-ting during cholecystectomy. In order to help surgeons delineatethe hepatoduodenal ligament anatomy to avoid causing seriousharm to the biliary tree, they133 also built a laparoscopic-capable,near-IR, HSI system for intraoperative biliary imaging in a pig,which enabled surgeons to see through the hepatoduodenalligament and visualize the anteriorly placed biliary system.
They again confirmed the common duct-reflected spectra of por-cine biliary structures to have a characteristic lipid shoulder at930 nm and a strong water peak at 970 nm. Venous structureshad absorption peaks at 760 nm (deoxyhemoglobin), 800 nm(oxyhemoglobin), and 970 nm (water). Arterial vessels hadabsorption peaks at 800 and 970 nm, which would be expectedfor oxyhemoglobin and water. Therefore, arterial vessels,venous structures, and bile ducts can be visualized throughthe hepatoduodenal ligament connective tissue during closedlaparoscopic procedures.
In an ex vivo tissue study, Mitra et al.54 used both reflectanceand fluorescence imaging to scan the biliary structure andimplemented advanced spectral analysis and image-processingalgorithms to classify the tissue types and to identify the biliaryanatomy. While fluorescence imaging provided dynamic
Fig. 6 (a) Photomicroscopic and corresponding medical hyperspectral imaging image from breasttumor in situ (4 × 3 cm) (upper left and upper middle panels). Resected tumor and surroundingtissue (5 × 7 mm) was stained with hematoxylin and eosin and evaluated by histopathology afterresection. Microscopic histological images with further resolution are displayed (right panels).(b) Representative examples of normal tissue (grade 0), benign tumor (grade 1), intraductal carcinomas(grade 2), papillary and cribriform carcinoma (grade 3), and carcinoma with invasion (grade 4) arerepresented.45
Fig. 7 (a) Photographic image of the biliary tissue structure. (b) Classification of the biliary tissue typesbased on hyperspectral imaging, superimposed with the fluorescence image of the encapsulate indoc-yanine green-loaded microballoons. The dual-mode image clearly identifies the biliary anatomy and itsrelative location with respect to the surrounding tissue components.
Journal of Biomedical Optics 010901-16 January 2014 • Vol. 19(1)
Lu and Fei: Medical hyperspectral imaging: a review
Downloaded From: http://biomedicaloptics.spiedigitallibrary.org/ on 01/13/2015 Terms of Use: http://spiedl.org/terms

information on movement and flow in the surgical region ofinterest, data from HSI allowed for identification of the bileduct (see Fig. 7) and safe exclusion of any contaminant fluores-cence from tissue that was not part of the biliary anatomy.
5.2.3 Renal surgery
Although open partial nephrectomy (OPN) is considered thegold-standard treatment for small (<4 cm) renal corticaltumors,198 laparoscopic partial nephrectomy (LPN) is alsoreported to achieve long-term oncologic outcomes comparableto those for OPN. To minimize the renal injuries caused byischemia during surgery, it is very important to monitor renalresponse to ischemia in real time. Holzer et al.193 reportedthe first experiment with a digital light processing (DLP)-based HSI system covering 520 to 645 nm for hemoglobin tononinvasively measure renal parenchymal HbO2 saturationand to determine the kidney response to hilar occlusion duringOPN. Olweny et al.194 recently conducted another clinical studyin 18 patients utilizing a DLP-based HSI to characterize renaloxygenation during robotic-assisted LPN. The laparoscopicHSI system successfully characterized dynamic changes inrenal oxygenation during LPN.
Renal hypothermia is often induced to lower the metabolicrate and to protect renal function during OPN, while warmischemia is used for LPN because there is no efficient and effec-tive method for inducing renal hypothermia laparoscopically.199
Using a digital light projection HSI system, Tracy et al.200
demonstrated that renal artery-only occlusion had a preliminarybenefit to the postoperative glomerular filtration rate after warmischemia during LPN in a porcine model.
To make HSI practical for real-time surgical use, Zuzaket al.80,191,195,196 proposed to use a DLP-based HSI systemthat successfully visualized chemical composition of in vivo tis-sues during renal surgical procedures noninvasively at nearvideo rate. The DLP HSI system used a programmable digitalmicro-mirror device capable of generating three processedimages per second and allowing the surgeon to visualize chemi-cal changes within fractions of a second. This overcame the pri-mary limitation of traditional wavelength-scanning methods thatcollected data on physiological changes in minutes. To comparethe capacity of the DLP NIR HSI system with that of the existentLCTF NIR HSI, Zuzak et al.80 performed studies on a porcinekidney during renal artery occlusion. The major differencebetween the two systems was their light source. Broadbandlight was discriminated into individual wavelengths in theLCTF system, which was replaced by the DLP light source
to illuminate the tissue using predetermined spectra. It turnedout that these two systems captured nearly identical spectrafor the surface of the kidney. In 2010, Zuzak et al.196 testedthe robustness of DLP HSI during OPN and other surgeries.The study showed the potential of DLP HSI in surface disordersvisible at or near the surface of the skin to in vivo tissue monitorduring surgery.
5.2.4 Abdominal surgery
Intestinal ischemia refers to a diminished intestinal blood flow,which compromises the delivery of oxygen and leads to theaccumulation of deoxygenated blood and waste products.These conditions result in cell death and necrosis, leading toinflammation and ulcers. Due to the anatomical variationsand unpredictable nature of surgeries, visibility is critical to cor-rectly diagnose these problems during surgery. MHSI was ableto distinguish differences among different tissues and organsand, therefore, allow surgeons to visualize and examinea vast area less invasively without actually removing tissue.Akbari et al.47,91,92 reported the use of MHSI as a visual support-ing tool to detect intestinal ischemia and anatomy of organsthrough abdominal surgery on pigs. They identified a keywavelength range of 765 to 830 nm, which provided the bestdifferentiation between normal and ischemic intestine. Spleen,colon, small intestine, urinary bladder, and peritoneum weresegmented based on their unique spectral signatures (see Fig. 8).It was demonstrated that MHSI could help surgeons visualizethe anatomy of blood vasculature, and differentiate betweenthe artery and vein during abdominal surgeries.95
6 DiscussionsOver the past 25 years, various studies have shown the excitingpotential of HSI techniques in medical applications. Based onthe technology by NASA for space exploration and Earth obser-vation, HSI acquires datasets that consist of 2-D images of spa-tial information and one spectral dimension at each pixel. HSIimages offer more wavelength channels than RGB images takenby the ordinary color camera; therefore they may carry moreuseful information than RGB images. Differences that appearsubtle to the human eye could be significant when looking atthe detailed spectra. In addition, wavelengths such as UV andSWIR, which are invisible to the human eye, can be capturedand analyzed by HSI, and can potentially reveal informationthat cannot be seen by the naked eye.
MHSI is a noninvasive, and nonionizing technology, whichprovides a quantitative way of solving medical problems, and it
Fig. 8 The RGB image is shown on the left side. Using the method described, the segmented image canbe viewed on the right side. Spleen is shown in red, peritoneum in pink, urinary bladder in blue, colon ingreen, and small intestine in yellow.
Journal of Biomedical Optics 010901-17 January 2014 • Vol. 19(1)
Lu and Fei: Medical hyperspectral imaging: a review
Downloaded From: http://biomedicaloptics.spiedigitallibrary.org/ on 01/13/2015 Terms of Use: http://spiedl.org/terms
may change the medical world in many ways. With the appli-cation of MHSI in the exploration of anatomy, physiology, andpathology, human vision has been extended into IR and near-IRwavelength regions. Due to the noninvasive nature, MHSI canbe used for optical biopsy, which involves in vivo diagnosis oftissue without the need for sample excision and processing.201
Blood volume is generally considered to increase during angio-genesis, and changes in blood oxygenation can be correlatedwith tumor metabolic activities.42 Therefore, MHSI can beemployed to map the spatial and temporal relationship of thedata and fully grasp the significance of blood oxygen deliveryand hypoxia at microvascular levels during tumor growth andangiogenesis.76 MHSI is also able to visualize chemical contentsof vessels and organs, and monitor tissue blood volume and oxy-genation during surgery. The use of MHSI does not requireintroduction of agents, which is advantageous compared to im-aging techniques that require contrast agents. Moreover, MHSIis able to provide us with real-time data interactively,189 whichenables its usage during surgical procedures.
However, the application of MHSI can be limited because itexamines only areas of tissue near the surface. The optical pen-etration depth is defined as the tissue thickness that reduces thelight intensity to 37% of the intensity at the surface. For a typicalperson, the optical penetration depth is 3.57 mm at 850 nmand 0.48 mm at 550 nm. While spectral signatures have littledependence on skin temperature over the NIR region, measuredradiance in the thermal infrared (8 to 12 μm) has a strongdependence on skin temperature.202 MHSI can also be limitedby the cost of HSI imaging systems and by the ability to extractrelevant information from large datasets.
HSI combines spectroscopy with imaging, capturing both thespectral and spatial information of biological samples underinvestigation and providing spatial mapping of parameters ofinterest in a noninvasive manner. Spectroscopy is a point-meas-urement method that measures only a limited number of points,so that the derived optical properties may be biased by localtissue inhomogeneities and important diagnostic informationcould be missed. Pressure caused by the contact probe mayalso affect the optical properties due to the altered localblood content, etc.203 Although spectroscopy has been exploredextensively for probing molecular, cellular, and tissue proper-ties204–206 and characterizing correlation of tissue parameterswith disease state,207 such fundamental research has not beeninvestigated vigorously in HSI. Therefore, fundamental researchabout the biological rationale of MHSI is necessary, and spec-troscopy can be used to validate HSI systems. It was argued thatcross-talk between spatial locations could occur when extendingto HSI, and the information extracted from one location mightbe influenced by neighboring locations.208 Martin et al.83 com-pared the average hyperspectral fluorescence over an area witha value obtained for one point on the tissue surface obtained byspectroscopy. They found that the major peaks were consistentbetween the HSI data and spectroscopic data.
HSI technology is an indirect strategy to extract a spatialmap of optical properties within the tissue since it deducesthe interaction coefficients from measurements of reflectanceand transmittance.209 This is an ill-posed inverse problem withno unique solution.210 It is possible for two media of substan-tially different optical properties to yield very similar opticalmeasurements, such as the diffuse reflectance and transmit-tance.209 In practice, it is difficult to eliminate the ambiguitiesof matching spectral profiles with biological samples, and
therefore, the presence of the fundamental nonuniqueness isanother limitation of HSI.
HSI can measure significant amounts of spectral informationfrom a large area of tissue. Most literature reported the feasibil-ity of a certain MHSI application without in-depth analysis ofthe image data obtained. Some results may suffer from a lack ofgenerality because the image datasets are usually constrained toa specific instrument. Therefore, accessible, accurate, and up-to-date spectral databases of tissues, cells, and molecules for vari-ous diseases are needed in order to offer a valuable tool fordisease diagnosis and treatment. For example, each subtype ofrenal tumors, such as clear cell, chromophobe, oncocytoma,papillary, and angiomyolipoma, can have different morphologi-cal and molecular characteristics and thus lead to the differencesin spectra signature. Therefore, a spectral library for renaltumors may be able to provide the reference spectra in orderto aid the interpretation of hyperspectral images. Furthermore,advanced data-mining methods are to be investigated in order tofully utilize the abundant spectral and spatial information pro-vided by MHSI.
With the increasing integration with other techniques, suchas microscope, colposcope, laparoscope, and fundus camera,MSHI is becoming an essential part of medical imaging tech-niques, which provides important information at the molecular,cellular, tissue, and organ levels for potential clinical use.
7 ConclusionHSI technology acquires a 3-D image cube with two spatialdimensions and one spectral dimension in a noninvasive mannerand in real time. Each pixel in the hypercube can be character-ized by a spectral curve, which can range from UV to IR region.Spatially resolved spectra obtained by HSI provide diagnosticinformation about the tissue physiology, morphology, andcomposition. Furthermore, HSI can be easily adapted to otherconventional techniques, such as microscopy, fundus camera,colposcopy, etc. As an emerging imaging technology, MHSIhas been explored in a variety of laboratory experiments andclinical trials, which strongly suggested that HSI has a greatpotential for improving accuracy and reliability in disease detec-tion, diagnosis, monitoring, and image-guided surgeries.
Three major challenges confront the development and appli-cations of HSI technology. The first challenge is the acquisitionof high-resolution HSI datasets in video rates. Real-time acquis-ition will facilitate intraoperative imaging of the organs, tissues,cells, and molecular biomarkers of interest. Higher spectral andspatial resolution and a larger database of tissue spectra will pro-vide more spatial and spectral information and may potentiallycapture more subtle spectral and spatial variations of differenttissue types.
The second challenge involves the fast processing of the vastamount of datasets acquired by HSI, including the extractionof the high-quality diagnostic information, and generation ofa quantitative map of different tissue types as well as disease-specific endogenous substances. Advanced classificationalgorithms will enable better differentiation between healthy,premalignant, and malignant tissue, and more precise delinea-tion of cancer margins for image-guided biopsy and surgery.Advanced spectral unmixing algorithms offer insight into thecorrelation between intrinsic biomarkers and disease states,and facilitate the identification of biomarkers for early cancerdetection by recovering subpixel compositional information.
Journal of Biomedical Optics 010901-18 January 2014 • Vol. 19(1)
Lu and Fei: Medical hyperspectral imaging: a review
Downloaded From: http://biomedicaloptics.spiedigitallibrary.org/ on 01/13/2015 Terms of Use: http://spiedl.org/terms

The third challenge lies in the establishment of a large spectradatabase for important molecular biomarkers and all types oftissue, including skin and subcutaneous tissue, ocular tissue,head/brain tissue, epithelial/mucous tissue, breast tissue, carti-lage, liver, muscle, aorta, lung, myocardium, etc. Such a data-base will make it possible to distinguish not only betweenoxygenated and deoxygenated blood, but also between differenttissue types, such as bile duct and the fatty tissue surroundingit.196 The identification of the molecular biomarkers can alsobenefit early cancer detection.
During the past two decades, HSI technology has undergonefast development in terms of hardware and systems, and hasfound numerous applications in medical domain. However,most MHSI only explores the UV, VIS, and NIR regions oflight. Exploration of HSI on disease detection, diagnosis, andmonitoring in the mid-IR region may bring new insights intothe medical field. Moreover, combination with other imagingmodalities, such as preoperative positron emission tomographyand intraoperative ultrasound, can leverage the key benefits ofeach technique individually, overcome the penetration limitationof HSI into biological tissue,211 and broaden the applicationfields of HSI. In clinical settings, HSI can be easily adaptedto conventional diagnostic tools, such as endoscope, colpo-scope, etc., to meet demanding requirements by various medicalapplications. Multimodal imaging combining reflectance andfluorescence has the potential of revealing more informationabout tissue under investigation. The clinical applicability ofMHSI is clearly still in its adolescence and requires muchmore validation before it can be used safely and effectivelyin clinics. With the advancement of hardware technologies,image analysis methods, and computational power, we expectthat HSI will play an important role for noninvasive diseasediagnosis and monitoring, identification and quantitative analy-sis of cancer biomarkers, image-guided minimum invasive sur-gery, targeted drug delivery and tracking, and pharmaceuticaldrug dosage assessment.
AcknowledgmentsThis research is supported in part by National Institute ofHealth grants (R01CA156775 and R21CA176684), GeorgiaResearch Alliance Distinguished Scientists Award, EmorySPORE in Head and Neck Cancer (NIH P50CA128613), andEmory Molecular and Translational Imaging Center (NIHP50CA128301).
References1. W. L. Wolfe, Introduction to Imaging Spectrometers, SPIE Press,
Bellingham, Washington (1997).2. A. F. H. Goetz, “Three decades of hyperspectral remote sensing of the
Earth: a personal view,” Remote Sens. Environ. 113(Suppl. 1), S5–S16(2009).
3. C. Fischer and I. Kakoulli, “Multispectral and hyperspectral imagingtechnologies in conservation: current research and potential applica-tions,” Stud. Conserv. 7, 3–16 (2006).
4. H. Liang, “Advances in multispectral and hyperspectral imaging forarchaeology and art conservation,” Appl. Phys. A 106(2), 309–323(2012).
5. M. Govender, K. Chetty, and H. Bulcock, “A review of hyperspectralremote sensing and its application in vegetation and water resourcestudies,” Water SA 33(2), 145–151 (2007).
6. E. Adam, O. Mutanga, and D. Rugege, “Multispectral and hyperspec-tral remote sensing for identification and mapping of wetland vegeta-tion: a review,” Wetlands Ecol. Manage. 18(3), 281–296 (2010).
7. A. A. Gowen et al., “Hyperspectral imaging—an emerging processanalytical tool for food quality and safety control,” Trends FoodSci. Technol. 18(12), 590–598 (2007).
8. Y. Z. Feng and D. W. Sun, “Application of hyperspectral imaging infood safety inspection and control: a review,” Crit. Rev. Food Sci. Nutr.52(11), 1039–1058 (2012).
9. G. J. Edelman et al., “Hyperspectral imaging for non-contact analysisof forensic traces,” Forensic Sci. Int. 223(1–3), 28–39 (2012).
10. D. B. Malkoff and W. R. Oliver, “Hyperspectral imaging applied toforensic medicine,” Proc. SPIE 3920, 108–116 (2000).
11. J. Kuula et al., “Using VIS/NIR and IR spectral cameras for detectingand separating crime scene details,” Proc. SPIE 8359, 83590P (2012).
12. R. L. Schuler, P. E. Kish, and C. A. Plese, “Preliminary observations onthe ability of hyperspectral imaging to provide detection and visuali-zation of bloodstain patterns on black fabrics,” J. Forensic Sci. 57(6),1562–1569 (2012).
13. O. Carrasco et al., “Hyperspectral imaging applied to medical diagno-ses and food safety,” Proc. SPIE 5097, 215–221 (2003).
14. M. A. Afromowitz et al., “Multispectral imaging of burn wounds:a new clinical instrument for evaluating burn depth,” IEEE Trans.Biomed. Eng. 35(10), 842–850 (1988).
15. G. Zonios et al., “Diffuse reflectance spectroscopy of human adenoma-tous colon polyps in vivo,” Appl. Opt. 38(31), 6628–6637 (1999).
16. L. V. Wang and H.-I. Wu, “Introduction,” in Biomedical Optics, pp. 1–15, John Wiley & Sons Inc., Hoboken, New Jersey (2009).
17. B. Costas, P. Christos, and E. George, “Multi/hyper-spectral imaging,”in Handbook of Biomedical Optics, pp. 131–164, CRC Press (2011).
18. V. V. Tuchin and V. Tuchin, Tissue Optics: Light Scattering Methodsand Instruments for Medical Diagnosis, SPIE Press, Bellingham (2007).
19. D. G. Ferris et al., “Multimodal hyperspectral imaging for the noninva-sive diagnosis of cervical neoplasia,” J. Low. Genit. Tract Dis. 5(2),65–72 (2001).
20. M. C. Pierce et al., “Accuracy of in vivo multimodal optical imagingfor detection of oral neoplasia,” Cancer Prev. Res. 5(6), 801–809(2012).
21. R. Salzer et al., “Infrared and Raman imaging of biological andbiomimetic samples,” Fresenius J. Anal. Chem. 366(6–7), 712–726(2000).
22. C. Gendrin, Y. Roggo, and C. Collet, “Pharmaceutical applications ofvibrational chemical imaging and chemometrics: a review,” J. Pharm.Biomed. Anal. 48(3), 533–553 (2008).
23. M. Patterson, B. Wilson, and D. Wyman, “The propagation of opticalradiation in tissue I. Models of radiation transport and their applica-tion,” Lasers Med. Sci. 6(2), 155–168 (1991).
24. M. Joel and V.-D. Tuan, “Optical properties of tissue,” Chapter 2 inBiomedical Photonics Handbook, pp. 1–76, CRC Press, Boca Raton,Florida (2003).
25. Y. Zhang et al., “Visible and near-infrared spectroscopy for distin-guishing malignant tumor tissue from benign tumor and normal breasttissues in vitro,” J. Biomed. Opt. 18(7), 077003 (2013).
26. A. Welch, M. C. Gemert, and W. Star, “Definitions and overview oftissue optics,” in Optical-Thermal Response of Laser-IrradiatedTissue, A. J. Welch and M. J. C. Gemert, Eds., pp. 27–64, Springer,Netherlands (2011).
27. A. Roggan et al., “The optical properties of biological tissue in the nearinfrared wavelength range: review and measurements,” in Laser-Induced Interstitial Thermotherapy Workshop, pp. 10–44, SPIE,Bellingham, Washington (1995).
28. J. A. Freeberg et al., “The performance of fluorescence and reflectancespectroscopy for the in vivo diagnosis of cervical neoplasia; pointprobe versus multispectral approaches,” Gynecol. Oncol. 107(1),S248–S255 (2007).
29. V.-D. Tuan and M. C. Brian, “Fluorescence spectroscopy for biomedi-cal diagnostics,” Chapter 28 in Biomedical Photonics Handbook,pp. 1–51, CRC Press, Boca Raton, Florida (2003).
30. V. T. Valery, “Light-tissue interactions,” Chapter 3 in BiomedicalPhotonics Handbook, pp. 1–27, CRC Press, Boca Raton, Florida(2003).
31. M. Sasha, M. Jelena, and F. Michael, “Reflectance spectroscopy,”in Handbook of Biomedical Optics, pp. 103–130, CRC Press (2011).
32. D. Roblyer et al., “Multispectral optical imaging device for in vivodetection of oral neoplasia,” J. Biomed. Opt. 13(2), 024019 (2008).
Journal of Biomedical Optics 010901-19 January 2014 • Vol. 19(1)
Lu and Fei: Medical hyperspectral imaging: a review
Downloaded From: http://biomedicaloptics.spiedigitallibrary.org/ on 01/13/2015 Terms of Use: http://spiedl.org/terms
33. K. R. Koh et al., “Visible and near infrared autofluorescence andhyperspectral imaging spectroscopy for the investigation of colorectallesions and detection of exogenous fluorophores,” Proc. SPIE 7169,71691E (2009).
34. J. M. Benavides et al., “Multispectral digital colposcopy for in vivodetection of cervical cancer,” Opt. Express 11(10), 1223–1236 (2003).
35. S. Shah et al., “Cutaneous wound analysis using hyperspectral imag-ing,” Biotechniques 34(2), 408–413 (2003).
36. K. R. Bambery et al., “Fourier transform infrared imaging and unsu-pervised hierarchical clustering applied to cervical biopsies,” Aust. J.Chem. 57(12), 1139–1143 (2004).
37. R. L. Greenman et al., “Early changes in the skin microcirculation andmuscle metabolism of the diabetic foot,” Lancet 366(9498), 1711–1717 (2005).
38. B. S. Sorg et al., “Hyperspectral imaging of hemoglobin saturation intumor microvasculature and tumor hypoxia development,” J. Biomed.Opt. 10(4), 44004 (2005).
39. S. G. Kong, M. E. Martin, and T. Vo-Dinh, “Hyperspectral fluores-cence imaging for mouse skin tumor detection,” Anglais 28(6),770–776 (2006).
40. L. C. Cancio et al., “Hyperspectral imaging: a new approach to thediagnosis of hemorrhagic shock,” J. Trauma Acute Care Surg. 60(5),1087–1095 (2006).
41. D. T. Dicker et al., “Differentiation of normal skin and melanomausing high resolution hyperspectral imaging,” Cancer Biol. Ther. 5(8),1033–1038 (2006).
42. L. L. Randeberg et al., “Hyperspectral imaging of bruised skin,” Proc.SPIE 6078, 60780O (2006).
43. L. L. Randeberg and J. Hernandez-Palacios, “Hyperspectral imagingof bruises in the SWIR spectral region,” Proc. SPIE 8207, 82070N(2012).
44. W. R. Johnson et al., “Snapshot hyperspectral imaging in ophthalmol-ogy,” J. Biomed. Opt. 12(1), 014036 (2007).
45. S. V. Panasyuk et al., “Medical hyperspectral imaging to facilitateresidual tumor identification during surgery,” Cancer Biol. Ther. 6(3),439–446 (2007).
46. K. J. Zuzak et al., “Characterization of a near-infrared laparoscopichyperspectral imaging system for minimally invasive surgery,”Anal. Chem. 79(12), 4709–4715 (2007).
47. H. Akbari et al., “Detection and analysis of the intestinal ischemiausing visible and invisible hyperspectral imaging,” IEEE Trans.Biomed. Eng. 57(8), 2011–2017 (2010).
48. H. Akbari et al., “Cancer detection using infrared hyperspectral imag-ing,” Cancer Sci. 102(4), 852–857 (2011).
49. R. T. Kester et al., “Real-time snapshot hyperspectral imaging endo-scope,” J. Biomed. Opt. 16(5), 056005 (2011).
50. E. L. P. Larsen et al., “Hyperspectral imaging of atheroscleroticplaques in vitro,” J. Biomed. Opt. 16(2), 026011 (2011).
51. D. Yudovsky et al., “Assessing diabetic foot ulcer development risk withhyperspectral tissue oximetry,” J. Biomed. Opt. 16(2), 026009 (2011).
52. H. Akbari et al., “Hyperspectral imaging and quantitative analysis forprostate cancer detection,” J. Biomed. Opt. 17(7), 076005 (2012).
53. R. Martin, B. Thies, and A. Gerstner, “Hyperspectral hybrid methodclassification for detecting altered mucosa of the human larynx,” Int. J.Health Geogr. 11(1), 21 (2012).
54. K. Mitra et al., “Indocyanine-green-loaded microballoons for biliaryimaging in cholecystectomy,” J. Biomed. Opt. 17(11), 116025 (2012).
55. T. E. Renkoski, K. D. Hatch, and U. Utzinger, “Wide-field spectral im-aging of human ovary autofluorescence and oncologic diagnosis via pre-viously collected probe data,” J. Biomed. Opt. 17(3), 036003 (2012).
56. J. G. Rosas and M. Blanco, “A criterion for assessing homogeneitydistribution in hyperspectral images. Part 2: application of homo-geneity indices to solid pharmaceutical dosage forms,” J. Pharm.Biomed. Anal. 70(0), 691–699 (2012).
57. P. Usenik et al., “Evaluation of cross-polarized near infrared hyper-spectral imaging for early detection of dental caries,” Proc. SPIE8208, 82080G (2012).
58. Y. Guan et al., “Pathological leucocyte segmentation algorithm basedon hyperspectral imaging technique,” Opt. Eng. 51(5), 053202 (2012).
59. Q. Li et al., “Nerve fibers identification based on molecular hyperspec-tral imaging technology,” in IEEE Int. Conf. on Computer Science andAutomation Engineering, Zhangjiajie, China, pp. 15–17 (2012).
60. S. Kumar et al., “Change in the microenvironment of breast cancerstudied by FTIR imaging,” Analyst 138(14), 4058–4065 (2013).
61. R. G. Sellar and G. D. Boreman, “Classification of imaging spectrom-eters for remote sensing applications,”Opt. Eng. 44(1), 013602 (2005).
62. P. Colarusso et al., “Infrared spectroscopic imaging: from planetary tocellular systems,” Appl. Spectrosc. 52(3), 106A–120A (1998).
63. L. W. Schumann and T. S. Lomheim, “Infrared hyperspectral imagingFourier transform and dispersive spectrometers: comparison of signal-to-noise-based performance,” Proc. SPIE 4480, 1–14 (2002).
64. P. Lasch and D. Naumann, “FT-IR microspectroscopic imaging ofhuman carcinoma thin sections based on pattern recognition tech-niques,” Cell. Mol. Biol. (Noisy-le-Grand) 44(1), 189–202 (1998).
65. K. Yano et al., “Direct measurement of human lung cancerous andnoncancerous tissues by Fourier transform infrared microscopy: canan infrared microscope be used as a clinical tool?,” Anal. Biochem.287(2), 218–225 (2000).
66. S. Argov et al., “Diagnostic potential of Fourier-transform infraredmicrospectroscopy and advanced computational methods in coloncancer patients,” J. Biomed. Opt. 7(2), 248–254 (2002).
67. B. R. Wood et al., “Fourier transform infrared (FTIR) spectral mappingof the cervical transformation zone, and dysplastic squamous epi-thelium,” Gynecol. Oncol. 93(1), 59–68 (2004).
68. M. J. Romeo andM. Diem, “Infrared spectral imaging of lymph nodes:strategies for analysis and artifact reduction,” Vib. Spectrosc. 38(1–2),115–119 (2005).
69. H. Fenniri et al., “Classification of spectroscopically encoded resinsby Raman mapping and infrared hyperspectral imaging,” J. Comb.Chem. 8(2), 192–198 (2006).
70. A. Boskey and N. P. Camacho, “FT-IR imaging of native and tissue-engineered bone and cartilage,” Biomaterials 28(15), 2465–2478(2007).
71. M. Berman et al., “ICE: a new method for the multivariate curveresolution of hyperspectral images,” J. Chemom. 23(2), 101–116(2009).
72. M. Isabelle, K. Rogers, and N. Stone, “Correlation mapping: rapidmethod for identification of histological features and pathologicalclassification in mid infrared spectroscopic images of lymph nodes,”J. Biomed. Opt. 15(2), 026030 (2010).
73. M. Verdonck et al., “Breast cancer and melanoma cell line identifica-tion by FTIR imaging after formalin-fixation and paraffin-embedding,”Analyst 138(14), 4083–4091 (2013).
74. P. A. Bernhardt, “Direct reconstruction methods for hyperspectralimaging with rotational spectrotomography,” Opt. Soc. Am. 12(9),1884–1901 (1995).
75. A. D. Elliott et al., “Real-time hyperspectral fluorescence imaging ofpancreatic beta-cell dynamics with the image mapping spectrometer,”J. Cell Sci. 125(20), 4833–4840 (2012).
76. A. A. Fawzi et al., “Recovery of macular pigment spectrum in vivousing hyperspectral image analysis,” J. Biomed. Opt. 16(10), 106008(2011).
77. R. T. Kester, N. Bedard, and T. S. Tkaczyk, “Image mapping spectrom-etry: a novel hyperspectral platform for rapid snapshot imaging,” Proc.SPIE 8048, 80480J (2011).
78. G. Bellisola and C. Sorio, “Infrared spectroscopy and microscopy incancer research and diagnosis,” Am. J. Cancer Res. 2(1), 1–21 (2012).
79. A. Nouvong et al., “Evaluation of diabetic foot ulcer healing withhyperspectral imaging of oxyhemoglobin and deoxyhemoglobin,”Diabetes Care 32(11), 2056–2061 (2009).
80. K. J. Zuzak et al., “Hyperspectral imaging utilizing LCTF and DLPtechnology for surgical and clinical applications,” Proc. SPIE 7170,71700C (2009).
81. A. M. Siddiqi et al., “Use of hyperspectral imaging to distinguish nor-mal, precancerous, and cancerous cells,” Cancer Cytopathol. 114(1),13–21 (2008).
82. D.-W. Sun, Hyperspectral Imaging for Food Quality Analysis andControl, Academic Press Inc., London, UK (2010).
83. M. E. Martin et al., “An AOTF-based dual-modality hyperspectralimaging system (DMHSI) capable of simultaneous fluorescence andreflectance imaging,” Med. Eng. Phys. 28(2), 149–155 (2006).
84. M. Maggioni et al., “Hyperspectral microscopic analysis of normal,benign and carcinoma microarray tissue sections,” Proc. SPIE 6091,60910I (2006).
Journal of Biomedical Optics 010901-20 January 2014 • Vol. 19(1)
Lu and Fei: Medical hyperspectral imaging: a review
Downloaded From: http://biomedicaloptics.spiedigitallibrary.org/ on 01/13/2015 Terms of Use: http://spiedl.org/terms
85. Q. Li et al., “Study on microscope hyperspectral medical imagingmethod for biomedical quantitative analysis,” Chin. Sci. Bull. 53(9),1431–1434 (2008).
86. P. A. Bautista and Y. Yagi, “Digital simulation of staining in histopa-thology multispectral images: enhancement and linear transformationof spectral transmittance,” J. Biomed. Opt. 17(5), 056013 (2012).
87. Bausch and Lomb, Diffraction Grating Handbook, Bausch & LombAnalytical Systems Division, Rochester, New York (1970).
88. M. Aikio, “Hyperspectral prism-grating-prism imaging spectrograph,”Ph.D. Thesis, Technical Research Centre of Finland (2001).
89. B. Khoobehi, J. M. Beach, and H. Kawano, “Hyperspectral imagingfor measurement of oxygen saturation in the optic nerve head,” Invest.Ophthalmol. Vis. Sci. 45(5), 1464–1472 (2004).
90. T. Vaarala, M. Aikio, and H. Keraenen, “An advanced prism-grating-prism imaging spectrograph in on-line industrial applications,” Proc.SPIE 3101, 322–330 (1997).
91. H. Akbari et al., “Hyperspectral imaging and diagnosis of intestinalischemia,” in 30th Annual Int. Conf. of the IEEE Engineering inMedicine and Biology Society, Vancouver, BC, pp. 1238–1241 (2008).
92. H. Akbari et al., “Wavelet-based compression and segmentation ofhyperspectral images in surgery,” in Medical Imaging andAugmented Reality, pp. 142–149, Springer Berlin Heidelberg (2008).
93. S. T. Monteiro et al., “Towards applying hyperspectral imagery as anintraoperative visual aid tool,” in Proc. 4th Int. Conf. on Visualization,Imaging and Image Processing, Marbella, Spain, pp. 483–488 (2004).
94. M. Ishihara et al., “Modification of measurement methods for evalu-ation of tissue-engineered cartilage function and biochemical proper-ties using nanosecond pulsed laser,” Proc. SPIE 6858, 685805 (2008).
95. H. Akbari et al., “Blood vessel detection and artery-vein differentia-tion using hyperspectral imaging,” in Annual Int. Conf. of the IEEEEngineering in Medicine and Biology Society, Minneapolis, Minnesota,pp. 1461–1464 (2009).
96. F. Blanco et al., “Hyperspectral imaging based method for fast charac-terization of kidney stone types,” J. Biomed. Opt. 17(7), 076027 (2012).
97. D. Hattery et al., “Hyperspectral imaging of Kaposi’s sarcoma for dis-ease assessment and treatment monitoring,” in Proc. 31st AppliedImagery Pattern Recognition Workshop, Washington, DC, pp. 124–130 (2002).
98. A. J. Chaudhari et al., “Hyperspectral and multispectral biolumines-cence optical tomography for small animal imaging,” Phys. Med.Biol. 50(23), 5421–5441 (2005).
99. M. H. Chen et al., “Development of a thermal and hyperspectral im-aging system for wound characterization and metabolic correlation,”Johns Hopkins APL Technical Digest 26(1), 67–74 (2005).
100. R. Jolivot, P. Vabres, and F. Marzani, “Reconstruction of hyperspectralcutaneous data from an artificial neural network-based multispectralimaging system,” Comput. Med. Imaging Graph. 35(2), 85–88 (2011).
101. N. Gat, “Imaging spectroscopy using tunable filters: a review,” Proc.SPIE 4056, pp. 50–64 (2000).
102. J. Hartke and E. L. Dereniak, “Snapshot dual-band visible hyperspec-tral imaging spectrometer,” Opt. Eng. 46(1), 013201 (2007).
103. A. Rogalski, “Progress in focal plane array technologies,” Prog.Quantum Electron. 36(2–3), 342–473 (2012).
104. V.-D. Tuan, “Basic instrumentation in photonics,” Chapter 6 inBiomedical Photonics Handbook, pp. 1–30, CRC Press, Boca Raton,Florida (2003).
105. K. J. Zuzak et al., “Visible and infrared hyperspectral visualization ofnormal and ischemic tissue,” in [Engineering in Medicine and Biology,1999. 21st Annual Conference and the 1999 Annual Fall Meeting ofthe Biomedical Engineering Society] BMES/EMBS Conference, 1999.Proceedings of the First Joint, Atlanta, Georgia, p. 1118 (1999).
106. K. J. Zuzak et al., “Visible spectroscopic imaging studies of normaland ischemic dermal tissue,” Proc. SPIE 3918, 17–26 (2000).
107. K. J. Zuzak et al., “Visible reflectance hyperspectral imaging: charac-terization of a noninvasive, in vivo system for determining tissue per-fusion,” Anal. Chem. 74(9), 2021–2028 (2002).
108. S. G. Kong et al., “Hyperspectral fluorescence image analysis foruse in medical diagnostics,” in Advanced Biomedical and ClinicalDiagnostic Systems III, San Jose, California, pp. 21–28 (2005).
109. T. Vo-Dinh, F. Yan, and M. B. Wabuyele, “Surface-enhanced Ramanscattering for medical diagnostics and biological imaging,” J. RamanSpectrosc. 36(6–7), 640–647 (2005).
110. C. Li et al., “A three-dimensional multispectral fluorescence opticaltomography imaging system for small animals based on a conicalmirror design,” Opt. Express 17(9), 7571 (2009).
111. P. Constantinou et al., “A high-resolution MACROscope with differ-ential phase contrast, transmitted light, confocal fluorescence, andhyperspectral capabilities for large-area tissue imaging,” IEEE J.Sel. Topics Quantum Electron. 11(4), 766–777 (2005).
112. J. Katrašnik, F. Pernuš, and B. Likar, “Illumination system characteri-zation for hyperspectral imaging,” Proc. SPIE 7891, 78910T (2011).
113. Y. Hirohara et al., “Validity of retinal oxygen saturation analysis:hyperspectral imaging in visible wavelength with fundus cameraand liquid crystal wavelength tunable filter,” Opt. Rev. 14(3), 151–158 (2007).
114. X. Liu, D. A. Rice, and B. Khoobehi, “Spectral reflectance of the ocu-lar fundus as a diagnostic marker for cerebral malaria,” Proc. SPIE8229, 82290H (2012).
115. S. Begin et al., “Coherent anti-Stokes Raman scattering hyperspectraltissue imaging with a wavelength-swept system,” Biomed. Opt.Express 2(5), 1296–1306 (2011).
116. H. Tsurui et al., “Hyperspectral imaging of pathology samples,” Proc.SPIE 3605, 273–281 (1999).
117. K. Masood et al., “Hyperspectral colon tissue classification usingmorphological analysis,” in Int. Conf. on Emerging Technologies,Peshawar, pp. 735–741 (2006).
118. K. Masood and N. Rajpoot, “Spatial analysis for colon biopsy classi-fication from hyperspectral imagery,” Ann. BMVA 2008(4), 1–16(2008).
119. L. L. Randeberg, E. L. P. Larsen, and L. O. Svaasand, “Hyperspectralimaging of blood perfusion and chromophore distribution in skin,”Proc. SPIE 7161, 71610C (2009).
120. G. M. Palmer et al., “Optical imaging of tumor hypoxia dynamics,”J. Biomed. Opt. 15(6), 066021 (2010).
121. J. Schweizer et al., “Hyperspectral imaging—a new modality for eyediagnostics,” Biomed. Tech. 57(Suppl 1), 293–296 (2012).
122. U. Maeder et al., “Evaluation and quantification of spectral informa-tion in tissue by confocal microscopy,” J. Biomed. Opt. 17(10), 106011(2012).
123. R. A. Schultz et al., “Hyperspectral imaging: a novel approach formicroscopic analysis,” Cytometry 43(4), 239–247 (2001).
124. P. Constantinou, R. S. Dacosta, and B. C. Wilson, “Extendingimmunofluorescence detection limits in whole paraffin-embeddedformalin fixed tissues using hyperspectral confocal fluorescenceimaging,” J. Microsc. 234(2), 137–146 (2009).
125. D. Landgrebe, “Hyperspectral image data analysis,” IEEE SignalProcess. Mag. 19(1), 17–28 (2002).
126. Z. Liu, H. J. Wang, and Q. L. Li, “Tongue tumor detection in medicalhyperspectral images,” Sensors 12(1), 162–174 (2012).
127. M. G. Sowa et al., “Visible-near infrared multispectral imaging ofthe rat dorsal skin flap,” J. Biomed. Opt. 4(4), 474–481 (1999).
128. R. Gillies et al., “Systemic effects of shock and resuscitation monitoredby visible hyperspectral imaging,” Diabetes Technol. Ther. 5(5), 847–855 (2003).
129. H. Lange et al., “Reflectance and fluorescence hyperspectral elasticimage registration,” Proc. SPIE 5370, 335–345 (2004).
130. A. Plaza et al., “Recent advances in techniques for hyperspectral imageprocessing,” Remote Sens. Environ. 113(Suppl. 1), S110–S122 (2009).
131. M. Fauvel et al., “Advances in spectral–spatial classification of hyper-spectral images,” Proc. IEEE 101(3), 652–675 (2013).
132. C. Rodarmel and J. Shan, “Principal component analysis for hyper-spectral image classification,” Survey. Land Inform. Syst. 62(2),115–122 (2002).
133. K. J. Zuzak et al., “Intraoperative bile duct visualization using near-infrared hyperspectral video imaging,” Am. J. Surg. 195(4), 491–497(2008).
134. A. O. H. Gerstner et al., “Hyperspectral imaging of mucosal surfaces inpatients,” J. Biophotonics 5(3), 255–262 (2012).
135. X. Zhang and C. H. Chen, “New independent component analysismethod using higher order statistics with application to remote sensingimages,” Opt. Eng. 41(7), 1717–1728 (2002).
136. D. Lu and Q. Weng, “A survey of image classification methods andtechniques for improving classification performance,” Int. J. RemoteSens. 28(5), 823–870 (2007).
Journal of Biomedical Optics 010901-21 January 2014 • Vol. 19(1)
Lu and Fei: Medical hyperspectral imaging: a review
Downloaded From: http://biomedicaloptics.spiedigitallibrary.org/ on 01/13/2015 Terms of Use: http://spiedl.org/terms
137. F. Melgani and L. Bruzzone, “Classification of hyperspectral remotesensing images with support vector machines,” IEEE Trans. Geosci.Remote Sens. 42(8), 1778–1790 (2004).
138. Z. Liu et al., “Automated tongue segmentation in hyperspectral imagesfor medicine,” Appl. Opt. 46(34), 8328–8334 (2007).
139. Z. Liu et al., “Classification of hyperspectral medical tongue imagesfor tongue diagnosis,” Comput. Med. Imaging Graph. 31(8), 672–678(2007).
140. H. Akbari et al., “Detection of cancer metastasis using a novel macro-scopic hyperspectral method,” Proc. SPIE 8317, 831711 (2012).
141. S. Kong and L.-J. Park, “Hyperspectral image analysis for skin tumordetection,” in Augmented Vision Perception in Infrared, R. Hammoud,Eds., pp. 155–171, Springer, London (2009).
142. K. Masood and N. Rajpoot, “Texture based classification of hyper-spectral colon biopsy samples using CLBP,” in IEEE Int. Symp. onBiomedical Imaging: From Nano to Macro, Boston, Massachusetts,pp. 1011–1014 (2009).
143. K. Rajpoot and N. Rajpoot, “SVM optimization for hyperspectralcolon tissue cell classification,” Lec. Notes Comput. Sci. 3217,829–837 (2004).
144. M. Fauvel et al., “Spectral and spatial classification of hyperspectraldata using SVMs and morphological profiles,” IEEE Trans. Geosci.Remote Sens. 46(11), 3804–3814 (2008).
145. G. Hughes, “On the mean accuracy of statistical pattern recognizers,”IEEE Trans. Inf. Theory 14(1), 55–63 (1968).
146. C. Cortes and V. Vapnik, “Support vector machine,” Mach. Learn.20(3), 273–297 (1995).
147. C.-C. Chang and C.-J. Lin, “LIBSVM: a library for support vectormachines,” ACM Trans. Intell. Syst. Technol. 2(3), 1–27 (2011).
148. N. Keshava and J. F. Mustard, “Spectral unmixing,” IEEE SignalProcess. Mag. 19(1), 44–57 (2002).
149. L. C. Parra et al., “Unmixing hyperspectral data,” in Advances inNeural Information Processing Systems 12 (Proc. NIPS’99),Colorado, pp. 942–948 (1999).
150. L. C. Cancio, “Application of novel hyperspectral imaging technolo-gies in combat casualty care,” Proc. SPIE 7596, 759605 (2010).
151. J. A. Chin, E. C. Wang, and M. R. Kibbe, “Evaluation of hyperspectraltechnology for assessing the presence and severity of peripheral arterydisease,” J. Vasc. Surg. 54(6), 1679–1688 (2011).
152. A. O. N. Joseph, “Hyperspectral optical imaging for detection,diagnosis and staging of cancer,” Ph.D. Dissertation, University ofSouthern California (2012).
153. K. Sokolov, M. Follen, and R. Richards-Kortum, “Optical spectros-copy for detection of neoplasia,” Curr. Opin. Chem. Biol. 6(5),651–658 (2002).
154. I. Pavlova et al., “Microanatomical and biochemical origins of normaland precancerous cervical autofluorescence using laser-scanningfluorescence confocal microscopy,” Photochem. Photobiol. 77(5),550–555 (2003).
155. L. Boucheron et al., “Utility of multispectral imaging for nuclearclassification of routine clinical histopathology imagery,” BMC CellBiol. 8(Suppl. 1), S8 (2007).
156. K. M. Rajpoot and N. M. Rajpoot, “Wavelet based segmentation ofhyperspectral colon tissue imagery,” in 7th Int. Multi Topic Conf.INMIC 2003, Islamabad, pp. 38–43 (2003).
157. K. Rajpoot and N. Rajpoot, “SVM optimization for hyperspectralcolon tissue cell classification,” in Medical Image Computing andComputer-Assisted Intervention—MICCAI 2004, pp. 829–837,Springer Berlin Heidelberg (2004).
158. K. Masood and N. M. Rajpoot, “Classification of colon biopsy sam-ples by spatial analysis of a single spectral band from its hyperspectralcube,” in Proceedings Medical Image Understanding and Analysis(MIUA), Aberystwyth, Wales, pp. 42–48 (2007).
159. K. Masood, “Hyperspectral imaging with wavelet transform forclassification of colon tissue biopsy samples,” Proc. SPIE 7073,707319 (2008).
160. M. Hohmann et al., “Preliminary results for hyperspectral videoendo-scopy diagnostics on the phantoms of normal and abnormal tissues:towards gastrointestinal diagnostics,” Proc. SPIE 8087, 80872N (2011).
161. S. Kiyotoki et al., “New method for detection of gastric cancer byhyperspectral imaging: a pilot study,” J. Biomed. Opt. 18(2), 026010(2013).
162. C. Angeletti et al., “Detection of malignancy in cytology specimensusing spectral–spatial analysis,” Lab. Invest. 85(12), 1555–1564 (2005).
163. M. E. Martin et al., “Hyperspectral fluorescence imaging system forbiomedical diagnostics,” Proc. SPIE 6080, 60800Q (2006).
164. M. E. Martin et al., “Development of an advanced hyperspectralimaging (HSI) system with application for cancer detection,” Ann.Biomed. Eng. 34(6), 1061–1068 (2006).
165. D. Roblyer et al., “In vivo fluorescence hyperspectral imaging of oralneoplasia,” Proc. SPIE 7169, 71690J (2009).
166. D. Roblyer et al., “Objective detection and delineation of oral neopla-sia using autofluorescence imaging,” Cancer Prev. Res. 2(5), 423–431(2009).
167. J. W. Uhr et al., “Molecular profiling of individual tumor cells by hyper-spectral microscopic imaging,” Transl. Res. 159(5), 366–375 (2012).
168. L. G. Koss, “The Papanicolaou test for cervical cancer detection.a triumph and a tragedy,” JAMA 261(5), 737–743 (1989).
169. N. Ramanujam, “Fluorescence spectroscopy of neoplastic and non-neoplastic tissues,” Neoplasia 2(1–2), 89–117 (2000).
170. R. Siegel, D. Naishadham, and A. Jemal, “Cancer statistics, 2012,”CA Cancer J. Clin. 62(1), 10–29 (2012).
171. S. M. Ismail et al., “Observer variation in histopathological diagnosisand grading of cervical intraepithelial neoplasia,” Br. Med. J.298(6675), 707 (1989).
172. W. R. Hiatt andM. R. Nehler, “Peripheral arterial disease,” inGeriatricMedicine, pp. 561–571, Springer, New York (2007).
173. K. J. Zuzak et al., “Imaging hemoglobin oxygen saturation in sicklecell disease patients using noninvasive visible reflectance hyperspec-tral techniques: effects of nitric oxide,” Am. J. Physiol. Heart Circ.Physiol. 285(3), H1183–H1189 (2003).
174. R. Neville and S. Gupta, “Establishment of normative perfusion valuesusing hyperspectral tissue oxygenation mapping technology,” Vasc.Dis. Manage. 6(6), 156–161 (2009).
175. C. Weber and H. Noels, “Atherosclerosis: current pathogenesis andtherapeutic options,” Nat. Med. 17(11), 1410–1422 (2011).
176. C. Kittrell et al., “Diagnosis of fibrous arterial atherosclerosis usingfluorescence,” Appl. Opt. 24(15), 2280–2281 (1985).
177. S. Andersson-Engels et al., “Malignant tumor and atheroscleroticplaque diagnosis using laser-induced fluorescence,” IEEE J. QuantumElectron. 26(12), 2207–2217 (1990).
178. G. O. Angheloiu et al., “Intrinsic fluorescence and diffuse reflectancespectroscopy identify superficial foam cells in coronary plaques proneto erosion,” Arterioscler. Thromb. Vasc. Biol. 26(7), 1594–1600(2006).
179. D. Cohen et al., “The use of spectral imaging for the diagnosis of retinaldisease,” in LEOS '99. IEEE Lasers and Electro-Optics Society 199912th Annual Meeting, San Francisco, California, pp. 220–221 (1999).
180. L. K. Cheung and A. Eaton, “Age-related macular degeneration,”Pharmacotherapy 33(8), 838–855 (2013).
181. N. Singh, D. G. Armstrong, and B. A. Lipsky, “Preventing foot ulcersin patients with diabetes,” JAMA 293(2), 217–228 (2005).
182. L. Khaodhiar et al., “The use of medical hyperspectral technology toevaluate microcirculatory changes in diabetic foot ulcers and predictclinical outcomes,” Diabetes Care 30(4), 903–910 (2007).
183. D. Yudovsky, A. Nouvong, and L. Pilon, “Hyperspectral imaging indiabetic foot wound care,” J. Diabetes Sci. Technol. 4(5), 1099–1113(2010).
184. D. Yudovsky et al., “Monitoring temporal development and healing ofdiabetic foot ulceration using hyperspectral imaging,” J. Biophotonics4(7–8), 565–576 (2011).
185. K. J. Zuzak et al., “Noninvasive determination of spatially resolved andtime-resolved tissue perfusion in humans during nitric oxide inhibitionand inhalation by use of a visible-reflectance hyperspectral imagingtechnique,” Circulation 104(24), 2905–2910 (2001).
186. M. L. Huebschman, K. P. Rosenblatt, and H. R. Garner, “Hyperspectralmicroscopy imaging to analyze pathology samples with multicolorsreduces time and cost,” Proc. SPIE 7182, 71821F (2009).
187. F. Vasefi et al., “Transillumination hyperspectral imaging for histopa-thological examination of excised tissue,” J. Biomed. Opt. 16(8),086014 (2011).
188. B. Khoobehi, A. Khoobehi, and P. Fournier, “Snapshot hyperspectralimaging to measure oxygen saturation in the retina using fiber bundleand multi-slit spectrometer,” Proc. SPIE 8229, 82291E (2012).
Journal of Biomedical Optics 010901-22 January 2014 • Vol. 19(1)
Lu and Fei: Medical hyperspectral imaging: a review
Downloaded From: http://biomedicaloptics.spiedigitallibrary.org/ on 01/13/2015 Terms of Use: http://spiedl.org/terms

189. J. Freeman et al., “Multispectral and hyperspectral imaging: applica-tions for medical and surgical diagnostics,” in Proc. of the 19th AnnualInt. Conf. of the IEEE Engineering in Medicine and Biology Society,Chicago, Illinois, pp. 700–701 (1997).
190. S. T. Monteiro et al., “Towards a surgical tool using hyperspectralimagery as visual aid,” in Augmented environments for MedicalImaging including augmented reality in computer-aided surgery(AMI-ARCS’04), Rennes, France, pp. 97–103 (2004).
191. K. J. Zuzak et al., “Active DLP hyperspectral illumination: a noninva-sive, in vivo, system characterization visualizing tissue oxygenation atnear video rates,” Anal. Chem. 83(19), 7424–7430 (2011).
192. E. Wehner et al., “NIR DLPà ® hyperspectral imaging system formedical applications,” Proc. SPIE 7932, 793204 (2011).
193. M. S. Holzer et al., “Assessment of renal oxygenation during partialnephrectomy using hyperspectral imaging,” J. Urol. 186(2), 400–404(2011).
194. E. O. Olweny et al., “Renal oxygenation during robotic-assisted lap-aroscopic partial nephrectomy: characterization using laparoscopicdigital light processing hyperspectral imaging,” J. Endourol. 27(3),265–269 (2013).
195. K. J. Zuzak et al., “DLP hyperspectral imaging for surgical and clinicalutility,” Proc. SPIE 7210, 721006 (2009).
196. K. J. Zuzak et al., “The robustness of DLP hyperspectral imaging forclinical and surgical utility,” Proc. SPIE 7596, 759604 (2010).
197. B. Fisher et al., “Twenty-year follow-up of a randomized trial compar-ing total mastectomy, lumpectomy, and lumpectomy plus irradiationfor the treatment of invasive breast cancer,” N. Engl. J. Med.347(16), 1233–1241 (2002).
198. S. C. Campbell et al., “Guideline for management of the clinical T1renal mass,” J. Urol. 182(4), 1271 (2009).
199. B. A. Laven et al., “A pilot study of ice-slurry application for inducinglaparoscopic renal hypothermia,” BJU Int. 99(1), 166–170 (2007).
200. C. R. Tracy et al., “Characterization of renal ischemia using DLPhyperspectral imaging: a pilot study comparing artery-only occlusionversus artery and vein occlusion,” J. Endourol. 24(3), 321–325 (2010).
201. V.-D. Tuan, “A hyperspectral imaging system for in vivo optical diag-nostics,” IEEE Eng. Med. Biol. Mag. 23(5), 40–49 (2004).
202. P. Zhihong et al., “Face recognition in hyperspectral images,” IEEETrans. Pattern Anal. Mach. Intell. 25(12), 1552–1560 (2003).
203. A. Kienle et al., “Spatially resolved absolute diffuse reflectance mea-surements for noninvasive determination of the optical scattering and
absorption coefficients of biological tissue,” Appl. Opt. 35(13), 2304–2314 (1996).
204. I. Georgakoudi et al., “Fluorescence, reflectance, and light-scatteringspectroscopy for evaluating dysplasia in patients with Barrett’s esopha-gus,” Gastroenterology 120(7), 1620–1629 (2001).
205. I. J. Bigio and J. R. Mourant, “Ultraviolet and visible spectroscopiesfor tissue diagnostics: fluorescence spectroscopy and elastic-scatteringspectroscopy,” Phys. Med. Biol. 42(5), 803 (1997).
206. R. Doornbos et al., “The determination of in vivo human tissue opticalproperties and absolute chromophore concentrations using spatiallyresolved steady-state diffuse reflectance spectroscopy,” Phys. Med.Biol. 44(4), 967 (1999).
207. M. G. Müller et al., “Spectroscopic detection and evaluation of mor-phologic and biochemical changes in early human oral carcinoma,”Cancer 97(7), 1681–1692 (2003).
208. C.-C. Yu et al., “Quantitative spectroscopic imaging for non-invasiveearly cancer detection,” Opt. Soc. Am. 16(20), 16227–16239 (2008).
209. M. Patterson, B. Wilson, and D. Wyman, “The propagation of opticalradiation in tissue. II: optical properties of tissues and resulting fluencedistributions,” Lasers Med. Sci. 6(4), 379–390 (1991).
210. A. Kim and B. Wilson, “Measurement of ex vivo and in vivo tissueoptical properties: methods and theories,” in Optical-ThermalResponse of Laser-Irradiated Tissue, A. J. Welch and M. J. C.Gemert, Eds., pp. 267–319, Springer, Netherlands (2011).
211. A. L. Vahrmeijer et al., “Image-guided cancer surgery using near-infra-red fluorescence,” Nat. Rev. Clin. Oncol. 10(9), 507–518 (2013).
Guolan Lu is a PhD student in the Department of BiomedicalEngineering at Emory University and Georgia Institute ofTechnology, Atlanta, Georgia.
Baowei Fei is associate professor in the Department of Radiologyand Imaging Sciences at Emory University and in the Departmentof Biomedical Engineering at Emory University and GeorgiaInstitute of Technology. He received his MS and PhD degreesfrom Case Western Reserve University, Cleveland, Ohio. He isa Georgia Cancer Coalition Distinguished Scholar and Director ofthe Quantitative BioImaging Laboratory (www.feilab.org) at EmoryUniversity School of Medicine.
Journal of Biomedical Optics 010901-23 January 2014 • Vol. 19(1)
Lu and Fei: Medical hyperspectral imaging: a review
Downloaded From: http://biomedicaloptics.spiedigitallibrary.org/ on 01/13/2015 Terms of Use: http://spiedl.org/terms


