MEDICARE ADVANTAGE: WHAT CONGRESS INTENDED? by Marsha Gold, Sc.D. Senior Fellow Mathematica Policy Research June 3, 2007 For presentation at Panel on “Medicare Advantage Private Plans: Costs and Benefits in 2007” Academy Health Annual Research Meeting
Transcript
MEDICARE ADVANTAGE: WHAT CONGRESS INTENDED?
MEDICARE ADVANTAGE: WHAT CONGRESS INTENDED?
by
Marsha Gold, Sc.D.Senior Fellow
Mathematica Policy Research
June 3, 2007
For presentation at Panel on “Medicare Advantage Private Plans: Costs and Benefits in 2007”
Academy Health Annual Research Meeting
by
Marsha Gold, Sc.D.Senior Fellow
Mathematica Policy Research
June 3, 2007
For presentation at Panel on “Medicare Advantage Private Plans: Costs and Benefits in 2007”
Academy Health Annual Research Meeting
2
Overview of Findings - IOverview of Findings - I
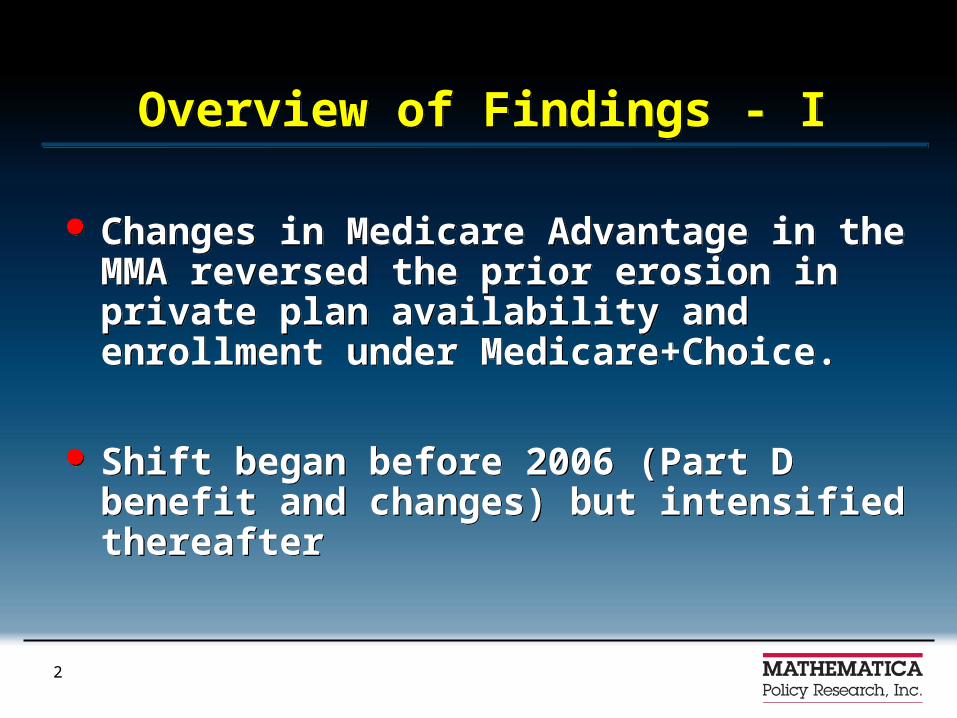
Changes in Medicare Advantage in the MMA reversed the prior erosion in private plan availability and enrollment under Medicare+Choice.
Shift began before 2006 (Part D benefit and changes) but intensified thereafter
Changes in Medicare Advantage in the MMA reversed the prior erosion in private plan availability and enrollment under Medicare+Choice.
Shift began before 2006 (Part D benefit and changes) but intensified thereafter
3
Overview of Findings - IIOverview of Findings - II
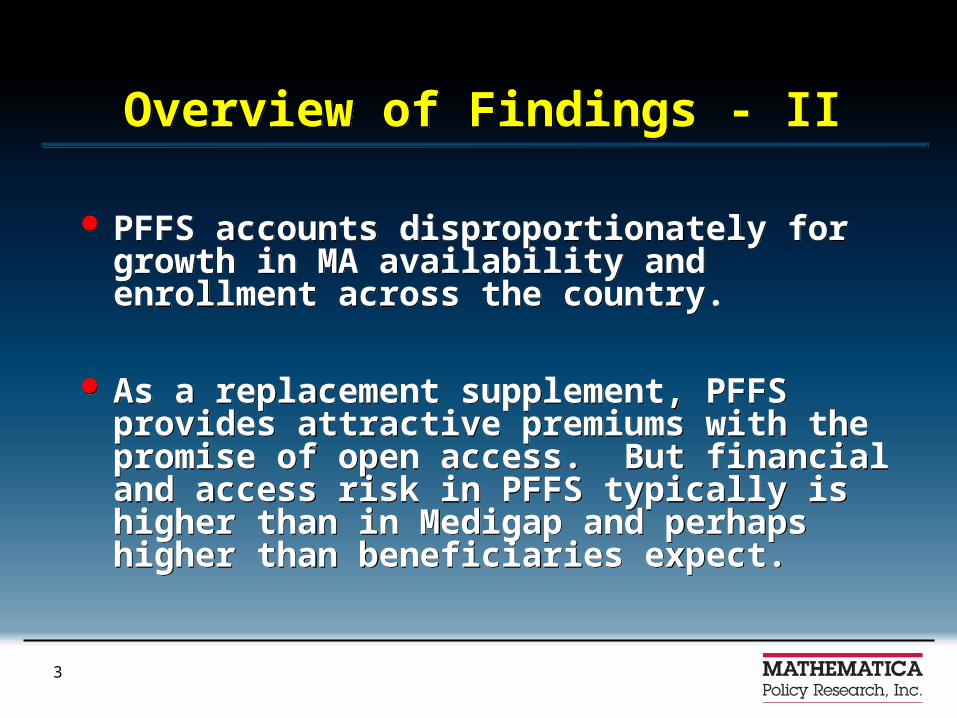
PFFS accounts disproportionately for growth in MA availability and enrollment across the country.
As a replacement supplement, PFFS provides attractive premiums with the promise of open access. But financial and access risk in PFFS typically is higher than in Medigap and perhaps higher than beneficiaries expect.
4
National Enrollment in Medicare Health Plans, 1999-2007
National Enrollment in Medicare Health Plans, 1999-2007
7.0
6.1 6.15.3 5.3 5.5
6.1
7.6
8.5
0.0
1.0
2.0
3.0
4.0
5.0
6.0
7.0
8.0
9.0
1999 2000 2001 2002 2003 2004 2005 2006 2007
Mil
lion
s
Source: CMS Monthly Health Plan Summary Report.
*Figures are for December of each year except for 2007 (April).
5
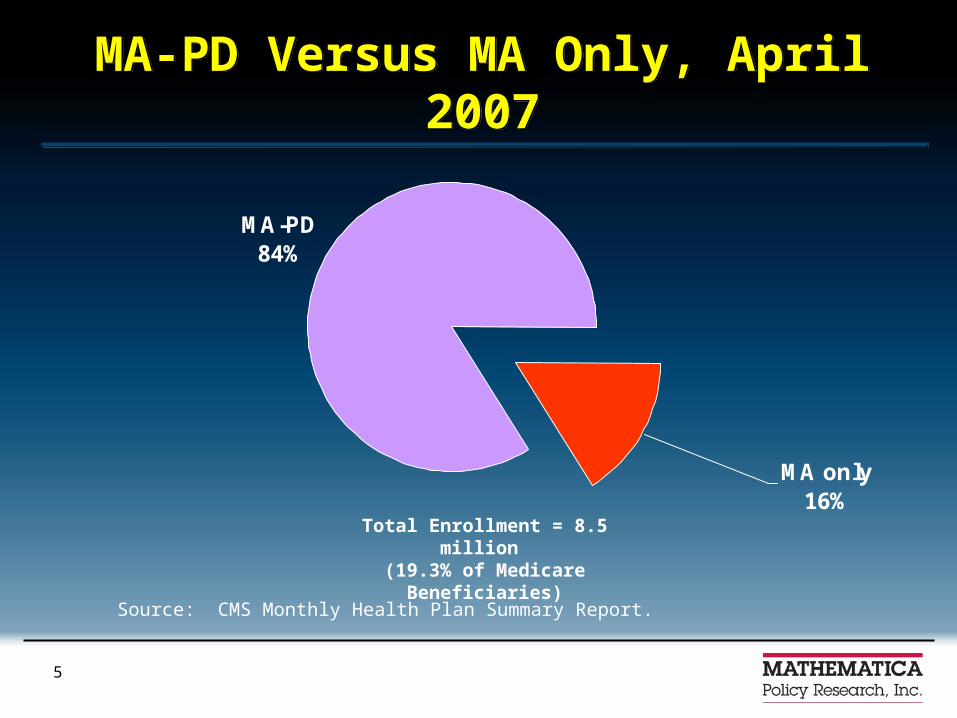
Medicare Advantage Enrollment: MA-PD Versus MA Only, April 2007Medicare Advantage Enrollment: MA-PD Versus MA Only, April 2007
MA-PD84%
MA only16%
Total Enrollment = 8.5 million (19.3% of Medicare Beneficiaries)
Source: CMS Monthly Health Plan Summary Report.
6
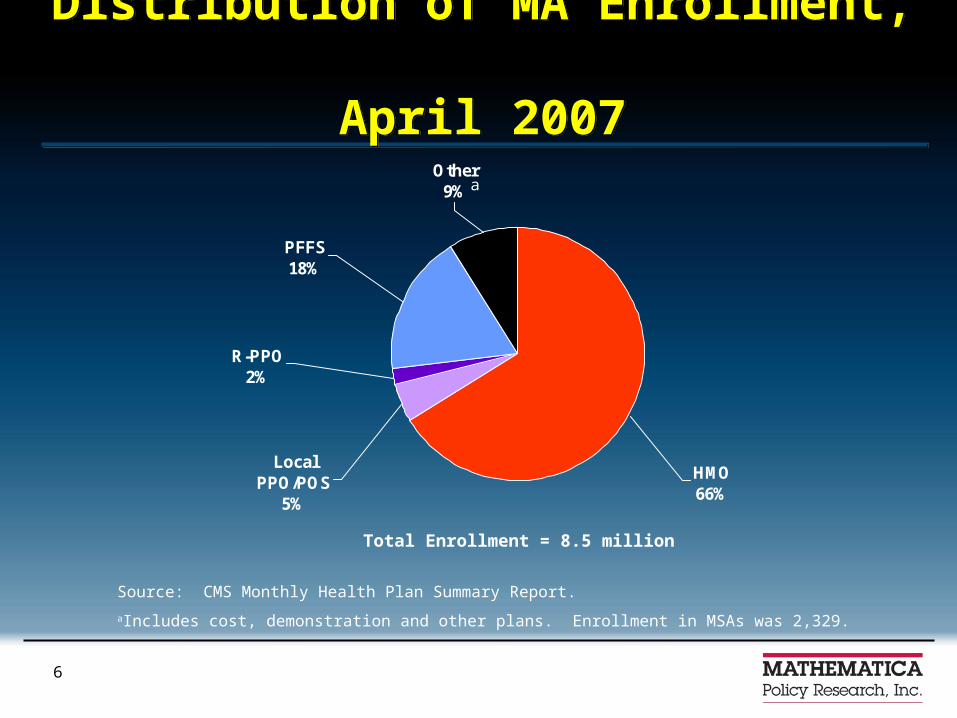
Distribution of MA Enrollment, April 2007
Distribution of MA Enrollment, April 2007
Total Enrollment = 8.5 million
Source: CMS Monthly Health Plan Summary Report.
aIncludes cost, demonstration and other plans. Enrollment in MSAs was 2,329.
HMO66%
Local PPO/POS
5%
R-PPO2%
PFFS18%
Other9% a
7
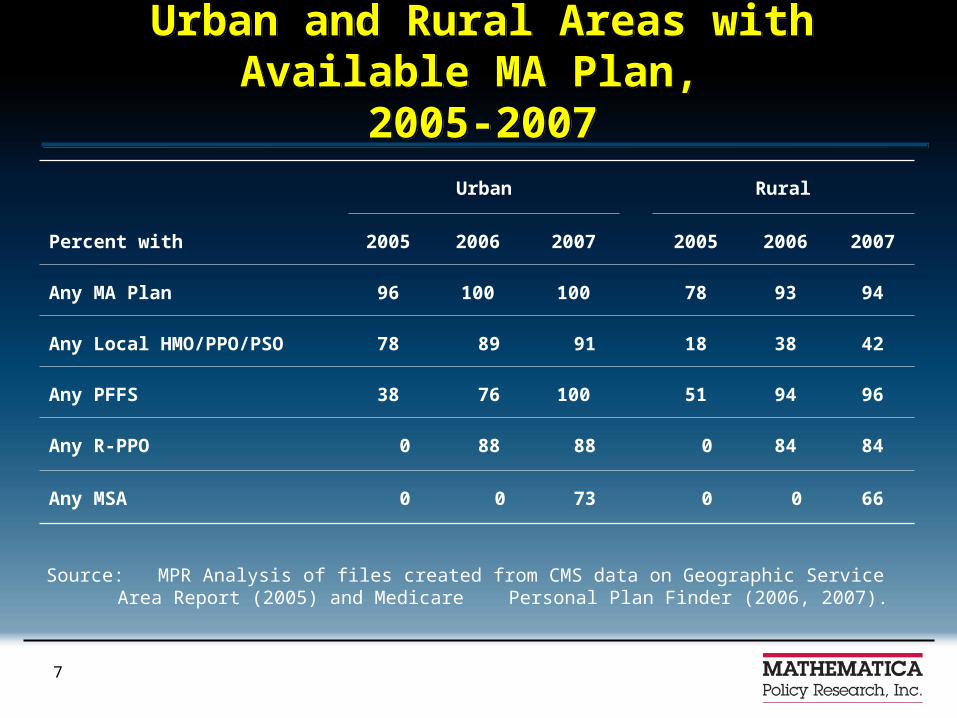
Percentage of Beneficiaries in Urban and Rural Areas with Available MA Plan,
2005-2007
Percentage of Beneficiaries in Urban and Rural Areas with Available MA Plan,
2005-2007Urban Rural
Percent with 2005 2006 2007 2005 2006 2007
Any MA Plan 96 100 100 78 93 94
Any Local HMO/PPO/PSO 78 89 91 18 38 42
Any PFFS 38 76 100 51 94 96
Any R-PPO 0 88 88 0 84 84
Any MSA 0 0 73 0 0 66
Source: MPR Analysis of files created from CMS data on Geographic Service Area Report (2005) and Medicare Personal Plan Finder (2006, 2007).
8
Number of Coordinated and PFFS Contracts Available to Beneficiaries By
County Type, 2007
Number of Coordinated and PFFS Contracts Available to Beneficiaries By
County Type, 2007
All Beneficiaries Urban
Beneficiaries
Rural Beneficiaries
Percentage of Beneficiaries with: CCPa PFFS CCPa PFFS CCPa PFFS
None 1.5% 0.3% 0.7% 0.0% 4.3% 0.0%
1 12.5 2.7 5.8 3.4 36.3 0.4
2 16.0 6.1 11.1 7.5 33.9 1.6
3-5 33.9 35.9 39.3 35.2 16.7 40.0
6 or More 33.7 52.4 43.2 53.4 2.3 51.4
Source: MPR analysis of a file created from the 2007 Personal Plan Finder.
Note: Contracts reflect unique organizational sponsors. Each contract may include several plans (that is, different benefit packages). Exclude employer-only “800” plans.
aIncludes R-PPOs which are available to most beneficiaries.
9
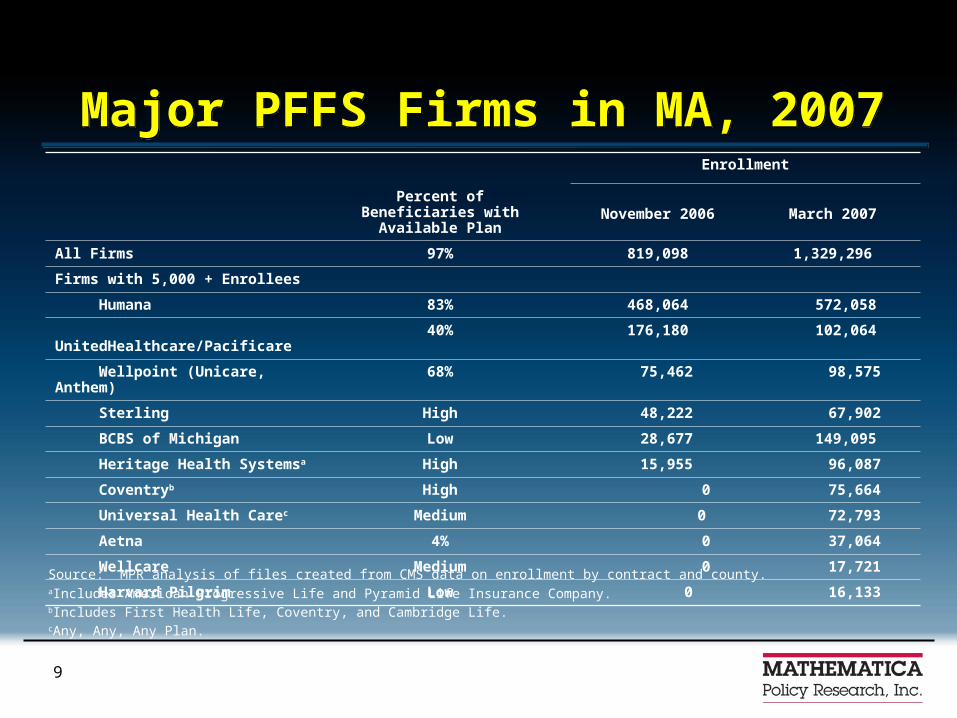
Major PFFS Firms in MA, 2007Major PFFS Firms in MA, 2007Enrollment
Percent of Beneficiaries with Available Plan November 2006 March 2007
All Firms 97% 819,098 1,329,296
Firms with 5,000 + Enrollees
Humana 83% 468,064 572,058
UnitedHealthcare/Pacificare 40% 176,180 102,064
Wellpoint (Unicare, Anthem) 68% 75,462 98,575
Sterling High 48,222 67,902
BCBS of Michigan Low 28,677 149,095
Heritage Health Systemsa High 15,955 96,087
Coventryb High 0 75,664
Universal Health Carec Medium 0 72,793
Aetna 4% 0 37,064
Wellcare Medium 0 17,721
Harvard Pilgrim Low 0 16,133Source: MPR analysis of files created from CMS data on enrollment by contract and county.aIncludes American Progressive Life and Pyramid Life Insurance Company.bIncludes First Health Life, Coventry, and Cambridge Life.cAny, Any, Any Plan.
10
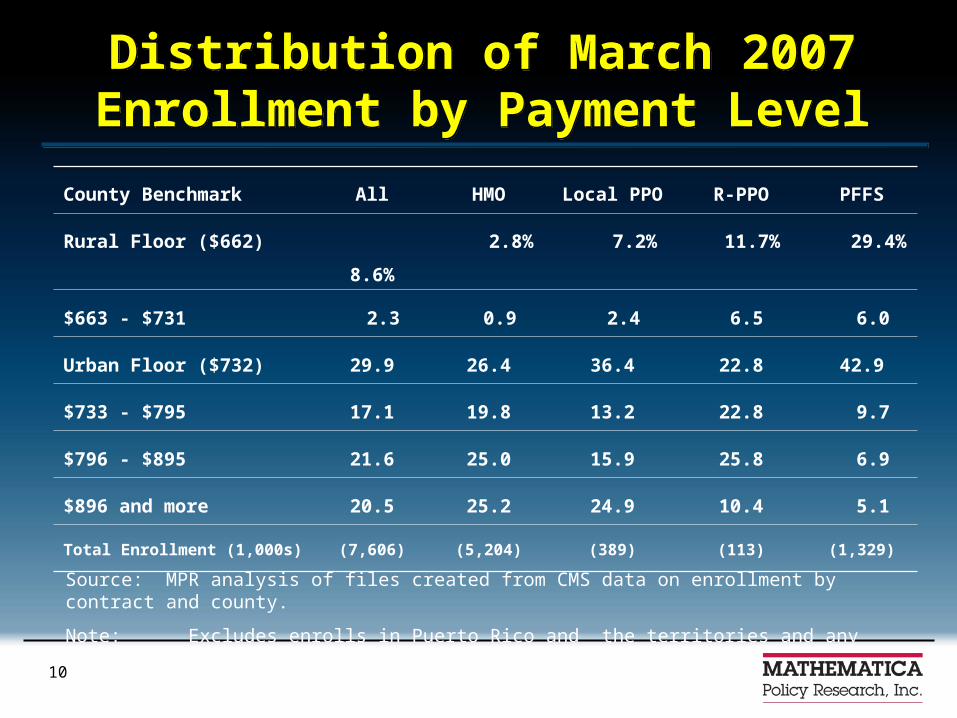
Distribution of March 2007 Enrollment by Payment Level
Distribution of March 2007 Enrollment by Payment Level
County Benchmark All HMO Local PPO R-PPO PFFS
Rural Floor ($662) 8.6% 2.8% 7.2% 11.7% 29.4%
$663 - $731 2.3 0.9 2.4 6.5 6.0
Urban Floor ($732) 29.9 26.4 36.4 22.8 42.9
$733 - $795 17.1 19.8 13.2 22.8 9.7
$796 - $895 21.6 25.0 15.9 25.8 6.9
$896 and more 20.5 25.2 24.9 10.4 5.1
Total Enrollment (1,000s) (7,606) (5,204) (389) (113) (1,329)
Source: MPR analysis of files created from CMS data on enrollment by contract and county.
Note: Excludes enrolls in Puerto Rico and the territories and any SNP only contracts.
11
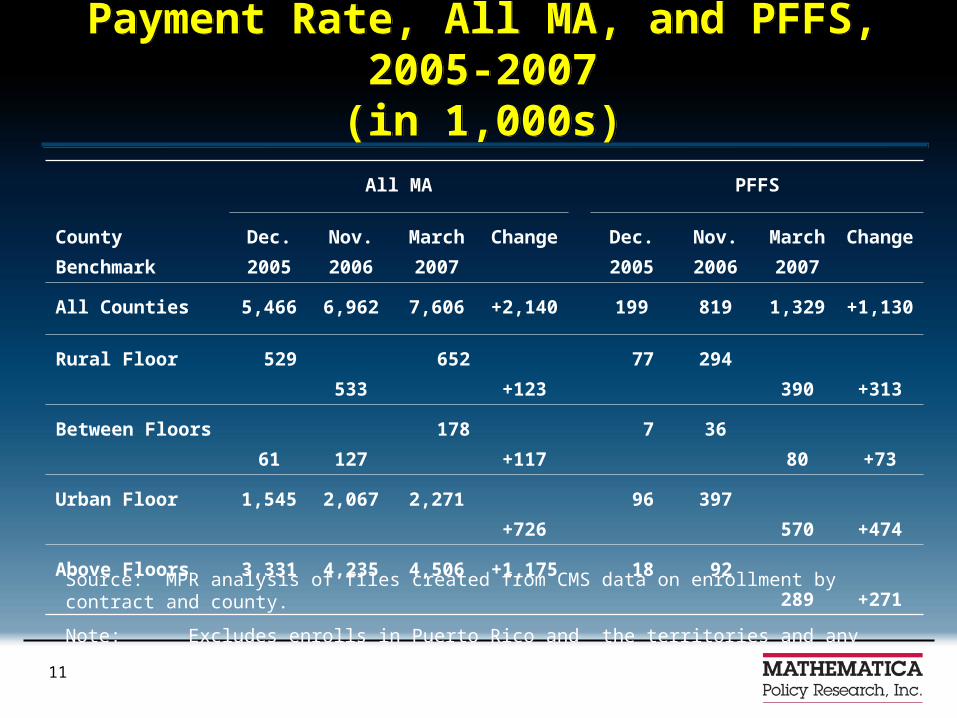
Growth in Enrollment By County Payment Rate, All MA, and PFFS, 2005-2007
(in 1,000s)
Growth in Enrollment By County Payment Rate, All MA, and PFFS, 2005-2007
(in 1,000s)
Source: MPR analysis of files created from CMS data on enrollment by contract and county.
Note: Excludes enrolls in Puerto Rico and the territories and any SNP only contracts.
All MA PFFS
County
Benchmark
Dec.
2005
Nov.
2006
March
2007
Change Dec.
2005
Nov.
2006
March
2007
Change
All Counties 5,466 6,962 7,606 +2,140 199 819 1,329 +1,130
Average MA Total Premium Per Month $39 $22 $48 $44
Percent with Zero Premiums 44% 64% 19% 24%
Percent Rx Benefits in Gap 31% 26% 0% 0%
PCP copay over $25 1% 1% 0% 0%
Spec copay over $25 22% 29% 57% 73%
Median Three Day IP Stay -- $300 -- $540
Median Three IP Staysb -- $1,300 -- $2,340
Source: MPR analysis of a file created from CMS’s November 2005 Personal Plan Finder.
aFigures only for MA-PDs. 70 percent of PFFS plans had drug coverage; premiums for MA only plans are $38 per month on average, with 20 percent having no premium. Among all PFFS plans, 38 percent have a specialist copay of $25 or more.
bTwo 2 six day stays and one three day stays.
13
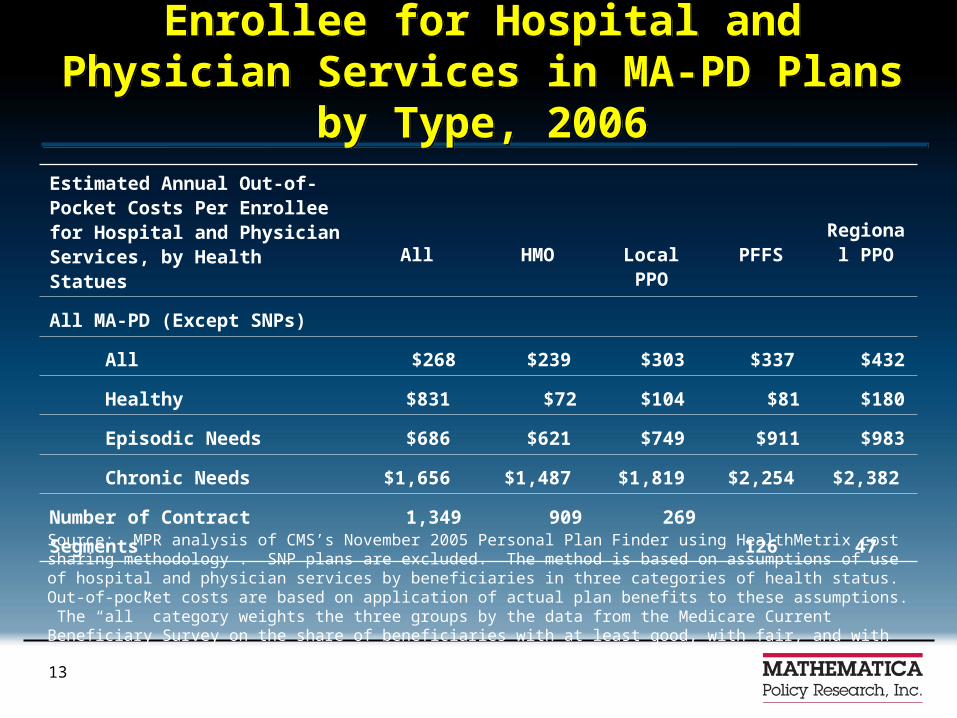
Estimated Out-of-Pocket Costs Per Enrollee for Hospital and Physician
Services in MA-PD Plans by Type, 2006
Estimated Out-of-Pocket Costs Per Enrollee for Hospital and Physician
Services in MA-PD Plans by Type, 2006Estimated Annual Out-of-Pocket Costs Per Enrollee for Hospital and Physician Services, by Health Statues All HMO Local PPO PFFS
Regional PPO
All MA-PD (Except SNPs)
All $268 $239 $303 $337 $432
Healthy $831 $72 $104 $81 $180
Episodic Needs $686 $621 $749 $911 $983
Chronic Needs $1,656 $1,487 $1,819 $2,254 $2,382
Number of Contract Segments 1,349 909 269 126 47
Source: MPR analysis of CMS’s November 2005 Personal Plan Finder using HealthMetrix cost sharing methodology . SNP plans are excluded. The method is based on assumptions of use of hospital and physician services by beneficiaries in three categories of health status. Out-of-pocket costs are based on application of actual plan benefits to these assumptions. The “all” category weights the three groups by the data from the Medicare Current Beneficiary Survey on the share of beneficiaries with at least good, with fair, and with poor health status.
14
For Additional InformationFor Additional Information
Marsha Gold. “Medicare Advantage in 2006-2007: What Congress Intended? Health Affairs Web Exclusive May 15, 2007. See www.healthaffairs.org
Marsha Gold. “Private Plan in Medicare: A 2007 Update.” Washington, DC: Kaiser Family Foundation, March 2007. See www.kff.org for this and earlier papers.
Marsha Gold and Stephanie Peterson. “Analysis of the Characteristics of Medicare Advantage Participation.” Report prepared for the Assistant Secretary for Planning and Evaluation. US Department of Health and Human Services, 2006. See www.mathematica-mpr.com for this and other papers on M+C/MA.