Medicare Patients: Regional Differences in Length of Hospital Stays. I 1969-71 by MARIAN GORNICK* This article focuses on the striking regional , differences observed in the length of the hospital stay bu Nedicare patienta discharged from short- stay hospitals in the four U.S. census regions. Ned&are data for patients discharged from ehort- stay horrpitals with specific diagnosea in 1969-71 are compared by region and age group, whether surgery was performed, and whether there were multiple diagnoses. Con&tent regional diflerences were found Zn length of stay that are not explained by variations in the patient characterietlca exam- ined. No matter what the condition, length of stay wa8 nearly always longest in the Northeast and shorteet in the West, with the North Central re- gion and the South occupying the positions In be- tu?een. Implications are that variation8 consistently found in other measure8 of hospital utilization, such as admission ratea, that directly affect hoapital expenditures are also not explained by the patient characterietics studied. The data sug- geat the need for extensive study of other factor8 that may influence the duration of the hoapital stay. SINCE ITS INCEPTION in 1966 the hospital insurance program under Medicare has protected virtually every person in the Nation aged 65 and over against the burdens of hospital costs, reliev- ing them of about 90 percent of the charges in- curred for short-stay hospita1ization.l Public expenditures for this program have undergone a steep increase. Medicare reimbursements for discharges from short-stay hospitals in 1972 ($5.6 billion or more than 95 percent of total hospital insurance reimbursements) were double the amount reimbursed just 5 years earlier in 1967 ($2.8 billion). The growth in medical care prices *Division of Health Insurance Studies, 05ce of Re- search and Statistics. ‘See “Hospital Charges Not Reimbursable by Medi- care,” in Medicare: Health Insurance for the Aged, 1967, Section 4.1: Short-Stay Hospital Utilization, Social Security Administration, Offlce of Research and Statis- tics, 1975. Effective July 1, 1973, protection was extended to persons entitled to receive social security cash benef3ts because of disability and to persons suffering from chronic renal disease. during that period has been widely reported, especially the accelerated growth in inpatient hospital care prices. The hospital daily-service- charge component of the Consumer Price Index rose at a faster rate than any other item of the medical care indexa It has also been reported that the initial impact of Medicare protection was one of increased hospital utilization by the population aged 65 and over. The discharge rate, the average length of stay, and the average number of days of care per 1,000 enrollees were greater the year that Medicare began than they were in the preceding year. Estimates of the increase in the short-stay hospital discharge rate for persons aged 65 and over from the year before the program started to the program’s first year have been in the range of 4.6-7.4 percent. Corresponding estimates of the increase in mean length of stay range from 4.1 percent to 7.8 percent; the number of days of care an estimated 8.9-16.0 percent.s By 1949, both the average length of stay and the average number of days of care per 1,000 enrollees began to show a downward trend. As table 1 shows, the mean length of stay in short- stay hospitals by Medicare patients was 12.9 days in 1969 and declined to 12.4 days by 1971; the number of days of care per 1,000 enrollees dropped from 3,804 to 3,660. A study covering age differ- ences in health care spending in fiscal year 1974 shows that for persons aged 65 and over the aver- age stay in community hospitals reached a post- Medicare low of 11.35 days that year.4 Experience under Medicare has also been char- acterized by marked geographic variations in hos- pital utilization. For short-stay hospitals, regional differences in discharge rates, average length of ‘Loucele A. Horowitz, “Medical Care Price Changes In Medicare’s First Five Years,” Social Security Bulletin, March 1972. a See Julian H. Pettengill, “Trends in Hospital Use by the Aged,” Social Security Bulletin, July 1972. ‘See Marjorie Mueller, “Age Differences in Health Care Spending, Fiscal Year 1974,” Sodal Security Bulle- tin, June 1975. 14 SOCIAL SECURITY
Transcript
Medicare Patients: Regional Differences in Length of Hospital Stays. I 1969-71
by MARIAN GORNICK*
This article focuses on the striking regional , differences observed in the length of the hospital
stay bu Nedicare patienta discharged from short- stay hospitals in the four U.S. census regions. Ned&are data for patients discharged from ehort- stay horrpitals with specific diagnosea in 1969-71 are compared by region and age group, whether surgery was performed, and whether there were multiple diagnoses. Con&tent regional diflerences were found Zn length of stay that are not explained by variations in the patient characterietlca exam- ined. No matter what the condition, length of stay wa8 nearly always longest in the Northeast and shorteet in the West, with the North Central re- gion and the South occupying the positions In be- tu?een. Implications are that variation8 consistently found in other measure8 of hospital utilization, such as admission ratea, that directly affect hoapital expenditures are also not explained by the patient characterietics studied. The data sug- geat the need for extensive study of other factor8 that may influence the duration of the hoapital stay.
SINCE ITS INCEPTION in 1966 the hospital insurance program under Medicare has protected virtually every person in the Nation aged 65 and over against the burdens of hospital costs, reliev- ing them of about 90 percent of the charges in- curred for short-stay hospita1ization.l Public expenditures for this program have undergone a steep increase. Medicare reimbursements for discharges from short-stay hospitals in 1972 ($5.6 billion or more than 95 percent of total hospital insurance reimbursements) were double the amount reimbursed just 5 years earlier in 1967 ($2.8 billion). The growth in medical care prices
*Division of Health Insurance Studies, 05ce of Re- search and Statistics.
‘See “Hospital Charges Not Reimbursable by Medi- care,” in Medicare: Health Insurance for the Aged, 1967, Section 4.1: Short-Stay Hospital Utilization, Social Security Administration, Offlce of Research and Statis- tics, 1975.
Effective July 1, 1973, protection was extended to persons entitled to receive social security cash benef3ts because of disability and to persons suffering from chronic renal disease.
during that period has been widely reported, especially the accelerated growth in inpatient hospital care prices. The hospital daily-service- charge component of the Consumer Price Index rose at a faster rate than any other item of the medical care indexa
It has also been reported that the initial impact of Medicare protection was one of increased hospital utilization by the population aged 65 and over. The discharge rate, the average length of stay, and the average number of days of care per 1,000 enrollees were greater the year that Medicare began than they were in the preceding year. Estimates of the increase in the short-stay hospital discharge rate for persons aged 65 and over from the year before the program started to the program’s first year have been in the range of 4.6-7.4 percent. Corresponding estimates of the increase in mean length of stay range from 4.1 percent to 7.8 percent; the number of days of care an estimated 8.9-16.0 percent.s
By 1949, both the average length of stay and the average number of days of care per 1,000 enrollees began to show a downward trend. As table 1 shows, the mean length of stay in short- stay hospitals by Medicare patients was 12.9 days in 1969 and declined to 12.4 days by 1971; the number of days of care per 1,000 enrollees dropped from 3,804 to 3,660. A study covering age differ- ences in health care spending in fiscal year 1974 shows that for persons aged 65 and over the aver- age stay in community hospitals reached a post- Medicare low of 11.35 days that year.4
Experience under Medicare has also been char- acterized by marked geographic variations in hos- pital utilization. For short-stay hospitals, regional differences in discharge rates, average length of
‘Loucele A. Horowitz, “Medical Care Price Changes In Medicare’s First Five Years,” Social Security Bulletin, March 1972.
a See Julian H. Pettengill, “Trends in Hospital Use by the Aged,” Social Security Bulletin, July 1972.
‘See Marjorie Mueller, “Age Differences in Health Care Spending, Fiscal Year 1974,” Sodal Security Bulle- tin, June 1975.
14 SOCIAL SECURITY
TABLE l.-Number of discharges, mean length of stay, and number of days of care per 1,000 Medicare enrollees in short-stay hospitals, by census region, 1909-71
Census region Number of Mean length Number of days
discharges per of care per 1,ooO enrollees Cp,‘2”,‘s, l,oo0 enrollees
I 1969 I ,
Unlted States ________
Northeast ___________ _____ North Central ___._______ Bouth. ___________.._.____ West _____ ____ __. _________
294 9 12 9 3.804
ifi!
15 1 13 0
y$
11 9 3:a19 302 4 10 6 3.205
I I I
1970
United Etates ________ 2924 12 3 3,743
Northeast ________________ 244 2 North Central ___._______
EE :: Y xt
South ____________________ 11 tl 3:722 West ____________ _________ 292 9 10 1 2,953
1971
United States ________ 296 2 12 4 3.659
Bource Unpublished data from billing forms for hospital discharges in Social Security AdministratIon central records as of Dee 23,187s
stay, and patient days per 1,000 enrollees may be observed in the figures for the four U.S. census regions for 1969-71, the period covered by this study. The number of discharges per 1.000 en- rollees were consistently highest in the South and lowest in the Northeast. The length of stay in short-stay hospitals in the Northeast, on the other hand, consistently exceeded that in the West-by 4.5-5.0 days.
Such disparities raise the question of whether regional differences in certain characteristics of the patient population explain the differences in hospital utilization, particularly with respect to length of stay. National data for the Medicare population aged 65 and over show that mean length of stay in short-stay hospitals increases with age, is greater for surgical cases than for nonsurgical cases, is greater for patients with multiple diagnoses than for those with a single diagnosis, and varies considerably with primary discharge diagnosis.
This article focuses on variations in length of stay in short-stay hospitals in the four U.S. census regions (Northeast, North Central, South, and West) and brings together 3 years of Medi- care data for patients discharged in 1969, 1970, and 1971. Information presented here is based on
BULLETIN, JULY 1975
tabulations in the annual Social Security Admin- istration series5 that show mean length of stay in 1969 and 1970 for 139 specific diagnoses (or diagnostic groups) and for 166 diagnoses in 1971 by census region and division. For each diagnosis, length-of-stay data are provided for three broad age groups, for discharges with single or multiple diagnoses, and for discharges with or without surgery.
Summary findings from the study show that, during 1969-71, consistent regional differences occurred in the length of stay for each of the three age groups, for surgical and nonsurgical cases, for patients with single or multiple diag- noses, and for the same primary discharge diag- nosis. The regional variations in length of stay do not appear to be explained by variations in these patient characteristics. The data suggest the need to study other regional differences that may influence the duration of the hospital stay.
REGIONAL DIFFERENCES FOR ALL DIAGNOSES
For Medicare patients discharged from short- stay hospitals in the United States during the study period, the average length of stay was 12.9 days in 1969, 12.8 days in 1970, and 12.4 days in 1971. Among the four census regions, marked differences were found for each of the years in length of stay (chart 1).6 In the Northeast the mean length of stay in 1969 was 15.1 day&.5 days longer than the average stay of 10.6 days in the West. The pattern of geographic variations observable in 1969 continued in the next 2 years: The Northeast had the longest stay, followed by the North Central States, the South, and the West.
In each region a tendency toward declining hospital stays is seen. The average stay went down to 0.6 day between 1969 and 1971 in the North
‘Medkare: Health Insurance for the Aged, 1969: Length of Stay by Diagnosie, Social Security Adminis- tration, Oface of Research and Statistics, 1973, and the corresponding reports for 1970 (1973) and for 1971 (1974).
’ The census regions include : Northeast-Me., N.H., Vt., Mass., R. I., Conn., N. Y., N. J., Pa. ; North Centrd- Ohio, Ind., Ill., Mich., Wis., Minn., Iowa, MO., N. Dak., S. Dak., Nebr., Kans.; South-Del., Md., D. C., Va., W. Va., N. C., S. C., Ga., Fla., Ky., Tenn., Ala., Miss., Ark., La., Okla., Tex.; West-Mont., Idaho, Wyo., Cola., N. Mex., Ariz., Utah, Nev., Wash., Oreg., Calif., Alaska, Hawaii.
17
CEIART l.-Mean length of stay for short-stay hospital discharges under Medicare, by census regions, 196%71
of the regions, with the drop from 1969 to 1971 averaging 0.6 day.
Days
ALL DISCHARGES
‘69’70’71 ‘69’70 ‘71 ‘69 ‘70’71 ‘69’70’71 North- North South West
east Central
Central, South, and West regions; in-the North- east the decline was only 0.1 day. Consequently, the disparity between the Northeast and the West increased. In 1969, hospital stays in the Northeast were 42 percent longer than they were in the West; in 1970 the difference was 49 percent. By 1971 it had reached 50 percent, with the length of stay amounting to 15.0 days in the Northeast and 10.0 days in the West.
Regional variations similar to those for Medi- care patients have been found for discharges from short-stay hospitals for patients of all ages. The data on length of stay shown below were com- piled for the entire population by the National Center for Health Statistics. These figures show
Census region
1969 1970 1971 ---
United States ___________.______________ 84 80 78 ~-~ Northeast..-...-...------------------------ North Central _____________________________ is 2 ii Scuth ______________________________________ West ___________________ _ ___________________ :i i; 2
Source National Center for Health Statistics, Ufifmztion of Shorf-Slav Hospttak Summary o/ Nonmcdtcal Statrstfcs-UnIted Btates, 1971, Series 13, No 17, and Monthly Vital Etatistica Report, Horpttatal Dlachargc Swwy Data, Vol. 21, No. 9, 8upplement. Dec. 6,1972.
PATIENT CHARACTERISTICS AND LENGTH
OF STAY
Age
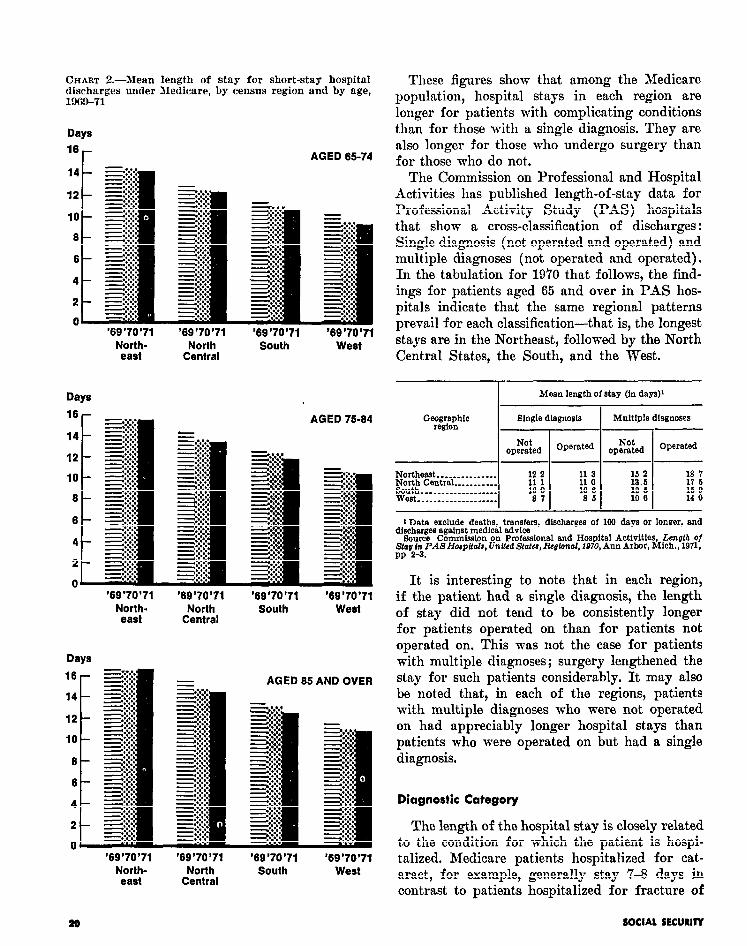
For the Medicare population aged 65 and over, age is a factor closely related to length of stay. Discharges f ram short-stay hospitals during the &year study period were classified in three broad age groups-65-74,75-84, and 85 and over. Fifty- three percent were for the youngest group, 38 percent for the middle group, and 9 percent for the oldest patients. During the period under study the oldest patients-those aged 85 and over-stayed about 2 days longer than those hospitalized at ages 65-74 (table 2).
As is apparent from the regional differences revealed in chart 2, for each of the age groups in each year hospital stays were longest in the Northeast and shortest in the West while the other two regions continued to hold the same positions in between. Except for the two oldest groups in the Northeast the average length of stay declined for each age group each year in each region.
It may be noted that each year the difference between the Northeast and the West was greatest in duration of stay for those aged 85 and over and that the difference increased during the study period. In 1969, the mean stay for the oldest age group in the Northeast was 5.1 days greater than it was for the same age group in the West. That difference increased to 5.6 days and 5.9 days in 1970 and 1971, respectively. For those in the middle group, differences were 4.7 days, 5.2 days, and 5.3 days in 1969, 1970, and 1971. For the youngest group, the corresponding figures were 4.2 days, 4.7 days, and 4.7 days.
rankings identical with those found for Medicare Single and Multiple Diagkses
patients-duration of stay was longest in the Medicare discharge data“for the aged popula- Northeast, which was followed by the North tion reflect the presence of complicating condi- Central States, the South, and the West. The tions among a high proportion of those hospital- mean length of stay declined each year in each ized. Nationally, 58 percent of all Medicare dis-
16 SOCIAL SECURITY
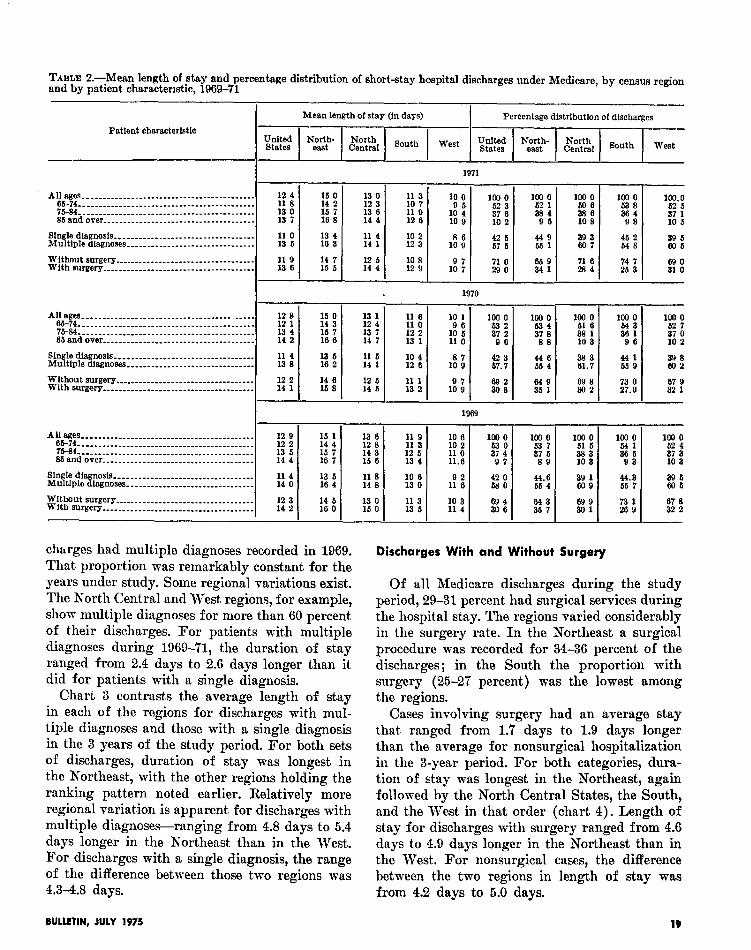
TABLE L.-Mean length of stay and percentage distribution of short-stay hospital discharges under Medicare, by census region and by patient charactenstic, 1969-71
Patient characteristic
Mean length of stay (in days) Percentage dlstrihution of discharges
All ages..-...........----.------.---------- ...... 65.74.. .......................................... 75.34 ............................................ 65andover ......................................
Single dlagnosls ___.___________.__.________________ Multiple diagnoses.. ..............................
:i i 13 4 14 2
11 4 13 3
15 0 13 1 14 3 12 4 15 7 13 7 16 6 14 7
13 6 11 5 16 2 14 1
Wlthout surgery .__._____________._._______________ 12 2 With surgery ___________.______. ___.______________.
12 5 14 1
I I :;: 8” 14 5
loo 0 61 6 331 10 3
E
69 8 302
100 0
ii;
106 0 52 7
E i
441 39 8 65 9 802
67 9 32 1
All am.. ......................................... 65-74 ............................................ 75-34. ........................................... 85 and over __._________________---.-----.--------
Single diagnosis Multlplediagnoses................................
Without surgery.. With surgery
.......... ......................................
2: 39 t?OQ 1 CL.3 56 7 Ei
ii! LE 73 26 9 1 32 67 8 2
charges had multiple diagnoses recorded in 1969. That proportion tvas remarkably constant for the years under study. Some regional variations exist. The North Central and West regions, for example, show multiple diagnoses for more than 60 percent of their discharges. For patients with multiple diagnoses during 1969-71, the duration of stay ranged from 2.4 days to 2.6 days longer than it did for patients with a single diagnosis.
Discharges With and Without Surgery
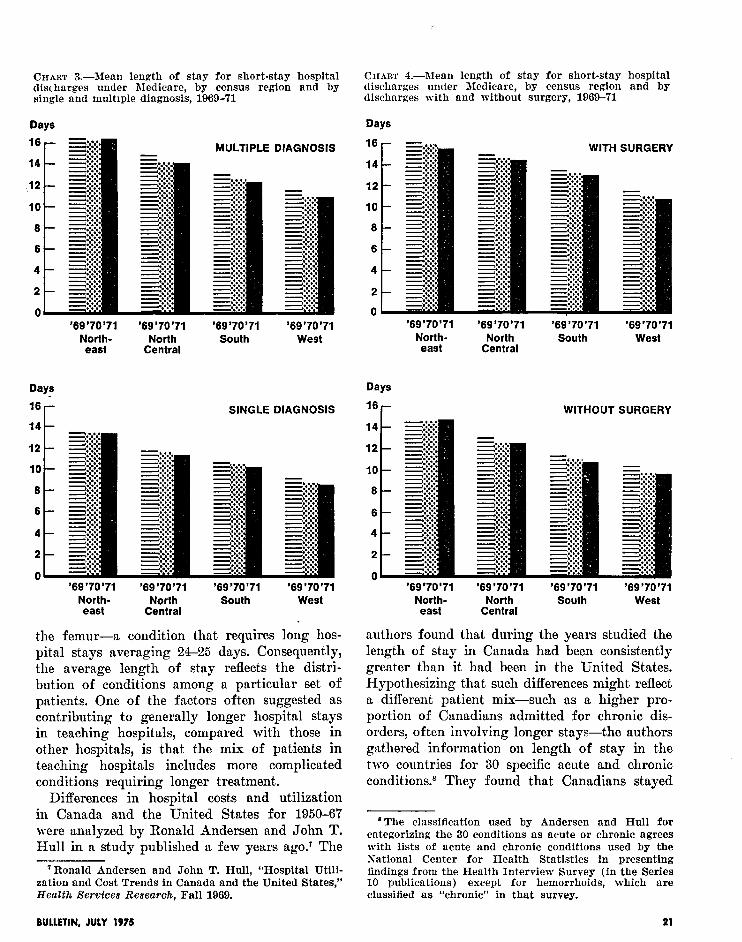
Chart 3 contrasts the average length of stay in each of the regions for discharges with mul- tiple diagnoses and those with a single diagnosis in the 3 years of the study period. For both sets of discharges, duration of stay was longest in the Northeast, with the other regions holding the ranking pattern noted earlier. Relatively more regional variation is apparent for discharges with multiple diagnoses-ranging from 4.8 days to 5.4 days longer in the Northeast than in the West. For discharges with a single diagnosis, the range of the difference between those two regions was 4.3-4.8 days.
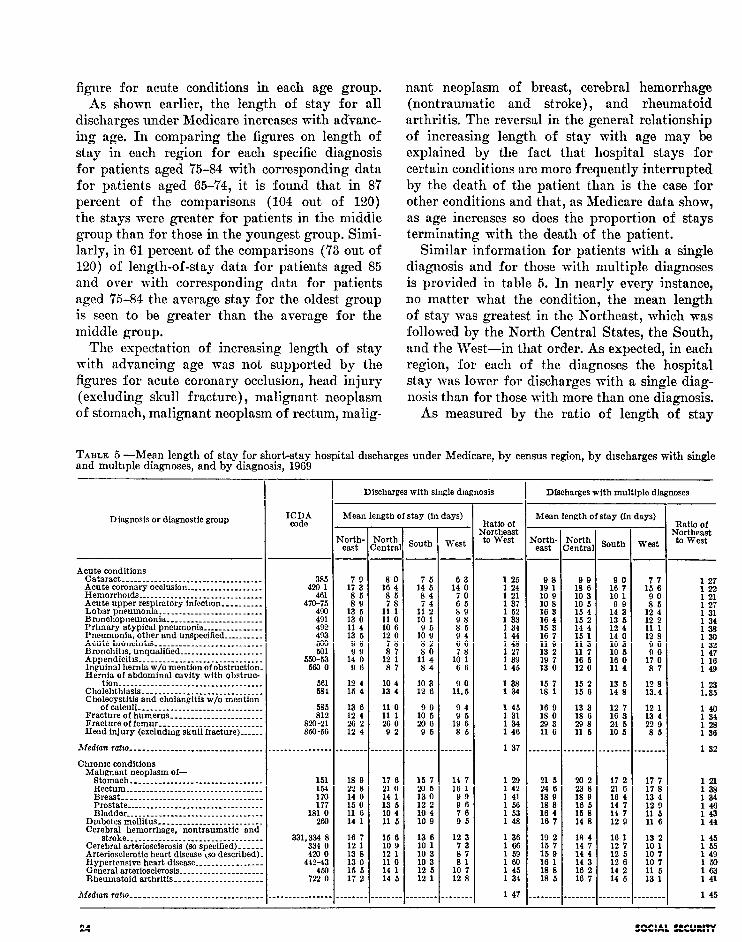
Of all Medicare discharges during the study period, 29-31 percent had surgical services during the hospital stay. The regions varied considerably in the surgery rate. In the Northeast a surgical procedure was recorded for 34-36 percent of the discharges ; in the South the proportion with surgery (25-27 percent) was the lowest among the regions.
Cases involving surgery had an average stay that ranged from 1.7 days to 1.9 days longer than the average for nonsurgical hospitalization in the 3-year period. For both categories, dura- tion of stay was longest in the Northeast, again followed by the North Central States, the South, and the West in that order (chart 4). Length of stay for discharges with surgery ranged from 4.6 days to 4.9 days longer in the Northeast than in the West. For nonsurgical cases, the difference between the two regions in length of stay was from 4.2 days to 5.0 days.
BULLETIN, JULY 1975 19
CHART 2.-Mean length of stay for short-stay hospital discharges under Medicare, by census region and by age, 1969-71
Days
16 r AGED 65-74
‘69’70’71 North- east
Days
‘69’70’71 North
Central
‘69’70’71 South
‘69’70 ‘71 West
AGED 75-M
‘69’70’71 ‘69’70 ‘71 North- North east Central
Days
‘69’70’71 South
‘69’70’71 West
AGED 65 AND OVER
‘69’70’71 North- east
‘69’70’71 North
Central
‘69’70’71 South
‘69’70’71 West
These figures show that among the Medicare population, hospital stays in each region are longer for patients with complicating conditions than for those with a single diagnosis. They are also longer for those who undergo surgery than for those who do not.
The Commission on Professional and Hospital Activities has published length-of-stay data for Professional Activity Study (PAS) hospitals that show a cross-classification of discharges : Single diagnosis (not operated and operated) and multiple diagnoses (not operated and operated). In the tabulation for 1970 that follows, the find- ings for patients aged 65 and over in PAS hos- pitals indicate that the same regional patterns prevail for each classification-that is, the longest stays are in the Northeast, followed by the North Central States, the South, and the West.
Mean length of stay (in days)’
Single dlagnosls Multlple diagnoses
I--
l Not Operated I
Not operated operated Operated
1 Date exclude deaths, transfers, d&charges of 109 days or longer, and disoharges against medical advice
&mm Commiaslon on Prokssional and Hospital Activities, Luzath of Stay Pn PAS Horpflala, United States, Realonal, 1070, Ann Arbor, Mich., 1971, PP 2-3.
It is interesting to note that in each region, if the patient had a single diagnosis, the length of stay did not tend to be consistently longer for patients operated on than for patients not operated on. This was not the case for patients with multiple diagnoses; surgery lengthened the stay for such patients considerably. It may also be noted that, in each of the regions, patients with multiple diagnoses who were not operated on had appreciably longer hospital stays than patients who were operated on but had a single diagnosis.
Diagnostic Category
The length of the hospital stay is closely related to the condition for which the patient is hospi- talized. Medicare patients hospitalized for cat- aract, for example, generally stay 7-8 days in contrast to patients hospitalized for fracture of
a6 SOCIAL SECURIIY
CHART 3.-Mean length of stay for short-stay hospital CIIART 4.-Mean length of stay for short-stay hospital discharges under Medicare, by census region and by discharges under Medicare, by census region and by single and multiple diagnosis, 1969-71 discharges with and without surgery, 196!Vi’l
Days Days
WITH SURGERY MULTIPLE DIAGNOSIS 16
14
12
10
6
6
4
2
0 ‘69’70’71 ‘69’70’71
North- North east Central
Days
‘69’70’71 South
‘69’70’71 West
SINGLE DIAGNOSIS 16 r WITHOUT SURGERY
‘69’70’71 North-
east
Days
‘69’70’71 North
Central
‘69’70’71 South
‘69’70’71 West
14
12 12
10 10
6 6
6 6
4 4
2 2
n n ‘69’70’71
North- east
‘69’70’71 North
Central
‘69’70’71 South
‘69’70’71 West
the femur-a condition that requires long hos- pital stays averaging 24-25 days. Consequently, the average length of stay reflects the distri- bution of conditions among a particular set of patients. One of the factors often suggested as cont,ributing to generally longer hospital stays in teaching hospitals, compared with those in other hospitals, is that the mix of patients in teaching hospitals includes more complicated conditions requiring longer treatment.
Differences in hospital costs and utilization in Canada and the United States for 1950-67 were analyzed by Ronald Andersen and John T. Hull in a study published a few years ago.’ The
‘Ronald Andersen and John T. Hull, “Hospital Utili- zation and Cost Trends in Canada and the United States,,’ Health Services Research, Fall 1969.
‘69’70’71 ‘69’70’71 ‘69’70’71 ‘69 ‘70 ‘71 North- North South West
east Central
authors found that during the years studied the length of stay in Canada had been consistently greater than it had been in the United States. Hypothesizing that such differences might reflect a different patient mix-such as a higher pro- portion of Canadians admitted for chronic dis- orders, often involving longer stays-the authors gathered information on length of stay in the two countries for 30 specific acute and chronic conditions.8 They found that Canadians stayed
a The classification used by Andersen and Hull for categorizing the 30 conditions as acute or chronic agrees with lists of acute and chronic conditions used by the National Center for Health Statistics in presenting findings from the Health Interview Survey (in the Series 10 publications) except for hemorrhoids, which are classified as “chronic” in that survey.
BULLETIN, JULY 1975 21
longer for every diagnostic category. The ratio of length of stay in Canada to that in the United States tended to be especially high for the chronic disorders studied, in comparison with the acute conditions.
The source data for this report permit a similar tabulation of Medicare data by regions for 1969 and 1970. Thirty diagnostic conditions mere also tabulated, and the same codes as those selected for the CanadajUnited States study were used whenever possible (omitting for the Medicare population conditions relating to pregnancy and delivery) and the same classification of specific diagnostic categories as acute or chronic. Table 3 shows the findings for Medicare discharges by type of condition and region. It is evident from these figures that the findings parallel those of the original study. No matter what the condition, the length of stay was nearly always longest in
the Northeast and shortest in the West, with the North Central States and the South occupying their usual positions.
The ratio of length of stay by Medicare patients in the Korthenst to that in the West is also given in table 3. In 1969, for acute conditions, the ratios ranged from 1.21 to 1.48, with the median ratio falling at 1.34. For chronic conditions, the ratios ranged from 1.23 to 1.59, with the median ratio a little higher (1.44). (In the Canada/ United States study cited above, the median ratio was 1.31 for acute conditions and 1.95 for chronic conditions.)
Mean length-of-stay figures are provided for the three broad age groups studied in table 4. In each age group it is evident that for each diagnosis the hospital stays were longest in the Northeast and shortest in the West, with the other regions usually holding the same rank order
T’;;;7:-Mean length of stay for all short-stay hospital discharges under Medicare, by census region and by diagnosis, 1969
with obstruction _______ Cholelithissis.... ____ _ ____ _ Cholecystitis and cholangi-
tie w/o mention of calculi. ______________ ___
Fracture of humerus...... _ Fracture of femur ______ __. . Head injury (excludmg
skull fracture). ______. _.
Medzan ratio _________________ _.
10 9
:;: :
14 8
16 1 11 5 12 5 17 3
11 9
:i t
:B” : 27 8
11 6
_-_-_
1: 3” 10 7
10 0
:“4 ;
13 6
14 6 11 1 11 6 14 9
10 8
12 6 15 7
12 6 15 5 282
11 0
.____
470-x 490 491
492
493
Et 559-53
5M) a
661 6a4
in between. For chronic conditions, the median ratio of the length of stay in the Northeast to the stay in the West exceeded the corresponding
BULLETIN, JULY 1975 2a
figure for acute conditions in each age group. As shown earlier, the length of stay for all
discharges under Medicare increases with advanc- ing age. In comparing the figures on length of stay in each region for each specific diagnosis for patients aged 75-84 with corresponding data for patients aged 65-74, it is found that in 87 percent of the comparisons (104 out of 120) the stays were greater for patients in the middle group than for those in the youngest group. Simi- larly, in 61 percent of the comparisons (73 out of 120) of length-of-stay data for patients aged 85 and over with corresponding data for patients aged ‘Z-84 the average stay for the oldest group is seen to be greater than the average for the middle group.
The expectation of increasing length of stay mit)h advancing age was not supported by the figures for acute coronary occlusion, head injury (excluding skull fracture) , malignant neoplasm of stomach, malignant neoplasm of rectum, malig-
nant neoplasm of breast, cerebral hemorrhage (nontraumatic and stroke), and rheumatoid arthritis. The reversal in the general relationship of increasing length of stay with age may be explained by the fact that hospital stays for certain conditions are more frequently interrupted by the death of the patient than is the case for other conditions and that, as Medicare data show, as age increases so does the proportion of stays terminating with the death of the patient.
Similar information for patients with a single diagnosis and for those with multiple diagnoses is provided in table 5. In nearly every instance, no matter what the condition, the mean length of stay was greatest in the Northeast, which was followed by the North Central States, the South, and the West-in that order. As expected, in each region, for each of the diagnoses the hospital stay was lower for discharges with a single diag- nosis than for those with more than one diagnosis.
As measured by the ratio of length of stay
TABLE 5 -Mean length of stay for short-stay hospital discharges under Medicare, by census region, by discharges with single and multiple diagnoses, and by diagnosis, 1969
- Discharges with multiple diagnoses Discharges with single diagnosis
--
I
Mean length of stay (in days) Mean length of stay (in days)
tion..............-....:-----.---------- Cholehthiasis ____________ _____ _____________ Cholecystltis and cholangitfs w/o mention
ofcalcuii....-.-..-.-----~--~--------~-- Fracture of humerus _______________________ Fracture of femur __________________________ Head injury (excludmg skull fracture)....-.
585 812
Em-21 SO-56
Median ratm -_-__._________._________________ Chrome conditions
TABLE 6.-Mean length of stay for short-stay hospital discharges under Medicare, by census region, by discharges Rlthout and with surgery, and by diagnosis, 1969
Discharges without surgery
-
.-
-. Discharges with surgery r -
I Mean length of stay (in days) Mean length of stay (in days) Diagnosis or diagnostic group Ratio of qortheast to west E Jorth
Median ratio -_-______________________________ -----.---------
in the Northeast to the length of stay in the West, regional variations in length of stay for discharges with a single diagnosis were similar to the varia- tions in length of stay for discharges with mul- tiple diagnoses. The ratios for acute conditions ranged from 1.21 to 1.52 for single diagnosis and from 1.16 to 1.49 for multiple diagnoses, with corresponding median ratios of 1.3’7 and 1.32. It may be observed that the median for chronic conditions was a little higher than the median for acute conditions-l.47 and 1.45, respectively.
plasm of bladder, and cataract-in each of the regions, the mean length of stay for a specific diagnosis not involving surgery was generally shorter than the same condition with surgery.
Data shown in table 6 for discharges with and without surgery indicate that the regions gener- ally held the same rank order in length of stay as reported earlier. 8 Except for three diagnoses- malignant neoplasm of breast, malignant neo-
Regional variations, as measured by the ratio of mean length of stay in the Northeast to the mean length of stay in the West, were similar for discharges with surgery and those without, but the largest discrepancies between these two regions for this set of diagnoses are found for discharges with surgery. In the Northeast, the average stay for acute bronchitis and for bron- chitis (unqualified) ’ was more than 80 percent greater than it was in the West. The correspond- ing median ratios were similar, and again the medians were slightly higher for chronic condi- tions than for acute conditions.
‘The patient’s primary diagnosis is coded, as well as any surgical procedure performed during the hospital stay. Thus, a “discharge with surgery” does not neces- sarily imply that the surgery was associated with his primary diagnosis.
Length-of-stay data for 1970 show regional patterns identical with those for 1969. As noted earlier, the overall ratio of the average stay in the Northeast to the average stay in the West
BULLETIN, JULY 1975 25
increased from 1.42 in 1969 to 1.49 in 1970. Of source data. The pattern already cited consist- the 30 diagnoses tabulated, 27 showed an increase ently-length of stay longest in the Northeast, in 1970 in the ratio of mean length of stay in the followed by the North Central, South, and West Northeast to that in the West (table 3). regions-held in nearly every instance.
Data for 1971 are not strictly comparable with 1969 and 1970 data because of the 1971 change- over in coding from the Seventh Revision of the ICDA to the Eighth Revision. (See the Technical Note at the end of the article.)
Table 7 presents length-of-stay data for spe- cific diagnoses selected from the 1971 source to match wherever possible the rubrics in tables 3-6. The figures for the four regions and for the ratios of the Northeast to the West show the same regional length-of-stay patterns as those for 1969 and 1970.
Such consistent regional differences-especially when examined by diagnosis-suggest that factors other than the medical ones for which the patient was hospitalized affect the duration of stay. One such factor applies to the elderly far more than to younger persons: When the elderly become hospitalized they are likely to face complex socio- economic problems involving posthospital ar- rangements, stemming in part from old age, living alone, and the necessity of receiving continued medical and nursing services.
To enlarge the scope of comparison by region, compilations were made for 50 additional diag- nostic groups randomly selected from the basic
TABLE 7.-Mean length of stay for all short-sta hos ital discharges under Medicare, by census region an nosis, 1971
d’by zag-
Studies in general hospitals have borne out the theory that many patients (and especially the elderly) remain in the hospital beyond the time they require that level of care. These patients could more appropriately be discharged from the hospital and receive posthospital extended-care services instead. In a utilization review study of a sample of hospitalized patients of all age groups, James G. Zimmer10 reported that, among all patients observed and judged by reviewers to be inappropriately hospitalized on the day of review, “delay in discharge” accounted for 82.2 percent of the cases. Moreover, of all patients judged to be inappropriately hospitalized, “chronic disease hospital or nursing home” was recommended as the proper level of care for 52.2 percent of the cases.
The author of that study provided unpublished data, broken out by age groupings, for use in this report. These data show that hospital bed mis- utilization is more likely to occur among aged patients and that the recommended level of care for aged patients judged inappropriately hospi- talized was very frequently a chronic-care facility. The proportion of patients judged misplaced in the hospital was 7.4 percent of those under age 71 but 15.8 percent of those aged 71 and over. Moreover, of those aged 65 and over who were judged inappropriately hospitalized on the day of review, 74.2 percent had a chronic-care facility recommended.
Nonmedical factors that clearly need examina-
lo James G. Zimmer, “Length of Stay and Hospital Bed Wsutilization,” dledical Care, May 1974 ; -and James Zimmer, unpublished data provided in a personal com- munication, January 27, 1975.
SOCIAL SECURITY
tion as determinants of hospitalization among the elderly include the impact of suitable home conditions for the return of the patient and/or community resources for posthospital care. As one factor of this type that may be reflected in regional variations in the hospital stay, the avail- ability and use of skilled-nursing facility (SNF) services under Medicare are examined next.
REGIONAL DIFFERENCES IN SNF SERVICES
Availability of Services
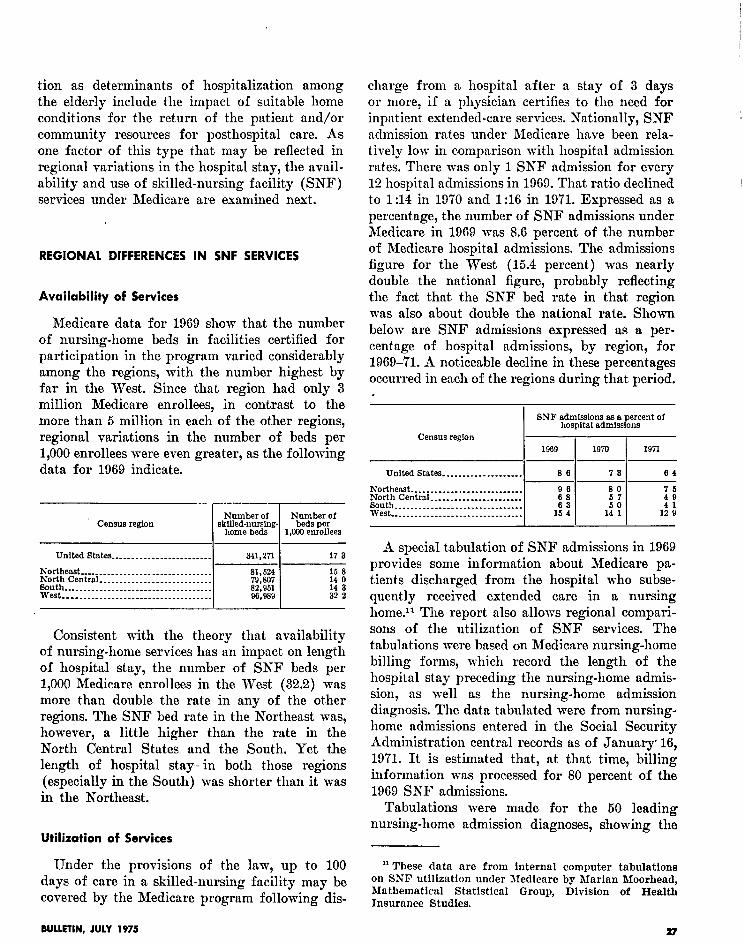
Medicare data for 1969 show that the number of nursing-home beds in facilities certified for participation in the program varied considerably among the regions, with the number highest by far in the West. Since that region had only 3 million Medicare enrollees, in contrast to the more than 5 million in each of the other regions, regional variations in the number of beds per 1,000 enrollees were even greater, as the following data for 1969 indicate.
United states ______________ _ __________
Northeast..-............................-- North Central ____________ _ ______ _ ______ __ @&I$ ---_______ ___ ___-----_________ _ ______
__-______.___________________________
341,271 17 3
;%i 15 8 14 0
a2:951 14 3 96,989 32 2
Consistent with the theory that availability of nursing-home services has an impact on length of hospital stay, the number of SNF beds per 1,000 Medicare enrollees in the West (32.2) was more than double the rate in any of the other regions. The SNF bed rate in the Northeast was, however, a little higher than the rate in the North Central States and the South. Yet the length of hospital stay- in both those regions (especially in the South) was shorter than it was in the Northeast.
Utilization of Services
Under the provisions of the law, up to 100 days of care in a skilled-nursing facility may be covered by the Medicare program following dis-
charge from a hospital after a stay of 3 days or more, if a physician certifies to the need for inpatient extended-care services. Nationally, SNF admission rates under Medicare have been rela- tively low in comparison with hospital admission rates. There was only 1 SNF admission for every 12 hospital admissions in 1969. That ratio declined to 1:14 in 1970 and 1:16 in 1971. Expressed as a percentage, the number of SNF admissions under Medicare in 1969 was 8.6 percent of the number of Medicare hospital admissions. The admissions figure for the West (15.4 percent) was nearly double the national figure, probably reflecting the fact that the SNF bed rate in that region was also about double the national rate. Shown below are SNF admissions expressed as a per- centage of hospital admissions, by region, for 1969-71. A noticeable decline in these percentages occurred in each of the regions during that period.
BNF admisslons as 8 percent of hospital admissions
Census region 1969 1970 1971
United States-.......------------ 86 73 64
Northeast. ___________________________ 2
80 North Central _____ _ ____ _________.___ 8outh. __________.___.___._ _ __________
-I- 1: :
ii 1:
west --______-_____-_ .-_----_-__------ 14 1 ld i
A special tabulation of SNF admissions in 1969 provides some information about Medicare pa- tients discharged from the hospital who subse- quently received extended care in a nursing home.ll The report also allows regional compari- sons of the utilization of SNF services. The tabulations were based on Medicare nursing-home billing forms, which record the length of the hospital stay preceding the nursing-home admis- sion, as well as the nursing-home admission diagnosis. The data tabulated were from nursing- home admissions entered in the Social Security Administration central records as of January. 16, 19’71. It is estimated that, at that time, billing information was processed for 80 percent of the 1969 SNF admissions.
Tabulations were made for the 50 leading nursing-home admission diagnoses, showing the
I1 These data are from internal computer tabulations on SSF utilization under Medicare by Marian Rloorhead, Mathematical Statistical Group, Division of Health Insurance Studies.
BULLETIN, JULY 1975 27
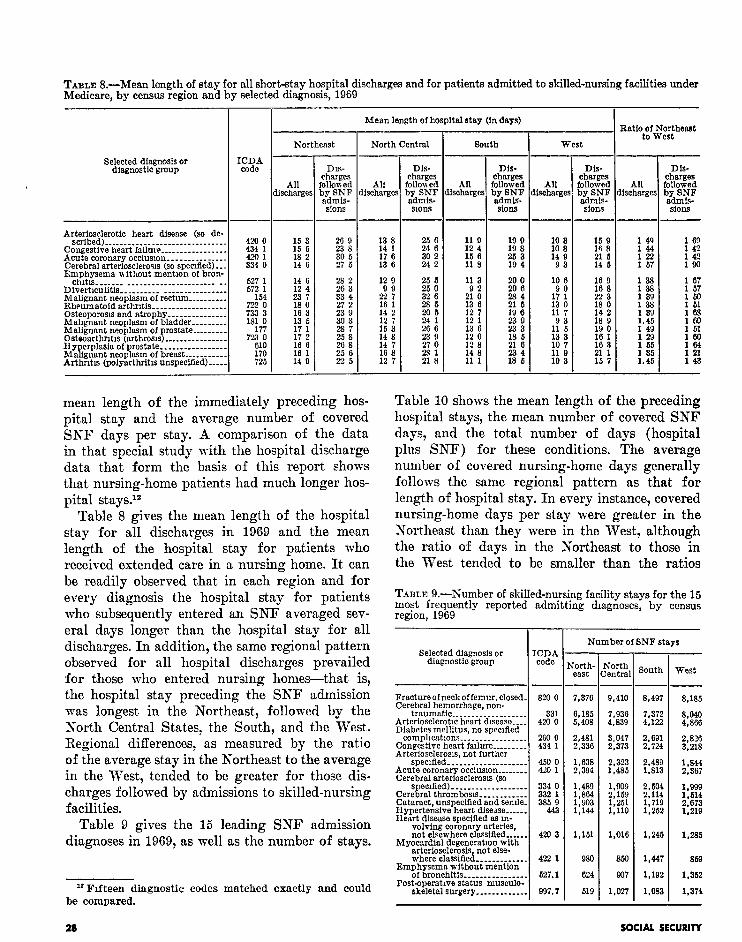
TABLE S.-Mean length of stay for all short-stay hospital discharges and for patients admitted to skilled-nursing facilities under Medicare, by census region and by selected diagnosis, 1969
chltls _______ _____ ___ _.____________ _ Divertlculitls ____ _ _____ __ ._________._., Malignant neoplasm of rectum ________.. Rheumatoid arthritis ______________ _ ___. Osteoporosis and atrophy ______________. Mahgnant neoplasm of bladder ____ _ ___, Malignant neoplasm of prostate _______.. Ostaoarthrltls (arthrosls) __.__________-.. H y Ma P
erplasia of prostate ______.___ __ ___. ignant neoplasm of breast __________
Arthrltls (polyarthritls unspecffied)..-..
15 3 15 5 18 2 14 6
14 6 12 4
% 16 3 13 6 17 1
:6’ i 16 1 14 9
26 9 23 8
;: z
1 i 33 4 27 2 23 9
% 25 8 26 8
iii
:i f 17 6 13 6
12 9
2; ; 16 1 14 2 12 7
:: i 14 7 16 8 12 7
11 0 12 4 15 6 11 8
11 3
2: i 13 6
:; :
:“z :
:: i 11 1
:i : 14 0 93
10 I3
1; Y 13 0 11 7
1: “5 13 3 10 7 11 0 10 3
2 II 21 b 14 b
16 9 16 a 223 18 0
:;t i 10 0 16 1 16 3 21 1 15 7
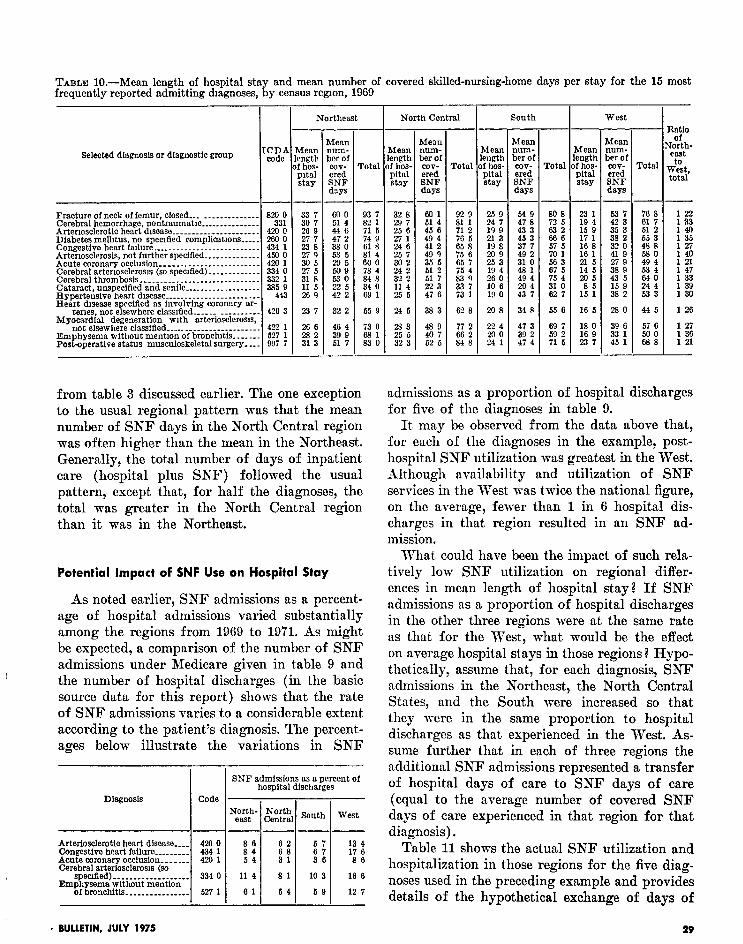
Table 10 shows the mean length of the preceding hospital stays, the mean number of covered SNF days, and the total number of days (hospital plus SNF) for these conditions. The average number of covered nursing-home days generally follows the same regional pattern as that for length of hospital stay. In every instance, covered nursing-home days per stay were greater in the Northeast than they were in the West, although the ratio of days in the Northeast to those in the West tended to be smaller than the ratios
mean length of the immediately preceding hos- pital stay and the average number of covered SKF days per stay. A comparison of the data in that special study with the hospital discharge data that form the basis of this report shows that nursing-home patients had much longer hos- pital stays.lz
Table 8 gives the mean length of the hospital stay for all discharges in 1969 and the mean length of the hospital stay for patients who received extended care in a nursing home. It can be readily observed that in each region and for every diagnosis the hospital stay for patients who subsequently entered an SNF averaged sev- eral days longer than the hospital stay for all discharges. In addition, the same regional pattern observed for all hospital discharges prevailed for those who entered nursing homes-that is, the hospital stay preceding the SNF admission was longest in the Northeast, followed by the R’orth Central States, the South, and the West. Regional differences, as measured by the ratio of the average stay in the Northeast to the average in the West, tended to be greater for those dis- charges followed by admissions to skilled-nursing facilities.
TABLE S.-Number of skilled-nursing facility stays for the 15 most frequently reported admitting dragnoses, by census region, 1969
Gelected diagnosis or diagnostfc group
-
I
.-
CDA code
- I Number of BNF stays
I
West
Fracture of neck of femur, closed. Cerebral hemorrhage. non-
7,376
6,185 b.408
2,481 2,336
1,633 2,394
1,489 1,864 1,993 1,144
;;Fril South --
9,410 8,497
7,936 7,372 4,839 4,122
t::;; 2,691 2,724
::Ei 2,489 1,813
1,ws 2,159 “2E 1,251 1:719 1,110 1,252
8,185
8,040 4,866
2,826 3,218
%;
:%I 2:673 1,219
Table 9 gives the 15 leading SNF admission diagnoses in 1969, as well as the number of stays.
420 3 1,161 1,285
“Fifteen diagnostic codes matched exactly and could be compared.
where classified ____________. Emphysema without mention
of bronchitfs _______________. Post-operative status musculo-
skeletal surgery ____________.
422 1 080
627.1 624
097.7 619
1,016 1,24b
850 1,447
907 1,192
1,027 1,083
869
1.352
1,374
28 SOCIAL SECURITY
TABLE lO.-Mean length of hospital sta and mean number of covered skilled-nursing-home days per stay for the 15 most frequently reported admitting diagnoses, ii y census region, 1969
not elsewhere classified _____ ______________ ____ Emphysema without mention of bronchitis...... Postoperative status musculoskeletal surgery. ._
from table 3 discussed earlier. The one exception to the usual regional pattern was that the mean number of SNF days in the North Central region was often higher than the mean in the Northeast. Generally, the total number of days of inpatient care (hospital plus SNF) followed the usual pattern, except that, for half the diagnoses, the total was greater in the North Central region than it was in the Northeast.
admissions as a proportion of hospital discharges for five of the diagnoses in table 9.
It may be observed from the data above that, for each of the diagnoses in the example, post- hospital SNF utilization was greatest in the West. Although availability and utilization of SNF services in the West was twice the national figure, on the average, fewer than 1 in 6 hospital dis- charges in that region resulted in an SNF ad- mission.
Potential Impact of SNF Use on Hospital Stay
As noted earlier, SNF admissions as a percent- age of hospital admissions varied substantially among the regions from 1969 to 1971. As might be expected, a comparison of the number of SNF admissions under Medicare given in table 9 and the number of hospital discharges (in the basic source data for this report) shows that the rate of SNF admissions varies to a considerable extent according to the patient’s diagnosis. The percent- ages below illustrate the variations in SNF
specked)-.................. 334 0 Emphysema without mention
of bronchitis ________________ 527 1
I
--
-
gorth- ,“,$;; east
--
i8” 31
114 81
81 54
South West
ii 36
10 3
59
What could have been the impact of such rela- tively low SNF utilization on regional differ- ences in mean length of hospital stay? If SNF admissions as a proportion of hospital discharges in the other three regions were at the same rate as that for the West, what would be the effect on average hospital stays in those regions? Hypo- thetically, assume that, for each diagnosis, SNF admissions in the Northeast, the North Central States, and the South were increased so that they were in the same proportion to hospital discharges as that experienced in the West. As- sume further that in each of three regions the additional SNF admissions represented a transfer of hospital days of care to SNF days of care (equal to the average number of covered SNF days of care experienced in that region for that diagnosis).
13 4 17 6 86
16 6
12 7
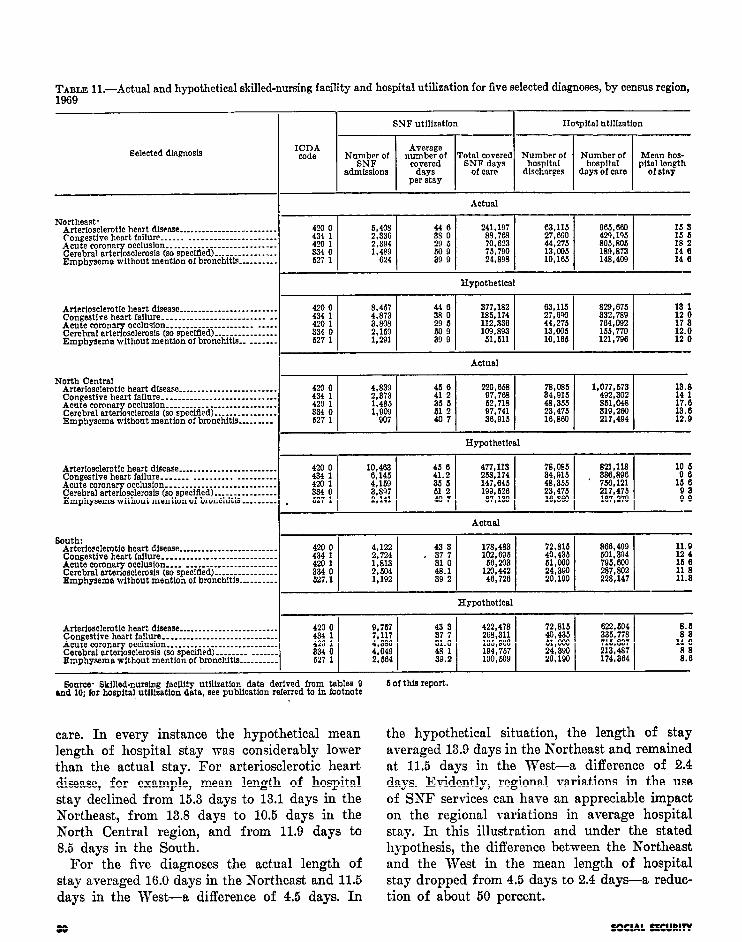
Table 11 shows the actual SNF utilization and hospitalization in those regions for the five diag- noses used in the preceding example and provides details of the hypothetical exchange of days of
. BULLETIN, JULY 1975 29
TABLE ll.-Actual and hypothetical skilled-nursing facility and hospital utilization for five selected diagnoses, by census region, 1969
North Central Arterfosclerotfc heart disease __.__.....__________----. Congestive heart failure _..___________...._.-.------. Acute coronar Cerebral arter osclemsia (so specified) ..__._._.______. T
Bource. Bkflled-nursing facility utllisatlon data derived from tables 9 md 10; for hospital utllleation data, see publication referred to in footnote
6 of this report.
care. In every instance the hypothetical mean length of hospital stay mas considerably lower than the actual stay. For arteriosclerotic heart disease, for example, mean length of hospital stay declined from 15.3 days to 13.1 days in the Northeast, from 13.8 days to 10.5 days in the North Central region, and from 11.9 days to 8.5 days in the South.
For the five diagnoses the actual length of stay averaged 16.0 days in the Northeast and 11.5 days in the West-a difference of 4.5 days. In
the hypothetical situation, the length of stay averaged 13.9 days in the Northeast and remained at 11.5 days in the West-a difference of 2.4 days. Evidently, regional variations in the use of SNF services can have an appreciable impact on the regional variations in average hospital stay. In this illustration and under the stated hypothesis, the difference between the Northeast and the West in the mean length of hospital stay dropped from 4.5 days to 2.4 days-a reduc- tion of about 50 percent.
00 SOCIAL SECURITY
OTHER MEASURES OF HOSPITAL UTILIZATION
Medicare data indicate that other measures of short-stay hospital utilization also varied con- siderably according to region. The number of persons per 1,000 enrollees in each region who used short-stay hospital services, as well as the number of discharges per 1,000 enrollees, showed regional variations that were very marked and consistent over a period of time. These and other utilization measures are shown below for 1967 and 1968 discharges. The ratio of total discharges
Census region sons hos- No~~*~Y Mean pitslized charges length of per 1 ,fml per 1,000 enrollees enrollees
stay
Ratio of Number numberof of dam dmharges of caie to numl5er
per 1,ooO of persons enrollees hospital-
ized
source Eee publication referred to in footnote 1 of this report, 1968 data from unpublished data for 1968 edition
to the total number of persons served, included in the tabulation, reflects the rate of multiple hospitalizations. The figures above illustrate the general consistency in regional rankings for the various measures of hospital utilization but also indicate that regional patterns may differ for different measures of utilization.
One hypothesis that might be examined through the use of these data is that average length of hospital stay is lowest where multiple hospitali- zations are highest. In other words, it is possible that the mean length of stay is lowest in the West because individuals in that region are readmitted to hospitals more frequently for the same con- ditions.
The data in the preceding tabulation indicate that multiple hospitalizations did tend to occur more often in those regions where the mean length of stay was shortest. For persons who were hospitalized at least once, the average
number of hospitalizations was 1.38 in 1967 and in 1968. The Northeast had the lowest rate of multiple hospitalizations, and the South had the highest. The rate of multiple hospitalizations was relatively high in the West also. A study in progress should provide further and more detailed data about multiple hospitalizations, including information on whether the relatively high rates in the South and the West (where the mean length of stay is low) actually reflect higher than average readmissions for the same condition.
SUMMARY AND CONCLUSIONS
Consistent and marked regional variations have been observed in short-stay hospital utilization under Medicare. Furthermore, these regional differences tend to persist over a period of time. This study, which focuses on the striking regional differences in mean length of hospital stay, found that these differences in duration of stay were not fully explained by differences in the patient characteristics examined here-age, primary diag- nosis, the presence of complicating conditions, and whether or not surgery was performed.
Implications are that these patient character- istics may fail to explain regional differences in other measures of hospital utilization, such as the number of persons who use short-stay hospital services and the number of discharges per 1,000. The findings suggest the need for extensive study of regional variations in managing the special medical and socioeconomic problems of the hos- pitalized elderly, as well as the need to study regional differences in patterns of medical care delivery.
TECHNICAL NOTE
The data in this study are derived from bills for inpatient services in short-stay hospitals for a 20-percent sample of Medicare beneficiaries. All discharges are included-that is, bills for patients discharged alive, as well as those who died during hospitalization or who were trans- ferred to other facilities.
Data for 1969 are based on the 5.4 million total discharges during 1969, which were recorded in Social Security Administration central records
IMLETIN, JULY 1975 31
by December 2, 1?‘70; data for 1970 are based on the 5.5 million discharges recorded by January 1972; and 1971 data are based on the 5.7 million discharges during 1971 recorded by January 1973.
Source of Data ,
When a beneficiary is hospitalized, an admis- sion notice and subsequent bills are received by the Social Security Administration, where they are processed and placed on file. Information from the billing forms is matched to other central records maintained by the Social Security Admin- istration, which contain data about I the charac- teristics of each Medicare beneficiary,’ as well as on individual short-stay hospitals participating under MYedicare. General and special hospitals reporting average stays of less than 30 days are included. In this study, discharges are categorized by the address of the hospital providing care.
Participating hospitals use standard billing forms to identify the beneficiary and specify the services, r,@ered during the stay. The billing form includes ‘space for the entry of a description of the patient’s primary diagnosis at the time of discharge from the hospital. Primary diagnosis
is defined as the primary reason for the patient’s hospitalization-that is, the disease, illness, con- dition, or injury requiring the current hospitaliza- tion. Space is also provided for the entry for any secondary diagnoses. The name and date of any surgical procedure performed during the hospital stay are recorded.
< Medical Coding .
, The primary discharge diagnosis on each bill
in the 20-percent sample of Medicare benefiqjaries is assigned a four-digit code, using the Inter- national Classification of Diseases Adapted- Seventh Revision (ICDA-7) for discharges in 1969 and 1970 and the Eighth Revision for dis- charges in 1971. If more than one diagnosis appears on the bill and the primary diagnosis is not indicated, the first diagnosis listed is coded. If, however, a “symptom or ill-defined condition” is listed first, preference is given to the more substantive diagnosis that appears second.
Surgical procedures are also coded on each sample bill on which one or more surgical pro- cedures are reported. Codes are assigned through the use of the Current Procedural Terminology
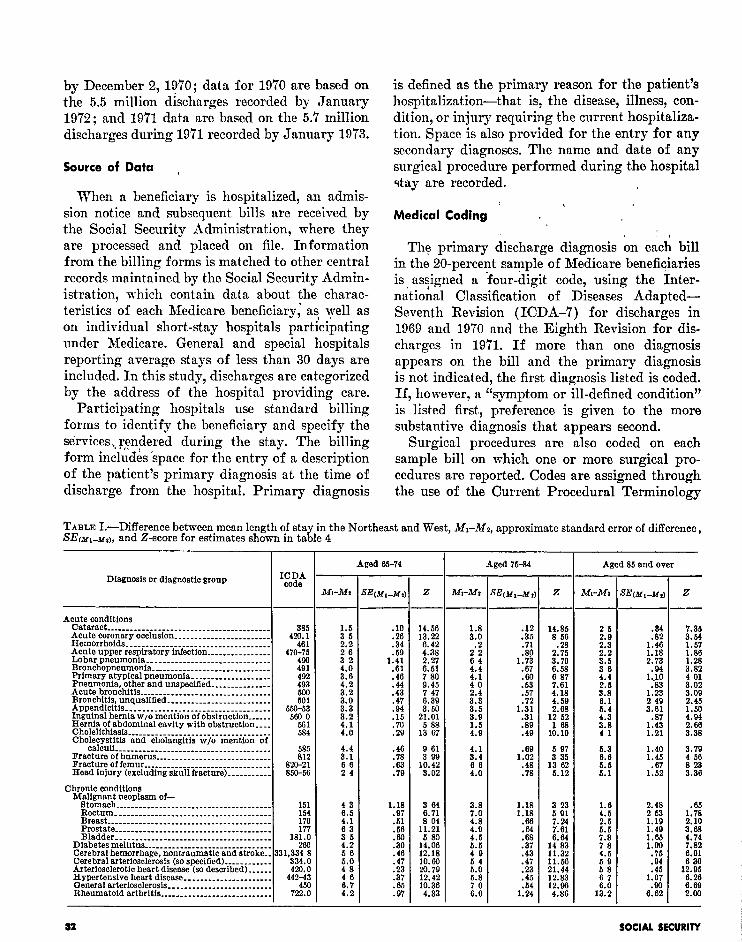
TABLE I.-Difference between mean length of sta S&f,--MI), and Z-score for estimates shown in ta ti
in the Northeast and West, M&~z, approximate standard error of difference, le 4
Diagnosis or diagnostic group
Acute conditions Cataract ____._____________._____________________- Acute coronary occlusion ___________ __ ___________ Hemorrhoids-........----~~--------------------- Acute upper respiratory infection ________._______ Lobar pneumonia _______________________________ Bronchopnemnonia. ________________ ____ _____ ____ Primary atypical pneumonia ________________ ____ Pneumonia, other and unspecified _______________ Acute bronchitis ___________._____________________ Bronchitis, unqualified ___________________ _ ______ Appendicitis __________________________ __________ Inguinal hernia w/o mention of obstruction-..-.. Hernia of abdominal cavity with obstruction.-.. Cholelithiasis ____________________________________ Cholecystitis and cholangitis w/o mention of
385 420.1
461
470;z 491 492 493 600 601
55063 5600
661 684
calcull--.-...-...-.-.----------------------- 685 Fracture of humerus _____________________________ 812 Fracture of femur ________________________________ 829-21 Head injury (excluding skull fracture) ___________ SO-66
(CPT) manual.13 When two or more surgical procedures appear on a bill the first listed surgical procedure is coded. If, however, the first listed procedure is primarily diagnostic in nature- such as an endoscopic procedure or biopsy- coding preference is given to more serious pro- cedures such as resections, removals, repairs, etc. The CPT defines surgery to include procedures involving incision, excision, amputation, intro- duction, endoscopy, repair, destruction, suture, manipulation, and surgical-collapse therapy.
Sampling Variability
Since the mean length-of-stay data in this study are based on discharges for a sample of enrolled persons, they may differ somewhat from the figures that would have been obtained from the entire universe of enrolled persons.
The standard error is primarily a measure of sampling variability-that is, of the variations that occur by chance because a sample rather than the whole universe was used. The chances are about 68 out of 100 that an estimate from
la Current Procedural Terminology (First Edition), American Medical Association, 1966.
the sample would differ from the result for the entire universe by less than the standard error; about 95 out of 100 that the difference would be less than twice the standard error; and about 99 out of 100 that the difference would be less than two and one-half times the standard error. This applies equally to sample estimates of differences.
Table II4 sholvs the differences found between the mean length of stay in the Northeast and the West (ill, - N,) for the estimates shown in table 4. For example, the mean length of stay for discharges with cataract for patients aged 65-74 was 8.0 days in the Northeast and 6.5 days in the West. That is, ill, - Mz = 8.0 - 6.5 = 1.5.
Table I also shows the approximate standard errors of the difierences in mean length of stay in the Northeast and the West--XEcnrl _ Mu)--- for the selected conditions. The value (2) of the ratio of (ill, - Mz) to SEtyl _ u,j is also given in table I. A Z value of 1.96 or greater can be interpreted to mean that the difference between the mean length of stay in the Northeast and the West is significant at the 95-percent confidence level.
I’ Prepared with the assistance of Nathaniel M Pigman, Jr., of the Mathematical Statistical Group of the Division of Health Insurance Studies
Notes and Brief Reports
Automatic Increases Under the Social Security Programs*
OASDHI benefit increase.-As the result of legislation enacted in 1972 and 1973, the first1 automatic cost-of-living increase in cash benefits
*Prepared by Albert Rettig, Division of Retirement and Survivor Studies, Office of Research and Statistics.
’ P.L 92-336 (signed July 1, 1972), P.L. 92-603 (signed October 30, 1972), and P.L 93-233 (signed December 31, 1973).
The previous 11-percent increase in OASDHI benefits effective for June 1974 was legislated (P.L. 93-233) by Congress on the basis of an estimated change in the cost of living from the third quarter of 1972 to the second quarter of 1974. In enacting this increase, Congress specified that the 11-percent increase would be regarded as a cost-of-living change, rather than a general benefit change, for purposes of implementing future automatic cost-of-living provisions of the law.
BULLETIN, JULY 1975
under the old-age, survivors, disability, and health insurance (OASDHI) program, went into effect June 1, 1975. The increase, reflected in the July 3 checks, is 8.0 percent. It applies to all beneficiaries on the rolls except those receiving benefits under the special minimum-benefit provision.
The cost-of-living benefit increase reflects the change in the Consumer Price Index (CPI) of the Bureau of Labor Statistics from the second quarter of 19’74 to the first quarter of 1975. The 8.0-percent rise was determined by dividing the average of the CPI for January, February, and March of 1975 by the average of the CPI for April, May, and June 1974 (the effective quar- ter of the previous increase-11 percent-in OASDHI benefits).
The next automatic cost-of-living benefit in- crease mill be based on the increase in the CPI from the first quarter of 1975 (if there is no statutory benefit increase) to the first quarter of