Olle Tranberg Supervisor: Mattias Larsson, SLU, Dept.of Plant Protection Biology Co-supervisor: Matts Lindbladh, SLU, Southern Swedish Forest Research Centre; and Thomas Ranius, SLU, Dept. of Ecology. Medium-term population development and responses to habitat conditions of a beetle, Osmoderma eremita, inhabiting hollow trees Swedish University of Agricultural Sciences Master Thesis no. 261 Southern Swedish Forest Research Centre Alnarp 2016
Transcript
Olle TranbergSupervisor: Mattias Larsson, SLU, Dept.of Plant Protection BiologyCo-supervisor: Matts Lindbladh, SLU, Southern Swedish Forest Research Centre; and Thomas Ranius, SLU, Dept. of Ecology.
Medium-term population developmentand responses to habitat conditions of a beetle,
Osmoderma eremita, inhabiting hollow trees
Swedish University of Agricultural Sciences Master Thesis no. 261Southern Swedish Forest Research CentreAlnarp 2016
Swedish University of Agricultural Sciences Master Thesis no. 261Southern Swedish Forest Research CentreAlnarp 2016
Olle TranbergSupervisor: Mattias Larsson, SLU, Dept. of Plant Protection BiologyCo-supervisors: Matts Lindbladh, SLU, Southern Swedish Forest Research Centre; and Thomas Ranius, SLU, Dept. of Ecology.Examiner: Jörg Brunet, SLU, Southern Swedish Forest Research Centre
Medium-term population developmentand responses to habitat conditions of a beetle,
Abstract Old oaks play an important role in the southern Swedish landscape by maintaining available habitats for many saproxylic species, several of which today are on the international Red List of threatened species. Old oaks can develop important habitats, such as hollows with wood mould, which is the habitat for the European hermit beetle (Osmoderma eremita). Habitat fragmentation as well as habitat qualities are important features that affect population sizes of O. eremita, although, most previous studies have only examined this relationship in a short-term perspective. This study investigated the medium-term population development of O. eremita, colonization and extinction rates and furthermore population trends related to tree variables that previously have affected beetles associated with hollow trees. The study combined data, covering a period of 20 years from a well-studied area with O. eremita in Östergötland, southern Sweden, concerning habitat variables and captures of O. eremita, including several previous publications, unpublished data, and new measurements in 2015. Population development of O. eremita has not previously been investigated to the same extent as in this study. Results demonstrate that hollow trees can be usable as habitat for long time; the study indicates that 9.7% of the examined trees were usable as habitat ≥20 years. The results revealed that local populations of O. eremita have developed both negatively and positively during the study period, leaving the overall population trend unchanged. In a medium-term perspective habitat colonization and extinction rate of O. eremita revealed corresponding rates (0.80% respectively 0.64%), indicating that colonization is compensating for extinction. Several habitat variables alter responses on population development. Tree age, sun exposure of entrance hole and canopy closure revealed significant positive correlations to population development, while tree circumference indicated a significant negative correlation. Death of inhabited hollow trees has a negative effect on population development. The results also revealed that the observed annual tree mortality rate was moderate (0.90%) and comparable to previous studies. Keywords: Osmoderma eremita, European hermit beetle, metapopulation, colonization and extinction, habitat, saproxylic species, tree hollows, Pedunculate oak, Quercus robur
4
Sammanfattning Gamla ekar spelar en viktig roll i det sydsvenska landskapet genom att upprätthålla tillgången på livsmiljöer för många vedlevande arter, av vilka flera idag är listade på den internationella rödlistan för hotade arter. I äldre ekar utvecklas håligheter med mulm, som utgör habitatet för läderbagge (Osmoderma eremita). Habitatets fragmentering och egenskaper påverkar populationsstorleken av läderbagge, men har i de flesta tidigare studier endast undersökts ur ett kortare tidsperspektiv. Denna studie syftade till att undersöka populationsutvecklingen av läderbagge, koloniserings- och utdöendetakten samt populationsutvecklingen i relation till habitatvariabler som tidigare visat sig påverka hålträdslevande skalbaggar. Studien kombinerade data insamlat under 20 år från ett välstuderat område i Östergötland inkluderande habitatvariabler och fångster av läderbagge från flera tidigare publikationer, opublicerade data, och nya data från 2015. Populationsutvecklingen för naturvårdsintressanta vedlevande insekter har aldrig tidigare undersökts över så lång tid som i denna studie. Resultatet visade att ihåliga träd kan utgöra habitat för läderbagge under lång tid, studien indikerar att 9,7 % av de undersökta träden hade förekomster av läderbagge ≥20 år. Den sammanlagda populationsutvecklingen för hela studieperioden var oförändrad, medan lokala populationer av läderbagge påvisade både negativa och positiva trender. Kolonisations- och utdöendetakten var ungefär lika stor (0,80 % respektive 0,64 % per år), vilket indikerar att i ett medellångt perspektiv kommer kolonisering kompensera för utdöende. Trädålder solexponering av ingångshål och slutenhet visade signifikanta positiva korrelationer till populations-utvecklingen, medan omkrets indikerade en signifikant negativ korrelation. Resultaten indikerade att bebodda träd som dör har en negativ inverkan på populationsutvecklingen av läderbagge. Den observerade årliga trädmortaliteten var 0,90 % vilket är jämförbart med tidigare studier. Nyckelord: Osmoderma eremita, läderbagge, metapopulation, kolonisering och utdöende, habitat, saproxyler, ihåliga träd, skogsek, Quercus robur
Biology of the European hermit beetle ................................................................................................. 8
Study aim .............................................................................................................................................. 9
Material and methods ......................................................................................................... 10
Study species ...................................................................................................................................... 10
Study area ........................................................................................................................................... 11
Data collection .................................................................................................................................... 12
Data analysis ...................................................................................................................................... 13
Population development ..................................................................................................................... 18
Population responses to habitat conditions......................................................................................... 22
Tree mortality ..................................................................................................................................... 24
Population development ..................................................................................................................... 25
Population responses to habitat conditions......................................................................................... 26
Tree mortality ..................................................................................................................................... 30
Introduction Habitat fragmentation is considered to be the foremost problem of conservation biology, as one of the most important reason for loss or decline in abundance of organisms. Isolation and discontinuity of natural habitats in a landscape perspective might limit population dispersal and in a long-term perspective lead to extinction. Many fragmented ecosystems, such as old trees, might although contain high abundances of threatened species.
Arboreal megalopolis Old trees embrace a high number of microhabitats and special structures such as cavities, dead bark and exposed wood that are important for many wood-living organisms and have therefore been described as an arboreal megalopolis (Speight, 1989). These wood-living saproxylic organisms are “dependent during some part of their lifecycle upon dead or dying wood of moribund or dead trees” (Speight, 1989). However, most saproxylic organisms are specialists and are only able to utilize their specific habitat during a limited part of decay succession. Species dependent upon recently dead trees remain in their habitat for only a short period after which it must colonize new habitat patches. Organisms that found their habitat in old-living trees can though last for much longer time before the need to colonize new habitat arises (Siitonen & Ranius, 2015). Since a tree is an organism itself, the habitats changes by time and new species colonize and follows in succession when previous are extinct. Hollows are one important feature of old trees, which develop successively and are most often a result of a damage or infection, which affect the growth or reduce the resistance or resilience within a tree. In most situations a mechanical wound is required to start the formation of a hollow (Morris & Perring, 1974; Speight, 1989). There are many factors that can cause damages or stress a tree; wind, lightning, increased shade, high ground water table, drought, frost cracks, fire, bark peeling are all potential vectors to hollow formation (Jansson & Antonsson, 1995; Winter & Möller, 2008). The probability to find a damage or hollow in a tree increases with increasing tree age and diameter (Gouix et al., 2015) and consequently so do the number of possible habitat patches. A study by Ranius et al. (2009b) revealed that 50% of trees within the age 200-300 years had present hollows, whereas all trees older than 400 years had hollows. A larger tree has existed for longer time, providing more opportunities for formation of microhabitats and also enables species a longer time to colonize. One important feature of microhabitats in hollow trees is the formation of wood mould. Wood mould is a nutrient-rich mixture of decayed wood, dead fungi, remnants and droppings from animals and insects (Sverdrup-Thygeson et al., 2010). The start of wood mould formation begins when rot, caused by several saprophyte fungi, enters a wound or damage in a tree. Rot works as a vector for other organisms, by creating entrances and making the wood’s nutrients more accessible. The latter is of great importance for all invertebrates, where nitrogen is the most growth limiting resource (Dajoz, 2000). Oak (Quercus robur L.) is considered to be a supercentenarian among trees with an extremely long life-span, in Sweden perhaps as long as 1000 years (Lindquist, 1939). The tree has very durable wood (CEN, 1994) which arises suitable properties to compose as habitats for many saproxylic organisms during long time, up to hundreds of years (Jansson & Antonsson, 1995). Oak is the most species-rich tree habitat for invertebrates (Palm, 1959; Morris & Perring, 1974; Jonsell et al., 1998), only in Sweden oak involves 26% of all red-listed forest insects (Jonsell et al., 1998). Oak is thereby the tree with highest biological diversity of all tree
8
species in Sweden (Hultengren, 1997; Widerberg et al., 2012; Antonsson & Karlsson, 2014), with more than 1500 species dependent upon the tree as habitat (Leonardsson, 2015). Due to this, oak is suggested to be a keystone species (Hultengren, 1997) since the trees holds such a high importance for the biological diversity. Oaks, as well as large old trees in general, were in a historical perspective much more abundant in southern Sweden (Lindbladh et al., 2000). Pollen distribution from oak in southern Scandinavia is today only some 20-35% of the levels throughout any time during the last 4000 years (Lindbladh & Foster, 2010). Oak is also renowned as a an iconic tree in human culture (Savill, 2013) and in Sweden the tree gained royal protection by decree of the National codex in 1347 (Arnborg & Hustich, 1953; Eliasson & Nilsson, 2002). The prohibition to harvest oaks was to some extent retained until 1830, after which oaks underwent a steep decline in abundance in southern Sweden, due to intense harvesting (Eliasson & Nilsson, 2002). Mostly due to anthropogenic reasons like lower fire frequency and timber harvest there has been a constant decline of oaks with diameter >1meter (Niklasson et al., 2002; Blomberg et al., 2003). Large old trees associated with the important wood pastures exhibit a sharp decline, both in Europe (Plieninger et al., 2015) and in a global context (Siitonen & Ranius, 2015) due to intensification of land use, agricultural intensification and harvesting of ecological valuable trees. In prehistoric times oak was found in a diversity of landscapes; everywhere from solitary trees of large herbivore-grazed park-like landscapes and as part of mixed groves, to closed forests, varying from completely closed canopy to very open (Vera, 2000). These kinds of landscapes offered a high diversity of habitats microclimates for many organism groups.
Biology of the European hermit beetle Some saproxylic species that today are rare, were in pre-historic time more common (Siitonen & Ranius, 2015). One species that today is at the IUCN red list for threatened species is the European hermit beetle (Osmoderma eremita), a saproxylic invertebrate which can be used as an indicator of a beetle-rich saproxylic fauna (Ranius, 2002b). O. eremita is exclusively found in hollows with wood mould, mostly of oak trees and is therefore considered to prefer this species (Palm, 1959; Jansson & Antonsson, 1995). However the habitat of the beetle it is more connected to specific structures, qualities and suitability of a tree, than specific species of host trees (Antonsson et al., 2003). The habitat of O. eremita is thoroughly investigated in several studies (e.g. Ranius & Nilsson, 1997; Ranius, 2000; Ranius et al., 2009b). The most important habitat qualities are probably those related to the amount of wood mould in a hollow and there is a positive correlation between population size and wood mould volume (Ranius et al., 2009c). A large hollow tree can contain hundreds of liters of mould (Jansson & Antonsson, 1995) and volume is positively correlated to trunk circumference and age (Ranius, 2002a; Hedin & Mellbrand, 2003). Concerning the importance of tree age, Ranius et al. (2009b) clamied that trees must be at least 300 years before hosting any populations of O. eremita and the largest populations are found in trees with the ages of 300-400 years (Ranius et al., 2009c). Access to light affects the phenotype of oaks (Andersson, 1975) which also affects structures and microhabitats of the tree, assembling a variation within gradients in sun and rain exposure (Sverdrup-Thygeson et al., 2010). Large solitary trees house a higher richness of saproxylic species (Ranius & Jansson, 2000; Ranius, 2002a) since more open canopy conditions generate lower and larger branches and a higher degree of forking (Attocchi, 2015), while denser
9
canopy generates narrow crowns and earlier natural pruning (Andersson, 1975). The amount of incoming light also influences the temperature in a tree hollow (Ranius & Nilsson, 1997) and consequently, hollows with openings towards the south have been proven to host a higher number of saproxylic species (Ranius & Nilsson, 1997; Widerberg et al., 2012). Fragmented habitats are however the most intimidating feature for O. eremita and decline in abundance of large habitable trees have led to an extinction debt of the beetle (Hedin, 2003b). The metapopulation concept has been applied to O. eremita populations with each tree regarded as a local habitat patch potentially inhabiting a population (Hedin, 2003a). Within each tree the population fluctuates rather independently of populations in nearby trees (Ranius & Hedin, 2001) and population variations are not uncommon among saproxylic beetles between years (Ranius, 2001b; Gouix et al., 2015). Inhabited trees undergo successional changes, formation and decay of hollows, which may be the source of population changes as well as colonization and extinction dynamics (Ranius, 2001a). O. eremita can colonize new habitat patches within possible dispersal distances, but approximately 85% of all adult beetles stay in the same tree as they were hatched (Ranius, 2001b) and most dispersal events took place to the nearest tree (Hedin et al., 2008). O. eremita has a quite low possible dispersal range, at maximum, distances up to 500 meter have been noted in Sweden (Svensson et al., 2011), which enables spreading within stands, but rarely between stands (Ranius, 2000). A dispersal study for saproxylic beetles made the conclusion that approximately 0.15 hollow oaks ha-1 were a minimum abundance of habitat patches for sustainable survival of invertebrates living in hollow oaks (Bergman et al., 2012). This emphasizes the importance of suitable habitat patches within possible dispersal distances for the long-term survival of O. eremita. Although much is known about O. eremita, most population studies are conducted for shorter periods of time, approximately 1-2 generations. More specific knowledge about both population and metapopulation perspective of O. eremita as well as individual hollow oak development perspective is needed. There is no unifying study of how the population of O. eremita develops in a medium-term perspective (10-20 years) and what responses specific qualities in their habitat rises for the population development in this time scale. A medium-term evaluation of an endangered key species like O. eremita may be of interest for both ecologists and nature conservation managers.
Study aim The purpose of this study was to assess the medium-term development of populations of O. eremita. The aim was to assess population trends, population colonization and extinction rates, population trends related to tree variables that previously have been shown to affect beetles associated with hollow trees, and furthermore tree mortality rate. The study combined data of habitat variables and captures of O. eremita from several previous publications (e.g. Ranius & Nilsson, 1997; Ranius et al., 2009b), unpublished data, together with new measurements in 2015.
10
Material and methods Study species In Scandinavia O. eremita is present in Sweden, Denmark (Ranius et al., 2005) and Norway (Flåten & Fjellberg, 2008). Sweden has the highest abundance of known sites with O. eremita in the world (Ranius et al., 2005). The species is categorized as Near Threatened on the international red list for threatened species (IUCN, 2015). In Sweden, O. eremita has been found in approximately 450 sites (separate locations with at least 500 meter from closest neighboring observation), out of which 430 are observations made after 1990 (Antonsson & Karlsson, 2014). The abundance of observations in Sweden can be concentrated to some core areas, where 70% of all O. eremita observation are made. These areas can be found in southeast Sweden, in Östergötland, Kalmar and Blekinge counties (Antonsson & Karlsson, 2014). O. eremita is mostly found in hollows of oaks, in which the beetle can exist its entire life (Palm, 1959; Andrei & Catalin, 2014), however the beetle is not specifically restricted to oaks, it has been found on several other tree species such as lime (Tilia cordata Mill.), European beech (Fagus sylvatica L.), ash (Fraxinus excelsior L.), black alder (Alnus gluttinosa L.), Salix (Salix spp.), horse chestnut (Aesculus hippocastanum L.), black poplar (Populus nigra L.) and also occasionally on fruit trees like apple (Malus domestica Borkh.) (Wiedemann, 1930; Ranius & Nilsson, 1997; Oleksa et al., 2007; Straka, 2011; Antonsson & Karlsson, 2014). The beetle has a lifecycle from egg to imago of at least three years, of which the larvae stage comprises the major part (Palm, 1959; Ranius, 2001b; Antonsson et al., 2003). The variation in abundance corresponds well to life cycle stages with smaller variations between parents and offspring (Ranius, 2001b). Adults of O. eremita only live for a month, they appear from July to September (Andrei & Catalin, 2014) and have a limited dispersal, in some studies less than 100 meter (Andrei & Catalin, 2014) but up to 1.5 km in the Mediterranean (Chiari et al., 2013). Dispersal is much controlled by male released sex pheromone that attracts females, and possibly males, to a suitable habitat patch or tree (Larsson et al., 2003). The larvae are among the biggest in Sweden and can be up to 90 mm long (Antonsson & Karlsson, 2014) and the imago can be up to 30 mm. Dajoz (2000) and Palm (1959) state that O. eremita feeds on partly decomposed wood, still with some remnants of cellulose and hemicellulose. The larva have a characteristic dropping that can be found in large quantities in hollows where the beetle is present (Jansson & Antonsson, 1995). Dissections of larvae from O. eremita have shown a fermentation chamber in their gut with nitrogen fixating bacteria that decompose cellulose and fix nitrogen (Wiedemann, 1930). The nitrogen enriched droppings and enlargement of cavities provides suitable conditions for other saproxylic beetles. O. eremita is therefore considered as an ecosystem engineer and since many demand for its presence is corresponding to other saproxylic invertebrates, the species are considered to be an indicator of a species-rich saproxylic fauna (Ranius, 2002b). One associated invertebrate is Elater ferrugineus, a beetle that lives in the same kind of hollow trees and predates on larvae of O. eremita (Antonsson & Karlsson, 2014).
Study area The study was performed in two known core areas of O. eremita in Bjärka-Säby and Brokind, Östergötland County (58 16´N, 15° 46´E), located in the southeastern part of Sweden. The two core areas included 8 sites (Figure 1 and Appendix 1) and approximately 200 hectares. The areas Bjärka-Säby and Brokind have among the highest concentrations of old oaks in the country (Antonsson, 1991; Jansson & Antonsson, 1995; Paltto et al., 2008) or even in Europe (Johannesson & Ek, 2006). The original selection of these areas was done since they contain a high abundance of O. eremita. This is advantageous since this reflects that it is the quality of the tree and habitat that are revealed in occurrence of a population, rather than lack of dispersal patches or habitat. This eliminates possible sources of errors like dispersal capability of the species or presence/absence of suitable trees habitats (Ranius & Nilsson, 1997). The study area was for this study also selected since many previous studies had been done within the area, both investigating the metapopulation of O. eremita and also chemical pheromone patterns. This has led to availability of a long time observation series of O. eremita.
12
Data collection The study area and data of this study is partly investigated and published previously in several studies (Ranius & Nilsson, 1997; Ranius, 2000; Ranius & Jansson, 2000; Ranius, 2001b; Ranius & Hedin, 2001; Mellbrand, 2002; Ranius, 2002b; Svensson et al., 2004; Svensson & Larsson, 2008; Larsson & Svensson, 2009; Ranius et al., 2009a; Ranius et al., 2009b; Ranius et al., 2009c; Larsson & Svensson, 2011; Svensson et al., 2011). The first data sampling was made in 1995. Existing hollows were examined within 8 defined sites of in total approximately 200 hectares in Bjärka-Säby and Brokind, Östergötland County. Each site received an individual site number (1-9, site 6 excluded). From all existing trees within the examined sites, hollow trees with cavities possible for retaining a pit fall trap (Figure 2) were selected. Selected trees within the sites received an individual tree ID, including the site number and an individual tree number. Coordinates for all trees were taken. Inaccessible and excluded trees were those with hollows higher than 4.5 meter above ground, too narrow hollows to access with necessary equipment, or too little accessible wood mould to place a pitfall trap. In each hollow a pit fall trap (a jar of approx. 7 cm in top-diameter) was placed and emptied once every 1-2 days and the number of trapped individuals of O. eremita were numbered, marked and released. The pit fall traps were maintained in the trees from approximately mid-July to late August or the beginning of September. Sampling was done with traps following years: 1995-2002, 2005, 2006, 2008, and 2015.
Table 1. Measured habitat variables including a general definition, year of measurement and unit. Data concerning wood mould volume and age have previously been published in Ranius et al. (2009a); (2009c).
Variable Definition Year of measurement Unit/Classification
Position Latitude/longitude 2015 RT 90 Circumference Stem circumference at breast
height (1.3 m) 2015 cm
Entrance hole height above ground
Distance from the ground to the lower part of the entrance hollow
2015 m
Entrance hole size Area of the entrance hole 2015 dm2 Wood mould volume Approximated wood mould
volume in tree hollow 2006 dm3
Living/dead Presence/absence of living crown 2015 yes/no Standing/laying trunk Whether the tree has fallen or not 2015 yes/no Age Approximated age of hollow tree. 2006 Year Canopy closure Percentage of the 2 m outer
distance from the tree crown shaded by other crowns
2015 %
Sun exposure Percentage of entrance hole
exposed by sunlight 2015 %
Hollow stage Stadium of development of hollow 2015 1-7
13
In addition to mark-release-recapture data of O. eremita, habitat variables were measured and are displayed in Table 1. The circumference was measured in centimeter perpendicular to the trunk at breast height (1.3 meter above ground). Depending on how the circumference was measured in field during the different measuring occasions, the perceived circumference may not only increase with presiding time, as would be the natural development. This may be because of differences in measuring height or, if the tree has died during the study period, bark may have fallen of the trunk, causing a smaller circumference than the living tree. In case of a decrease of the circumference, the larger of the two measures was chosen for analysis. The height of the entrance hole was measured as the distance from the ground to the lower part of the entrance hollow. The area of the entrance hole was measured as well as the volume of wood mould in the hollow. The wood mould volume was estimated by calculation of the volume a cone and for this the approximate diameter of the hollow and depth of the cavity from the surface of the mould was estimated. Further if the tree was living or dead and whether the trunk was standing or fallen was noted. The age of the trees was estimated by methods by Ranius et al. (2009a) based upon a core of the trunk, growth pattern and diameter growth with a mean derivation error on 15%. Canopy closure was measured as percentage of the 2 m outer distance from the tree crown shaded by other crowns and sun exposure was estimated as amount of sunlight reaching the entrance hole.
Hollow stage is a variable developed by Jansson (1998) which categorizes the stadium of development of a tree hollow. The variable is adopted to work as method for inventory for trees with high nature conservation values and the seven categories goes from; young tree without hollow (1), mid-aged tree without hollows (2), old tree without hollows (3), old tree with small cavity (opening approx. 5 cm in diam.) and amount of wood mould (4), old tree with medium sized cavity (opening approx. 15 cm in diam.) and lot of wood mould (5), old tree with large sized hollow (opening approx. 30 cm in diam.) and lot of wood mould (6) and old tree with large and often totally exposed hollow with little amount of wood mould (7).
Figure 2. Illustration of a pit fall trap inside a hollow tree
As additional to the study, inventory data from the County administrative board of Östergötland (Claesson & Ek, 2009) were incorporated, from which circumference, hollow stage and spatial distribution of oaks within the limited study area were selected.
Data analysis Statistical and descriptive analyses were done in MiniTab 16 and 17 (MiniTab Inc.). The data consists of total 3663 samplings, scattered on 12 data sampling occasions, distributed over a setting of 20 years. In total 86 trees have in some way been examined during the whole study period. The oldest samplings were made in 1995 (year 0) and the latest in 2015 (year 20). Some of the collected data includes uncertainties and a selection procedure was needed for further analysis. Trees included in population analysis in this study had been subject for sampling for at least five or more sampling years by pit fall traps. For trees with only recaptures of beetles from pitfall traps in other trees (dispersal events), the first capture in a new tree has in this study been counted as a first capture and not as a recapture event.
14
The first basic assessment of the collected data was to make a comparison with a regional inventory of oaks with high nature conservation values, made by County administrative board (Claesson & Ek, 2009). The aim of this comparison was to contrast the spatial, trunk circumference and hollow stage distribution for oaks within the sites. This was done to compare the successional stages of oaks included in this study with those of other oaks in the same areas, in order to assess how representative this selection was compared to all oaks in the area. Results from pit fall trapping for each examined hollow tree resulted in a number of captures of O. eremita, consisting of new captures (r), recaptures (a) and summarized captures (S) for each sampled year. In earlier studies, populations were estimated by close-population model method by Craig (1953). However, population estimations based upon proportion of recaptures require a certain number of captures and recaptures for an accurate estimation. Using population estimations as the variable to compare changes in individual trees between years would mean that trees automatically would be excluded if their population sizes were too low, which would lead to a very skewed sample. However, whereas it is not possible to directly relate and compare captures between trees, since the local conditions may vary which affect the proportion of individual caught, it is nevertheless possible to compare captures within the same trees between years, as long as the conditions remained the same, which appears to be the case for the great majority of the trees in this study. Due to this, new captures (r) from individual trees was chosen as the most suitable variable to compare population changes between years. For further population analysis one requirement was to be able to actually distinguish any relevant population changes from random fluctuations. Therefore all individual tree populations with total captures summarized to <5 individuals over all sampling years were excluded from population analysis. From these multi-year observation events included in the population analysis (≥5 sampling years and ≥5 captured individuals in total), general linear regression were assembled for; 1) Metapopulation (all captures together), 2) Local populations (each individual tree and its captures). From the linear regression for individual tree populations over time, with the general form; y = kx + m, the coefficient of correlation (k) was chosen as the signifying value of population change, consequently this variable answers for the change in population over time. The k-values for all individual tree populations were plotted to assess their overall distribution, and the means of all k-values computed, resulting in an overall measure of the population development coefficient (k (N)). An alternative transformation or normalization was also done of captures (r) before any correlation of coefficient were completed. The capture values for individual years in each tree were normalized in relation to the average annual captures for all years for each tree. After the transformation, a general linear regression (Pearson correlation) was created for all individual tree populations, resulting in normalized population development correlation (k (NNorm)). Of these two values used for the analysis, k (N) reflects total change regardless of population size, whereas k (NNorm) reflects proportional changes to populations. From all captures population dynamic events like habitat colonization and extinction were recognized. Trees indicating habitat colonization were recognized as a tree with captures of 0 individuals for at least 1 sampling year, followed by at least 5 captured individuals one or more of the remaining sampling years. The concept was conversely implemented for trees
15
indicating extinction of populations and were defined as at least 5 captured individuals for one sampling year followed by capture of 0 individuals for at least the last year of sampling. The two different population development correlation transformations, (k (NNorm)) and (k (N)), were assembled and correlated by a general linear regression to each separate habitat variable. The two transformations of population development were also assembled for a multiple regression with all habitat variables. The habitat variable living/dead was discrete and thus not included in general linear regression; instead it was analyzed separately by a two-sample t-test. The t-test was performed between the sample group living/dead and four variables; population development coefficient (k (N)), normalized population development coefficient (k (NNorm)), Age and Circumference. The last part of the data analysis included tree mortality. The overall mortality rate was calculated as an annual ratio of the number of deceased trees during the study period (1995-2015). For mortality analysis year of death and estimated age were variables of importance.
16
Results Descriptive analysis 66 trees, or 76.7%, of the examined trees were possible to include in the study (≥ 5 sampling years) and 31 trees, or 36.0%, were possible to include in the more thorough population analysis (≥ 5 sampling years and ≥ 5 captured individuals in total) (Table 2). In total 257 annual tree samplings counting for 1786 individual captures of O. eremita were included in the population analysis. The density (Table 3) of surveyed hollow oaks varied among sites between 0.09-1.22 oaks ha-1, with corresponding total numbers for hollow trees inventoried by Claesson and Ek (2009), between 0.26-6.35 oaks ha-1.
Table 2. Investigated hollow trees (1995-2015) with information of number of trees (N) for each category, a ratio (%) to the total number of all examined trees, number of annual samplings (n), number of captured individuals of O. eremita (r) and number of captures (S).
Category N % n r S All investigated trees 86 100.0 564 1899 3663 Living (2015) 72 83.7 458 1150 2192 Dead (2015) 14 16.3 106 749 1471 Died during study period 12 14.0 101 745 1463
Included in study 1.) 66 76.7 510 1819 3550 Included in study; living 54 62.8 409 1074 2087
Included in population analysis 2.) 31 36.0 257 1786 3495 Included in population analysis; living 26 30.2 210 1049 2048 1. ≥ 5 sampling years 2. ≥ 5 sampling years and ≥ 5 captured individuals in total
Table 3. Summary of sites included in the study with approximately covered area, number of hollow oaks surveyed for O. eremita, stem density and comparison with inventory by County administrative board (Claesson & Ek, 2009) within parenthesis.
Site Site name Area (ha) Hollow trees included in study, CAB1.) inventory in parenthesis.
Hollow trees per hectare, CAB inventory in parenthesis.
1 Hjorthagen 7.4 9 (47)
1,22 (6,35) 2 Bjärka-Säby 44.1 4 (12)
0,09 (0,27)
3 Kalvhagen 14 13 (37)
0,93 (2,64) 4 Bjärka äng 25 11 (66)
0,44 (2,64)
5 Bos holme 17.6 4 (5)
0,23 (0,28) 7 Storängen 22.4 11 (17)
0,49 (0,76)
8 Sätra-Humpen 38.1 6 (10)
0,16 (0,26) 9 Brokind 41.5 8 (77)
0,19 (1,86)
∑ 202.7 66 (271) 0,32 (1,34) 1. Inventory of oaks with high nature conservation values; County administrative board of Östergötland (Claesson & Ek, 2009).
17
All oaks in the study areas from the inventory of trees with high nature conservation values (i.e. hollow trees and trees with a diameter > 1 m) made by Claesson and Ek (2009) were used as a comparison where two specific parameters were highlighted; circumference distribution and hollow stage distribution. The circumference distribution (Figure 3) among hollow trees included in the present study was similar to the distribution among hollow trees inventoried by Claesson and Ek (2009), but with a slight skew towards larger trees among the study sample. In both data sets there was a peak of circumference between 350 and 400 cm. Hollow stage distribution (Figure 4) had a strong shift towards the higher stages among hollow trees included in study, compared to the inventory by Claesson and Ek (2009), as it is difficult or impossible to fit pitfall traps in hollows of stages less than 5.
Figure 3. Distribution of trunk circumference of hollow oaks within the study area. Inventory of oaks with high nature conservation values by County administrative board (grey) (Claesson & Ek, 2009) and present study (black).
Figure 4. Distribution of hollow development stage of hollow oaks within the study area. Inventory of oaks with high nature conservation values by County administrative board (grey) (Claesson & Ek, 2009) and present study (black).
0
5
10
15
20
25
30
35
200 250 300 350 400 450 500 550 600 650 700
Perc
enta
ge (%
)
Circumference class (cm)
Oaks surveyed by Countyadministrative boardHollow oaks in study
0
10
20
30
40
50
60
3 4 5 6 7
Perc
enta
ge (%
)
Hollow stage
Oaks surveyed by Countyadministrative boardHollow oaks in study
18
Population development A linear regression was performed for annual captures in all trees in relation to time (Figure 5). Only a small proportion of the sampled habitats had captures during the whole studied period. 9.7% of trees included in the population analysis had a detectable population for the whole 20-year period and 35.5% had a detectable population for ≥ 15 years. The overall population size remained constant. Even though there was a slightly negative trend, it was not significant (coefficient of correlation = -0.1979 and p = 0.165).
Figure 5. Annual captures of O. eremita between 1995 and 2015 for hollow trees included in population analysis (≥ 5 sampling years and ≥ 5 captured individuals in total). The coefficient of determination of the linear regression (R2) = 0.008 and probability (p) = 0.165. 9.7% of the trees in the population analysis had a population for ≥ 20 sampling years and 35.5% had a population for ≥ 15 years.
A linear regression was also performed for the population development in each individual tree. The distribution of k-values (Figure 6) were more closely examined for the two transformations of population development k (N)) and k (NNorm). The coefficients were distributed at both positive and negative values, indicating that local habitat patches face both increasing and decreasing population trends. Population developments (Figure 6) with negative trends have a larger spreading among values (-3.0-0.0) than the population developments with positive trends (0.0-1.5). This distribution is more uniform for normalized population development (Figure 6), ranging from -0.3-0.0 for negative trends and 0.0-0.4 for positive trends.
Figure 6. Distribution of correlation of coefficients for population development correlations (k (N)) and normalized population development correlations (k (NNorm)) for O. eremita populations in trees included in population analysis (≥ 5 sampling years and ≥ 5 captured individuals in total).
The results revealed 13 populations (Table 4) with a significant change in population size from either population development coefficient or normalized population development coefficient, 6 of which indicated a negative trend and 7 a positive trend. Figure 7 are graphical representations of these population developments.
Table 4. Individual trees with a significant change (p<0.05) in population size of O. eremita by either population development correlation (k (N)) or normalized population development correlation (k (NNorm)).
Figure 7. Annual observed individuals of O. eremita for six hollow trees, revealing significant negative or positive population development. Cross and dashed line indicates year of death for the tree.
21
The results further revealed that five trees indicated habitat colonization of O. eremita and four trees indicated extinction of populations (Table 5). Whether a habitat colonization or extinction occurred were based upon one sampling of 0 individuals for one year followed by minimum one observation ≥5 individuals for a following year, opposite for extinction. The annual habitat colonization rate was 0.80% and the annual population extinction rate was 0.64%.
Table 5. Trees indicating habitat colonization and extinction of O. eremita populations (based upon zero-observation followed by minimum one observation ≥5 individuals, or inversed). The annual habitat colonization rate of hollow trees included in population analysis (≥ 5 sampling years and ≥ 5 captured individuals in total) where 0.80% and the annual extinction rate where 0.64%.
Population responses to habitat conditions Population development coefficient (short: k (N)) and normalized population development coefficient (short: k (NNorm)) were investigated in relation to 7 habitat variables by regression analysis (Pearson correlation). The regression analysis firstly examined the relationship with each individual variable (Table 6) and secondly a multiple analysis with all 7 variables (Table 7). In the regression with individual habitat variables, there were no statistically significant relationships (Table 6). In the multiple regression (Table 7) the effect of four variables were statistically significant. For circumference, a significant negative trend (p = 0.005) was revealed towards k (N) a in the multiple regression (Table 7). Canopy closure revealed a significant positive correlation (p = 0.042) in the multiple regression (Table 7). Sun exposure did similarly reveal a significant positive correlation (p = 0.008) in the multiple regression (Table 7). The last labeled variable age revealed showed a strong (p = 0.004) correlation in the multiple regression (Table 7). A complete correlation matrix for all habitat variables can be found in Appendix 4.
Table 6. Regression analysis (Pearson correlation) for tree characteristics affecting the population dynamics of O. eremita, based upon population development correlation (k (N)) and normalized population development coefficient (k (NNorm)).
Table 7. Multiple regression analysis for tree characteristics affecting the population dynamics of O. eremita, based upon population development correlation (k (N)) and normalized population development coefficient (k (NNorm)). The combined multiple regression received the coefficients -3.29 (p = 0.0263 and R2
=0.811) for population development coefficient (k (N)) and -0.037 (p = 0.882 and R2 = 0.523) for normalized population development coefficient (k (NNorm)).
Variable Coefficient p Circumference
k (N)
-0.012 0.005*
k (NNorm)
-0.001 0.060 Entrance hole height above ground
k (N)
0.267 0.337
k (NNorm)
0.012 0.819 Entrance hole size (dm2)
k (N)
0.028 0.297
k (NNorm)
0.009 0.099
Mould volume
k (N)
-0.004 0.264
k (NNorm)
0.000 0.439
Canopy Closure
k (N)
0.214 0.042*
k (NNorm)
0.000 0.996
Sun exposure
k (N)
0.032 0.008*
k (NNorm)
0.003 0.155
Age
k (N)
0.014 0.004*
k (NNorm) 0.001 0.123 Asterisk (*) indicates a significant p-value. The two-sample t-test (Table 8) for the sample groups dead and living indicated significant differences between living and dead trees for population development coefficient (k (N)). This results indicates that death trees apprehended lower (or negative) population development in comparison with living trees.
Table 8. Two-sample t-test between sample group Living and Dead for four variables; population development coefficient (k (N)) and normalized population development coefficient (k (NNorm)), Age and Circumference. N indicating number of trees included in each category.
k (N) k (NNorm) Age Circumference
(cm) Living Dead Living Dead Living Dead Living Dead
N 26 5
26 5
23 3
26 5 Mean 0.113 -1.224
0.056 -0.061
347 316
389.1 443.6
StDev 0.83 -1.22
0.177 0.109
84.8 31.2
121 128 p 0.007* 0.168 0.551 0.368 Asterisk (*) indicates a significant p-value.
24
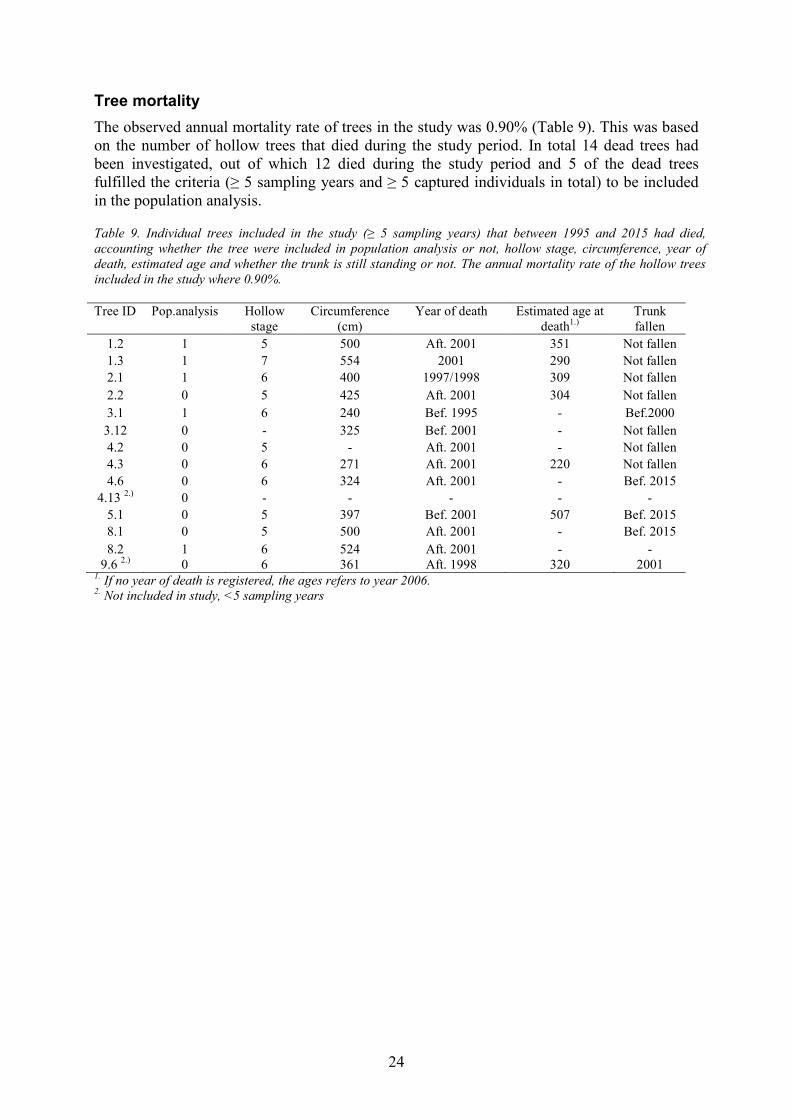
Tree mortality The observed annual mortality rate of trees in the study was 0.90% (Table 9). This was based on the number of hollow trees that died during the study period. In total 14 dead trees had been investigated, out of which 12 died during the study period and 5 of the dead trees fulfilled the criteria (≥ 5 sampling years and ≥ 5 captured individuals in total) to be included in the population analysis.
Table 9. Individual trees included in the study (≥ 5 sampling years) that between 1995 and 2015 had died, accounting whether the tree were included in population analysis or not, hollow stage, circumference, year of death, estimated age and whether the trunk is still standing or not. The annual mortality rate of the hollow trees included in the study where 0.90%.
9.6 2.) 0 6 361 Aft. 1998 320 2001 1. If no year of death is registered, the ages refers to year 2006. 2. Not included in study, <5 sampling years
25
Discussion This study is unique in the context that such a long time series of population development has not been recorded previously for any saproxylic invertebrate. The overall results reveal that the total population size remained unchanged, whereas in individual trees populations exhibited significant changes as well as both population colonization and extinction. These results contribute with new knowledge about the metapopulation dynamics of O. eremita.
Descriptive analysis The sampled hollow trees within the 8 sites offered a range of different habitat densities (Table 3); between 10-80% of the available oaks from development stages 3-7 within the sites were sampled. The sampled trees were at the beginning of the study the only possible sources for sampling (the only ones with suitable hollows) and additional habitat patches may exist or have been formed within the sites during the study period but could not be included in the study. The minimum number of habitat patches, 0.15 trees ha-1 (Bergman et al., 2012), that are required to ensure richness of saproxylic species living in tree hollows, were for all sites, except site 2, over the minimum abundance. Even if the abundance of the sampled hollow trees was lower than the minimum for some sites according to Bergman et al. (2012), additional trees inventoried by Claesson and Ek (2009) within the sites were all of sufficient abundance. The circumference distribution of the sampled hollow trees (Figure 3) was reasonably similar to the surrounding oaks, although sampled trees had a greater proportion of trees in the higher circumference classes. The results further indicated that the hollow stage distribution (Figure 4) among sampled trees had a pronounced shift towards the higher hollow stages. The reason behind the total absence of oaks of hollow stage 3 among the sampled trees was that only oaks of hollow stage 4 and higher contains cavities; thus trees belonging to stage 3 have thus not been sampled for the presence of O. eremita, but correspond to the future source of habitat formation. There is a high proportion of possible near-future habitat patches at the sites, which suggests that the population development might be sustainable in a medium-term perspective, given that suitable habitat develops. Altogether the descriptive analysis indicates that the results obtained in this study are applicable to both local population of oaks and to trees of the same qualities and distribution.
Population development The overall population development (Figure 5) was assessed for all captures of O. eremita during the whole study period. The results indicated that 9.7% of the trees were inhabited for ≥ 20 years and 35.5% for ≥ 15 years. Such long observation series of O. eremita have not been previously recorded. It is likely that the environment in the cavities is so stable that it denotes a lower mortality risk for a beetle to stay and lay eggs in the same tree where the beetle itself was hatched, than trying to colonize other suitable hollows. A successful colonization includes both dispersal and establishment, which assigns that O. eremita must manage both to find habitat within the possible dispersal distances and to reproduce successfully. Only when a tree dies, falls or when the source of nutritious substrate decreases, is it a more favorable strategy to migrate for a new hollow tree (Ranius & Hedin, 2001). Furthermore, the results revealed that the overall population size across all sampled trees remained unchanged (Figure 5). The results do reveal some very high captures (exceeding 40 individuals per year) in the early phase of the study period; levels that do not occur in later stages. This effect is largely due to a few trees that exhibited very high catches in the first
26
years of sampling, followed by a decrease that seems in some cases to be associated with deteriorating habitat conditions (see below). Even though the overall metapopulation size did not significantly change during the study period, both positive and negative population development trends were found in individual trees (Figure 6). The results revealed that a third of the analyzed hollow trees exhibited significant changes in population size (Table 4), which were distributed approximately equally between positive and negative development trends. Figure 7 includes examples of such negative and positive population developments. The consistent number of significant positive and negative population trends supports the received result concerning distribution of correlations of coefficients (Figure 6) which indicated that positive population developments will compensate for negative population developments, in relation to both improved and degraded habitat conditions. A noted relationship was that negative population developments seemed to advance more rapidly than developments with positive trends when measured as absolute changes (k(N)), but not when measured as relative changes (k (NNorm)) (Figure 6). In several trees it was possible to study colonization and extinctions (Table 5). The annual population extinction rate was 0.64% and the annual habitat colonization rate was 0.80%. The consistent rates indicated that extinction of inhabitable habitat patches were compensated by colonization of empty ones. These results support the outcomes by Ranius (2001a) that local populations within a larger metapopulation constantly undergo both negative and positive development. In a longer time frame (such as in this study) these changes also include colonization and extinction events. At the same time, many of the habitats in this study indicate a stable population development with no change in population size. The slightly higher colonization rate for O. eremita would probably only have a marginal effect in a long-term perspective, considering the ecological circumstances of low dispersal distances (Svensson et al., 2011), habitat fragmentation (Hedin, 2003b) and low abundances of old oaks in the landscape (Eliasson & Nilsson, 2002).
Population responses to habitat conditions Development of hollows in oaks follows a relatively consistent progression of expansion and senescence, although with considerable variation (Jansson & Antonsson, 1995). Previous studies have indicated that populations of O. eremita and other saproxylic invertebrates living in hollow trees likely follow this trajectory to some extent, with population sizes and species richness positively correlated with age-related traits like trunk diameter and amount of wood mould in hollows (Ranius & Jansson, 2000; Oleksa et al., 2007; Ranius et al., 2009c). However, since population size and population development are two separate features at any given time, the results are only indirectly comparable to each other. In the present study relationships between population development of O. eremita and traits related to the age of the tree and development of hollows indicated partly conflicting results. In correlations of individual factors, no single tree variable exhibited a significant correlation with population development. In multiple regressions, relative (normalized) population changes were not related to any tree variable; however absolute population changes of O. eremita did exhibit correlations with some variables: Population development exhibited a strong positive correlation with age (Table 7). It is reasonable to state that habitat formation and associated qualities of hollows require time to develop, which would explain the positive trend between age and population size. The proportion of damages and probability of existing hollows increases with higher age (Morris & Perring, 1974). By the age of 300 years the probability of finding a hollow is high and the
27
largest populations of O. eremita are found in trees between 300 to 400 years (Ranius et al., 2009c). The positive correlation between age and population development found in this study would also suggest that sampled trees are still in a phase of overall upwards progression in the development of resources within hollows. Population development also exhibited a significant negative correlation with trunk circumference (Table 7), however, which should be part of the same age-related process of formation of hollows. Among the sampled trees, age and trunk circumference were strongly positively correlated (Appendix 4). It is likely that the individual tree’s history plays an important role for how long a tree can host a population of O. eremita, such as when hollow formation is initiated, or what qualities the cavity has. Trunks with small circumferences in general have lower amounts of wood mould (Ranius & Nilsson, 1997), though no such correlation was found in this study (Appendix 4). Neither did the results exhibit significant relationship between population development and wood mould volume (Table 7). A cavity inside a very thick trunk has possibly expanded over time to an extent that the hollow is no longer habitable or favorable for population persistence. The highest amounts of mould volume will thereby not always be found in in the trees with the highest circumferences. Oleksa et al. (2007) claimed that trees with a circumference of 450 cm were preferred as habitat for O. eremita. No such specific association were investigated in this study, although, this supports theories that expansion of hollows, which is associated with both age and circumference (Ranius et al., 2009c), reaches a climax after which the ability to inhabit a cavity decreases with too large circumferences. Habitat conditions that can be expected to remain relatively constant over time, and thus less correlated to overall progression in development of hollows, are the vertical location and size of the hollow’s entrance hole on the trunk, which both revealed no significance in relation to population development (Table 6 and Table 7). The indirectly correlated population size of O. eremita is in previous studies proven to increase with increasing height above ground of the inhabited hollow (Hedin & Mellbrand, 2003; Ranius et al., 2009c), most likely due to lower predation and fluctuating microclimate. A too wide entrance hole increases the temperature inside the hollow, but is likely to expose much of the cavity and reduces the humidity, affecting the microclimate negatively (Ranius et al., 2009c). Although the size or height of the entrance hole is likely to play a much less important role for medium-term population development of O. eremita compared with the stage of hollow development. The surrounding environment of hollow oaks has been shown to affect habitat suitability for several saproxylic species (Ranius & Jansson, 2000). In this study canopy closure exhibited a significant positive trend in relation to population development in the multiple regression (Table 7), indicating that a more closed canopy has a positive effect on population development. Strongly correlated to canopy closure is sun exposure of the entrance hole which, similar to canopy closure, revealed a strong significant positive correlation in the multiple regression (Table 7), indicating that a more sun exposed entrance hole was positive for population development. These results are contradictive since the two variables revealed a negative correlation in the correlation matrix (Appendix 4), that a denser canopy decreases the amount of light that reaches the trunk and entrance hole. Higher amount of light affects the temperature and microclimate in the cavity which is positively correlated to population size of many saproxylic and hollow living species (Jonsell et al., 1998; Ranius & Jansson, 2000). Obtained results concerning canopy closure is contradictive to theories by Ranius and Nilsson (1997); Vera (2000); Hedin and Mellbrand (2003) of a semi-open landscape as the natural and most favorable conditions for oak and its associated species. Historically oak and suitable
28
hollow trees were probably present in a landscape consisting of a mixture between grazed semi-open environments and patches of closed forest and groves (Vera, 2000). During the last decades the light conditions within the sites have also remarkably changed; from a denser surrounding vegetation efforts has been taken by repetitive cleanings and reintroduced grazing in order to preserve the biodiversity rich environments (personal communication; Larsson & Ranius, 2015). It is possible that the present positive population development in relation to sun-exposure of the opening of the hollow is a response to recent changes in the surrounding vegetation. Dead trees revealed a strong negative correlation towards population development (Table 8) implying that a suitable hollow tree will become less suitable after death. When a hollow tree approaches the moment of death, often not a definitive moment, rather a process of degradation, the resistance and resilience will be remarkably reduced due to relocations of resources in an effort to survive. At the moment of death, absence and decay of the crown is likely to increase the access of light to the trunk and the entrance hole and thereby enhances the microclimatic conditions (Ranius & Nilsson, 1997). Even though a hollow tree remains standing after the moment of death, a completely dead tree appears to be more or less unsuitable for O. eremita. Actual number of captures (Appendix 2) revealed that dead trees held significantly lower amounts of individuals than living trees. In 2015 dead trees exhibited catches of 0.33 beetles on average and living trees 2.45 on average. A completely dead tree is not totally uninhabitable for O. eremita but death clearly has an effect on the suitability of the hollow as only fractions of previous population sizes remains after death of the hollow tree. This relationship is supported by responses seen in Figure 7, where the moment of death either alters a peak in population size, or occurs right after a peak of the population. Theoretically, the peak of population would possibly occur with a short delay right after or before the moment of death but not too long, approximately within a 5 year span. The beetle is most likely dependent upon resources that can only be found in a living, dying, or recently dead tree. The increased accessibility of nutritious substrates (due to reduced resistance of the tree) in combination with enhanced microclimatic conditions creates a limited time span where a hollow tree is probably most suitable as habitat for O. eremita. When the source of nutritious substrates decreases, due to death of the inhabited tree, the beetles successively migrate from the tree. Classic metapopulation theory assumes that stochastic events affecting local populations leads to extinctions, leaving unoccupied habitat patches, which are then available for recolonization by nearby local populations (Thomas, 1994; Moilanen et al., 1998). The Glanville fritillary (Melitaea cinxia) is an endangered butterfly species that follows this kind of pattern in a network of habitat patches where larger populations (larger meadows) support local populations (smaller meadows) through recolonization when extinction occurs (Hanski et al., 1995). These concepts are true if the network of patches will remain the same, however, if habitat patches are remarkably negatively changed or destroyed, local populations will go extinct regardless of population size, as a deterministic consequence of changed habitat conditions (Thomas, 1994). Results in this study indicate that the theories of environmental tracking (e.g. Thomas, 1994) are probably more applicable to O. eremita than classical metapopulation theory. Environmental tracking designates that species track suitable conditions, a colonization is a consequence of improvement of habitat conditions, while extinction is a deterministic response to unsuitable habitat conditions (Thomas, 1994). The rapid negative trends for population development (Figure 6) that this study exhibited might be explained by the observation that once the qualities of the habitat patch evolves negatively
29
(e.g. rapidly decreasing wood mould volume, progression of hollow stage or death of the tree) the suitability of a hollow decreases rapidly.
30
Tree mortality Even though death of individual trees a significant negative relationship to population development, the consequences for metapopulation survival can be considered as low, as long as new habitat patches develop by at least the same rate as that the previous ones become uninhabitable. In present landscapes, where natural oak habitats are heavily affected by fragmentation (Niklasson et al., 2002), it is important to consider the mortality rate of available hollow trees. The observed annual tree mortality rate (Table 9) of hollow trees were 0.90%, which is comparable with average mortality rates that Drobyshev et al. (2008) displays of 1.1% for trees >200 years. Trees that exhibited population extinctions were by a majority (75%) caused by death of the tree, which further supports the received results (population development coefficient (k (N)). This results indicates that death trees apprehended lower (or negative) population development in comparison with living trees. Table 8 shows that death is a turning point for habitability of cavities. The cause of death of the studied trees were in most cases not known or slow degradation. Drobyshev et al. (2008) suggest that windthrow was the most important source of disturbance that leads to death of oaks, which can constitute to 50-70% of the mortality. In this study only a smaller part of the dead trees (33%) have fallen and these event revealed no clear connection to the moment of death due to apparent separation in time. The reason why windthrow does not compose a more fundamental part of the mortality in this study is worth discussing since the cause of death have importance for the properties of the wood and further suitability as habitat (Stokland, 2012). Hollow formation and decay can remarkably lower the mechanical strength of a tree (Andersson, 1975), mostly depending on the phenotype and growth conditions. A tree with a large crown is more vulnerable to windthrow than trees with narrow crowns (Savill, 2013) and in the given conditions with mostly old oaks with wide crowns in pasture land, windthrow as cause of death should theoretically be more common. Mechanical damages and stochastic events occurred constantly, but did not seem to be the final cause of death, nonetheless damages often drastically changed the conditions of the cavity; e.g. leading to rapidly reduced mould volume by a spoiled cavity. A sudden death caused by windthrow or fire often portends that the tree was growing until the moment of death, leaving rich supplies of energy in the wood, while senescent oaks gradually decays due to starvation or lack of light (Stokland, 2012). One aspect that might affect the mortality rate is the fact that oak is moderately shade tolerant (Annighofer et al., 2015). A lower disturbance frequency in oak rich environments have given a shift towards a composition of more late succession species and thereby a denser canopy (Niklasson et al., 2002). Although there was uncertainty regarding causes of death, mortality rate revealed in this study were similar to previous studies.
31
Conclusions The population development of O. eremita has not previously been investigated for medium-long time intervals, spanning several generations. In fact, the long sampling period, well distributed and large number of samplings indicates that such results have never been recorded before for any saproxylic invertebrate. One basic assessment of this study was the medium-term population development of O. eremita. Local populations of O. eremita have developed both negatively and positively and the results indicate that negative trends seem to advance more rapidly than positive trends. Reasons behind this might be stochastic events that remarkably affect the habitability of a hollow tree. Habitat colonization and population extinction rate of O. eremita revealed corresponding rates (0.80% respectively 0.64 %), indicating that colonization was compensating for extinction in a medium-term perspective. Successive habitat changes caused colonization and extinction of local populations of O. eremita, although the metapopulation remained unchanged. The study revealed that cavities can be usable as habitat for long time; the study indicates >20 years. The suitability of a hollow as habitat for O. eremita most likely follows the progression of hollow development of expansion and senescence. Among examined habitat variables tree age revealed a strong positive correlations to population development indicating that hollows require time to develop. Over time, expansion of hollows might however reach a climax after which the ability to inhabit a cavity decreases with too large circumferences, which is supported by the results that exhibited a significant negative correlation between trunk circumference and population development. Although the regressions indicated some partly conflicting results, especially concerning canopy closure and sun exposure of the entrance hole. The suitability as habitat is remarkably negatively reduced by death of a hollow tree. Even though a tree remains standing, a completely dead tree has a strong negative correlation to population development. This together with the results that colonization seems to compensate for extinction indicates that O. eremita reveals clear similarities to environmental tracking patterns where colonization of habitat patches is a consequence of improvement of habitat conditions, while extinction is a response to unsuitable habitat conditions. As long as new habitat patches develop at the same rate as that by which the previous ones become uninhabitable this would not be a concern in a nature conservation perspective. The study revealed that the observed annual mortality rate was moderate (0.90%) and comparable to previous studies.
32
33
Figure 10. A denser canopy affects the shade-vulnerable oaks with an increased natural pruning which decreases the crown height and life-span of the tree. Tree ID: 9.9. (Photo: Olle Tranberg, 2015).
Figure 11. A deceased but still standing hollow tree. Tree ID: 2.1. (Photo: Olle Tranberg, 2015).
Figure 8. The breakage of a fork branch has split the trunk, exposing the hollow and drastically changing the microclimatic conditions in the hollow. Tree ID: 3.7. (Photo: Olle Tranberg, 2015).
Figure 9. Solitary oak in Bjärka-Säby. (Photo: Olle Tranberg, 2015).
34
Acknowledgements I would like to express my thanks to my supervisor Mattias Larsson for his ideas, knowledge and supervising in field as well as the followed work with this manuscript. I would also like to give a special thanks to my co-supervisors Thomas Ranius and Matts Lindbladh for their time and consultation, to Jan-Eric Englund for statistical consultation, to Kajsa Mellbrand, Jonas Hedin and all other that have collected data and contributed to the accomplishment of this thesis. Finally I would also send my highest appreciation to my classmates and friends at the University for company and support during the time of writing and working and finally for always keeping a good sense of humor. Olle Tranberg Umeå, May 2016
35
References Andersson, B. (1975). Djurgårdens gamla ekar. Stockholm: Stockholm. Andrei, T.O. & Catalin, S. (2014). Biological and ecological features of the saproxylic beetles
listed on IUNC red list from the site of comunity importance 'Nordul Gorjului de Vest'. Analele Universitatii din Craiova Biologie Horticultura Tehnologia Prelucrarii Produselor Agricole Ingineria Mediului, 19(55), pp. 613-616.
Annighofer, P., Beckschafer, P., Vor, T. & Ammer, C. (2015). Regeneration Patterns of European Oak Species (Quercus petraea (Matt.) Liebl., Quercus robur L.) in Dependence of Environment and Neighborhood. Plos One, 10(8), p. 16.
Antonsson, K. (1991). Eklandskapet: en naturinventering av hagar och lövskogar i eklandskapet s. om Linköping: Linköping: Miljövårdsenheten, Länsstyrelsen Östergötland.
Antonsson, K., Hedin, J., Jansson, N., Nilsson, S.G. & Ranius, T. (2003). Occurrence of the hermit beetle (Osmoderma eremita), in Sweden. Entomologisk Tidskrift, 124(4), pp. 225-240.
Antonsson, K. & Karlsson, T. (2014). Åtgärdsprogram för större läderbagge, 2014-2018. Arnborg, T. & Hustich, I. (1953). Våra träd: Stockholm: Svenska skogsvårdsföreningen. Attocchi, G. (2015). Silviculture of oak for high-quality wood production : effects of thinning
on crown size, volume growth and stem quality in even-aged stands of pedunculate oak (Quercus robur L.) in Northern Europe. Diss.: Alnarp : Sveriges lantbruksuniv., 2015.
Bergman, K.O., Jansson, N., Claesson, K., Palmer, M.W. & Milberg, P. (2012). How much and at what scale? Multiscale analyses as decision support for conservation of saproxylic oak beetles. Forest Ecology and Management, 265, pp. 133-141.
Blomberg, P., Billqvist, M., Elfman, P. & Naturskyddsföreningen i, S. (2003). Skånska jätteträd : deras förekomst, betydelse och historia. Lund: Lund : Naturskyddsföreningen i Skåne.
CEN (1994). Durability of wood and wood-based products : natural durability of solid wood : part 2: guide to natural durability and treatability of selected wood species of importance in Europe: Brussels: European Committee for Standardization.
Chiari, S., Carpaneto, G.M., Zauli, A., Zirpoli, G.M., Audisio, P. & Ranius, T. (2013). Dispersal patterns of a saproxylic beetle, Osmoderma eremita, in Mediterranean woodlands. Insect Conservation and Diversity, 6(3), pp. 309-318.
Claesson, K. & Ek, T. (2009). Skyddsvärda träd i Östergötland 1997-2008; inventering av alla grova och ihåliga träd utförd 1997-20082008:13). Linköping: Länsstyrelsen Östergötland.
Craig, C.C. (1953). On the utilization of marked specimens in estimating populations of flying insects. Biometrika, 40(1-2), pp. 170-176.
Dajoz, R. (2000). Insects and forests: the role and diversity of insects in the forest environment: Paris: Intercept.
Drobyshev, I., Niklasson, M., Linderson, H., Sonesson, K., Karlsson, M., Nilsson, S.G. & Lanner, J. (2008). Lifespan and mortality of old oaks - combining empirical and modelling approaches to support their management in Southern Sweden. Annals of Forest Science, 65(4), p. 12.
Eliasson, P. & Nilsson, S.G. (2002). ‘You Should Hate Young Oaks and Young Noblemen’: The Environmental History of Oaks in Eighteenth- and Nineteenth-Century Sweden. Environmental History, 7(4), pp. 659-674.
Flåten, M. & Fjellberg, A. (2008). Rediscovery of Osmoderma eremita (Scopoli, 1763) (Coleoptera, Scarabaeidae) in Norway. Norwegian Journal of Entomology, 55(2), pp. 165-168.
36
Gouix, N., Sebek, P., Valladares, L., Brustel, H. & Brin, A. (2015). Habitat requirements of the violet click beetle (Limoniscus violaceus), an endangered umbrella species of basal hollow trees. Insect Conservation and Diversity, 8(5), pp. 418-427.
Hanski, I., Pakkala, T., Kuussaari, M. & Lei, G.C. (1995). Metapopulation Persistence of an Endangered Butterfly in a Fragmented Landscape. Oikos, 72(1), pp. 21-28.
Hedin, J. (2003a). Metapopulation ecology of Osmoderma eremita - dispersal, habitat quality and habitat history. Diss.: Jonas Hedin.
Hedin, J. (2003b). Verifying an extinction debt in Osmoderma eremita. In: Hedin, J. (Ph.D. thesis), Metapopulation ecology of Osmoderma eremita — dispersal, habitat quality and habitat history.
Hedin, J. & Mellbrand, K. (2003). Population size of the threatened beetle Osmoderma eremita in relation to habitat quality. In: Hedin, J. (Ph.D. thesis), Metapopulation ecology of Osmoderma eremita — dispersal, habitat quality and habitat history.
Hedin, J., Ranius, T., Nilsson, S.G. & Smith, H.G. (2008). Restricted dispersal in a flying beetle assessed by telemetry. Biodiversity and Conservation, 17(3), pp. 675-684.
Hultengren, S. (1997). Ekjättar : historia, naturvärden och vård. Stenungsund: Stenungsund: Naturcentrum.
IUCN (2015). The IUCN Red List of Threatened Species. Version 2015-4. Jansson, N. (1998). Vedskalbaggsfaunan i sex områden med gamla ädellövträd i Örebro
län1998:20): Länsstyrelsen Örebro. Jansson, N. & Antonsson, K. (1995). Eklandskapet som miljöövervakningsobjekt : ett
metodutvecklingsprojekt utfört 1994-1995 av Nicklas Jansson ELK AB i samarbete med Kjell Antonsson: Linköping : Länsstyrelsen Östergötland.
Johannesson, J. & Ek, T. (2006). Eklänet Östergötland - naturinventering av ekmiljöer. (Länsstyrelsens rapport, 2006:10). Linköping: Länsstyrelsen Östergötland.
Jonsell, M., Weslien, J. & Ehnstrom, B. (1998). Substrate requirements of red-listed saproxylic invertebrates in Sweden. Biodiversity and Conservation, 7(6), pp. 749-764.
Larsson, M.C., Hedin, J., Svensson, G.P., Tolasch, T. & Francke, W. (2003). Characteristic odor of Osmoderma eremita identified as a male-released pheromone. Journal of Chemical Ecology, 29(3), pp. 575-587.
Larsson, M.C. & Ranius, T. (2015). Personal communication. Larsson, M.C. & Svensson, G.P. (2009). Pheromone Monitoring of Rare and Threatened
Insects: Exploiting a Pheromone-Kairomone System to Estimate Prey and Predator Abundance. Conservation Biology, 23(6), pp. 1516-1525.
Larsson, M.C. & Svensson, G.P. (2011). Monitoring spatiotemporal variation in abundance and dispersal by a pheromone-kairomone system in the threatened saproxylic beetles Osmoderma eremita and Elater ferrugineus. Journal of Insect Conservation, 15(6), pp. 891-902.
Leonardsson, J. (2015). Skötsel av ekblandskogar: naturvårdsgallring och respons hos träd och buskar. (Management of oak-rich mixed forests: conservation-oriented thinning and response of trees and shrubs). Diss.: University of Gothenburg. Faculty of Science.
Lindbladh, M., Bradshaw, R. & Holmqvist, B.H. (2000). Pattern and process in south Swedish forests during the last 3000 years, sensed at stand and regional scales. Journal of Ecology, 88(1), pp. 113-128.
Lindbladh, M. & Foster, D.R. (2010). Dynamics of long-lived foundation species: the history of Quercus in southern Scandinavia. Journal of Ecology, 98(6), pp. 1330-1345.
Lindquist, B. (1939). Eken vid Norra Kvill [The oak at Norra Kvill in southeastern Sweden]. In: Bygd och Natur 11), pp. 357-359.
37
Mellbrand, K. (2002). Population size in relation to habitat quality in Osmoderma eremita, a vulnerable Scarabaeid beetle living in hollow trees. Diss. Lund: Lund University.
Moilanen, A., Smith, A.T. & Hanski, I. (1998). Long-term dynamics in a metapopulation of the American pika. American Naturalist, 152(4), pp. 530-542.
Morris, M.G. & Perring, F.H. (1974). The British oak: its history and natural history: [... report of the 14th conference of the Botanical society of the British Isles which took place at the University of Sussex, in September, 1973]. (B.S.B.I. conference reports; 14: Faringdon: Classey, cop. 1974).
Niklasson, M., Lindbladh, M. & Björkman, L. (2002). A long-term record of Quercus decline, logging and fires in a southern Swedish Fagus-Picea forest. Journal of Vegetation Science, 13(6), pp. 765-774.
Oleksa, A., Ulrich, W. & Gawronski, R. (2007). Host tree preferences of hermit beetles (Osmoderma eremita Scop., Coleoptera : Scarabaeidae) in a network of rural avenues in Poland. Polish Journal of Ecology, 55(2), pp. 315-323.
Palm, T. (1959). Die holz- und Rindenkäfer der Süd- und Mittelschwedischen Laubbäume. In: Lund, E.s.i. (ed. Opuscula entomologica. Supplementum. Lund.
Paltto, H., Norden, B. & Götmark, F. (2008). Partial cutting as a conservation alternative for oak (Quercus spp.) forest - Response of bryophytes and lichens on dead wood. Forest Ecology and Management, 256(4), pp. 536-547.
Plieninger, T., Hartel, T., Martin-Lopez, B., Beaufoy, G., Bergmeier, E., Kirby, K., Montero, M.J., Moreno, G., Oteros-Rozas, E. & Van Uytvanck, J. (2015). Wood-pastures of Europe: Geographic coverage, social-ecological values, conservation management, and policy implications. Biological Conservation, 190, pp. 70-79.
Ranius, T. (2000). Minimum viable metapopulation size of a beetle, Osmoderma eremita, living in tree hollows. Animal Conservation, 3, pp. 37-43.
Ranius, T. (2001a). Constancy and asynchrony of Osmoderma eremita populations in tree hollows. Oecologia, 126(2), pp. 208-215.
Ranius, T. (2001b). Populationsekologi och habitatkrav för skalbaggar och klokrypare i ihåliga ekar (Population ecology and habitat preferencens preferences for beetles and pseudoscorpions in hollow oaks). Entomologisk Tidskrift, 122(3), pp. 137-149.
Ranius, T. (2002a). Influence of stand size and quality of tree hollows on saproxylic beetles in Sweden. Biological Conservation, 103(1), pp. 85-91.
Ranius, T. (2002b). Osmoderma eremita as an indicator of species richness of beetles in tree hollows. Biodiversity and Conservation, 11(5), pp. 931-941.
Ranius, T., Aguado, L.O., Antonsson, K., Audisio, P., Ballerio, A., Carpaneto, G.M., Chobot, K., Gjurasin, B., Hanssen, O., Huijbregts, H., Lakatos, F., Martin, O., Neculiseanu, Z., Nikitsky, N.B., Paill, W., Pirnat, A., Rizun, V., Ruicanescu, A., Stegner, J., Suda, I., Szwalko, P., Tamutis, V., Telnov, D., Tsinkevich, V., Versteirt, V., Vignon, V., Voegeli, M. & Zach, P. (2005). Osmoderma eremita (Coleoptera, Scarabaeidae, Cetoniinae) in Europe. Animal Biodiversity and Conservation, 28(1), pp. 1-44.
Ranius, T. & Hedin, J. (2001). The dispersal rate of a beetle, Osmoderma eremita, living in tree hollows. Oecologia, 126(3), pp. 363-370.
Ranius, T. & Jansson, N. (2000). The influence of forest regrowth, original canopy cover and tree size on saproxylic beetles associated with old oaks. Biological Conservation, 95(1), pp. 85-94.
Ranius, T., Niklasson, M. & Berg, N. (2009a). A comparison of methods for estimating the age of hollow oaks. Ecoscience, 16(2), pp. 167-174.
Ranius, T., Niklasson, M. & Berg, N. (2009b). Development of tree hollows in pedunculate oak (Quercus robur). Forest Ecology and Management, 257(1), pp. 303-310.
38
Ranius, T. & Nilsson, S.G. (1997). Habitat of Osmoderma eremita Scop. (Coleoptera: Scarabaeidae), a beetle living in hollow trees. Journal of Insect Conservation, 1(4), pp. 193-204.
Ranius, T., Svensson, G.P., Berg, N., Niklasson, M. & Larsson, M.C. (2009c). The successional change of hollow oaks affects their suitability for an inhabiting beetle, Osmoderma eremita. Annales Zoologici Fennici, 46(3), pp. 205-216.
Savill, P. (2013). The silviculture of trees used in British forestry. In: Wise, R. (ed. Wallingford: Wallingford: CABI.
Siitonen, J. & Ranius, T. (2015). The importance of veteran trees for saproxylic insects. In: Kirby, K.J. & Watkins, C. (eds) Europe's changing woods and forests: from wildwood to managed landscapes. Wallingford, UK: Cabi.
Speight, M.C.D. (1989). Saproxylic invertebrates and their conservation. Nature and Environment Series(Y42), p. 79 pp.
Stokland, J.N. (2012). Biodiversity in dead wood: Cambridge; New York: Cambridge University Press.
Straka, U. (2011). Investigations on the biology of the hermit beetle (Osmoderma eremita Scopoli, 1763; Coleoptera) in Lower Austria. Beitraege zur Entomofaunistik, 12, pp. 3-24.
Svensson, G.P. & Larsson, M.C. (2008). Enantiomeric specificity in a pheromone-kairomone system of two threatened saproxylic beetles, Osmoderma eremita and Elater ferrugineus. Journal of Chemical Ecology, 34(2), pp. 189-197.
Svensson, G.P., Larsson, M.C. & Hedin, J. (2004). Attraction of the larval predator Elater ferrugineus to the sex pheromone of its prey, Osmoderma eremita, and its implication for conservation biology. Journal of Chemical Ecology, 30(2), pp. 353-363.
Svensson, G.P., Sahlin, U., Brage, B. & Larsson, M.C. (2011). Should I stay or should I go? Modelling dispersal strategies in saproxylic insects based on pheromone capture and radio telemetry: a case study on the threatened hermit beetle Osmoderma eremita. Biodiversity and Conservation, 20(13), pp. 2883-2902.
Sverdrup-Thygeson, A., Skarpaas, O. & Odegaard, F. (2010). Hollow oaks and beetle conservation: the significance of the surroundings. Biodiversity and Conservation, 19(3), pp. 837-852.
Thomas, C.D. (1994). Extinction, Colonization, and Metapopulations: Environmental Tracking by Rare Species. Conservation Biology, 8(2), pp. 373-378.
Vera, F.W.M. (2000). Grazing ecology and forest history. Grazing ecology and forest history., pp. i-xix, 1-506.
Widerberg, M.K., Ranius, T., Drobyshev, I., Nilsson, U. & Lindbladh, M. (2012). Increased openness around retained oaks increases species richness of saproxylic beetles. Biodiversity and Conservation, 21(12), pp. 3035-3059.
Wiedemann, J.F. (1930). Die Zelluloserverdauung bei Lamellicornierlarven. Zeitschrift für Morphologie und Ökologie der Tiere, 19(1), pp. 227-258.
Winter, S. & Möller, G.C. (2008). Microhabitats in lowland beech forests as monitoring tool for nature conservation. Forest Ecology and Management, 255(3-4), pp. 1251-1261.
39
Appendix 1. Site maps for all examined sites.
40
41
Appendix 2. Captures 1995-2015 Tables presenting all captures for all included hollow trees during the whole study period 1995-2015. Sampling was done with traps following years: 1995-2002, 2005, 2006, 2008, and 2015. The captures consists of first captures (r), recaptures (a) and summarized captures (S) for each sampled year. Additional to this is the estimated population size (N) by method’s by Craig (1953). Dead trees in 2015 are indicated with a cross (†). Table 10. Annual captures consisting of first captures (r), recaptures (a) summarized captures (S), estimated population size (N) for each sampled year.
Tree 1.1 1.2 (†) 1.3 (†) 1.4 Year r a S N r a S N
r a S N r a S N
1995 - - - - 58 47 105 79 3 6 9 4
1 0 1 1 1996 - - - -
47 58 105 55
1 1 2 2
0 0 0 0
1997 - - - -
20 9 29 36
0 0 0 0
0 0 0 0 1998 0 0 0 0
30 6 36 96
0 0 0 0
0 0 0 0
1999 1 0 1 1
25 5 30 79
0 0 0 0
11 8 19 16 2000 0 0 0 0
12 3 15 32
0 0 0 0
5 1 6 16
2001 0 0 0 0
3 0 3 3
0 0 0 0
3 4 7 4 2002 - - - -
- - - -
1 0 1 1
2 0 2 2
2003 - - - -
- - - -
- - - -
- - - - 2004 - - - -
- - - -
- - - -
- - - -
2005 - - - -
- - - -
0 0 0 0
0 0 0 0 2006 - - - -
- - - -
- - - -
5 1 6 16
2007 - - - -
- - - -
- - - -
- - - - 2008 0 0 0 0
- - - -
0 0 0 0
- - - -
2009 - - - -
- - - -
- - - -
- - - - 2010 - - - -
- - - -
- - - -
- - - -
2011 - - - -
- - - -
- - - -
- - - - 2012 - - - -
- - - -
- - - -
- - - -
2013 - - - -
- - - -
- - - -
- - - - 2014 - - - -
- - - -
- - - -
- - - -
2015 3 0 3 3 0 0 0 0 0 0 0 0 2 0 2 2
42
Table 11. Annual captures consisting of first captures (r), recaptures (a) summarized captures (S), estimated population size (N) for each sampled year.
Tree 1.5 1.6 1.7 1.8 Year r a S N r a S N r a S N r a S N 1995 2 0 2 2
- - - - - - - - - - - -
1996 0 0 0 0
- - - -
- - - -
- - - - 1997 0 0 0 0
- - - -
- - - -
- - - -
1998 0 0 0 0
- - - -
- - - -
- - - - 1999 1 0 1 1
0 0 0 0
15 30 45 15
0 0 0 0
2000 0 0 0 0
0 0 0 0
18 28 46 20
0 0 0 0 2001 0 0 0 0
1 0 1 1
3 1 4 7
0 0 0 0
2002 - - - -
1 0 1 1
3 1 4 7
0 0 0 0 2003 - - - -
- - - -
- - - -
- - - -
2004 - - - -
- - - -
- - - -
- - - - 2005 0 0 0 0
0 0 0 0
- - - -
10 1 11 57
2006 - - - -
0 0 0 0
5 2 7 10
0 0 0 0 2007 - - - -
- - - -
- - - -
- - - -
2008 - - - -
- - - -
- - - -
- - - - 2009 - - - -
- - - -
- - - -
- - - -
2010 - - - -
- - - -
- - - -
- - - - 2011 - - - -
- - - -
- - - -
- - - -
2012 - - - -
- - - -
- - - -
- - - - 2013 - - - -
- - - -
- - - -
- - - -
2014 - - - -
- - - -
- - - -
- - - - 2015 0 0 0 0 0 0 0 0 - - - - - - - -
Table 12. Annual captures consisting of first captures (r), recaptures (a) summarized captures (S), estimated population size (N) for each sampled year.
Tree 1.9 1.10 1.11 1.12 Year r a S N
r a S N
r a S N
r a S N
1995 - - - -
- - - -
- - - -
- - - - 1996 - - - -
- - - -
- - - -
- - - -
1997 - - - -
- - - -
- - - -
- - - - 1998 - - - -
0 0 0 0
0 0 0 0
- - - -
1999 5 0 5 6
0 0 0 0
0 0 0 0
- - - - 2000 9 3 12 20
0 0 0 0
0 0 0 0
- - - -
2001 5 0 5 5
0 0 0 0
0 0 0 0
- - - - 2002 2 0 2 2
- - - -
1 0 1 1
- - - -
2003 - - - -
- - - -
- - - -
- - - - 2004 - - - -
- - - -
- - - -
- - - -
2005 - - - -
0 0 0 0
0 0 0 0
- - - - 2006 0 0 0 0
0 0 0 0
0 0 0 0
- - - -
2007 - - - -
- - - -
- - - -
- - - - 2008 - - - -
- - - -
- - - -
0 0 0 0
2009 - - - -
- - - -
- - - -
- - - - 2010 - - - -
- - - -
- - - -
- - - -
2011 - - - -
- - - -
- - - -
- - - - 2012 - - - -
- - - -
- - - -
- - - -
2013 - - - -
- - - -
- - - -
- - - - 2014 - - - -
- - - -
- - - -
- - - -
2015 - - - -
3 1 4 7
- - - -
- - - -
43
Table 13. Annual captures consisting of first captures (r), recaptures (a) summarized captures (S), estimated population size (N) for each sampled year.
Tree 2.1 (†) 2.2 (†) 2.3 2.4 Year r a S N
r a S N
r a S N
r a S N
1995 11 2 13 38
0 0 0 0
0 0 0 0
0 0 0 0 1996 15 19 34 18
0 0 0 0
0 0 0 0
0 0 0 0
1997 78 102 180 90
2 5 7 3
1 1 2 2
0 0 0 0 1998 94 241 335 97
0 0 0 0
0 0 0 0
0 0 0 0
1999 66 51 117 91
0 0 0 0
0 0 0 0
0 0 0 0 2000 60 30 90 103
2 0 2 0
0 0 0 0
0 0 0 0
2001 39 29 68 55
0 0 0 0
0 0 0 0
0 0 0 0 2002 42 38 80 55
- - - -
- - - -
- - - -
2003 - - - -
- - - -
- - - -
- - - - 2004 - - - -
- - - -
- - - -
- - - -
2005 7 15 22 7
- - - -
- - - -
- - - - 2006 9 9 18 11
- - - -
- - - -
- - - -
2007 - - - -
- - - -
- - - -
- - - - 2008 3 0 3 3
0 0 0 0
0 0 0 0
0 0 0 0
2009 - - - -
- - - -
- - - -
- - - - 2010 - - - -
- - - -
- - - -
- - - -
2011 - - - -
- - - -
- - - -
- - - - 2012 - - - -
- - - -
- - - -
- - - -
2013 - - - -
- - - -
- - - -
- - - - 2014 - - - -
- - - -
- - - -
- - - -
2015 0 0 0 0
0 0 0 0
0 0 0 0
- - - -
Table 14. Annual captures consisting of first captures (r), recaptures (a) summarized captures (S), estimated population size (N) for each sampled year.
Tree 3.1 (†)
3.2
3.3
3.4 Year r a S N
r a S N
r a S N
r a S N
1995 29 21 50 41
5 5 10 6
8 7 15 11
14 11 25 19 1996 14 2 16 59
0 0 0 0
3 3 6 3
14 20 34 16
1997 14 3 17 42
2 9 11 2
8 12 20 8
11 30 41 11 1998 8 5 13 16
4 25 29 4
5 0 5 5
10 17 27 10
1999 7 1 8 29
5 8 13 5
4 3 7 6
15 11 26 21 2000 14 3 17 42
12 6 18 21
13 53 66 13
9 28 37 9
2001 6 1 7 22
6 6 12 8
1 0 1 1
8 2 10 22 2002 0 0 0 0
4 2 6 7
13 17 30 15
1 0 1 1
2003 - - - -
- - - -
- - - -
- - - - 2004 - - - -
- - - -
- - - -
- - - -
2005 5 2 7 10
7 16 23 7
14 30 44 14
3 1 4 7 2006 1 0 1 1
12 1 13 80
22 54 76 22
7 0 7 7
2007 - - - -
- - - -
- - - -
- - - - 2008 - - - -
2 12 14 3
11 53 64 11
10 9 19 13
2009 - - - -
- - - -
- - - -
- - - - 2010 - - - -
- - - -
- - - -
- - - -
2011 - - - -
- - - -
- - - -
- - - - 2012 - - - -
- - - -
- - - -
- - - -
2013 - - - -
- - - -
- - - -
- - - - 2014 - - - -
- - - -
- - - -
- - - -
2015 2 1 3 3
- - - -
- - - -
3 0 3 3
44
Table 15. Annual captures consisting of first captures (r), recaptures (a) summarized captures (S), estimated population size (N) for each sampled year.
Tree 3.5 3.6 3.7 3.8 Year r a S N r a S N r a S N r a S N 1995 2 0 2 2
0 0 0 0
0 0 0 0
- - - -
1996 3 0 3 4
1 0 1 1
0 0 0 0
- - - - 1997 2 0 2 2
1 0 1 1
0 0 0 0
- - - -
1998 0 0 0 0
2 1 3 4
0 0 0 0
0 0 0 0 1999 0 0 0 0
0 0 0 0
0 0 0 0
0 0 0 0
2000 1 0 1 1
0 0 0 0
0 0 0 0
0 0 0 0 2001 0 0 0 0
0 0 0 0
0 0 0 0
2 2 4 3
2002 8 3 11 16
1 0 1 1
0 0 0 0
0 0 0 0 2003 - - - -
- - - -
- - - -
- - - -
2004 - - - -
- - - -
- - - -
- - - - 2005 0 0 0 0
1 0 1 1
0 0 0 0
5 8 13 13
2006 0 0 0 0
0 0 0 0
0 0 0 0
10 13 23 12 2007 - - - -
- - - -
- - - -
- - - -
2008 - - - -
- - - -
- - - -
8 3 11 16 2009 - - - -
- - - -
- - - -
- - - -
2010 - - - -
- - - -
- - - -
- - - - 2011 - - - -
- - - -
- - - -
- - - -
2012 - - - -
- - - -
- - - -
- - - - 2013 - - - -
- - - -
- - - -
- - - -
2014 - - - -
- - - -
- - - -
- - - - 2015 0 0 0 0 - - - - 0 0 0 0 - - - -
Table 16. Annual captures consisting of first captures (r), recaptures (a) summarized captures (S), estimated population size (N) for each sampled year.
Tree 3.9 3.10 3.11 3.12 (†) Year r a S N r a S N r a S N r a S N 1995 1 0 1 1
- - - -
- - - -
0 0 0 0
1996 0 0 0 0
- - - -
- - - -
0 0 0 0 1997 0 0 0 0
- - - -
- - - -
0 0 0 0
1998 0 0 0 0
0 0 0 0
0 0 0 0
0 0 0 0 1999 0 0 0 0
0 0 0 0
0 0 0 0
0 0 0 0
2000 0 0 0 0
0 0 0 0
1 1 2 2
0 0 0 0 2001 0 0 0 0
0 0 0 0
0 0 0 0
0 0 0 0
2002 0 0 0 0
0 0 0 0
0 0 0 0
0 0 0 0 2003 - - - -
- - - -
- - - -
- - - -
2004 - - - -
- - - -
- - - -
- - - - 2005 - - - -
- - - -
- - - -
- - - -
2006 - - - -
- - - -
- - - -
- - - - 2007 - - - -
- - - -
- - - -
- - - -
2008 0 0 0 0
0 0 0 0
0 0 0 0
0 0 0 0 2009 - - - -
- - - -
- - - -
- - - -
2010 - - - -
- - - -
- - - -
- - - - 2011 - - - -
- - - -
- - - -
- - - -
2012 - - - -
- - - -
- - - -
- - - - 2013 - - - -
- - - -
- - - -
- - - -
2014 - - - -
- - - -
- - - -
- - - - 2015 - - - - - - - - 0 0 0 0 - - - -
45
Table 17. Annual captures consisting of first captures (r), recaptures (a) summarized captures (S), estimated population size (N) for each sampled year.
Tree 3.13 3.14 3.15 4.Y Year r a S N r a S N r a S N r a S N 1995 - - - -
- - - -
- - - -
- - - -
1996 - - - -
- - - -
- - - -
- - - - 1997 - - - -
- - - -
- - - -
- - - -
1998 0 0 0 0
- - - -
- - - -
- - - - 1999 0 0 0 0
- - - -
- - - -
- - - -
2000 0 0 0 0
- - - -
- - - -
- - - - 2001 0 0 0 0
- - - -
- - - -
- - - -
2002 0 0 0 0
- - - -
- - - -
- - - - 2003 - - - -
- - - -
- - - -
- - - -
2004 - - - -
- - - -
- - - -
- - - - 2005 - - - -
- - - -
- - - -
2 3 5 2
2006 - - - -
- - - -
- - - -
0 0 0 0 2007 - - - -
- - - -
- - - -
- - - -
2008 0 0 0 0
- - - -
- - - -
- - - - 2009 - - - -
- - - -
- - - -
- - - -
2010 - - - -
- - - -
- - - -
- - - - 2011 - - - -
- - - -
- - - -
- - - -
2012 - - - -
- - - -
- - - -
- - - - 2013 - - - -
- - - -
- - - -
- - - -
2014 - - - -
- - - -
- - - -
- - - - 2015 - - - - 0 0 0 0 0 0 0 0 - - - -
Table 18. Annual captures consisting of first captures (r), recaptures (a) summarized captures (S), estimated population size (N) for each sampled year.
Tree 4.1 4.2 (†) 4.3 (†) 4.4 Year r a S N
r a S N
r a S N
r a S N
1995 24 14 38 38
0 0 0 0
0 0 0 0
2 1 3 4 1996 8 2 10 22
0 0 0 0
0 0 0 0
0 0 0 0
1997 0 0 0 0
0 0 0 0
0 0 0 0
0 0 0 0 1998 1 2 3 2
0 0 0 0
0 0 0 0
2 0 2 2
1999 8 23 31 8
0 0 0 0
0 0 0 0
2 0 2 2 2000 5 6 11 5
0 0 0 0
0 0 0 0
0 0 0 0
2001 4 5 9 4
0 0 0 0
0 0 0 0
0 0 0 0 2002 1 1 2 2
1 0 1 1
0 0 0 0
0 0 0 0
2003 - - - -
- - - -
- - - -
- - - - 2004 - - - -
- - - -
- - - -
- - - -
2005 - - - -
- - - -
- - - -
- - - - 2006 - - - -
- - - -
- - - -
- - - -
2007 - - - -
- - - -
- - - -
- - - - 2008 - - - -
- - - -
0 0 0 0
0 0 0 0
2009 - - - -
- - - -
- - - -
- - - - 2010 - - - -
- - - -
- - - -
- - - -
2011 - - - -
- - - -
- - - -
- - - - 2012 - - - -
- - - -
- - - -
- - - -
2013 - - - -
- - - -
- - - -
- - - - 2014 - - - -
- - - -
- - - -
- - - -
2015 - - - -
- - - -
- - - -
0 0 0 0
46
Table 19. Annual captures consisting of first captures (r), recaptures (a) summarized captures (S), estimated population size (N) for each sampled year.
Tree 4.5 4.6 (†) 4.8 4.9 Year r a S N r a S N r a S N r a S N 1995 1 0 1 1
- - - -
- - - -
- - - -
1996 1 0 1 1
- - - -
- - - -
- - - - 1997 0 0 0 0
- - - -
- - - -
- - - -
1998 0 0 0 0
0 0 0 0
1 3 4 2
1 13 14 2 1999 0 0 0 0
0 0 0 0
0 0 0 0
0 0 0 0
2000 0 0 0 0
1 0 1 1
0 0 0 0
0 0 0 0 2001 0 0 0 0
0 0 0 0
0 0 0 0
3 3 6 3
2002 0 0 0 0
0 0 0 0
0 0 0 0
2 0 2 2 2003 - - - -
- - - -
- - - -
- - - -
2004 - - - -
- - - -
- - - -
- - - - 2005 - - - -
- - - -
0 0 0 0
4 4 8 5
2006 - - - -
- - - -
0 0 0 0
5 0 5 5 2007 - - - -
- - - -
- - - -
- - - -
2008 0 0 0 0
- - - -
- - - -
- - - - 2009 - - - -
- - - -
- - - -
- - - -
2010 - - - -
- - - -
- - - -
- - - - 2011 - - - -
- - - -
- - - -
- - - -
2012 - - - -
- - - -
- - - -
- - - - 2013 - - - -
- - - -
- - - -
- - - -
2014 - - - -
- - - -
- - - -
- - - - 2015 0 0 0 0 0 0 0 0 0 0 0 0 - - - -
Table 20. Annual captures consisting of first captures (r), recaptures (a) summarized captures (S), estimated population size (N) for each sampled year.
Tree 4.10 4.11 4.12 4.13 (†) Year r a S N r a S N r a S N r a S N 1995 - - - -
- - - -
- - - -
- - - -
1996 - - - -
- - - -
- - - -
- - - - 1997 - - - -
- - - -
- - - -
- - - -
1998 0 0 0 0
0 0 0 0
0 0 0 0
- - - - 1999 0 0 0 0
0 0 0 0
1 0 1 1
- - - -
2000 0 0 0 0
0 0 0 0
0 0 0 0
- - - - 2001 0 0 0 0
0 0 0 0
0 0 0 0
- - - -
2002 0 0 0 0
1 0 1 1
0 0 0 0
- - - - 2003 - - - -
- - - -
- - - -
- - - -
2004 - - - -
- - - -
- - - -
- - - - 2005 - - - -
- - - -
- - - -
- - - -
2006 - - - -
- - - -
- - - -
- - - - 2007 - - - -
- - - -
- - - -
- - - -
2008 0 0 0 0
0 0 0 0
0 0 0 0
- - - - 2009 - - - -
- - - -
- - - -
- - - -
2010 - - - -
- - - -
- - - -
- - - - 2011 - - - -
- - - -
- - - -
- - - -
2012 - - - -
- - - -
- - - -
- - - - 2013 - - - -
- - - -
- - - -
- - - -
2014 - - - -
- - - -
- - - -
- - - - 2015 - - - - 0 0 0 0 1 0 1 1 1 1 2 2
47
Table 21. Annual captures consisting of first captures (r), recaptures (a) summarized captures (S), estimated population size (N) for each sampled year.
Tree 5.1 (†) 5.2 5.3 5.4 Year r a S N
r a S N
r a S N
r a S N
1995 1 0 1 1
0 0 0 0
3 4 7 4
- - - - 1996 1 1 2 2
0 0 0 0
0 0 0 0
- - - -
1997 0 0 0 0
0 0 0 0
1 0 1 1
- - - - 1998 0 0 0 0
0 0 0 0
0 0 0 0
3 8 11 3
1999 0 0 0 0
0 0 0 0
2 0 2 2
0 0 0 0 2000 0 0 0 0
0 0 0 0
0 0 0 0
0 0 0 0
2001 0 0 0 0
0 0 0 0
0 0 0 0
0 0 0 0 2002 - - - -
- - - -
- - - -
- - - -
2003 - - - -
- - - -
- - - -
- - - - 2004 - - - -
- - - -
- - - -
- - - -
2005 - - - -
- - - -
- - - -
- - - - 2006 - - - -
- - - -
- - - -
- - - -
2007 - - - -
- - - -
- - - -
- - - - 2008 - - - -
- - - -
- - - -
- - - -
2009 - - - -
- - - -
- - - -
- - - - 2010 - - - -
- - - -
- - - -
- - - -
2011 - - - -
- - - -
- - - -
- - - - 2012 - - - -
- - - -
- - - -
- - - -
2013 - - - -
- - - -
- - - -
- - - - 2014 - - - -
- - - -
- - - -
- - - -
2015 0 0 0 0
0 0 0 0
0 0 0 0
0 0 0 0
Table 22. Annual captures consisting of first captures (r), recaptures (a) summarized captures (S), estimated population size (N) for each sampled year.
Tree 7.1 7.2 7.3 7.4 Year r a S N r a S N r a S N r a S N 1995 - - - - - - - -
- - - - - - - -
1996 - - - -
- - - -
- - - -
- - - - 1997 - - - -
- - - -
- - - -
- - - -
1998 - - - -
- - - -
- - - -
- - - - 1999 0 0 0 0
1 0 1 1
1 0 1 2
0 0 0 0
2000 0 0 0 0
1 2 3 2
0 0 0 0
0 0 0 0 2001 0 0 0 0
0 0 0 0
0 0 0 0
0 0 0 0
2002 0 0 0 0
3 2 5 5
5 1 6 16
- - - - 2003 - - - -
- - - -
- - - -
- - - -
2004 - - - -
- - - -
- - - -
- - - - 2005 - - - -
3 0 3 4
0 0 0 0
- - - -
2006 - - - -
14 14 28 18
25 10 35 49
- - - - 2007 - - - -
- - - -
- - - -
- - - -
2008 0 0 0 0
- - - -
- - - -
- - - - 2009 - - - -
- - - -
- - - -
- - - -
2010 - - - -
- - - -
- - - -
- - - - 2011 - - - -
- - - -
- - - -
- - - -
2012 - - - -
- - - -
- - - -
- - - - 2013 - - - -
- - - -
- - - -
- - - -
2014 - - - -
- - - -
- - - -
- - - - 2015 0 0 0 0 - - - - 0 0 0 0 - - - -
48
Table 23. Annual captures consisting of first captures (r), recaptures (a) summarized captures (S), estimated population size (N) for each sampled year.
Tree 7.5 7.6 7.7 7.8 Year r a S N r a S N r a S N r a S N 1995 - - - - - - - -
- - - - - - - -
1996 - - - -
- - - -
- - - -
- - - - 1997 - - - -
- - - -
- - - -
- - - -
1998 0 0 0 0
0 0 0 0
2 2 4 3
1 0 1 1 1999 0 0 0 0
0 0 0 0
15 17 32 18
0 0 0 0
2000 0 0 0 0
0 0 0 0
12 18 30 14
0 0 0 0 2001 0 0 0 0
8 4 12 14
6 6 12 8
- - - -
2002 0 0 0 0
- - - -
25 16 41 38
- - - - 2003 - - - -
- - - -
- - - -
- - - -
2004 - - - -
- - - -
- - - -
- - - - 2005 - - - -
7 6 13 9
- - - -
- - - -
2006 - - - -
- - - -
14 6 20 26
- - - - 2007 - - - -
- - - -
- - - -
- - - -
2008 - - - -
0 0 0 0
- - - -
- - - - 2009 - - - -
- - - -
- - - -
- - - -
2010 - - - -
- - - -
- - - -
- - - - 2011 - - - -
- - - -
- - - -
- - - -
2012 - - - -
- - - -
- - - -
- - - - 2013 - - - -
- - - -
- - - -
- - - -
2014 - - - -
- - - -
- - - -
- - - - 2015 0 0 0 0 - - - - 7 1 8 29 - - - -
Table 24. Annual captures consisting of first captures (r), recaptures (a) summarized captures (S), estimated population size (N) for each sampled year.
Tree 7.9 7.10 7.11 7.12 Year r a S N r a S N r a S N r a S N 1995 - - - - - - - -
- - - -
- - - -
1996 - - - -
- - - -
- - - -
- - - - 1997 - - - -
- - - -
- - - -
- - - -
1998 0 0 0 0
0 0 0 0
0 0 0 0
1 1 2 2 1999 0 0 0 0
0 0 0 0
0 0 0 0
0 0 0 0
2000 0 0 0 0
0 0 0 0
0 0 0 0
0 0 0 0 2001 6 6 12 8
0 0 0 0
0 0 0 0
- - - -
2002 0 0 0 0
0 0 0 0
0 0 0 0
0 0 0 0 2003 - - - -
- - - -
- - - -
- - - -
2004 - - - -
- - - -
- - - -
- - - - 2005 2 0 2 2
- - - -
- - - -
0 0 0 0
2006 8 11 19 9
- - - -
- - - -
7 0 7 7 2007 - - - -
- - - -
- - - -
- - - -
2008 - - - -
- - - -
- - - -
- - - - 2009 - - - -
- - - -
- - - -
- - - -
2010 - - - -
- - - -
- - - -
- - - - 2011 - - - -
- - - -
- - - -
- - - -
2012 - - - -
- - - -
- - - -
- - - - 2013 - - - -
- - - -
- - - -
- - - -
2014 - - - -
- - - -
- - - -
- - - - 2015 - - - - - - - - 0 0 0 0 - - - -
49
Table 25. Annual captures consisting of first captures (r), recaptures (a) summarized captures (S), estimated population size (N) for each sampled year.
Tree 8.1 (†) 8.2 (†) 8.5 8.6 Year r S a N r S a N r S a N r S a N 1995 - - - - - - - - - - - - - - - - 1996 - - - -
- - - -
- - - -
- - - -
1997 - - - -
- - - -
- - - -
- - - - 1998 2 2 0 3
2 2 0 3
0 0 0 0
0 0 0 0
1999 0 0 0 0
3 3 0 4
0 1 1 2
0 0 0 0 2000 0 0 0 0
0 0 0 0
0 0 0 0
0 0 0 0
2001 0 0 0 0
1 1 0 1
0 0 0 0
0 0 0 0 2002 - - - -
- - - -
- - - -
- - - -
2003 - - - -
- - - -
- - - -
- - - - 2004 - - - -
- - - -
- - - -
- - - -
2005 - - - -
- - - -
- - - -
- - - - 2006 - - - -
- - - -
- - - -
- - - -
2007 - - - -
- - - -
- - - -
- - - - 2008 - - - -
- - - -
- - - -
- - - -
2009 - - - -
- - - -
- - - -
- - - - 2010 - - - -
- - - -
- - - -
- - - -
2011 - - - -
- - - -
- - - -
- - - - 2012 - - - -
- - - -
- - - -
- - - -
2013 - - - -
- - - -
- - - -
- - - - 2014 - - - -
- - - -
- - - -
- - - -
2015 0 0 0 0 7 7 0 7 - - - - 0 0 0 0
Table 26. Annual captures consisting of first captures (r), recaptures (a) summarized captures (S), estimated population size (N) for each sampled year.
Tree 8.7 8.8 8.9 8.10 Year r S a N r S a N r S a N r S a N 1995 - - - -
- - - -
- - - -
- - - -
1996 - - - -
- - - -
- - - -
- - - - 1997 - - - -
- - - -
- - - -
- - - -
1998 0 0 0 0
0 0 0 0
3 4 1 7
0 0 0 0 1999 0 0 0 0
5 6 1 16
0 0 0 0
0 0 0 0
2000 0 0 0 0
2 3 1 4
5 10 5 6
0 0 0 0 2001 0 0 0 0
0 0 0 0
1 1 0 1
0 0 0 0
2002 - - - -
- - - -
- - - -
- - - - 2003 - - - -
- - - -
- - - -
- - - -
2004 - - - -
- - - -
- - - -
- - - - 2005 - - - -
- - - -
- - - -
- - - -
2006 - - - -
- - - -
- - - -
- - - - 2007 - - - -
- - - -
- - - -
- - - -
2008 - - - -
- - - -
- - - -
- - - - 2009 - - - -
- - - -
- - - -
- - - -
2010 - - - -
- - - -
- - - -
- - - - 2011 - - - -
- - - -
- - - -
- - - -
2012 - - - -
- - - -
- - - -
- - - - 2013 - - - -
- - - -
- - - -
- - - -
2014 - - - -
- - - -
- - - -
- - - - 2015 - - - - - - - - - - - - 0 0 0 0
50
Table 27. Annual captures consisting of first captures (r), recaptures (a) summarized captures (S), estimated population size (N) for each sampled year.
Tree 8.11 8.12 8.13 8.14 Year r S a N r S a N r S a N r S a N 1995 - - - - - - - - - - - - - - - - 1996 - - - -
- - - -
- - - -
- - - -
1997 - - - -
- - - -
- - - -
- - - - 1998 3 4 1 7
0 0 0 0
0 0 0 0
- - - -
1999 0 0 0 0
0 0 0 0
0 0 0 0
- - - - 2000 3 4 1 7
1 1 0 2
0 0 0 0
- - - -
2001 2 2 0 2
2 3 1 3
0 0 0 0
- - - - 2002 - - - -
- - - -
- - - -
- - - -
2003 - - - -
- - - -
- - - -
- - - - 2004 - - - -
- - - -
- - - -
- - - -
2005 - - - -
- - - -
- - - -
- - - - 2006 - - - -
- - - -
- - - -
- - - -
2007 - - - -
- - - -
- - - -
- - - - 2008 - - - -
- - - -
- - - -
- - - -
2009 - - - -
- - - -
- - - -
- - - - 2010 - - - -
- - - -
- - - -
- - - -
2011 - - - -
- - - -
- - - -
- - - - 2012 - - - -
- - - -
- - - -
- - - -
2013 - - - -
- - - -
- - - -
- - - - 2014 - - - -
- - - -
- - - -
- - - -
2015 5 6 1 16 4 5 1 11 - - - - 0 0 0 0
Table 28. Annual captures consisting of first captures (r), recaptures (a) summarized captures (S), estimated population size (N) for each sampled year.
Tree 9.2 9.3 9.4 9.5 Year r a S N r a S N r a S N r a S N 1995 - - - -
- - - -
- - - -
- - - -
1996 - - - -
- - - -
- - - -
- - - - 1997 - - - -
- - - -
- - - -
- - - -
1998 0 0 0 0
11 5 16 20
0 0 0 0
7 0 7 7 1999 8 3 11 16
18 6 24 40
0 0 0 0
7 0 7 7
2000 2 0 2 2
11 9 20 15
0 0 0 0
1 0 1 1 2001 - - - -
- - - -
0 0 0 0
- - - -
2002 6 0 6 6
3 0 3 3
0 0 0 0
15 3 18 48 2003 - - - -
- - - -
- - - -
- - - -
2004 - - - -
- - - -
- - - -
- - - - 2005 0 0 0 0
0 0 0 0
0 0 0 0
5 0 5 5
2006 18 6 24 40
1 0 1 1
0 0 0 0
8 0 8 8 2007 - - - -
- - - -
- - - -
- - - -
2008 5 9 14 6
- - - -
- - - -
- - - - 2009 - - - -
- - - -
- - - -
- - - -
2010 - - - -
- - - -
- - - -
- - - - 2011 - - - -
- - - -
- - - -
- - - -
2012 - - - -
- - - -
- - - -
- - - - 2013 - - - -
- - - -
- - - -
- - - -
2014 - - - -
- - - -
- - - -
- - - - 2015 1 0 1 1 0 0 0 0 0 0 0 0 25 16 41 38
51
Table 29. Annual captures consisting of first captures (r), recaptures (a) summarized captures (S), estimated population size (N) for each sampled year.
Tree 9.6 (†) 9.7 9.8 9.9 Year r a S N r a S N r a S N r a S N 1995 - - - -
- - - -
- - - -
- - - -
1996 - - - -
- - - -
- - - -
- - - - 1997 - - - -
- - - -
- - - -
- - - -
1998 2 3 5 3
0 0 0 0
6 3 9 10
2 2 4 3 1999 1 0 1 1
0 0 0 0
8 7 15 11
1 0 1 1
2000 0 0 0 0
0 0 0 0
17 10 27 27
1 0 1 1 2001 0 0 0 0
0 0 0 0
10 3 13 24
0 0 0 0
2002 - - - -
0 0 0 0
24 17 41 35
0 0 0 0 2003 - - - -
- - - -
- - - -
- - - -
2004 - - - -
- - - -
- - - -
- - - - 2005 - - - -
- - - -
19 15 34 26
2 0 2 2
2006 - - - -
- - - -
34 31 65 44
6 0 6 6 2007 - - - -
- - - -
- - - -
- - - -
2008 - - - -
- - - -
27 23 50 36
- - - - 2009 - - - -
- - - -
- - - -
- - - -
2010 - - - -
- - - -
- - - -
- - - - 2011 - - - -
- - - -
- - - -
- - - -
2012 - - - -
- - - -
- - - -
- - - - 2013 - - - -
- - - -
- - - -
- - - -
2014 - - - -
- - - -
- - - -
- - - - 2015 - - - - 0 0 0 0 29 31 60 36 0 0 0 0
Table 30. Annual captures consisting of first captures (r), recaptures (a) summarized captures (S), estimated population size (N) for each sampled year.
Tree 9.10 9.11 9.12 Year r a S N r a S N r a S N r a S N 1995 - - - -
- - - -
- - - -
- - - -
1996 - - - -
- - - -
- - - -
- - - - 1997 - - - -
- - - -
- - - -
- - - -
1998 - - - -
- - - -
- - - -
- - - - 1999 8 3 11 16
- - - -
- - - -
- - - -
2000 7 3 10 13
0 0 0 0
- - - -
- - - - 2001 9 4 13 17
- - - -
- - - -
- - - -
2002 9 3 12 20
- - - -
- - - -
- - - - 2003 - - - -
- - - -
- - - -
- - - -
2004 - - - -
- - - -
- - - -
- - - - 2005 6 4 10 9
- - - -
0 0 0 0
- - - -
2006 5 0 5 6
- - - -
11 3 14 28
- - - - 2007 - - - -
- - - -
- - - -
- - - -
2008 10 17 27 10
- - - -
- - - -
- - - - 2009 - - - -
- - - -
- - - -
- - - -
2010 - - - -
- - - -
- - - -
- - - - 2011 - - - -
- - - -
- - - -
- - - -
2012 - - - -
- - - -
- - - -
- - - - 2013 - - - -
- - - -
- - - -
- - - -
2014 - - - -
- - - -
- - - -
- - - - 2015 2 0 2 2 13 9 22 19 - - - - - - - -
52
Appendix 3. Hollow tree data Tables presenting additional data to hollow trees, concerning tree ID, coordinates (RT90) (N and E), circumference, age (refers to 2015, dead trees to 2006) and conditions regarding hollow.
Table 31. Specific habitat variables interconnected to individual trees.
Tree ID N E Circumference Age Hollow
Entrance h. ab.
ground
Mould volume (dm3)
Entr. size
(dm2)
Stage
1.1 6461325 1496063 410 371
0 14.3 2.95 7 1.2 6461298 1496073 500 351
4 145.7 24.0 5
1.3 6461293 1496078 554 290
0.5 - 50.5 7 1.4 6461282 1496078 370 309
4 2.0 1.0 5
1.5 6461271 1496174 556 304
4.5 - 23.5 6 1.6 6461384 1496078 467 268
0 3.6 13.0 5
1.7 6461425 1496105 424 400
3 0.3 5.0 6 1.8 6461396 1496187 598 -
0 46.1 2.0 -
1.9 6461426 1496136 674 365
4 1.8 - - 1.10 6461409 1496141 388 -
0 29.2 14.0 5
1.11 6461393 1496149 517 -
3 - 2.5 5 1.12 6461337 1496141 - -
- - - -
1.13 6461336 1496154 - -
- - - - 1.14 - - - -
- - - -
2.1 6460882 1497126 400 309
1 207.7 20.0 6 2.2 6460666 1496982 425 304
3.5 49.1 3.5 5
2.3 6461162 1495864 530 388
1.5 - - 5 2.4 6460902 1495899 362 190
0 56.8 6.0 5
3.1 6460913 1496684 240 -
0.5 96.5 4.5 6 3.2 6460970 1496633 190 254
3 9.9 1.0 5
3.3 6461012 1496631 340 395
2 71.4 5.5 6 3.4 6461022 1496642 335 245
2 50.3 3.5 5
3.5 6461067 1496676 310 264
3 6.3 17.0 5 3.6 6461087 1496656 305 287
3 19.7 12.0 5
3.7 6461152 1496656 418 271
1.5 90.7 5.0 6 3.8 6461067 1496758 340 264
1 130.8 3.0 6
3.9 6461328 1496633 334 274
3 5.4 12.5 5 3.10 6461195 1496758 500 -
0 - 20.0 -
3.11 6461214 1496743 546 306
1 47.1 34.5 6 3.12 6460864 1496861 325 -
1 - - 6
3.13 6460987 1496912 357 -
2 - - 5 3.14 6461386 1496682 - -
1 - - -
3.15 6461128 1496742 - -
0.5 - - - 4.1 6461430 1497156 450 465
1 45.1 36.0 6
4.2 6461420 1497162 - -
- - - 5 4.3 6461439 1497188 271 220
3 182.0 2.5 6
4.4 6461306 1497086 273 362
2 - - 5 4.5 6461355 1497022 287 353
2 7.8 1.0 5
4.6 6461406 1497050 324 -
- - 6.0 6 4.8 6461469 1496996 285 310
3 55.0 8.0 5
4.9 6461480 1496968 334 299
2.5 20.4 4.0 5 4.10 6461607 1496756 495 336
3 - - 5
4.11 6461584 1496676 286 224
2.5 1.9 - 4 4.12 6461308 1497083 275 278
0 11.3 3.0 7
4.13 6461453 1496959 - -
- - - -
53
4.14 - - - - - - - -
Table 32. Specific habitat variables interconnected to individual trees.
Tree ID N E Circumference Age Hollow
Entrance h. ab.
ground
Mould volume (dm3)
Entr. size
(dm2)
Stage
5.1 6462376 1496496 397 507
3 5.3 2.5 5 5.2 6462371 1496480 585 491
2.5 9.4 4.0 5
5.3 6462423 1496475 525 507
3.5 14.7 3.5 5 5.4 6462555 1496448 369 268
1 10.8 48.0 6
7.1 6458783 1495971 380 355
0 15.1 90.0 7 7.2 6458846 1495946 424 399
4 9.5 30.0 5
7.3 6459167 1495965 235 241
3 17.2 5.0 5 7.4 6458933 1496153 - -
- - - -
7.5 6458777 1495977 262 249
2.5 6.4 15.0 5 7.6 6459171 1495981 156 -
0.5 - 6.0 5
7.7 6459220 1495747 416 330
1 - 9.5 6 7.8 6459246 1495764 - -
- - - -
7.9 6459116 1495568 326 201
0.5 73.5 2.5 6 7.10 6459091 1495743 365 295
4 - 4.5 5
7.11 6459123 1495755 - -
- - - 5 7.12 6459007 1495830 352 278
- 38.9 - 6
7.13 6458819 1495907 361 347
1 126.1 3.0 6 8.1 6462487 1497241 500 -
1 - - 5
8.2 6462460 1497241 524 -
2 226.5 7.5 6 8.5 6462313 1497093 520 -
3 - - -
8.6 6463027 1496956 450 -
0 4.4 3.0 6 8.7 6463193 1496712 322 -
1.5 0.3 2.0 -
8.8 6463359 1496565 393 -
2 385.6 6.0 - 8.9 6463178 1497205 473 -
1.5 6.9 2.0 -
8.10 6463104 1497240 319 -
0.5 105.9 1.5 5 8.11 6463089 1496896 465 -
2 101.3 33.0 6
8.12 6463038 1496867 680 -
4 10.2 6.0 5 8.13 6462458 1497255 490 -
0 24.4 6.0 -
8.14 6463021 1496956 - -
1 - - - 9.2 6453671 1491626 470 365
4 187.0 21.0 6
9.3 6453510 1491584 623 472
3.5 94.2 9.5 6 9.4 6453463 1491497 420 307
- 197.5 35.5 7
9.5 6453518 1491710 498 406
- 0.3 - 5 9.6 6453574 1491803 361 320
0 3.2 11.0 -
9.7 6453693 1491691 560 -
2.5 - - 6 9.8 6453841 1491708 340 429
2 102.1 2.5 6
9.9 6453578 1491790 436 412
4 53.4 3.5 5 9.10 6453706 1491709 500 399
1.5 389.2 15.0 6
9.11 6453686 1491625 - -
- - - - 9.12 6453517 1491665 - 486 - 16.4 - -
54
55
Appendix 4. Correlation matrix
Table 33. Correlation matrix for habitat variables included in singular and multiple regression, including correlation coefficient and probability (p).
k (N) k (NNorm) Circumference Entrance hole height above ground
Entrance hole size
(dm2)
Mould volume
Canopy Closure
Sun exposure
Age
k (NNorm) - 1.00 k (N) 1.00 - Circumference -0.37 -0.31 1.00