www.jrc.ec.europa.eu Serving society Stimulating innovation Supporting legislation MEErP preparatory study on taps and showers Joint Research Center 1 st TWG meeting – Sevilla, 29 October 2013
Transcript
www.jrc.ec.europa.eu
Serving society
Stimulating innovation
Supporting legislation
MEErP preparatory study on taps and showers
Joint Research Center
1st TWG meeting – Sevilla, 29 October 2013
Objectives Developing an evidence base to prepare the potential integrated implementation of SPP for taps and showers. MEErP compliant and representative Technical, Economic, Environmental analyses
Independent, neutral, science-based research with strong stakeholder involvement (Technical Working Groups) Preparing the ground for decisions on appropriate SPP tool mix
Study overview
Task 1: Product group definition and scope, standards and legislation,
Task 2: Market analysis
Task 3: User behaviour and system aspects
Task 4: Technologies
Task 5: Environmental and economic assessment
Task 6: Design options
Task 7: Policy scenarios analysis
Milestones Jan 2013, Start of works Jun 2013, KO meeting with stakeholders: official launch of the study Oct 2013, 1st TWG meeting: finding consensus and discussing on potential outcomes Feb/Mar 2014, 2nd TWG meeting: presentation of preliminary outcomes Jun/Jul 2014, Final report
Information collection
• Literature
• May 2013, 1st Questionnaire: 15 replies, partial update
• Jul 2013, 2nd Questionnaire: 10 replies, supplementary information
• Participation in meetings and further interaction with stakeholders
Processing updated and new information on
1. Scope and definitions: incl. standards and legislation
2. Market: Prodcom statistics and data from industry (ref. to 2012, trends and forecasts)
3. Users and system aspects: user behaviour, heating systems, water supply and wastewater collection and treatment
4. Technologies: BAT for water and energy savings, BoMs for design options + additional input for the Ecoreport tool
Estimation of water and energy consumption and saving potential in the EU
Identification of technical options for further analyses
Next steps:
Deadline for comments: 10 November at the latest
2nd TWG meeting (Brussels, 2nd half of Mar 2014)
Completion of the final report (Jul 2014)
Consultation process for the implementation of SPP (tbd)
Table of Contents
1. Scope 2. Market analysis 3. Users and system aspects 4. Analysis of technologies 5. Preliminary environmental assessment 6. Synthesis and potential results 7. Next steps
Table of Contents
1. Scope 2. Market analysis 3. Users and system aspects 4. Analysis of technologies 5. Preliminary environmental assessment 6. Synthesis and potential results 7. Next steps
TASK 1: SCOPE
• Product definitions and classifications
• Measurements methods and standards
• Legislation, voluntary agreements and labels
• Potential barriers to producers
Product definitions and classification
The initial scope of this preparatory study covers taps and showers used to derive urban water with a quality that fits for human use and a desired temperature.
Urban uses include personal hygiene, cleaning, cooking and drinking and other uses in urban applications.
These can take place in domestic and non-domestic applications
Non-domestic applications include premises such as restaurants, shops, hotels, schools, sport centres, hospitals, office and public buildings
• a mixing valve (e.g. mechanical or thermostatic)
• a water outlet (e.g. showerhead, hand shower, shower handset, shower plates connected to the mixing valve through flexible hoses or tubes (columns or panels in the most expensive models)
Feature Options Type of shower outlet
Fixed / Movable
Outlet holder Fixed / Slide bar Mixing valve Mechanical valve
environments Additional features Wellness and luxury
showers Massage outlets
Main functions of taps and showers are related to: quality, safety, flow rate and temperature control and comfort
Functionality of taps
• Delivering water without impairing its hygienic and organoleptic quality and affecting the safety of users and buildings
• Allowing the user to control the flow rate
• Allowing the user to control the temperature
Functionality of showers
• Delivering water without impairing its hygienic and organoleptic quality and affecting the safety of users and buildings
• Providing an effective and comfortable rinsing performance
Additional functions
Classifications according to EU trade statistics PRODCOM / CN
• Differentiation between mixing valves (28.14.12.33 / 8481 80 11) and other valves (28.14.12.35 / 8481 80 19).
• No information about the use of the product
• According to information collected during the Kick Off Meeting
showers are in the same categories of relevance for taps
• Pillar taps are not included
NACE more aggregated
Definitions and classifications according to:
International standards (e.g. EN 200, EN 1112, EN 13904, BS 6100-7)
Labelling schemes (e.g. EU Ecolabel for sanitary tapware)
Products not relevant for water/energy saving
Product Market significance Technical comment
Bathtub taps
They are mandatory in Portugal (one per dwelling) and common in the UK (95% of bath market, including bath taps and bath/shower mixers)
Either a single outlet high-flow mixer or the bath outlet of a bath/shower mixer.
These products are required to allow bath filling as quickly as possible to prevent energy and heat loss. The size of the bath tub would be the relevant factor, not the tap. The faster a bath is filled, the lower the amount of heat loss.
Household food waste disposers installed in sinks
Different market, however this product hardly exists in France and it is not permitted in Portugal.
Not a water using product included within the scope of the project.
Industrial kitchens taps
Different market shares (indicatively 1% by value in Germany and about 0% in Portugal).
Industrial kitchen taps are professional tools that need to be assessed accordingly to the particular needs of their users. Water is part of the food recipe or needed to clean food in big wash basins. Hand-wash basins in industrial kitchens represent an exception. Sensor operated taps could be mandatory for these applications.
Based on discussion with stakeholders
Product Market significance Technical comment
Instant hot water dispensers
No specific data available.
Not a water using product included in the scope of the project.
Luxury and wellness showers
No specific data available, however it has been reported that market is very low in Portugal.
These are showerhead with a diameter above 200mm. However, very clear definitions are required to understand these sectors. Luxury devices do not necessarily mean that they perform a ‘wellness’ function. Moreover, wellness devices may be required to perform a ‘medical’ function.
Pre-rinse shower units
Market share of this product is expected to be quite small (1% by value in Germany for industrial kitchens and about 0% in Portugal)
This is not a regular function of the majority of the products on the market (apart from industrial kitchens taps). Moreover, a simple reduction of the flow rate for this product would imply a longer use. More efficient spray nozzles could be a more effective option to save water.
Dominant design is spray gun, spring and hose on a tap.
Safety showers
No specific data available, however the market share is considered very low in Portugal.
The function of this product is to wash a person/body part in order to provide relief and to minimise as quickly as possible the effects of an incident.
Frequency of use is very low and safety is the only important parameter.
Updated information
• EN 806 series (-1;-2;-3;-4;-5) on "Specifications for installations inside buildings conveying water for human consumption“
• EN 12056-1;-2;-3;-4;-5 on "Gravity drainage systems inside buildings"
• EN 16145 on "Extractable outlets for sink and basin mixers" and EN 16146:2013 on "Extractable shower hoses for sanitary tapware for supply systems type 1 and type 2"
• DIN 1988-100;-200;-300;-8;-500;-600;-7
Standards to be deleted
• EN 1717 on protection against pollution of potable water in water installations
• EN 13618 on flexible hose assemblies in drinking water installations
• EN 13904 and EN 13905 replaced by EN 1112 and EN 1113
Measurement methods and standards
Additional information
a) Functional performance parameters
Apart from EN 16507, EN 16058 and DIN 2459, no other standards allow the characterizing the fitness for contact with drinking water
some methods exist to assess the distribution of the flow a proxy
for comfort or efficiency (BS 6340-4 - AUS/NZ 3662 - ASTM F2324-03). A method for rinsing effectiveness of showers is being developed by CEIR
In Sweden SS 820000 and SS 820001 that include methods for
temperature measurement, flow distribution and rinsing ability
In Portugal, test for evaluation of water efficiency (ANQIP ETA 0807 and ETA 0809)
Functional performance parameters for thermostatic mixing
valves:
• EN 1111
• EN 15092-1; -2; -3; -4 on Aluminium and aluminium alloys
• Australian Standards AS 4032.1-2-3-4
• Standards of the American Society of Sanitary Engineering 1016,
1017, 1062, 1069, 1070 on temperature control
• KIWA guidelines and TMV2 and TMV3 certification
• NF 077 and NF 079 on certification and control and safety valves
• Chinese Standard QB 2806
b) Resources use (energy, water and other materials)
EN 15804 related to the environmental impact of construction products
EN 27842 on "Methods for Determination of Discharge Capacity of Automatic Steam Traps" (?)
DIN 1988-300 on "Codes of practice for drinking water installations-Part 300: Pipe Sizing"
c) Water abstraction, treatment and supply
d) Waste production
e) Emission measurement
No relevant information identified
g) Noise and vibrations
• EN 200 on "Sanitary tapware. Single taps and combination taps for water supply systems of type 1 and type 2"
• EN 1112 on "Sanitary tapware. Shower outlets for sanitary tapware for water supply systems of type 1 and type“
h) Waste-water collection and treatment which discharge into surface water
• EN 12056 on "Gravity drainage systems inside buildings Roof drainage, layout and calculation"
• DIN 1986-30; -100
f) Safety
• EN 1287 on "Sanitary tapware. Low pressure thermostatic mixing valves. General technical specification"
• EN 15092 on "Building valves. Inline hot water supply tempering valves. Tests and requirements"
New standards, mandates or revision
• Standards such as EN 246, EN 200, EN 817, EN 15091, EN 1111, EN 1287 have to be revised and updated
• EN 1111 should be under final approval. ASSE 1016 has been modified in order to integrate lower flow rates. Revision in the Australian Code
• CEIR has been developing a pre-normative method for showerhead ‘efficiency’ or cleanability rating test
Problems of accuracy, reproducibility and representativeness
• According to stakeholders often ‘type tests’ and not validation tests
• For performance, comfort and water use efficiency some methods exist to assess the flow distribution, but they are very sensitive to the test conditions and with reproducibility problems.
• Swedish methods are also considered to have some reproducibility problems. Results seem to be directly correlated with flow rate and it is very complicated to measure efficiency
Legislation
Ecodesing and Energy labelling
EU mandatory legislation involving some WuP but not taps and showers
Additional information (e.g. water consumption, noise) can be included into the Commission's energy label
Voluntary labelling schemes at European level
• EU Ecolabel criteria for sanitary tapware (November 2012)
Some water labelling schemes based on water efficiency rating systems have been identified:
• Water Label
• Water Efficiency Label (WELL)
Updated information on legislation
Regulations for drinking water and materials
• Schemes for the market approval of WuP differ from country to country (AU; BE; DK; DE; Norway; CH; UK). Need of harmonization
• The UBA works according to the German drinking water directive (TrinWV) on mandatory criteria for materials and substances in contact with drinking water
• In UK, compliance with the Water Regulation no specific testing
for metallic while organics shall comply with BS 6920
• In Portugal Scheme Approval
• Test methods to secure safe and healthy drinking water NKB 4 - ACS, Wras, KTW, AS 4020, NSF 61, UBA list, KIWA
• 4 MS initiative: any update?
Building regulations
French regulation on energy performance of buildings
calculation method for taps
UK building regulations under revision possible influence on water
use in new homes
• National Building Code of Finland covering "water supply and drainage installations for buildings“ (water quality must be taken into consideration in materials selection. Small amount of dezincification is allowed for water fixtures)
Additional labelling of interest
Voluntary environmental labelling for buildings such as LEED (USA), BREEAM (GB), DNGB (Germany) and HQE (France)
In the French “Marque NF” products are tested and ranked according to nominal flow rate and flow and temperature management
Waste-water collection and treatment which discharge into surface water
• The UK Building Regulations – Sustainable Drainage Requirements
No relevant information identified for:
• Water abstraction, treatment and supply
• Waste production
• Emission measurement
Safety
• French regulation hot water delivered below 50°C
• In the UK specific safety issues for the delivery of hot water in healthcare premises. Additionally Scottish and English Building Regulations also cover hot water safety to baths and other appliances
Additional information
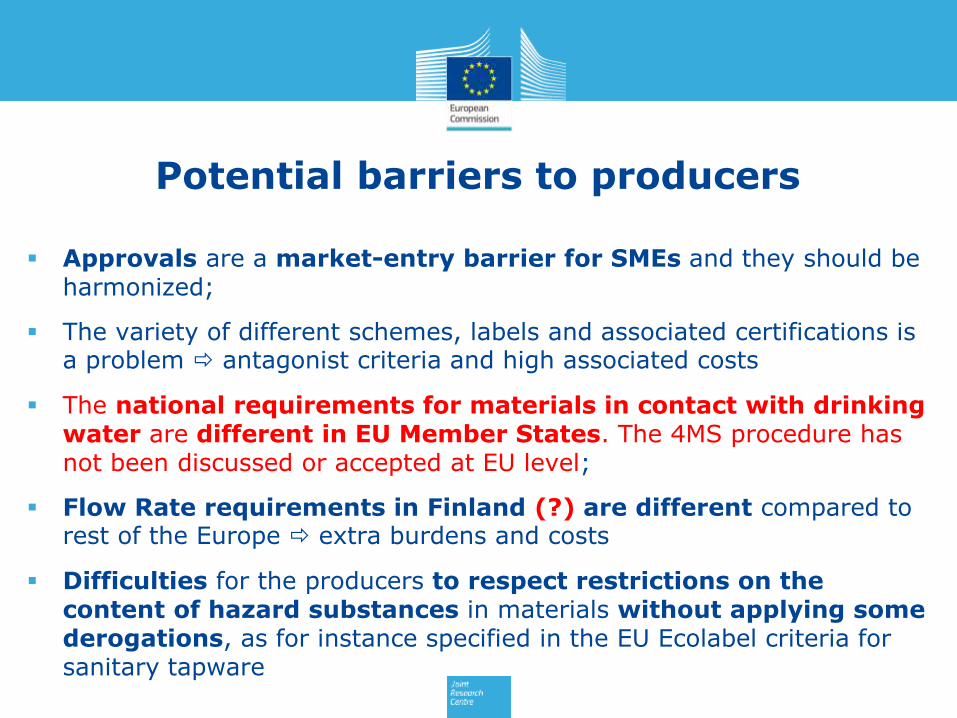
Approvals are a market-entry barrier for SMEs and they should be harmonized;
The variety of different schemes, labels and associated certifications is a problem antagonist criteria and high associated costs
The national requirements for materials in contact with drinking water are different in EU Member States. The 4MS procedure has not been discussed or accepted at EU level;
Flow Rate requirements in Finland (?) are different compared to rest of the Europe extra burdens and costs
Difficulties for the producers to respect restrictions on the content of hazard substances in materials without applying some derogations, as for instance specified in the EU Ecolabel criteria for sanitary tapware
Potential barriers to producers
Discussion area
1. Definition and classification for taps and showers
2. Refining of products not relevant for water/energy saving (e.g. definition of luxury and wellness showers)
3. Information on standards, labelling and legislation (e.g. 4MS)
Supporting information for Task 1
1. Water consumption and related energy saving
• Maximum and lowest maximum available water flow rates
• Presence of a temperature management device / technical solution (where water supply is not temperature controlled)
• Guidelines on time control for taps and showers with time control devices
2. Materials in contact with drinking water
3. Excluded or limited substances and mixtures
4. Product quality and longevity
5. Packaging
6. User information
7. Information appearing on the EU Ecolabel
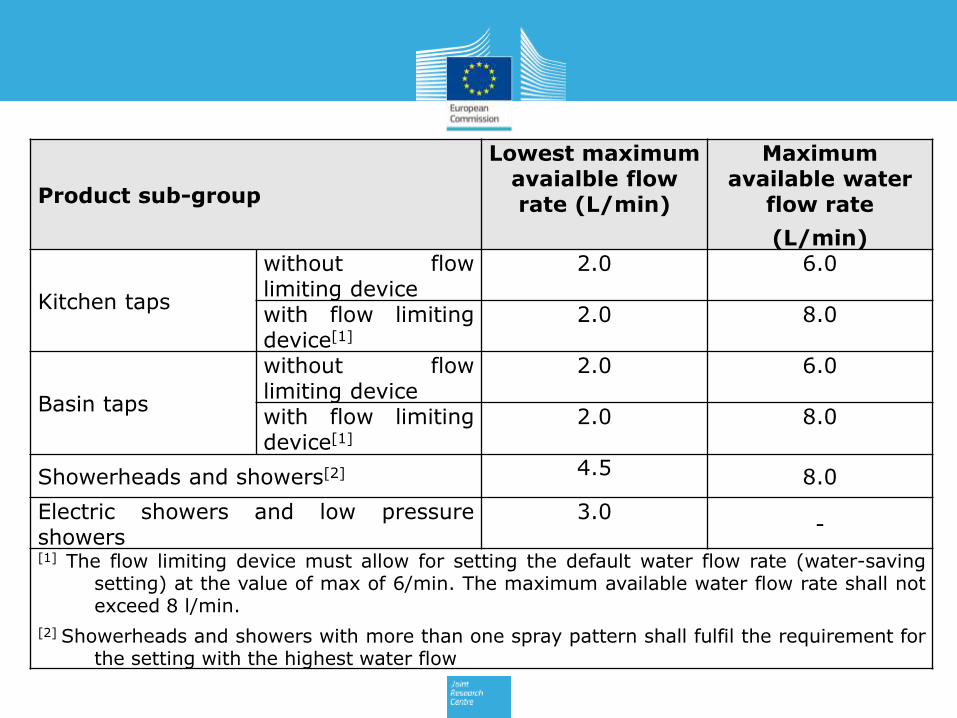
EU Ecolabel criteria for sanitary tapware (November 2012)
Product sub-group
Lowest maximum avaialble flow rate (L/min)
Maximum available water
flow rate
(L/min)
Kitchen taps
without flow limiting device
2.0 6.0
with flow limiting device[1]
2.0 8.0
Basin taps
without flow limiting device
2.0 6.0
with flow limiting device[1]
2.0 8.0
Showerheads and showers[2] 4.5 8.0
Electric showers and low pressure showers
3.0 -
[1] The flow limiting device must allow for setting the default water flow rate (water-saving setting) at the value of max of 6/min. The maximum available water flow rate shall not exceed 8 l/min.
[2] Showerheads and showers with more than one spray pattern shall fulfil the requirement for the setting with the highest water flow
Table of Contents
1. Scope 2. Market analysis 3. Users and system aspects 4. Analysis of technologies 5. Preliminary environmental assessment 6. Synthesis and potential results 7. Next steps
TASK 2: MARKET ANALYSIS
• EU production and trade volume (official statistics)
• Market and stock data (model)
• Market structure and trends
• Consumer expenditure and base data
Generic economic data (official statistics)
Production in EU-27 (1995-2012) (Prodcom, EUR and kg units)
Imports/exports from/to third countries (ComExt, EUR and kg units)
Sales in EU-27 = Production in EU-27 + imports – exports (EUR/units)
Taps and Showers - PRODCOM codes and corresponding 2012 CN codes
Showers in the same categories of relevance for taps
Pillar taps are not included
Code Description
Prodcom
28.14.12.33 Mixing valves for sinks, wash basins, bidets, water cisterns etc. excluding valves for pressure-reducing or oleohydraulic/pneumatic power transmissions, check valves, safety/relief valves
CN 8481 80 11 Mixing valves for sinks, washbasins, bidets, water cisterns, baths and similar fixtures
Prodcom
28.14.12.35 Taps, cocks and valves for sinks, wash basins, bidets, water cisterns etc. excluding valves for pressure-reducing/oleohydraulic transmissions, check, safety, relief and mixing valves
CN 8481 80 19 Taps, cocks and valves for sinks, washbasins, bidets, water cisterns, baths and similar fixtures (excl. Mixing valves)
EU Production
Mixing valves (28.14.12.33) 99 millions kg and 2.3 billion€ (2012)
Other valves (28.14.12.35) 300 millions kg and 2.4 billion€ (2012)
in terms of units
All products reported in PRODCOM refer to taps and showers of relevance for this study (with the exception of pillar taps).
The share of taps and showers (in terms of units) sold and/or installed in domestic premises represents 90% of the market and the remaining part (10%) is sold and/or installed in non-domestic premises
The ratio between taps and showers is 3:1 for the domestic sector and 30:1 for the non-domestic sector
the ratio between taps and showers in the overall market is
5.7:1
Assum
ptions
Based on feedback from stakeholders
The average weight of taps is evaluated as average of the provided data
Showers are made of: 1.Thermostatic valves (4 kg) installed in 50% of the showers
and mechanical mixing valves (1.8 kg) in the other 50% 2.Showerhead/handshower (1 kg) A
ssum
ptions
Product Average weight (kg/product)
Weight range (kg/product) Min Max
Taps Basin mixer: 1kg Bath/shower mixer: 2.5kg
0.5 kg for a basin pillar tap
4 kg for a thermostatic bath/shower mixer
1.8 kg in a global retailer 1.2 3.5
Showerheads and hand showers
100 mm plastic hand shower: 0.4 kg 150 mm metallic showerhead: 1.5kg
0.1 kg basic plastic hand shower
10 kg for a 500mm x 250mm showerhead
Product Average product (kg)
Min (kg)
Max (kg)
Tap 1.8 0.5 4
Showerhead and handshower 1.0 0.1 10
Shower 4.1 1.8 14
Presence of pillar taps is significant only in the UK (30% of the market in terms of units and 45% of the stock in 2012). Trend for following years is -3%.
UK production reported in the official statistics has to be increased by 30% to take into account for pillar taps. A
ssum
ptions
Estimated production (in 2012):
• 161 millions of taps and 28 millions of showers
This corresponds to 284 Millions of kg, or 3,397 M€, for taps and 116 Millions of kg, or 1,367 M€, for showers
Split between taps and showers
• Taps: 85% of the total sold units - 71 % of the total sold volume in weight
• Showers: 15% of the total sold units - 29 % of the total sold volume in
weight
EU trade
The same assumptions made for the production volume have been applied to the evaluation of imports and exports of taps and showers
Estimated trade (in 2012):
• Import 82.3 millions of taps and 13.7 millions of showers
• Export 61.9 millions of taps and 10.8 millions of shower
Intra-EU Trade and Extra-EU Trade
Total value
• Other Valves (CN 8481 8019) - largest importers/exporters
• Mixing Valves (CN 8481 8011) - largest importers/exporters
• Lower average weights apparent consumption from statistics vs. results of the scale-up decreases from 3.1 to 1.5 for taps and from 1.6 to 0.6 for showers
Market and stock data (model)
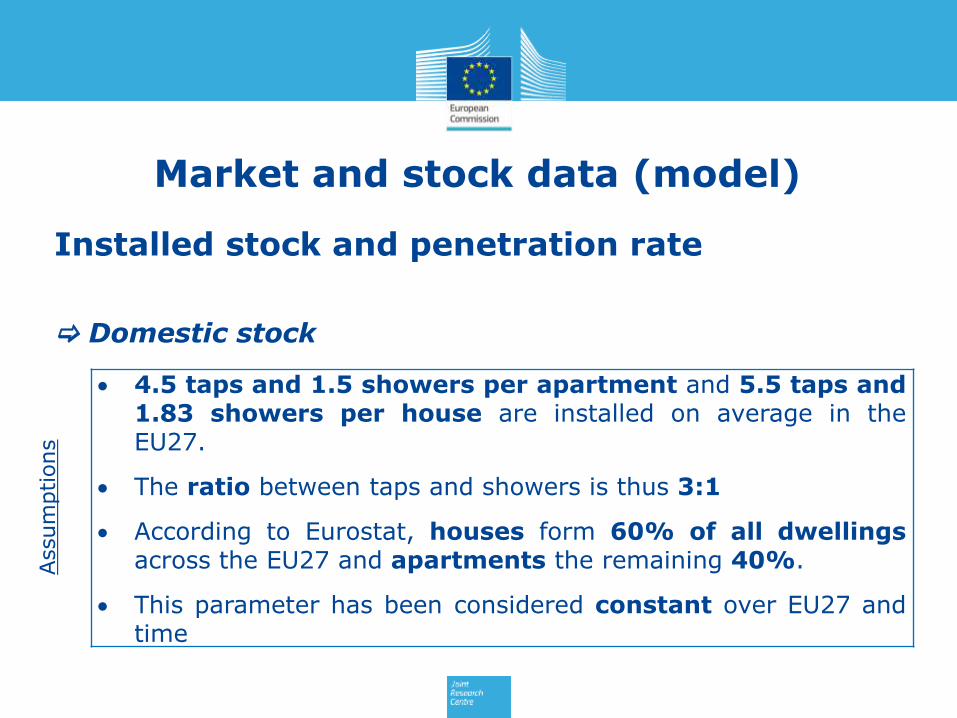
Installed stock and penetration rate
Domestic stock
4.5 taps and 1.5 showers per apartment and 5.5 taps and 1.83 showers per house are installed on average in the EU27.
The ratio between taps and showers is thus 3:1
According to Eurostat, houses form 60% of all dwellings across the EU27 and apartments the remaining 40%.
This parameter has been considered constant over EU27 and time
Assum
ptions
Assum
ptions
Business 100% of private businesses provide showering to employees 1 shower per 100 employees is present in all cat. of companies Separate showers are provided for male and female employees The ratio between taps and showers is equal to 30:1 An additional 20% of employees work in public
administrations
Healthcare 1 bathroom with 1 tap every bed (average across all MSs) 1 shower every 4 beds (average across all MSs) 1 kitchen tap every 75 beds (average across all MSs)
Non-domestic stock (1)
Assum
ptions
Tourism For 50% of beds, 1 bathroom with 1 tap and 1 shower For the other 50% of beds, 1 bathroom with 1 tap and 1
shower every 2 beds 1 kitchen taps every 100 beds
Education 1 tap, 1 shower and 1 kitchen tap every 100 student/pupils
Non-domestic stock (2)
Taps stock
domestic sector: 1.22 billion of units (2012). Growth (2010-2050) +14% 1.36 billion of units (2050)
non-domestic sector: 73.2 million of units (6% of domestic) (2012). Growth (2010-2050) +24% 87.5 million of units (2050)
Showers stock
domestic sector: 406 million of units (2012) [261 million units in the study for EU and GPP criteria for sanitary tapware]. Growth (2010-2050) +14% 452 million of units (2050)
non-domestic sector: 24.7 million units (6% of domestic) (2012). Growth (2010-2050) +17% 28 million of units (2050)
Annual sales
Frequency of substitution = 1/average lifetime of the product
Annual sales = product installed x frequency of substitution
Product Real life time (years)
Technical life time, as declared by manufacturer
(years)
Average (min-max) Average (min-max)
Taps, domestic 16 (10-40) in France 25 (15-50) in France
3-10 (3-50) in the UK Variable among manufacturers in the UK
Taps, non-domestic 12 (5-20) in France 25 (10-50) in France
5-10 (5-20) in the UK Variable among manufacturers in the UK
Showers, domestic 10 (5-15) in France 15 (2-25) in France
2-10 (2-30) in the UK Variable among manufacturers in the UK
Showers, non-domestic 7 (5-15) in France 15 (5-25) in France
5-10 (5-15) in the UK Variable among manufacturers in the UK
Industrial kitchen taps 5 (1-10) 15 (10-20)
Domestic dwellings Non-domestic sector
Average life time in years (min-
max)
Average life time in years (min-
max)
Taps 16 (3-50) 10 (5-20)
Showers 10 (2-30) 7 (5-15)
Assum
ptions
Taps sales
domestic sector: 76.1 million of units (2012).
Growth (2010-2050) +12% 85 million of units (2050)
non-domestic sector: 7.3 million of units (2012).
Growth (2010-2050) +17% 8.5 million of units (2050)
Showers sales
domestic sector: 40.6 million of units (2012).
Growth (2010-2050) +11% 45.2 million of units (2050)
non-domestic sector: 3.5 million of units (2012).
Growth (2010-2050) +20% 4.2 million of units (2050)
Results of the analysis Taps (2012)
Showers (2012)
Stock of taps (M units)
Domestic Non Domestic Total
1,217 73
1,291
406 25
431 Sales (M units)
Domestic Non Domestic Total
76.1 7.3
83.4
40.6 3.5
44.1 Apparent consumption (M units)
(scale-up) 59 19 (EU statistics) 181 31
Average lifetime (years) Domestic Non domestic Under the assumption that 90% is domestic
16 10
13.7
10 7
8.6
From stock and total sales
15.5
9.7
Share of non-domestic stock and sales <10%
apparent consumption based on official statistics could be overestimated for taps and underestimated for showers
modelling of stock and sales should be more robust
Market structure and trends
50% of companies are SMEs. Progressive absorption in larger companies
80-96% of taps and showers are sold for domestic applications
Market channels: large stores, retailers and distributors, trade associations, on-line sellers, importers, manufacturers and construction companies
Country Major players and key contacts (Feedback from stakeholders)
Portugal Large stores: Leroy Merlin, AKI, Isibuild, etc. The UK Suppliers: Keramag, Villeroy &, VitrAbad Gmbh, Duravit Ag, Kohler and Ideal Standard, Grohe
Hansgrohe, Kludi, Ideal Standard,Hansa, Bristan Group , Ideal Standard (UK), Jacuzzi UK Group, Qualceram Shires , Roca, Samuel Heath & Sons, Triton, Twyford Bathrooms Key importers: VitraA and Tipravit from Turkey, Dahll from China, Lecico from Egypt, Roca and Porcelanosa form Spain
Bathroom taps 30-200 50-100 Showerheads 20–60 15-100 Shower/bath 300 50-100 Kitchen taps 30–300 50-100 Outdoor taps 100 50-100 Non-domestic Installation cost (€) Maintenance (€) Bathroom taps 30–200b 50-100 Showerheads 60 15-100 Kitchen taps 150 50-100 Outdoor taps 100b 50-100 (a) in case of intervention of professionals (b) considered as the cost for domestic
Spare Part Cost (€)a
Aerators single 5-10
Ceramic Disc Cartridges (single lever taps)
single 20
O Rings Box of mixed o rings for taps (approx. 115) 10
Tap heads single 10-40
Valves: Ceramic disc valve Compression tap valve
pair single
25-40
5
Washers Box of mixed washers for taps (approx. 80) 10
(a) when not included in the price of repair and maintenance
Please check
Disposal Tariffs
• Taps and showerheads may be disposed alongside other waste
• However, it seems that taps are usually collected and recycled
• No economic burdens identified
Gas and Electricity Prices
• Reference to MEErP Methodology Report
Water Prices
• Task 2 report for Ecodesing of Washing Machines considered an
average price for water supply and sewage of 2.5 Euro/m3
• Alternatively, reference to MEErP Methodology Report
Interest and Inflation Rates
• Reference to Eurostat and MEErP Methodology Report
Domestic
incl.VAT
Long term
growth per
year
Non-
domestic
excl. VAT
Electricity (€ / kWh) 0.18 5% 0.11
Gas (€ / GJ (LHV)) 14.54 3-5% 8.90
Oil (gas oil) (€ / 1000 ltr) 824 5% Not Available
Water (€ / m³) 3.70 2.50% Not Available
Interest rate 7.7% Not Available 6.5%
Inflation rate 2.1%
Discount rate (EU default) 4%
Energy escalation rate* 4%
VAT 20%
Summary energy, water & financial rates for EU-27
* real (inflation corrected) increase
Discussion areas
1. Assumptions on: general market data, stock and sales model (from KO meeting and interaction with stakeholders), e.g. • Prodcom categories and taps and showers definition • ratio between taps and showers, • domestic vs. non-domestic • average weight • % pillar taps • number of taps and showers in domestic and non-domestic • forecasts • product lifetime
2. Information on market trends
3. Information on consumer expenditures (cost of products, installation, maintenance and repair, EoL)
Supporting information for Task 2
Growth factors estimated for domestic and non-domestic dwelling
Source of information: development of EU Ecolabel and GPP criteria on sanitary tapware + VHK report "Study on Amended Working Plan under the Ecodesign Directive. Task 3"
Table of Contents
1. Scope 2. Market analysis 3. Users and system aspects 4. Analysis of technologies 5. Preliminary environmental assessment 6. Synthesis and potential results 7. Next steps
• Water and energy use in taps and showers
• Water and energy saving potential
• Impact on waste water treatment
TASK 3: USERS AND SYSTEM ASPECTS
Urban water consumption
• 60.7 billion m3/yr (FAO, 2008-2012), 17-25% of total abstraction
• Demographic and economic trends to increased use
• Different uses and differences across the EU (507 M persons)
• Domestic: 150 L delivered/p/d (EUREAU)
• Non-domestic: 50 L delivered/p/d (EUREAU)
• Water loss: 10-50%, 24% on average
• General consistency between EUREAU, FAO and EEA
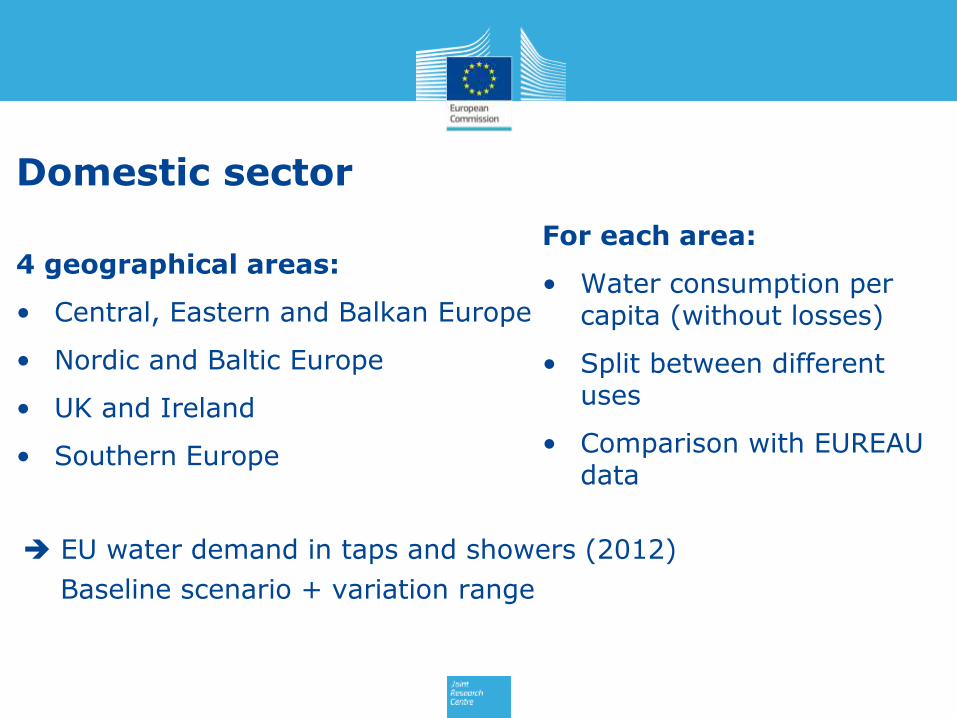
Water and energy use in taps and showers
• Aim: EU average for domestic and non domestic sectors (2012) + variation range
• Domestic: based on 4 geographical zones
• Non-domestic: based on split between different uses
• Heating systems: summary of key information from VHK Lot2 Ecodesign study
• Mix of energy and conversion/transmission efficiency (energy weighted EU average from Lot2)
• Water loss and energy demand for water supply;
• Energy demand in the wastewater treatment system;
• Considered to refer to 2012
Tier 2 – Inclusion of system aspects
• Heating systems: summary of key information from VHK Lot2 Ecodesign study
• Mix of energy and conversion/transmission efficiency (energy weighted EU average from Lot2)
• Water loss and energy demand for water supply;
• Energy demand in the wastewater treatment system;
• Reference to 2012
Energy mix (total efficiency): • 40% electricity (72%) • 40% natural gas (50%) • 20% oil (52%)
• Water distribution loss: 24% (10-50%)
• Water supply: 0.63 kWh electricity per m3 (-25%/+43%). Abstraction = 50%
• Wastewater collection and treatment: 1.97 kWh electricity per m3 (-85%/+422%). Mainly treatment
Water consumption – Tier 2 • Total water abstraction for use in taps and showers in the EU28:
24860 Mm3/yr (-35%/+42%) = 40% of total urban water abstraction
• 87% in the domestic sector and 13% in the non-domestic sector
• Domestic: 21640 Mm3/yr (-27%/+37%) for taps (49%) and showers (51%)
• Non-domestic: 3223 Mm3/yr (-83%/+76%) for taps (85%) and showers (15%)
Energy consumption – Tier 2
• Total system energy demand associated to the use of water in taps and showers is 1794 PJ/yr (-44%/+54%)
• 94% in the domestic and 6% in the non-domestic sector
• Domestic: 1693 PJ/yr (-41%/+54%) for taps (22%) and showers (78%)
• Non-domestic: 101.3 PJ/yr (-90%/+59%) for taps (69%) and showers (31%)
• Energy contributions:
- Hot water: 46-55%
- Water heating efficiency: 32-38%
- Wastewater treatment: 5-15%
- Water abstraction and delivery: 2-7%
In line with literature
Water and energy saving potential Based on stakeholders feedback:
Volume of water Wastage of water Daily frequency
Baths 155-185 L (40% actual) 0-10% 0.2 in the UK
Time of use Wastage of water Daily frequency Showers 7 min (2.5-10 min) 10% (0-20%) 1 (0.6-1.5) Washbasin taps 1 min (0.33-2.5 min) 10% (0-50%) 5 (3-7) Kitchen taps 1 min (0.5-2.5 min) 10% (0-20%) 5 (3-7)
Baseline Min Max
Baths 185 L (50% actual) 155 L (40% actual) 200 L (60% actual) Showers 10 L/min 6 L/min 13 L/min
Washbasin taps 10 L/min 6 L/min 13 L/min
Kitchen taps 10 L/min 6 L/min 13 L/min
Technical measures to achieve water savings applied to
• 43% of water from all taps (washbasin, dishwashing, bathing)
• 100% of water from all showers.
Water saving potential (product only):
• 36% for domestic taps (mix of different taps, 32% w/o bathing)
• 40% for non-domestic taps
• 34% for showers in both domestic and non-domestic sectors.
• No switch from bathing to showering
Annual water saving potential over tot. water from T&S:
• 15% for domestic taps (14% w/o bathing ) and 17% for non-domestic taps.
• 34% for all showers.
Compared to baseline (literature: 0-30% for the non-domestic)
Total EU28 water saving from taps and showers:
• 6027 Mm3/year (89% domestic, 11% non-domestic)
• 24% of the total water abstraction for taps and showers
• 12% of the total water abstraction for urban use
• Variation range: from 65% to 142%
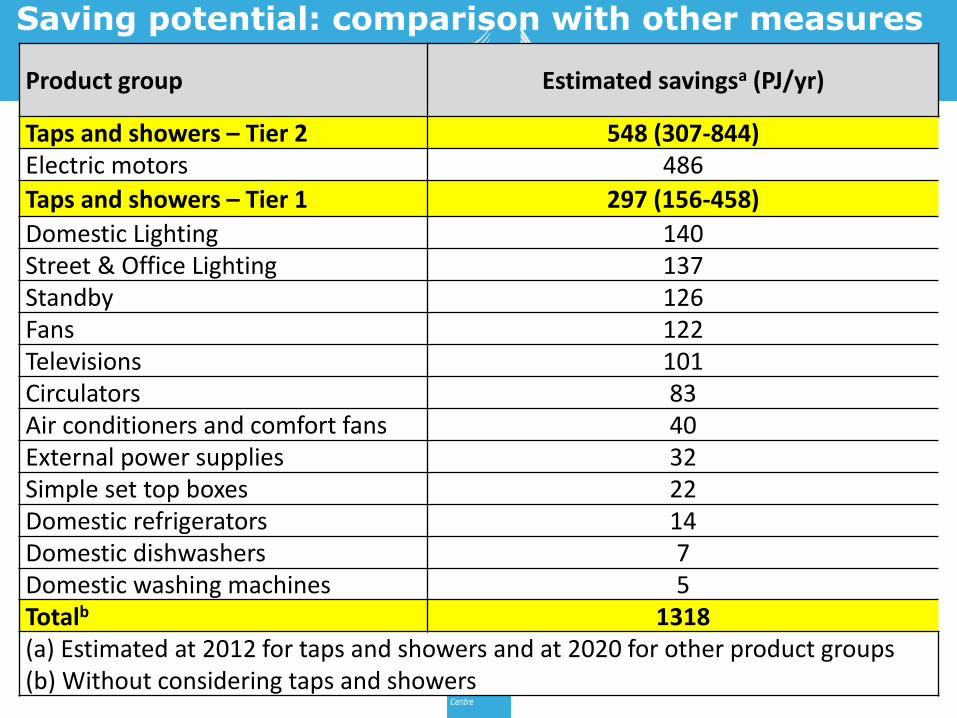
Total EU28 energy saving from taps and showers:
• 548.2 PJ/year in Tier 2 (297.1 PJ/year in Tier 1)
• 92% domestic sector, 8% non-domestic
• 17% of the total energy demand for taps and showers
• Variation range: from 56% to 154%
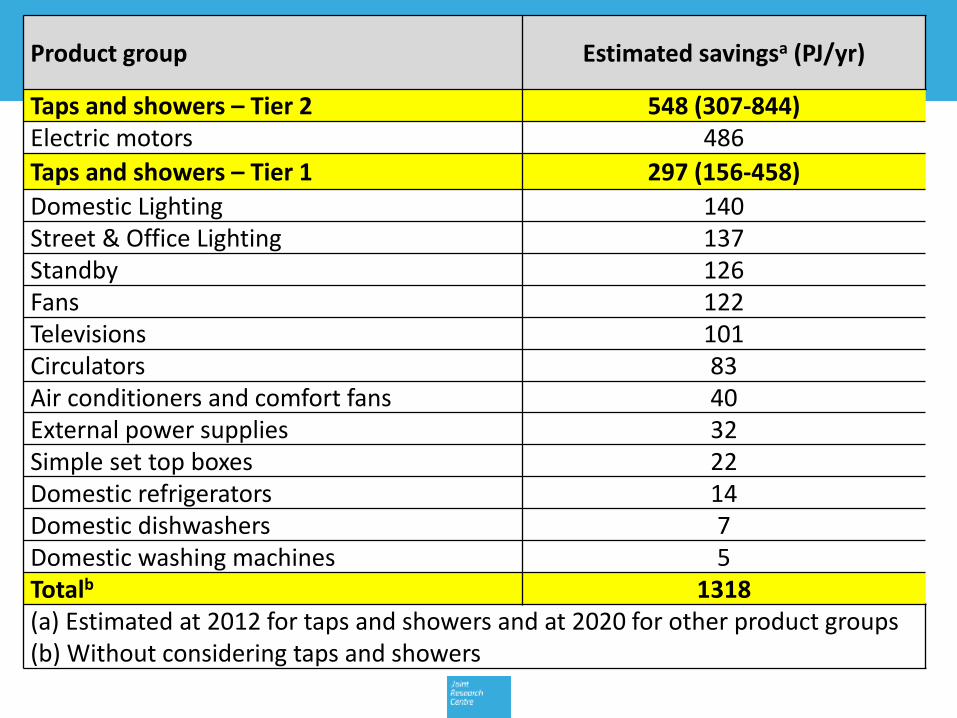
Product group Estimated savingsa (PJ/yr)
Taps and showers – Tier 2 548 (307-844) Electric motors 486
Taps and showers – Tier 1 297 (156-458)
Domestic Lighting 140
Street & Office Lighting 137
Standby 126
Fans 122
Televisions 101
Circulators 83
Air conditioners and comfort fans 40
External power supplies 32
Simple set top boxes 22
Domestic refrigerators 14
Domestic dishwashers 7
Domestic washing machines 5
Totalb 1318
(a) Estimated at 2012 for taps and showers and at 2020 for other product groups
(b) Without considering taps and showers
Impact on wastewater collection and treatment infrastructures
1. UK Environmental Agency.
2. Plumbing Efficiency Research Coalition
3. Monteiro et al.
Preliminary outcomes:
• Wastewater management network not affected by reduced consumption of water in taps and showers
• Any negative effects possibly associated to toilet flushing and disposal of toilet paper and other materials in toilets
• Possible to control effects through technical actions on toilets and management of sewage system.
Discussion Areas
1. Assumptions for water/energy use calculation
2. Information on user behaviour
3. Assumptions for water/energy saving calculation (current and forecasts)
4. Information on impact on wastewater infrastructures
Supporting information for Task 3
Water availability
FAO's Aquastat database
FAO, EEA, Ecologic project:
• 44-59%: Industry and energy
• 20-32%: Agricultural
• 17-25%: Urban
Combined Drought Index Water Exploitation Index
Importance of water all across the EU!
Saving potential = f(technology; user behaviour)
Technology effect:
• Switch from bathing to showering: -46%
• Taps: -40% / +30%
• Showers: -34% (85% of -40%) / +30%
Higher considering the influence of user behaviour
• Washbasin Taps: -82% / +485%
• Other taps: -73% / +73%
• Showers: -69% / +109%
• Bathing: -20% / +80%
Table of Contents
1. Scope 2. Market analysis 3. Users and system aspects 4. Analysis of technologies 5. Preliminary environmental assessment 6. Synthesis and potential results 7. Next steps
TASK 4: ANALYSIS OF TECHNOLOGIES
• Conventional and water/energy saving technologies
• Market segmentation
• Production, use, end-of-life
Information on conventional products
• Variety of designs, materials and functionality for taps and showers
• Taps designed for the pressure system they are to be used with
• Innovations in technology for taps and showers are on average introduced every 2-10 years and stay on the market for 10-40 years
• Increasing number of water/energy-efficient taps and showers
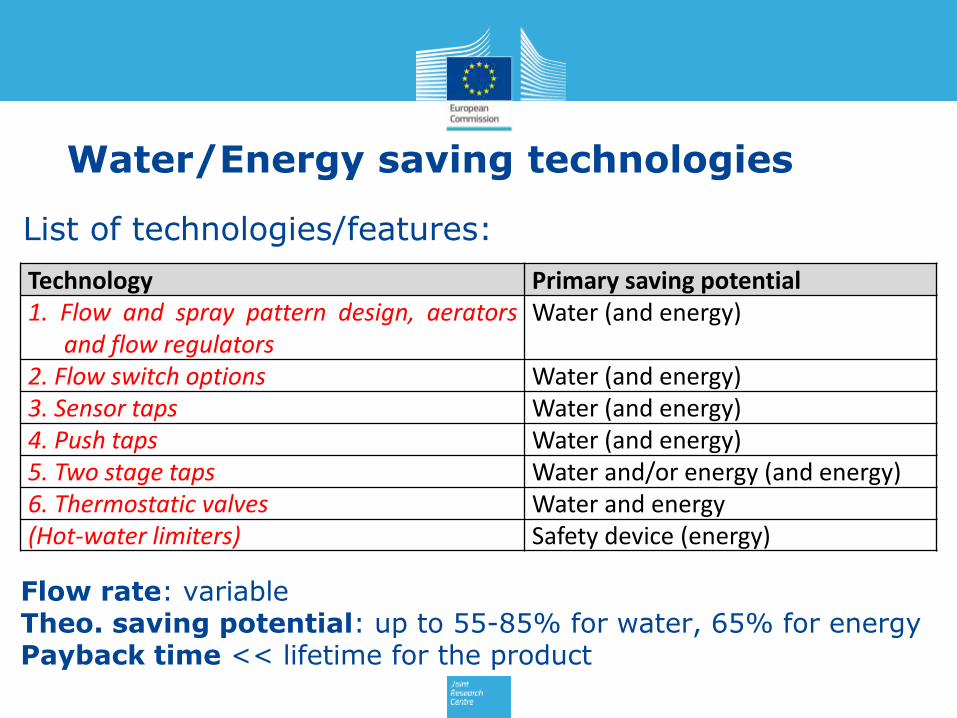
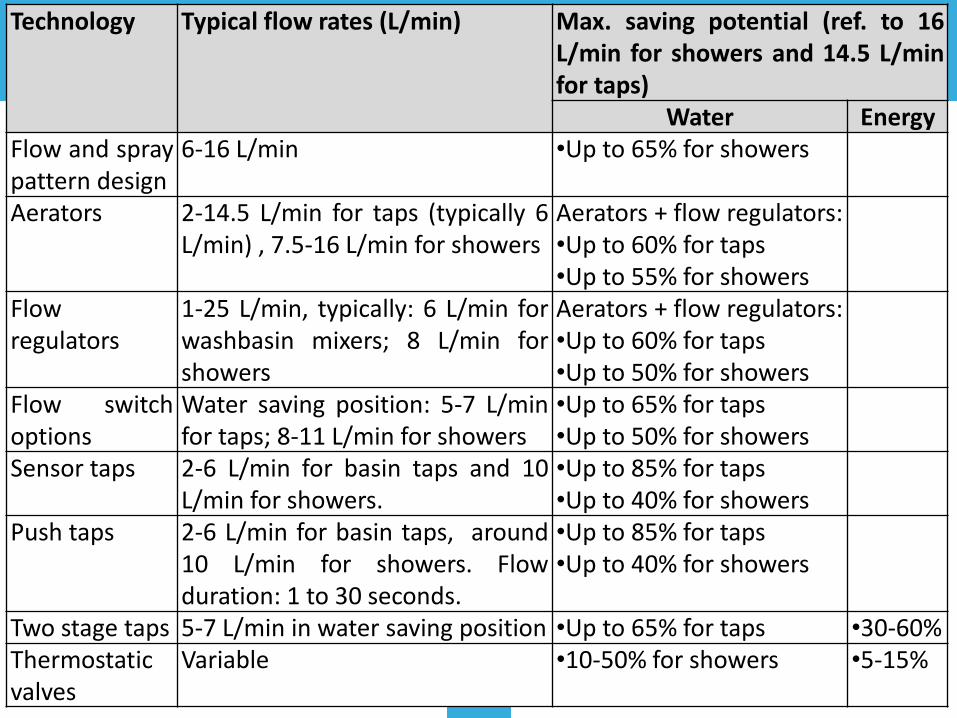
Water/Energy saving technologies
List of technologies/features:
Flow rate: variable Theo. saving potential: up to 55-85% for water, 65% for energy Payback time << lifetime for the product
2. Flow switch options Water (and energy) 3. Sensor taps Water (and energy) 4. Push taps Water (and energy) 5. Two stage taps Water and/or energy (and energy) 6. Thermostatic valves Water and energy
• Number of products registered in the Water Label scheme (updated at Sep 2013)
• Different levels of performance on the market
Technology penetration in terms of water flow rate
90 31 October 2013
Stakeholders feedback
Water flow in L/min
Kitchen taps (%) Bathroom Taps (%) Showers (%)
Max 4 L/min 10% in Portugal (trend to 60%)
Max 6 L/min 10% in Portugal (trend to 50%)
29.5% in one global retailer
Max 7.2 L/min 10% in Portugal (trend to 60%)
Max 8 L/min 99.5% in one global retailer
Max 13 L/min 100% in one global retailer
Lowest flow rate technically feasible (L/min)
2 L/min at 3 bar Below 2 L/min functionality of non-domestic basin taps could be undermined.
4.5 L/min at 3 bar. Below 6 L/min, functionality of showers could be undermined.
Highest flow rate known (L/min)
110 L/min in pot or kettle filling taps
30 L/min at 3 bar > 30 L/min at 3 bar
Expected trends and innovations: • Product size reduction and increased importance of water and
energy savings technologies
• Increase importance of wellness together with water saving.
• Increase penetration of automatic valves in private households and extending the battery life up to 10 years
• Increase penetration of electronics;
• Increase penetration of thermostatic valves;
• Integration of a flow switch element in the aerator and improved system for cleaning and change;
• Selection of materials that ensure the respect of hygiene quality standards.
Production - Materials
• 90-99% of the taps mostly made of brass, with chrome plating as metal finishing. Unlikely to change in the short to medium term.
• Other materials play a more important role in Germany (5% of taps based on stainless steel) and the UK (4% of taps based on stainless steel; 1% on plastic and 5% on other materials (e.g. Zinc-Al alloys)).
• Shower valves mostly based on brass (70% in the UK and 90% in France) but high relevance of plastics (25% in the UK and 10% in France).
• Plastics used considerably more in showerheads and hand showers (70% of the end product in the UK and 89% in France).
• Other materials: brass (20% in the UK and 10% in France), stainless steel (4% in the UK and 1% in France).
• Scenarios for the coming year should not change significantly, although the use of plastic could increase in the future.
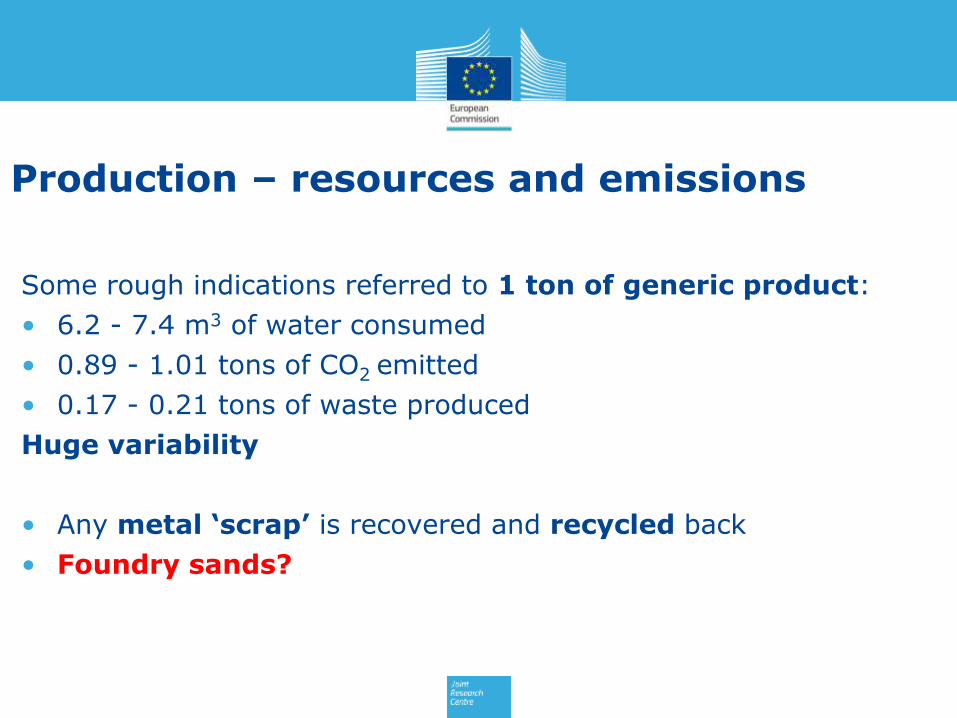
Production – resources and emissions
Some rough indications referred to 1 ton of generic product:
• 6.2 - 7.4 m3 of water consumed
• 0.89 - 1.01 tons of CO2 emitted
• 0.17 - 0.21 tons of waste produced
Huge variability
• Any metal ‘scrap’ is recovered and recycled back
• Foundry sands?
Production – Plastic materials
Broad use of technical plastics:
• Spray gun bodies: POM or Grivory
• Aerators: POM,
• Rings: POM and PA6,
• Cartridges: PSU, POM and PA6
• Thermostatic cartridges: PSU, PEI, PPA;
• Parts under extreme conditions of pressure and temperature or requiring special accuracy during manufacture: PPA, PPO, PSU, PEI, ABS
• Wet parts, not pressurized: POM, PP
• Hoses for mixers: inner tube of PEX (with braid of nylon or stainless steel and brass sleeves).
• Hoses for showers: PVC
• Showerheads and hand shower: housing (90%) made of ABS and internal elements made of POM, PPO or PS and others.
• Other parts : PA, ABS, POM
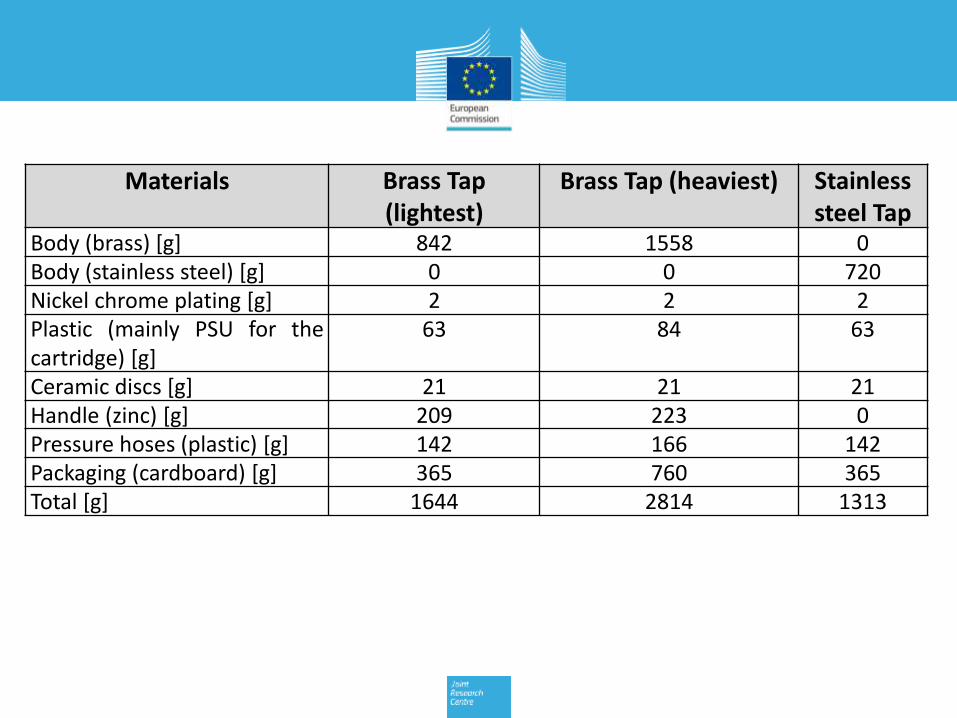
Bill-of-Materials of example products
• Average data on material composition and weight of taps and showerheads was provided by manufacturers.
• Selected examples of products for domestic and/or non-domestic applications.
• Taps: “light” and “heavy” brass taps and “light” stainless steel tap
• Shower systems:
- A “light” shower mixer with a showerhead
- A “heavy” wall mounted shower mixer with a showerhead
- A “heavy” shower mixer with a shower plate
- A shower pipe
Materials Brass Tap (lightest)
Brass Tap (heaviest) Stainless steel Tap
Body (brass) [g] 842 1558 0
Body (stainless steel) [g] 0 0 720
Nickel chrome plating [g] 2 2 2
Plastic (mainly PSU for the cartridge) [g]
63 84 63
Ceramic discs [g] 21 21 21
Handle (zinc) [g] 209 223 0
Pressure hoses (plastic) [g] 142 166 142
Packaging (cardboard) [g] 365 760 365
Total [g] 1644 2814 1313
Material Shower mixer + showerhead (lightest)
Wall mounted shower mixer + showerhead (heaviest)
Shower mixer + shower plate (heaviest )
Shower pipe
Body (brass) [g] 1653 4200 2800 5101
Waste fitting (brass) [g] 0 0 0 0
Plastic (mainly PSU for the cartridge) [g]
86 642 428 957
Ceramic discs [g] 21 63 42 15
Handle (zinc) [g] 223 707 484 416
Pressure hoses (plastic) [g]
0 0 0 0
Packaging (cardboard) [g] 437 1049 699 1191
Brass outlet [g] 0 0 1902 0
Plastic outlet [g] 163 163 393 0
Nickel chrome plating [g] 2 2 2 2
Packaging outlet [g] 92 92 650 0
Total [g] 2677 6918 7400 7683
Product distribution
• Packaging: few 100 grams - more than 1 kg
• Materials used: cardboard, paper and plastic/cloth bags.
• Cardboard: recycled for fitments, higher quality and printed for end products.
• LD-PE/cloth bags for components
• Average dimensions:
- Length 30-80 cm
- Width 18-26 cm
- Height 6-13 cm
- Volume: 4.6-16.0 L
• Mainly road transportation (2-5 days from the factory to the place of installation)
Installation, use and maintenance
• Installation and maintenance varies for all products
(compliance with manufacturer’s requirements)
• Durability can be reduced significantly by bad installation or maintenance.
• Importance of product cleaning and lime removal
• Very few replacements of parts. Some producers provide spare parts for repairing
• Depending on the quality of water, aerators could be replaced periodically, even by the user.
• For other parts (e.g. seals, valves, diverters, cartridges), intervention of the plumber
Product Real life time (years) Technical life time, as declared by manufacturer (years)
Taps, domestic
16 (10-40) in France 25 (15-50) in France
3-10 (3-50) in the UK Variable among manufacturers in the UK
Taps, non-domestic
12 (5-20) in France 25 (10-50) in France
5-10 (5-20) in the UK Variable among manufacturers in the UK
Showers, domestic
10 (5-15) in France 15 (2-25) in France
2-10 (2-30) in the UK Variable among manufacturers in the UK
Showers, non-domestic
7 (5-15) in France 15 (5-25) in France
5-10 (5-15) in the UK Variable among manufacturers in the UK


![[PPT]No Slide Title - Wikispacesptec107.wikispaces.com/file/view/Flow_Measurement.ppt · Web viewFlange Taps Corner Taps Radius Taps Vena-Contracta Taps Pipe Taps Multivariable Pressure](https://static.documents.pub/doc/80x56/5ad6f9207f8b9a32618bb97e/pptno-slide-title-viewflange-taps-corner-taps-radius-taps-vena-contracta-taps.jpg)


