53
| Date post: | 16-Dec-2015 |
| Category: |
Documents |
| Upload: | dorothy-bryant |
| View: | 216 times |
| Download: | 0 times |
Meeting Agenda
Announcements Market Discussions Lecture: Valuation Methods Portfolio Update Pitch: AIG Important Dates


Announcements
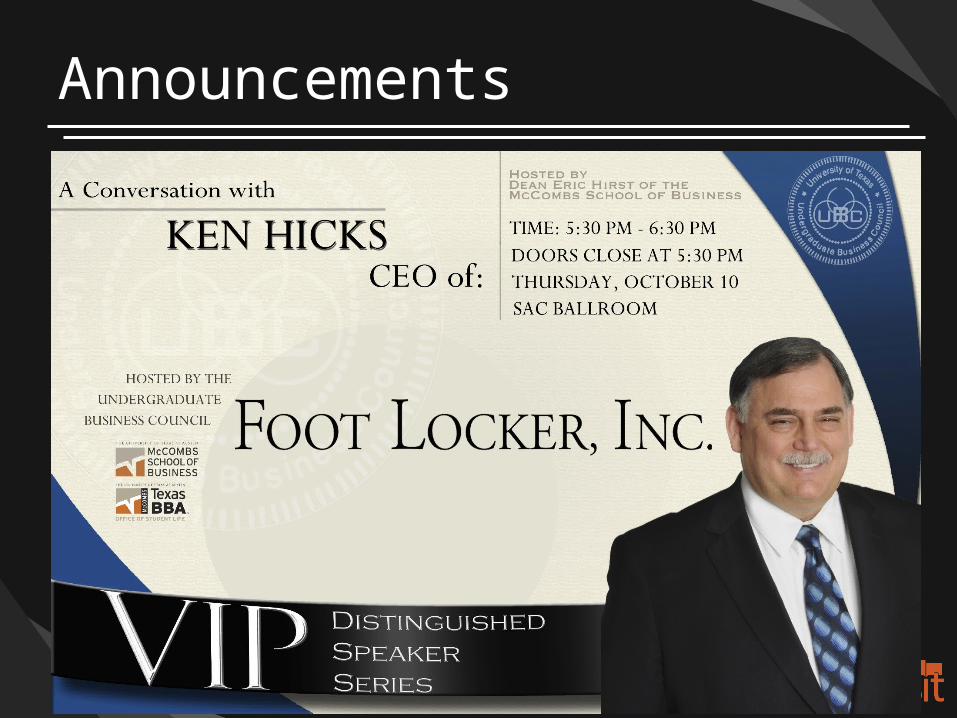
Announcements

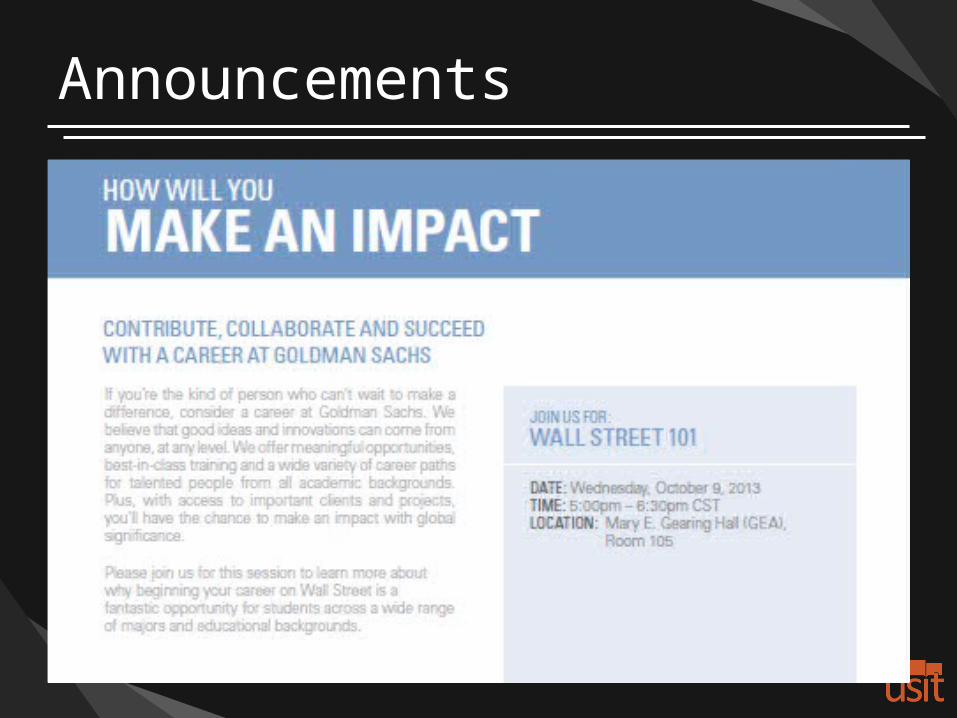
Announcements

Announcements

Announcements
Announcements
Free Wall Street Journal digital access for paid members
Contact [email protected] to receive login information

Announcements
•Build and manage your own virtual portfolio• Compete with other McCombs students
• Top three winners receive prizes in January
Register at usiteam.org/even
ts
Fall Portfolio Challenge
$5entry fee
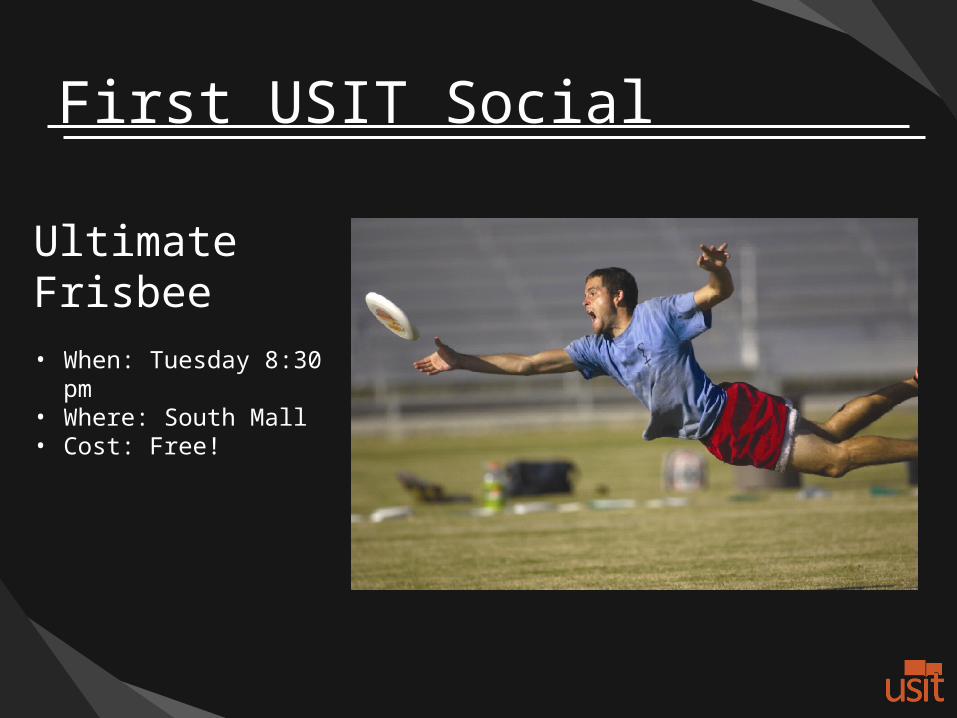
First USIT Social
Ultimate Frisbee
• When: Tuesday 8:30 pm• Where: South Mall• Cost: Free!

Announcements
The Suggestion Box

Announcements
WorkshopsEvery Thursday 7-8PMSAC2.120
Topic this week:• Projecting
Operating Results
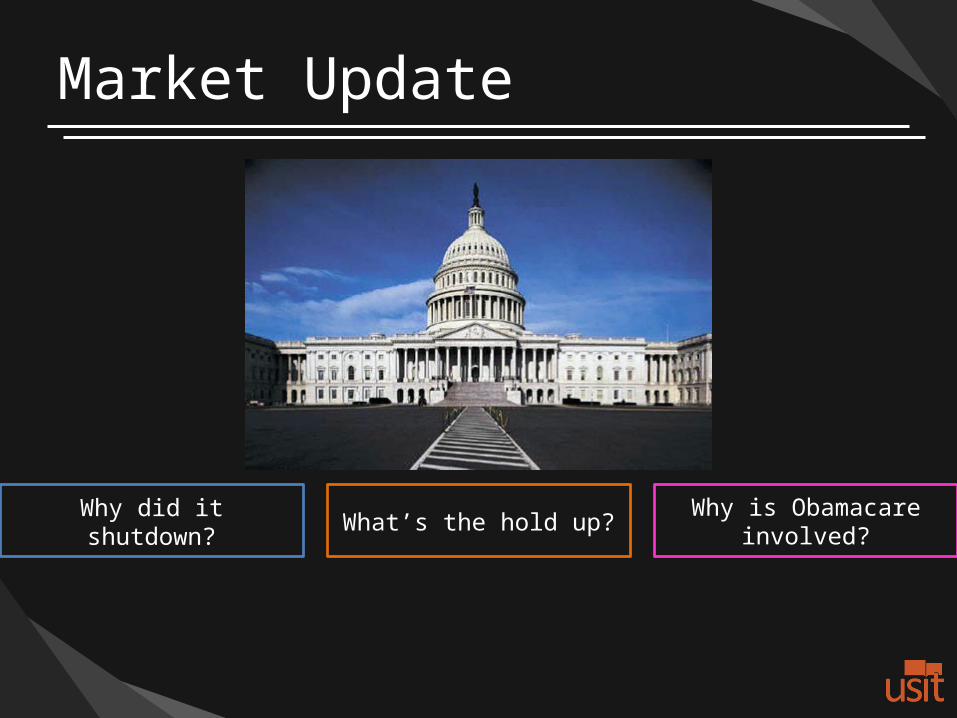
Market Update
Why did it shutdown?Why is Obamacare
involved?What’s the hold up?

What happened to the debt ceiling?

Market Update
Market Update
Market Update
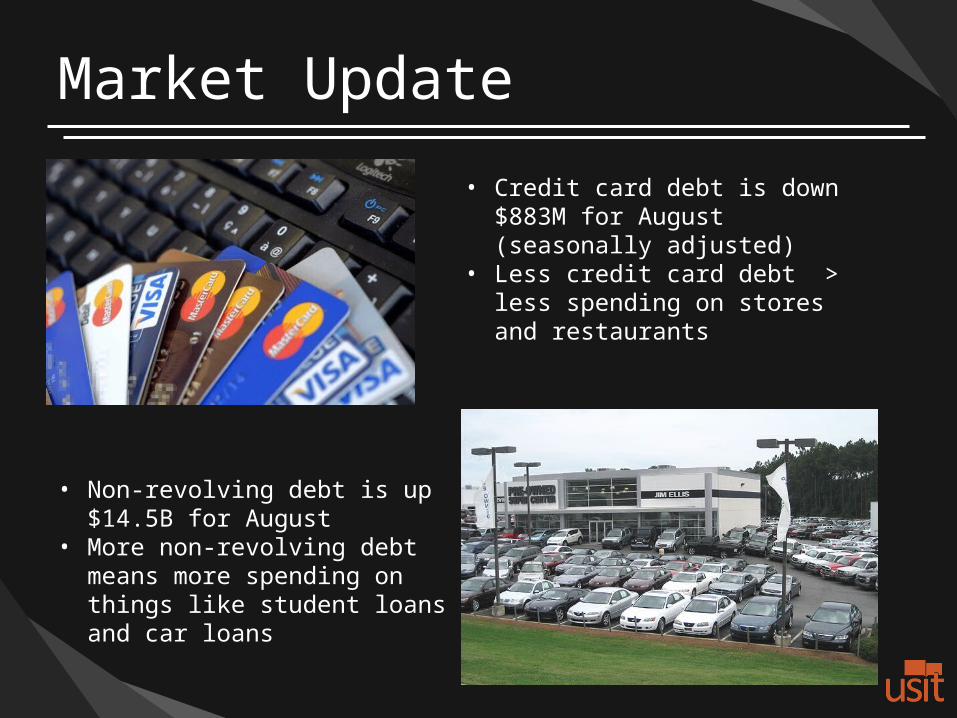
• Credit card debt is down $883M for August (seasonally adjusted)
• Less credit card debt > less spending on stores and restaurants
• Non-revolving debt is up $14.5B for August
• More non-revolving debt means more spending on things like student loans and car loans
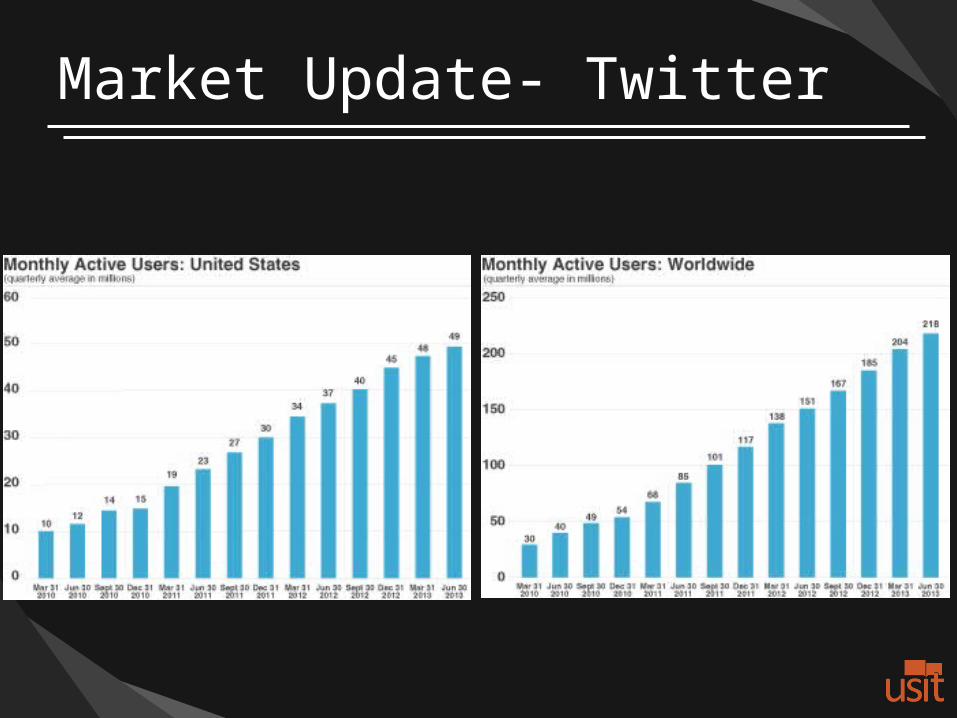
Market Update- Twitter

Market Update- Twitter
$2.16 per timeline view $.30 per timeline view
Other Key Stats:• 65% revenue from mobile• 2011-2012 Revenue growth of 198%• EBITDA growth of 149%• Net loss decreased 36%

Market Update- Tweeter
Company Valuation
Andrew Smith

Two primary ways
Relative
Public company comparables
Precedent transaction
Intrinsic
DCF
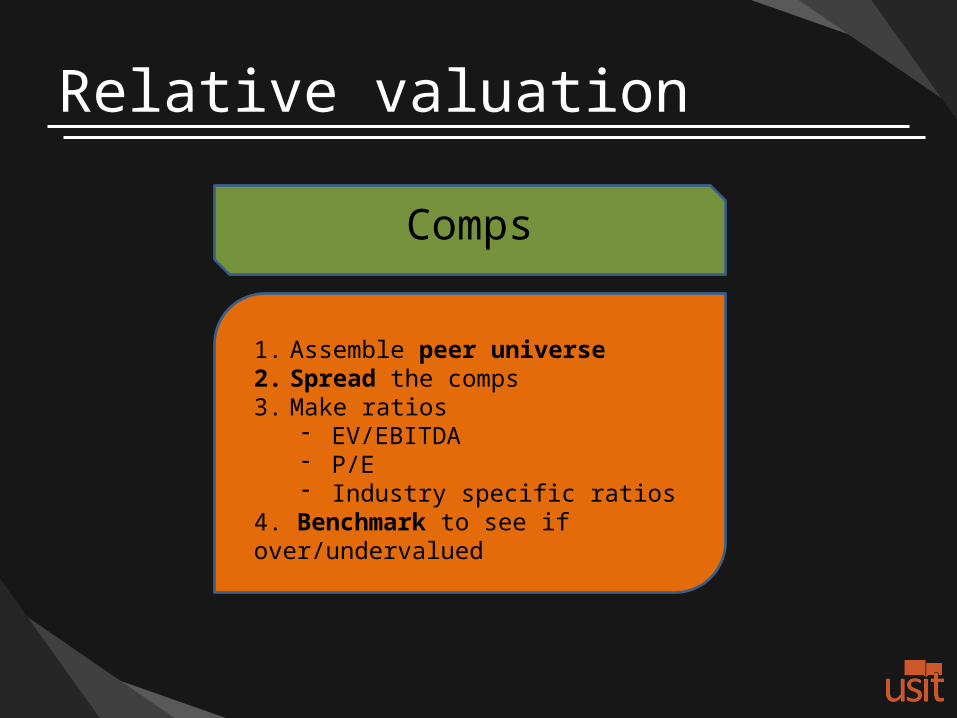
Comps
1. Assemble peer universe2. Spread the comps3. Make ratios
- EV/EBITDA- P/E- Industry specific ratios
4. Benchmark to see if over/undervalued
Relative valuation
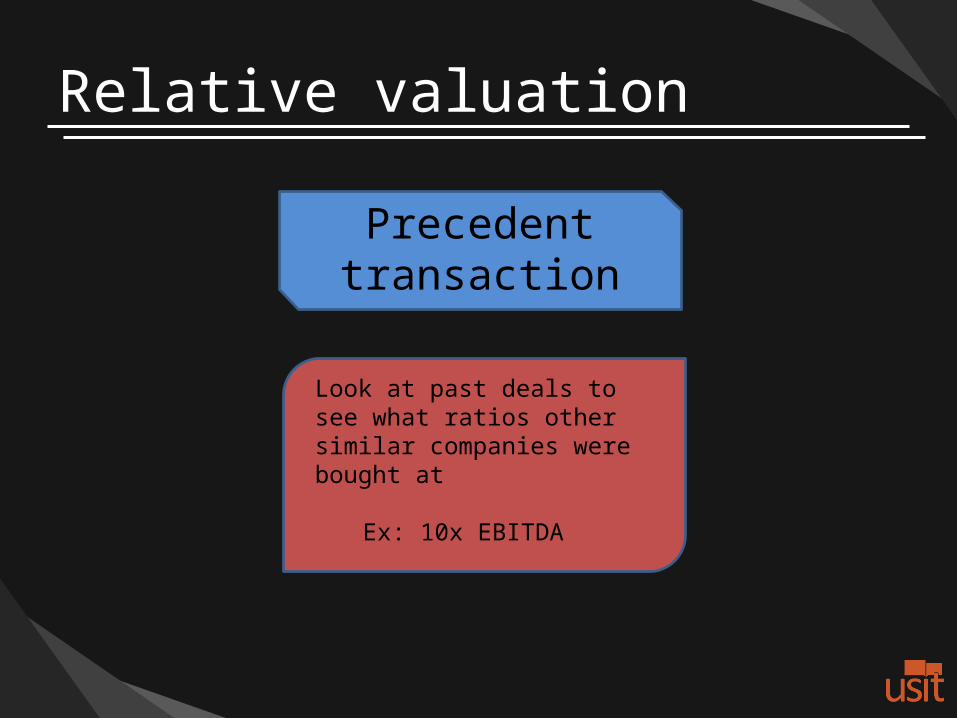
Precedent transaction
Look at past deals to see what ratios other similar companies were bought at
Ex: 10x EBITDA
Relative valuation

Problem?
Pros
• Market driven comparison and not subject to assumptions like DCF
Cons
• Market driven so the market environment in which you’re taking comps has direct effect on your result

Problem?
Pros
• Market driven comparison and not subject to assumptions like DCF
Cons
• Market driven so the market environment in which you’re taking comps has direct effect on your result
Fixed by using intrinsic valuation

Intrinsic valuation - DCF

Intrinsic valuation - DCF
The value of a company is the
present value of its future cash flows.
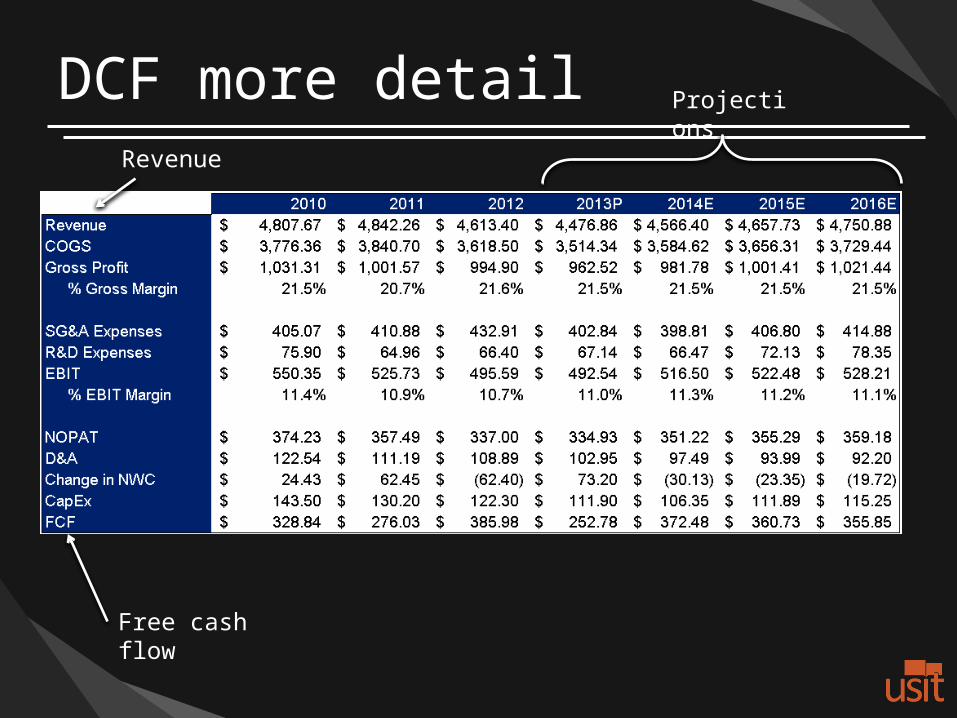
DCF more detailRevenue
Free cash flow
Projections

DCF more detail
Discount rate
To estimate cash flows after 2016

DCF more detail
EV/fully diluted shares outstanding
=Value per share

Portfolio UpdateHistorical Performance
Invested Capital Cash Exposure AUM Weekly Portfolio Return Cumulative Return Since 8/30/13 Exp-Adj Weekly Return Exp-Adj Cum. Return8/30/2013 $4,396.8 $9,716.0 31.2% $14,112.8 - 0.0% 0.0%9/6/2013 $7,739.3 $6,556.9 54.1% $14,296.2 1.3% 1.3% 2.40% 2.4%9/13/2013 $4,328.6 $9,922.9 30.4% $14,251.5 (0.3%) 1.0% (1.03%) 1.3%9/20/2013 $4,381.9 $9,922.9 30.6% $14,304.8 0.4% 1.4% 1.22% 2.6%9/27/2013 $5,911.2 $8,226.2 41.8% $14,137.4 (1.17%) 0.17% (2.80%) (0.3%)10/4/2013 $5,847.4 $8,226.2 41.5% $14,073.6 (0.45%) (0.28%) (1.09%) (1.4%)
Ticker Shares Cost Per Share Total Cost Basis Purchase Date PX_LAST Total Market Value Gain/Loss Gain/Loss % SectorAAPL US Equity 3 $486.11 $1,458.32 8/13/2013 $483.03 $1,449.09 ($9.23) -0.6% Information TechnologyADNC US Equity 50 $10.51 $525.50 8/13/2013 $11.05 $552.50 $27.00 5.1% Information TechnologyCBRX US Equity 125 $6.82 $852.13 8/14/2013 $7.14 $892.50 $40.38 4.7% Health CareENZN US Equity 200 $1.96 $391.00 8/13/2013 $1.68 $336.00 ($55.00) -14.1% Health CareIDT US Equity 55 $17.91 $984.85 8/14/2013 $19.10 $1,050.50 $65.65 6.7% Telecommunication ServicesSWKH US Equity 400 $1.13 $450.00 8/13/2013 $1.13 $452.00 $2.00 0.4% FinancialsU CN Equity 125 $4.64 $579.68 8/28/2013 $4.61 $576.79 ($2.88) -0.5% Basic MaterialsAGX US Equity 25 $21.67 $541.75 9/26/2013 $21.52 $538.00 ($3.75) -0.7% Industrials

Portfolio UpdateSector Exposures Dollar Amount % AllocationInformation Technology $2,001.59 34%Energy $0.00 0%Consumer Services $0.00 0%Consumer Goods $0.00 0%Financials $452.00 8%Industrials $538.00 9%Health Care $1,228.50 21%Utilities $0.00 0%Telecommunication Services $1,050.50 18%Basic Materials $576.79 10%
Sector Exposures + CashInformation Technology $2,001.6 14%Energy $0.0 0%Consumer Services $0.0 0%Consumer Goods $0.0 0%Financials $452.0 3%Industrials $538.0 4%Health Care $1,228.5 9%Utilities $0.0 0%Telecommunication Services $1,050.5 7%Basic Materials $576.8 4%Cash $8,226.2 58%
14% 0%
0%
0%
3%
4%
9%
0%
7%
4%
58%
Information Technology
Energy
Consumer Services
Consumer Goods
Financials
Industrials
Health Care
Utilities
Telecommunication Services
Basic Materials
Cash

Fanyu MengNiraj Parekh
Matthew RindelaubConnor Ruddick
Nic TachaJeffrey Toobi

INVESTMENT THESIS
Undervalued/Oversold
Well-Established Presence
Rising Interest Rates
Improving Housing Market

COMPANY OVERVIEW

American International Group, Inc.

Revenues & Growth Premiums, fees, investments Interest rates & reinsurance Housing Market

INDUSTRY OVERVIEW

Rivalry within
Industry
Threat of New
Entrants
Bargaining Power of Buyers
Threat of Substitute
s
Bargaining Power of Suppliers
Porter’s Five Forces

Insurance services for:◦ Commercial◦ Institutional◦ Independent
Primary Services:◦ Property Casualty◦ Life and Retirement◦ Investment and Banking Services◦ Reinsurance
The Insurance Industry

•Commercial• Largest in the US and Canada
•Focused on Property Casualty• Largest in the US• Largest US based in Europe• Largest foreign insurer in Japan
& China•1st to market in many developing nations
Primary Competitors

RISKS AND MITIGANTS

• Regularly outperforming industry• Strong industry dominance in key sectorsCompetition
• US monetary policy future is bright• Current rising ratesChanging
Interest Rates
• Conducts enterprise-wide stress tests under a range of different scenarios
• Restructuring away from risky investments
Volatile Market
Risks and Mitigants

FINANCIAL VALUATION

Comparables Analysis
AEG DB:ALVENXTPA:CS BRK.A CB SWX:ZURN AIG0.0
0.5
1.0
1.5
2.0
2.5
P/B
AEG DB:ALVENXTPA:CS BRK.A CB SWX:ZURN AIG0
2
4
6
8
10
12
14
16
18
P/E
AEG
DB:ALV
ENXTP
A:CS
BRK.A CB
SWX:Z
URNAIG
0.0%
2.0%
4.0%
6.0%
8.0%
10.0%
12.0%
14.0%
16.0%
18.0%
ROE
AEG
DB:ALV
ENXTP
A:CS
BRK.A CB
SWX:Z
URNAIG
0.02.04.06.08.0
10.012.014.016.0
Leverage Ratio (Assets/Equity)

Book Valuation
P/B Implied Price Discount
AIG Multiple $ 78.10 64%
Current Share Price $47.70
2012 2013 2014 2015 20160%
2%
4%
6%
8%
10%
12%
ROE
2012 2013 2014 2015 20160
20000
40000
60000
80000
100000
120000
140000
160000
Book Value

CONCLUSION

Pitch Team Sign-Ups
www.usiteam.org/membership

Important Dates
• Thursday, October 10, 6-8PM- SCG Workshop #3
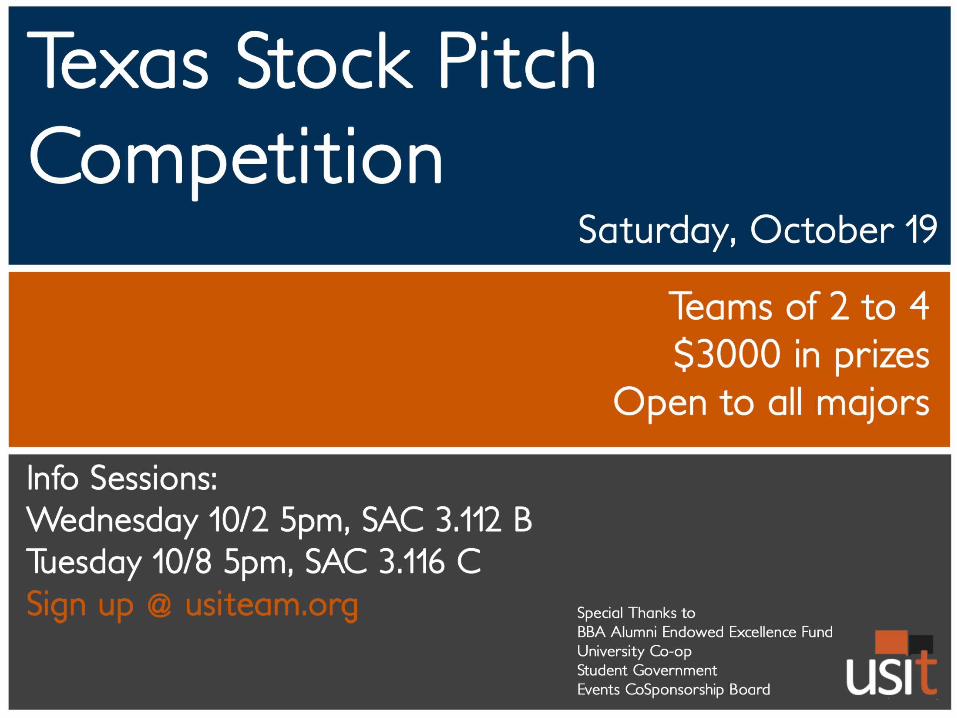
• Saturday, October 12: Last day to register for TXSPwww.usiteam.org/events
• Saturday, October 19: Texas Stock Pitch Competition


