Jonathan S. Gagliardi, NASH Deputy Director Jane Wellman, Project Consultant February, 2015 Assessing and Improving the Institutional Research Function in Public University Systems MEETING DEMANDS FOR IMPROVEMENTS IN PUBLIC SYSTEM INSTITUTIONAL RESEARCH
Transcript
Jonathan S. Gagliardi, NASH Deputy Director Jane Wellman, Project Consultant February, 2015
Assessing and Improving the Institutional
Research Function in Public University Systems
MEETING DEMANDS FOR
IMPROVEMENTS IN PUBLIC
SYSTEM INSTITUTIONAL
RESEARCH
This material is based on research funded by the Bill & Melinda Gates Foundation. The findings and conclusions contained within are those of the authors and do not necessarily reflect positions or policies of the Bill and Melinda Gates Foundation.
This report summarizes the findings from a two-year project undertaken by the National
Association of System Heads (NASH) to address opportunities to strengthen
institutional research (IR) among public systems, and colleges and universities in the
United States. The first year concentrated on an assessment of the general capacity of
system and campus IR functions. During the second year, NASH has designed a toolkit
for public systems, and colleges and universities, for the purpose of assessing the state
of their IR function relative to the changing landscape. This final report reflects the
findings of both years of this work, and is designed to provide both the context, and a
tool that system and IR leaders can use to align their functions with current and future
challenges.
Summary of findings
Higher education is going through a period of rapid change, faced with an imperative to
increase student access and success without diluting quality and in the face of real
financial constraints. Institutional leaders need to meet unprecedented public demand
for information while also doing more with data to improve performance within their
institutions. Most also face considerable pressure to overhaul basic business functions,
to reduce costs and to put investments into places that enhance student success. They
want information that often goes past traditional measures of activity, like enrollments
and credit hour production, to better understand the conditions that produce student
success, including the connection between resource use and student outcomes.
Information demands do not stop at the college door; college leaders need to know
more about their students beginning with their K-12 preparation, as well as how they
fare in the workforce. This calls for more frequent and fluid connection of student
information between campuses, the system office, and myriad external agencies.
Deeper and broader information and analysis, and more compelling narratives are
needed to satisfy the growing appetite for knowledge among internal and external
stakeholders. To that end, NASH has undertaken a two-year study to better understand
the opportunities and challenges facing institutional research (IR). As part of this study,
NASH conducted a nationwide survey of IR officers in 2013. NASH also interviewed IR
personnel and users, and visited with volunteer systems in an effort to further map the
ability of IR to respond to growing demands.
Against this backdrop of demand for IR, the picture that emerges from this study is of a
field that is at best unevenly positioned to support change. IR offices are running hard
and yet many are still falling behind, deluged by demands for data collection and report
writing that blot out time and attention for deeper research, analysis and
communication. Many do not have the information they need to get at the performance
questions of most interest to them, their boards or public officials, either because it
doesn’t exist or because it’s not collected in a way that admits of analysis. The analytic
functions in most systems and campuses remain topically stove-piped, with the named
"IR" office focused primarily on student and student related research, with reporting
and any research in other topical areas (resource use, efficiency and effectiveness,
and personnel) handled by the budget and human relations offices. The overall ability
of IR offices to use data to look at issues affecting many of the cross-cutting issues of
the day—such as the connections between resource use and student success—is
nascent at best.
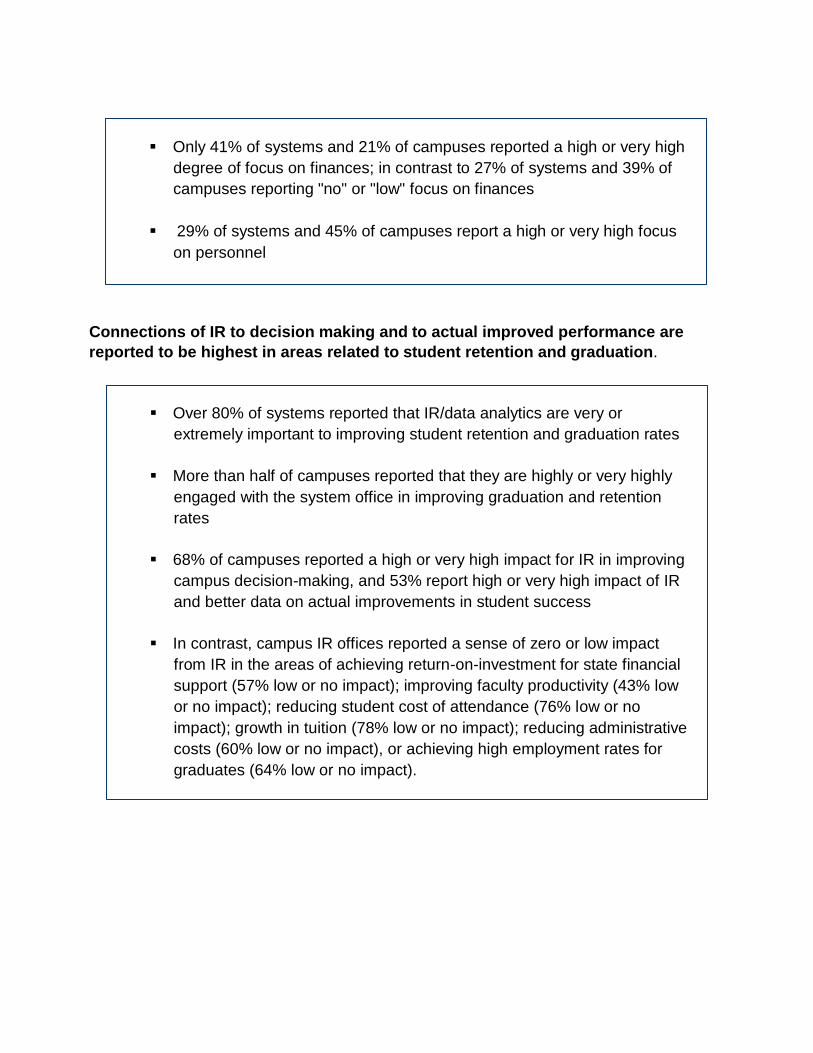
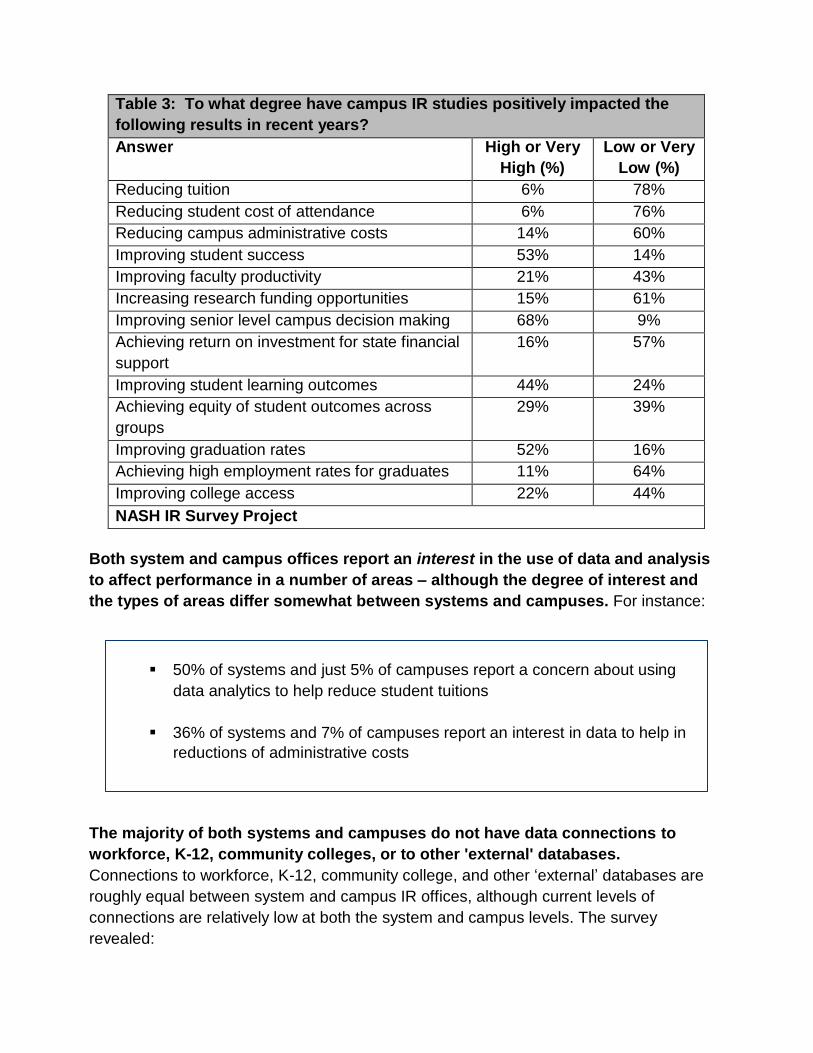
There are some success stories, despite the unevenness of IR. In the area of student
retention and graduation, both system and campus IR offices report improvements in
analytics and in use of data by decision makers which in turn are contributing to
improvements in student success. More can be done, but there's no question that the
field has evolved to a much higher level of performance than in previous eras. This has
come about because leaders at all levels have demanded such data, and the field has
responded. That success story does not extend to other major performance issues
facing higher education, such as resource use, cost and tuition control, and meeting
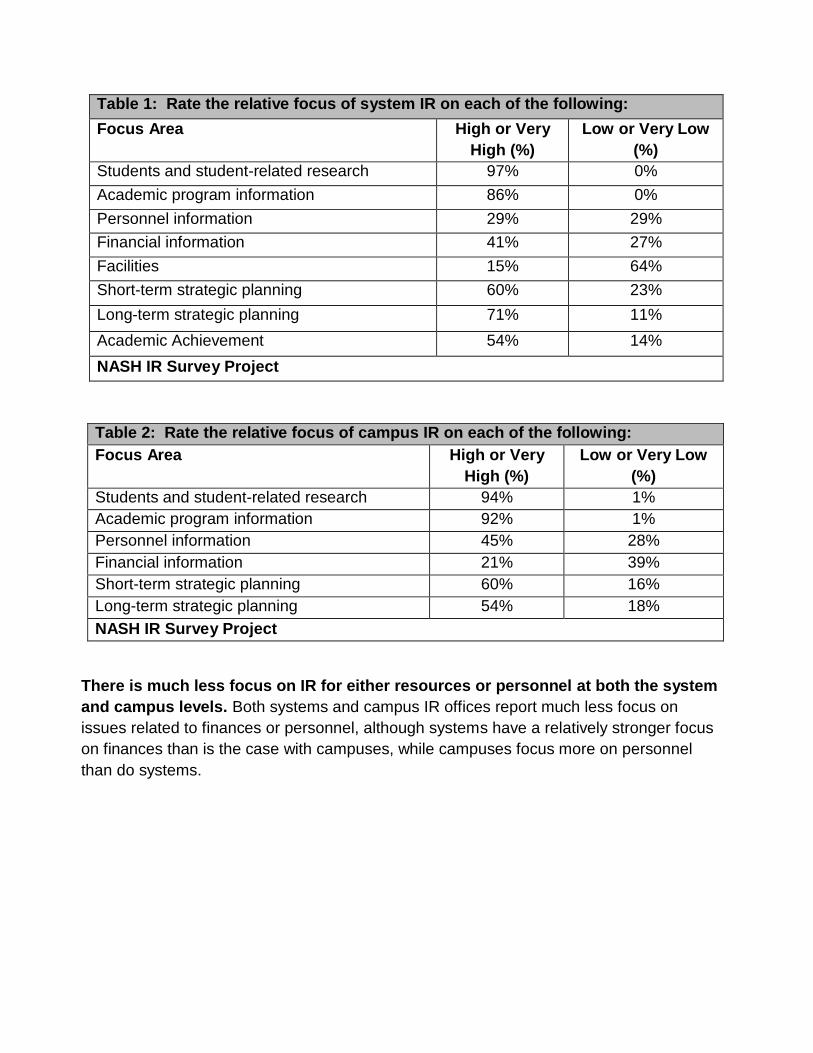
workforce needs. These topical areas are quite simply not a major focus for either
system or campus IR offices in most universities. While most system offices see these
as areas of emerging priorities for future research, that view is not held by the majority
of campus IR offices.
The surveys also show frequent disconnections between system and campus IR
offices, caused by different IT systems and data definitions, even inside a single
campus as well as within systems. This limits capacity for either system or campus
decision makers to compare performance across campuses or systems, to understand
the reasons for differences and to use data to drive improvements. While gaps exist in
data governance and infrastructure among systems and their campuses, there is also
a redundancy in reporting between system and campus, perhaps necessitated by
different audiences for the different levels of work. This contributes to confusion about
basic measures and metrics, and also gets in the way of potential efforts for greater
sharing of work between campuses and systems in order to free up staff to do other
things. While some systems are ahead of others in this respect, it is clear that many
stand to benefit from a more intentional differentiation of focus between the system and
the campus.
Interviews with IR office heads and with institutional leaders and other users of IR
confirmed the basic accuracy of the survey findings. They see the demand for work
increasing exponentially, against a field that is not well positioned to meet the needs of
the future. Institutional leaders see weaknesses in IR inhibiting their ability to address
basic and legitimate questions about performance in higher education being asked of
them by their boards, legislatures, and consumers. They welcome the opportunity to
improve the function, through the identification and promotion of emerging practices
within the field and to more attention to professional development for IR professionals.
Institutional leaders and other users of IR share a desire to widen the lens to bring in
perspectives from outside of IR, to think about a potential redesign of analytic capacity,
and to better meet the needs of the future. Among institutional leaders and those in
public policy positions, we heard a sense of urgency about this topic, some of whom
characterized it as being among the most vexing issues facing public institutions. They
also see it as an area where systematic attention and willingness to take bold steps will
yield big payoffs.
Much about the state of the IR function at both systems and campuses was revealed
as a result of the survey conducted during the first-year. This laid the foundation for a
more in-depth investigation of the opportunities and challenges faced by system and
institutional IR functions during the second-year of this study. The year began with
the creation of a team of experts composed by leaders from IR, and information
technology (IT), and was further strengthened by experts from the health-care field
who have faced and overcome challenges that are similar to what are faced by
higher education today.
The team of experts began in earnest with the goal of designing a tool-kit that could be
used by system and institutional leaders to evaluate the current capacity of IR
functions to satisfy the increasingly diverse and complex challenges faced by systems
and institutions today. In addition to the year-one findings, two premises about the
direction of the field, and the cultural and political dynamics within systems that either
impede or empower robust decision analytics were driving the current state of IR.
These are:
1. The IR function is evolving, from data collection and compliance reporting, to
also encompass systems and institutional learning and improvement. Well-
developed IR functions blend sophisticated data retrieval and good use of
metrics with strong analysis and communication.
2. Robust decision analytics require decision makers that empower the work, by
using data to set goals and evaluate performance, and by creating a culture of
openness to inquiry and willingness to use data to document and improve
performance.
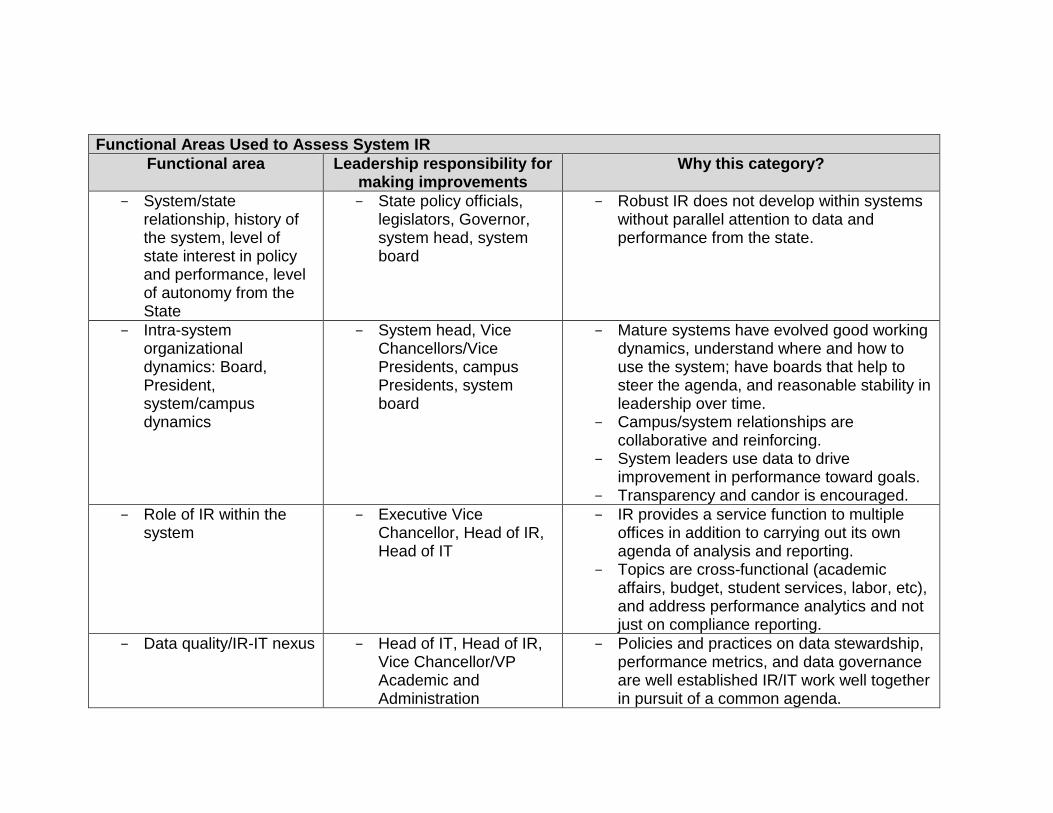
Four broad themes emerged that served as foundational elements for these rubrics,
which are organized by functional areas and by decision-makers most likely to be in a
position to influence change. The broad categories include:
System and state relationships: This includes the history of the system, the
level of state interest in policy and performance, and the degree of autonomy of
the system from the state.
Intra-system organizational dynamics: This includes dynamics between the
system and the Board, President or Chancellor, and/or the campuses.
The role of IR within the system and among campuses: This includes
whether or not IR is focused on compliance reporting and auditing, or geared
more towards translating data into knowledge and action.
Data quality and the IR-IT nexus: This includes how Institutional Research and
Information Technology can best complement one another.
Once the rubric was created, it was tested at several systems to ensure it reflected the
realities faced by these functions, which allowed for further refinement. To that end, the
following report includes a more details analysis of the current state of the IR function
at systems and institutions, as well as a toolkit for the purposes of assessing whether
or not system and institution IR functions are well positioned to evolve in ways that
meet the challenges and demands of today.
The context for changes in institutional research
Higher education is facing unprecedented pressures for rapid change, to increase
access and improve success for all students, to improve student learning, to meet
future demands for jobs, and to reduce costs. We have witnessed huge changes in
how data are accessed and used, and will continue to experience changes for the
foreseeable future. Technical information is becoming more and more widely available
– via social media tools – and easily accessible to major databases. The business of
higher education is no longer only the province of the institutions themselves. College
and university performance is now also the people's business, and is a major topic of
public policy. A myriad of sophisticated nonprofit public policy and research groups
have developed over the last two decades, each focused on data driven analysis about
some facet of higher education performance. Demand for easily accessible, relevant
data about higher education performance has never been stronger: from federal
officials, ‘think tanks,’ among state officials, in the media, and in the blogosphere. The
days when higher education could control the flow of data, or even define the terms of
the discussion about performance, are over.
A current example of this dynamic can be found in the Obama administration's plan
to develop a new 'ratings' system for colleges and universities, based on measures
of 'value' and 'value-added' that have yet to be defined. The administration has
asked for input about the measures, and will likely unveil their new proposals within a
year or so. The feedback from the higher education community has by and large
been to support the concept but to question the technical basis on which measures
will be developed. They see the issues of definitions and data as critical to the
integrity of any new rating system, and potentially dangerous to higher education if
not developed with great care as to consistency and quality of the data elements.
The Obama administration, while listening to the field about these issues, has clearly
signaled intent to move forward with new measures, without waiting for consensus
about the technical infrastructure on which any such system must be built.
While IR is unquestionably needed to inform external accountability demands, a
deeper need lies in the potential to use IR to inform and leverage strategic change
and organizational learning necessary to propel change. Good organizational
intelligence, the type of information that looks both inward and outward, is central to
the management of strategic change in higher education. Colleges and universities
often change at the edges, in ad hoc and idiosyncratic ways driven by individuals
and disconnected from the central business of the institution. For change to take hold
and to grow to scale, it has to be strategic and organizational. This type of change
depends on leadership and persuasion. Information is absolutely essential to this,
particularly for faculty and for administrators who need to draw their own conclusions
about where and why to do things differently. Faculty are notorious skeptics, but
they are also invested in organizational success, and many care deeply about
finding ways to do more to increase the success of their institutions. Successful
change efforts require building consensus and support through engagement and
communication with stakeholders at both the system and campus levels.
The following framework for ‘change agency’, adapted from work by Swing (2009),
shows the steps in the process of organizational change.
Framework for Change Agency: (adapted from work by Swing, 2009)
Step Important Pieces to Actualizing Change Role of IR
Build
Awareness
Establish a common language; Anticipate the scale and scope of
awareness needed to advance the issue; Ensure that constituents
perceive the planned change as one that the campus can influence
or has direct control over; Consider human desires to change.
Hypothesis testing and
communication; Help
standardize language.
Develop Focus Apply framing theory: Communicate data-based information that
identifies and disaggregates components of complex issues; Refine
the language used in diagnosing issues; Ensure that others can
articulate the timeliness of issues; Encourage debate and discussion
of the issues.
Narrator: Use problem
framing to present
information in a way that
clearly defines problems and
solutions and resonates with
various stakeholders.
Increase
Knowledge
Sample stakeholders; Move campus from considering a problem to a
finite and narrow list of potential solutions; Peer comparisons;
Understand where political and cultural barriers may arise and work
to navigate them; Knowledge-building; Find a critical mass of people
who support the change.
Surveys, focus groups, other
tools and research to quickly
build a body of knowledge to
drive consensus.
Resolve to
Change
Continue to build momentum behind decision, or run the risk of failed
adoption; Pilot projects and small demonstrations; Understanding
campus dynamics; Disseminate and communicate a change plan;
Assist decision makers in establishing and monitoring a timeline;
Track progress through initiation, implementation, and continuation.
Develop performance
measures to monitor change
efforts; Help establish
routines and monitoring
tools.
Incorporate or
Replace
Fairly evaluate efforts; Create, change, or disband where
appropriate; Intentional revision and continuous improvement;
Building a leadership succession plan.
Serve as an objective
evaluator of policies and
programs.
About the survey and interviews
The National Association of System Heads (NASH) collaborated with the Association of
Institutional Research (AIR), to develop surveys of both system and campus IR offices.
Guided by a national advisory committee see Appendix 1 for names of committee
members), the survey results then formed the basis for interviews about the findings with
both IR professionals and users of IR – academic provosts, fiscal officers, government
relations personnel, system heads, and individuals in policy positions at both state and
national levels. We used the interviews to confirm findings from the surveys, and to test
perceptions among key stakeholders as to whether the function is well positioned to
meet the needs of the future. Questions were designed to get at issues of IR
organization, workflow, audience, impact, and readiness for change.
Two separate surveys were developed in 2013, one for system IR offices, and one for
campus IR offices. Although we asked the IR offices to complete the survey, we asked
them to frame responses about the IR function, whether or not that is done within a
designated IR or other-named office. Draft surveys were field tested with both system
and campus offices, and distributed to all 48 system offices and to the IR offices for 349
campuses within systems. NASH sent letters to all system heads, informing them about
the survey, and encouraging member institutions to participate in it. We received
responses from 35 system offices, and from 157 campus IR offices, for a response rate
from systems of 73% and for campuses of 45%. A listing of respondents is provided in
Appendix 2. A copy of the survey instrument and a detailed summary of the complete
campus and system surveys and results are available via the AIR website:
System head, Vice Chancellors/Vice Presidents, campus Presidents, system board
Mature systems have evolved good working dynamics, understand where and how to use the system; have boards that help to steer the agenda, and reasonable stability in leadership over time.
Campus/system relationships are collaborative and reinforcing.
System leaders use data to drive improvement in performance toward goals.
Transparency and candor is encouraged.
Role of IR within the system
Executive Vice Chancellor, Head of IR, Head of IT
IR provides a service function to multiple offices in addition to carrying out its own agenda of analysis and reporting.
Topics are cross-functional (academic affairs, budget, student services, labor, etc), and address performance analytics and not just on compliance reporting.
Data quality/IR-IT nexus Head of IT, Head of IR, Vice Chancellor/VP Academic and Administration
Policies and practices on data stewardship, performance metrics, and data governance are well established IR/IT work well together in pursuit of a common agenda.
The more detailed questions embedded within these categories are shown below. The
rubric provides examples of organizational responses to each question, organized along
a continuum and scored on a 1-3 scale (1 representing a less than mature state; 2
represents an intermediately mature state; 3 represents the most mature state). The
entire rubric with descriptive characteristics is attached.
I. System/state context. This category is ungraded; it asks questions about the
state political and data context within which IR functions, such as whether
there is a mandatory statewide accountability system, a student unit-record
system, or state or system collective bargaining.
II. Intra-system organizational dynamics: Board, President, system/campus
dynamic
a. Board level involvement in the IR agenda
b. System level leadership stability
c. System and campus dynamics
III. Role of IR within the system
a. Orientation of the IR office
b. “Clients” and products of IR
c. Topical coverage and integration of data and indicators
d. Staff capacity, and professional development and support
e. Translation and contextualization of data
f. Accessibility of data and other products from IR
g. IR relation to other system offices
IV. Data quality/IR-IT nexus
a. IR and IT relationships (reporting, communication, staff)
b. Data governance
c. Data Stewardship
d. Data accessibility
About NASH and the IR project
NASH is a network of the chief executives of 44 United States public multi campus
university systems. The mission of NASH is to improve collective capacity for system
leaders to drive educational innovation and institutional improvements to better meet
public needs for higher education. They do this by identifying and promoting best
practices in strategic areas central to improving educational performance, with an
emphasis on educational equity, degree completion, efficiency and effectiveness, and
public accountability for performance.
The work to support the development of this rubric has been supported by a grant to
NASH from the Bill & Melinda Gates Foundation. The first phase of the project was
spent in a general assessment of the state of IR, conducted via a national survey
accompanied by interviews with institutional leaders. The results of that study are
available at www.nashonline.org/institutional-research. The survey work led to the
development of the rubric.
Members of the team that developed and tested the rubric include:
Timothy Chester, Vice President Information Technology, University of Georgia
Lisa Clarke, Consultant, RPK Consulting Group
Jonathan Gagliardi, Deputy Director, National Association of System Heads
Stephanie Bond Huie, Vice Chancellor, Office of Strategic Initiatives, University
of Texas System
Bobby Sharp, Director of Institutional Research and Assessment, University of
North Carolina Asheville
Jane Wellman, Consultant to NASH and Manager of Project on Systems and IR
The project has been also been overseen by a steering committee, whose members
include:
Margot Rogers, Parthenon Consulting
Richard Steele, SysPartners
Randy Swing, Association for Institutional Research
Rebecca Martin, Executive Director of NASH.
February, 2015
System assessment rubric
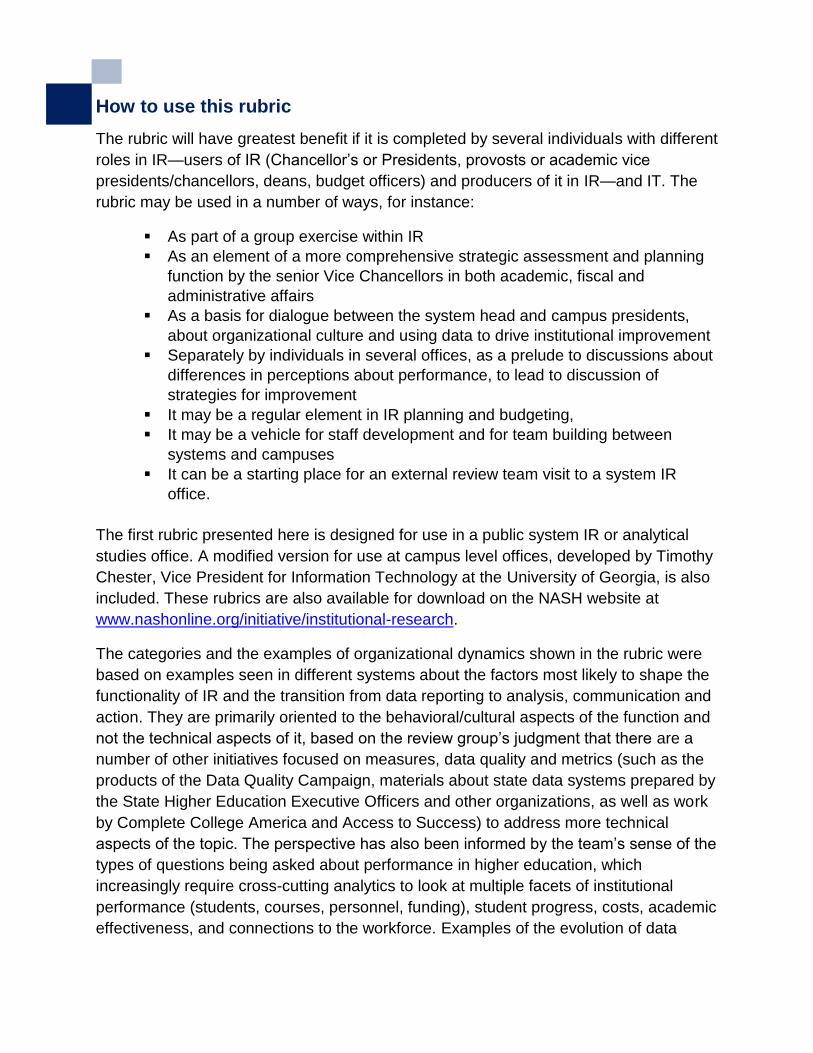
How to use this rubric
The rubric will have greatest benefit if it is completed by several individuals with different
roles in IR—users of IR (Chancellor’s or Presidents, provosts or academic vice
presidents/chancellors, deans, budget officers) and producers of it in IR—and IT. The
rubric may be used in a number of ways, for instance:
As part of a group exercise within IR
As an element of a more comprehensive strategic assessment and planning
function by the senior Vice Chancellors in both academic, fiscal and
administrative affairs
As a basis for dialogue between the system head and campus presidents,
about organizational culture and using data to drive institutional improvement
Separately by individuals in several offices, as a prelude to discussions about
differences in perceptions about performance, to lead to discussion of
strategies for improvement
It may be a regular element in IR planning and budgeting,
It may be a vehicle for staff development and for team building between
systems and campuses
It can be a starting place for an external review team visit to a system IR
office.
The first rubric presented here is designed for use in a public system IR or analytical
studies office. A modified version for use at campus level offices, developed by Timothy
Chester, Vice President for Information Technology at the University of Georgia, is also
included. These rubrics are also available for download on the NASH website at
effectiveness, and connections to the workforce. Examples of the evolution of data
analytics in other spheres of public policy – particularly health care, but also K-12
education – have also been helpful.
The rubric is a diagnostic tool and not a prescriptive one. It will help users to reach
judgments about strengths and weaknesses in their IR function both from the
perspective of the producers of IR and the consumers of it. It will not generate
comparative information about how each system IR functions look compare to those in
other systems. To accomplish that, NASH recommends that system leaders supplement
the self-assessment with a visit from an external review team with expertise in public
systems and the IR function. The team can provide the system leaders with their
perspective about the overall function, and can provide an independent assessment
about strategies for improving performance. NASH has organized and trained an IR
review team to support that function, which can be made available to systems on a cost-
sharing basis.
As system leaders, NASH members are dependent on IR and data analytics to carry out
their responsibilities for oversight and public accountability, to set goals for
performance, and to monitor progress toward meeting those goals. Early research by
NASH done in conjunction with the Association for Institutional Research (AIR)
determined that despite a growing awareness of the importance of robust IR, the
function itself is underdeveloped and often strained, dominated by the demands of data
reporting and data cleaning, to the determinant of deeper analytics or connections to
decision makers. The research also suggests that the systems that have been most
successful in evolving multidimensional data analytics have developed sophistication
both on the demand and production side of IR: from presidents and others who use data
to set goals and to improve performance, and from the analysts and researchers who
work collaboratively with others to inform questions and find new ways to measure and
improve performance. The hope is that this diagnostic framework will be helpful to both
constituencies as they find ways to improve this important function.
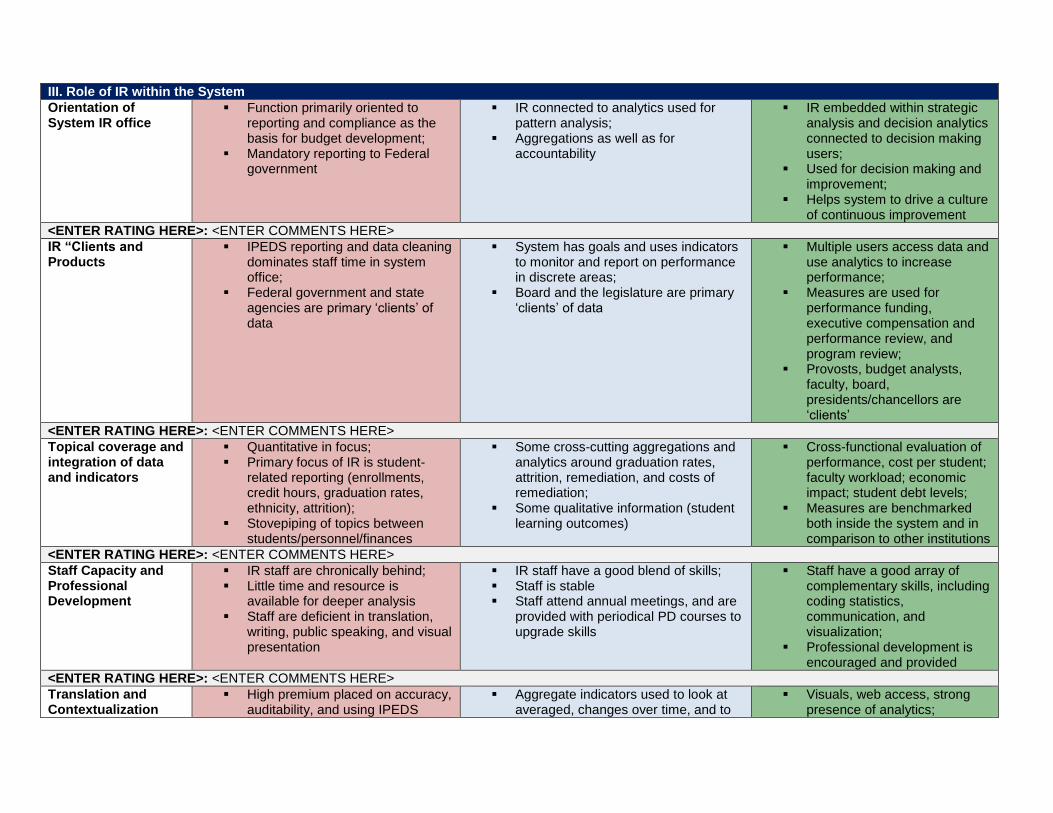
SYSTEM IR ASSESSMENT RUBRIC RED (1 POINT) IS LESS THAN MATURE STATE; BLUE (2 POINTS) IS INTERMEDIATELY MATURE STATE; GREEN (3 POINTS) IS MATURE STATE
This rubric is designed to facilitate system self-assessments of the functionality of the IR process across four categories, which include: (1) State/System Context; (2) System-level organizational dynamics; (3) The role of IR within the system; and (4) Data quality/IR-IT interactions/and accessibility of the data. The completed rubric describes these in greater detail, and offers examples of what characteristics are of scores of 1 (red), 2 (blue) or 3 (green) for each of the elements. Following the generic presentation of the rubric, you have space to score your function based on your assessment. Depending on your sense of the relative importance of each of these categories, you could potentially ‘weight’ them. The scores should be based on collective judgments. We would be interested in your feedback about that; our own view is that this is an adaptable framework that can be very helpful to systems and to campuses.
I. State/system context: role of the system within the state, political history, state policy environment (environment within which the function has evolved and the emerging context for future uses)
Systems’ capacity to evolve the IR function will vary depending on a system office’s history and relationship to state agencies. Issues to consider in contextualizing the demand for integrated and actionable analytics: Is there a state coordinating agency that takes care of IPEDS reporting for the campuses? If NO, then system will need to perform this, which can
detract from focus on data analytics. If NO, can system collaborate with other systems/institutions to share resources on reporting function? Does the state have a student unit-level record system connecting P-20? If NO, does the system have options to reach out to state Department of
Education or Community Colleges (if separate) to share data on student academic preparation and other issues of interest? Does the system office have discretionary decision making authority over funding allocations to campuses, including incentive funding practices? If NO,
then can system build an incentive funding “pot” for rewarding performance in key areas? Is there a statewide accountability system or a report card? If NO, then system and the board may need to develop their own indicators consistent with
the strategic plan. Is there collective bargaining? Does the system do the bargaining on behalf of the campuses, or does the state do it? If YES, using data to develop
aggregate indicators of performance may take back seat to data that may be certified to be used in bargaining. Is the state moving to or currently using outcomes based budgeting as the basis for allocating resources? If not, are discussions and studies underway
about likely future metrics?
<ENTER COMMENTS HERE>
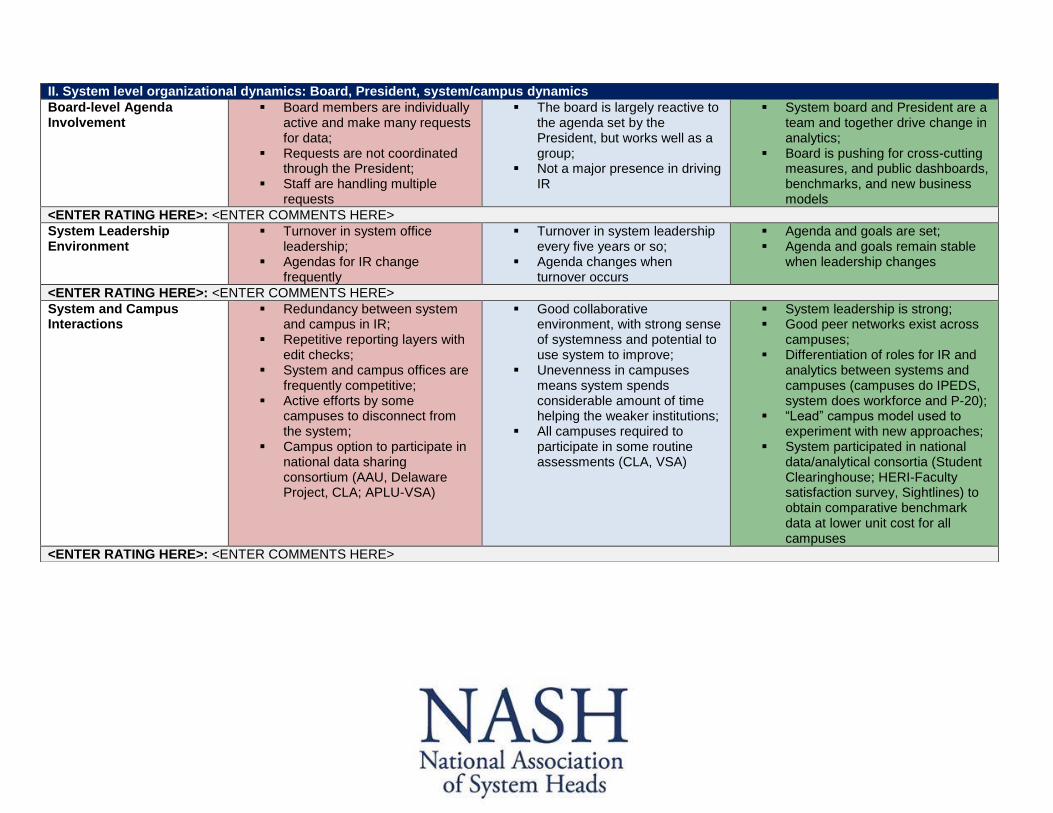
II. System level organizational dynamics: Board, President, system/campus dynamics
Board-level Agenda Involvement
Board members are individually active and make many requests for data;
Requests are not coordinated through the President;
Staff are handling multiple requests
The board is largely reactive to the agenda set by the President, but works well as a group;
Not a major presence in driving IR
System board and President are a team and together drive change in analytics;
Board is pushing for cross-cutting measures, and public dashboards, benchmarks, and new business models
<ENTER RATING HERE>: <ENTER COMMENTS HERE>
System Leadership Environment
Turnover in system office leadership;
Agendas for IR change frequently
Turnover in system leadership every five years or so;
Agenda changes when turnover occurs
Agenda and goals are set; Agenda and goals remain stable
when leadership changes
<ENTER RATING HERE>: <ENTER COMMENTS HERE>
System and Campus Interactions
Redundancy between system and campus in IR;
Repetitive reporting layers with edit checks;
System and campus offices are frequently competitive;
Active efforts by some campuses to disconnect from the system;
Campus option to participate in national data sharing consortium (AAU, Delaware Project, CLA; APLU-VSA)
Good collaborative environment, with strong sense of systemness and potential to use system to improve;
Unevenness in campuses means system spends considerable amount of time helping the weaker institutions;
All campuses required to participate in some routine assessments (CLA, VSA)
System leadership is strong; Good peer networks exist across
campuses; Differentiation of roles for IR and
analytics between systems and campuses (campuses do IPEDS, system does workforce and P-20);
“Lead” campus model used to experiment with new approaches;
System participated in national data/analytical consortia (Student Clearinghouse; HERI-Faculty satisfaction survey, Sightlines) to obtain comparative benchmark data at lower unit cost for all campuses
<ENTER RATING HERE>: <ENTER COMMENTS HERE>
III. Role of IR within the System
Orientation of System IR office
Function primarily oriented to reporting and compliance as the basis for budget development;
Mandatory reporting to Federal government
IR connected to analytics used for pattern analysis;
Aggregations as well as for accountability
IR embedded within strategic analysis and decision analytics connected to decision making users;
Used for decision making and improvement;
Helps system to drive a culture of continuous improvement
<ENTER RATING HERE>: <ENTER COMMENTS HERE>
IR “Clients and Products
IPEDS reporting and data cleaning dominates staff time in system office;
Federal government and state agencies are primary ‘clients’ of data
System has goals and uses indicators to monitor and report on performance in discrete areas;
Board and the legislature are primary ‘clients’ of data
Multiple users access data and use analytics to increase performance;
Measures are used for performance funding, executive compensation and performance review, and program review;
Provosts, budget analysts, faculty, board, presidents/chancellors are ‘clients’
<ENTER RATING HERE>: <ENTER COMMENTS HERE>
Topical coverage and integration of data and indicators
Quantitative in focus; Primary focus of IR is student-
related reporting (enrollments, credit hours, graduation rates, ethnicity, attrition);
Stovepiping of topics between students/personnel/finances
Some cross-cutting aggregations and analytics around graduation rates, attrition, remediation, and costs of remediation;
Some qualitative information (student learning outcomes)
Cross-functional evaluation of performance, cost per student; faculty workload; economic impact; student debt levels;
Measures are benchmarked both inside the system and in comparison to other institutions
<ENTER RATING HERE>: <ENTER COMMENTS HERE>
Staff Capacity and Professional Development
IR staff are chronically behind; Little time and resource is
available for deeper analysis Staff are deficient in translation,
writing, public speaking, and visual presentation
IR staff have a good blend of skills; Staff is stable Staff attend annual meetings, and are
provided with periodical PD courses to upgrade skills
Staff have a good array of complementary skills, including coding statistics, communication, and visualization;
Professional development is encouraged and provided
<ENTER RATING HERE>: <ENTER COMMENTS HERE>
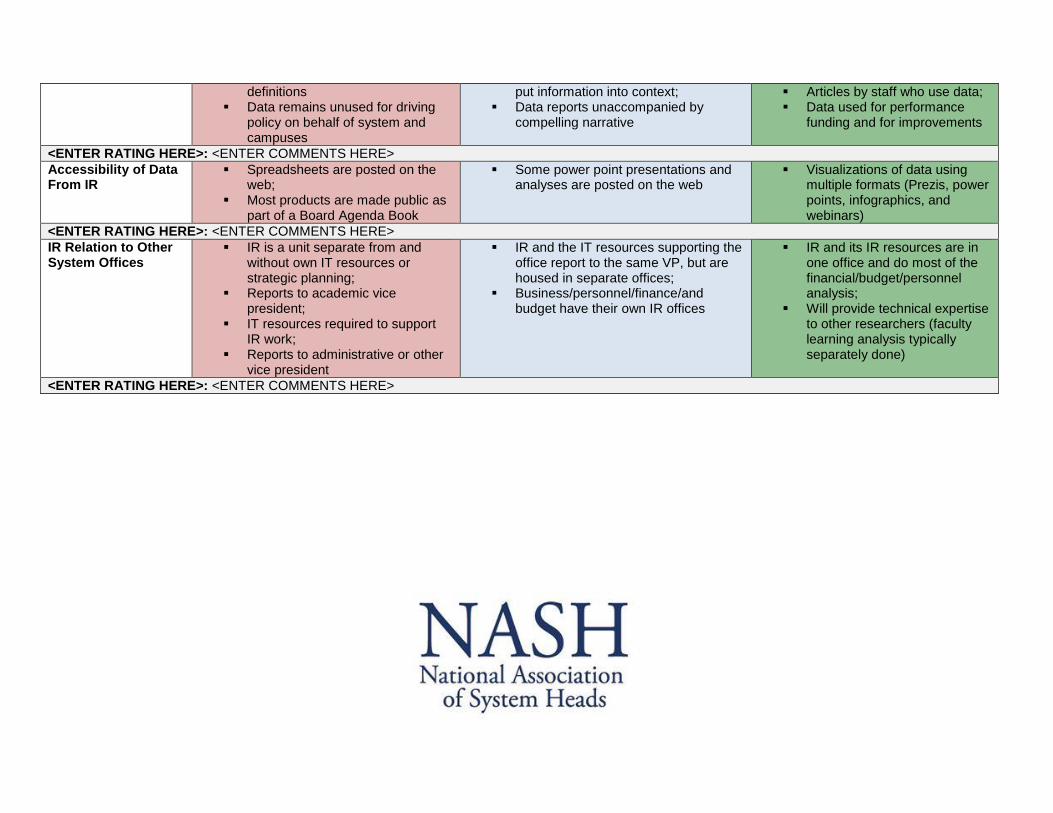
Translation and Contextualization
High premium placed on accuracy, auditability, and using IPEDS
Aggregate indicators used to look at averaged, changes over time, and to
Visuals, web access, strong presence of analytics;
definitions Data remains unused for driving
policy on behalf of system and campuses
put information into context; Data reports unaccompanied by
compelling narrative
Articles by staff who use data; Data used for performance
funding and for improvements
<ENTER RATING HERE>: <ENTER COMMENTS HERE>
Accessibility of Data From IR
Spreadsheets are posted on the web;
Most products are made public as part of a Board Agenda Book
Some power point presentations and analyses are posted on the web
Visualizations of data using multiple formats (Prezis, power points, infographics, and webinars)
<ENTER RATING HERE>: <ENTER COMMENTS HERE>
IR Relation to Other System Offices
IR is a unit separate from and without own IT resources or strategic planning;
Reports to academic vice president;
IT resources required to support IR work;
Reports to administrative or other vice president
IR and the IT resources supporting the office report to the same VP, but are housed in separate offices;
Business/personnel/finance/and budget have their own IR offices
IR and its IR resources are in one office and do most of the financial/budget/personnel analysis;
Will provide technical expertise to other researchers (faculty learning analysis typically separately done)
<ENTER RATING HERE>: <ENTER COMMENTS HERE>
IV. Data quality/IR-IT interactions, accessibility of data
IR & IT Dynamic IR and IT competing for resources; IR and IT are not well connected
IR and IT work together well; System office cannot control
campus IT; Perpetual chase for new
systems, hardware, and solutions
Strong relationships between IR and IT and both are possibly in one unit;
Report to the same people and commonly understand priorities and resources
<ENTER RATING HERE>: <ENTER COMMENTS HERE>
Data Governance Common data definitions and common elements for data storage are lacking;
Data from separate functions are unevenly structures, creating multiple ‘truths’
Some areas have standardized data definitions;
Protocols for sharing between system and campus ‘in progress’;
Data is considered reliable but cannot be used until it is certified, which compromises timely access to information
Well-established data definitions; Established governance
procedures for collaboration and sharing;
Data are considered accurate, linked, tailored and timely
<ENTER RATING HERE>: <ENTER COMMENTS HERE>
Data Stewardship Sharing of data elements between system and system institutions is through flat-file transfers;
No web interface exists; Sharing of data requires significant
efforts by staff to manually clean data up upon data transfer between parties;
Some manual data conversion is required upon data transfer between parties due to a lack of standardized data definitions for the data that is shared;
There is no Enterprise Resource Planning (ERP) system or data warehouse structure that can integrate disparate data systems
Sharing of data is performed mostly between systems and campuses via flat-file transfers;
A web interface for collection exists;
No capacity for user-generated reports
Sharing of data requires some efforts by staff to manually clean data up upon data transfer between parties;
Little or no manual data conversation is required as data shared is based on standardized data definitions for the data that is shared;
The function has begun planning for the creation of an Enterprise Resource Planning (ERP) system or data warehouse
Sharing of data is performed by automated data base to database transfers;
Established data definitions and data integrity are enforced by automated rules checking upon data transfer;
Minimal data cleanup is required; if required it is generally only for a limited number of exceptions;
Discrete information from multiple data sources and format efficiently interact and aggregate, creating ‘one truth’ that stems from a centralized source;
There is an optimal Enterprise Resource Planning (ERP) system or data warehouse that manages and integrates data
<ENTER RATING HERE>: <ENTER COMMENTS HERE>
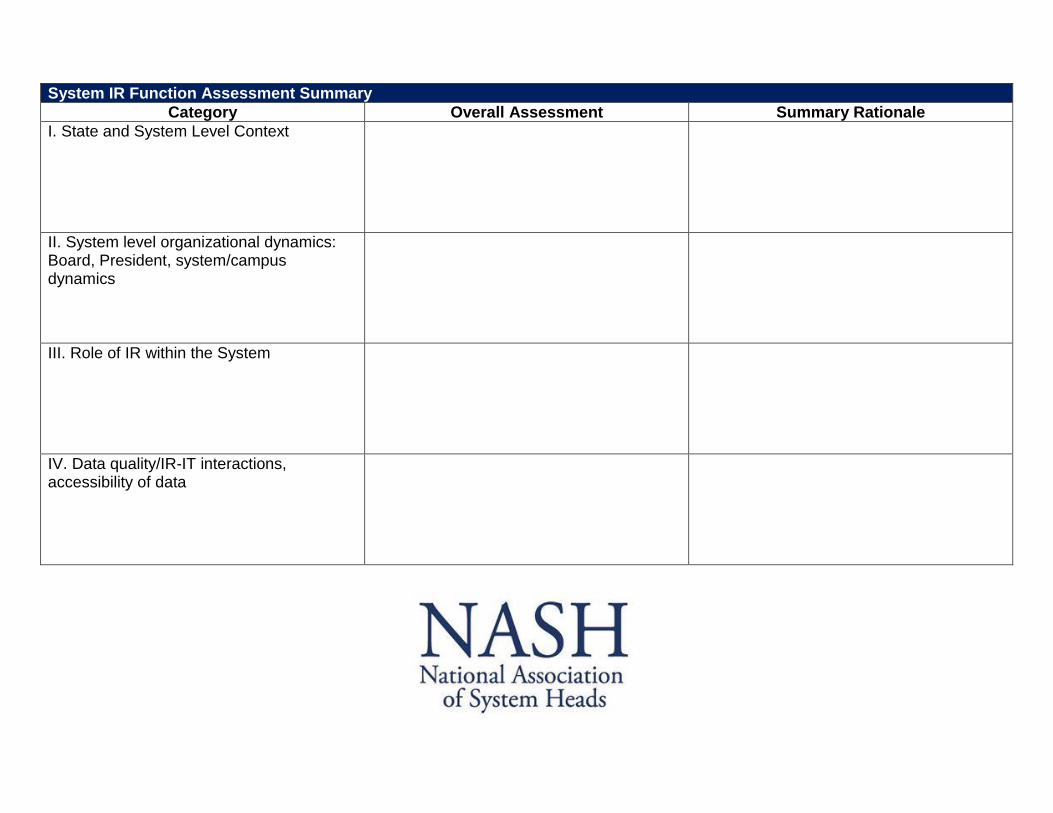
System IR Function Assessment Summary
Category Overall Assessment Summary Rationale
I. State and System Level Context
II. System level organizational dynamics: Board, President, system/campus dynamics
III. Role of IR within the System
IV. Data quality/IR-IT interactions, accessibility of data
Institutional assessment rubric
INSTITUTION IR ASSESSMENT RUBRIC RED (1 POINT) IS LESS THAN MATURE STATE; BLUE (2 POINTS) IS INTERMEDIATELY MATURE STATE; GREEN (3 POINTS) IS MATURE STATE
This rubric is designed to facilitate institutional self-assessments of the functionality of the IR process across three categories, which include: (1) Institution-level organizational dynamics; (2) The role of IR within the institution; and (3) Data quality/IR-IT interactions/and accessibility of the data. The completed rubric describes these in greater detail, and offers examples of what characteristics are of scores of 1 (red), 2 (blue) or 3 (green) for each of the elements. Following the generic presentation of the rubric, you have space to score your function based on your assessment. Depending on your sense of the relative importance of each of these categories, you could potentially ‘weight’ them. The scores should be based on collective judgments. We would be interested in your feedback about that; our own view is that this is an adaptable framework that can be very helpful to systems and to campuses.
I. Institution level organizational dynamics: Board, President, system/campus dynamics
Board-level Agenda Involvement
Cabinet members and senior leadership are individually active and make many requests for data;
Not coordinated through central gatekeepers;
Staff need to be able to handle multiple requests
The cabinet and senior leadership is largely reactive to strategic agenda set by campus strategic plan;
Works well as a group; Not a major presence in
driving IR
Cabinet and senior leadership work as a team and together drive changes in analytics;
Both are pushing for cross-cutting measures, public dashboards, benchmarks, and new business models
<ENTER RATING HERE>: <ENTER COMMENTS HERE>
Senior Leadership Environment
Turnover in senior leadership; agendas for IR change frequently
Turnover in senior leadership every 5 years or so;
Agenda changes when turnover occurs
Agenda and goals are set, and remain stable when there are changes in leadership
<ENTER RATING HERE>: <ENTER COMMENTS HERE>
IR and Campus Unit Interactions
Redundancy between IR and other units performing reporting;
Repetitive layers of reporting with or without common data definitions;
Relationships between IR and other units performing reporting is frequently competitive;
Active efforts by some units to perform reporting functions outside IR
Good collaborative environment between IR and other units performing reporting;
Strong sense of togetherness and potential to use data to improve
IR leadership of function is strong; Good peer network across
campus; Differentiation of roles for IR and
analytics between performing reporting functions;
IR takes lead to experiment with new approaches
<ENTER RATING HERE>: <ENTER COMMENTS HERE>
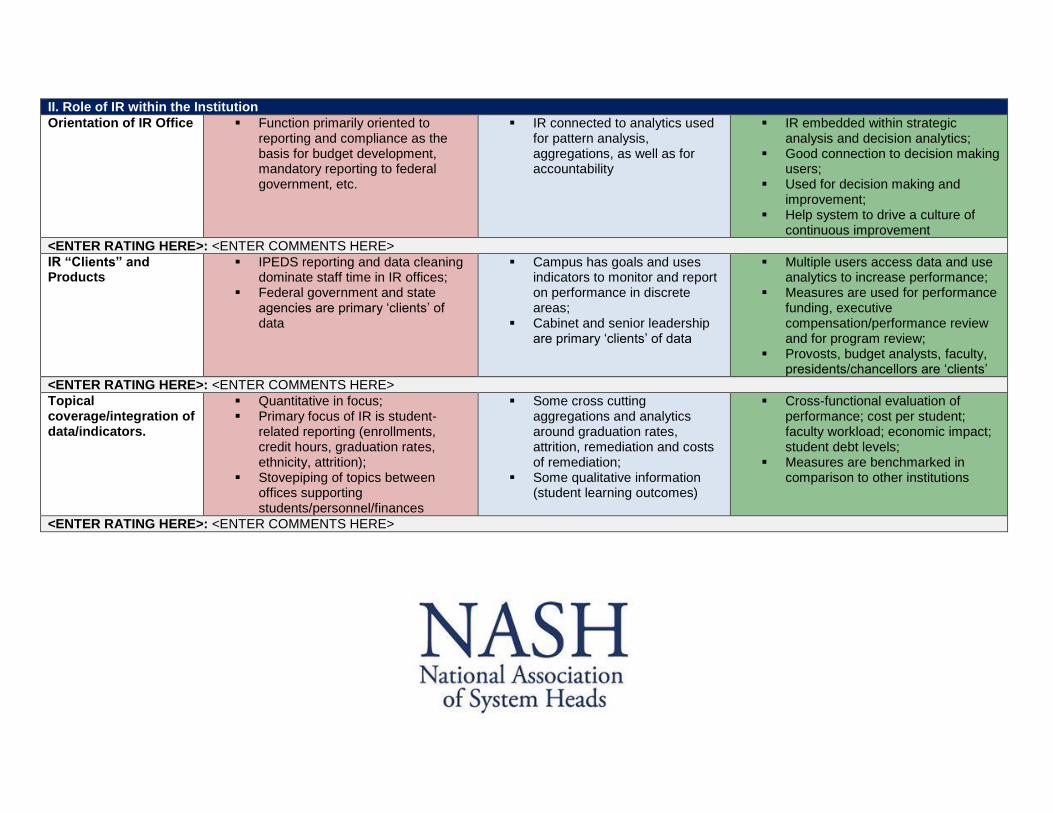
II. Role of IR within the Institution
Orientation of IR Office Function primarily oriented to reporting and compliance as the basis for budget development, mandatory reporting to federal government, etc.
IR connected to analytics used for pattern analysis, aggregations, as well as for accountability
IR embedded within strategic analysis and decision analytics;
Good connection to decision making users;
Used for decision making and improvement;
Help system to drive a culture of continuous improvement
<ENTER RATING HERE>: <ENTER COMMENTS HERE>
IR “Clients” and Products
IPEDS reporting and data cleaning dominate staff time in IR offices;
Federal government and state agencies are primary ‘clients’ of data
Campus has goals and uses indicators to monitor and report on performance in discrete areas;
Cabinet and senior leadership are primary ‘clients’ of data
Multiple users access data and use analytics to increase performance;
Measures are used for performance funding, executive compensation/performance review and for program review;
Provosts, budget analysts, faculty, presidents/chancellors are ‘clients’
<ENTER RATING HERE>: <ENTER COMMENTS HERE>
Topical coverage/integration of data/indicators.
Quantitative in focus; Primary focus of IR is student-
related reporting (enrollments, credit hours, graduation rates, ethnicity, attrition);
Stovepiping of topics between offices supporting students/personnel/finances
Some cross cutting aggregations and analytics around graduation rates, attrition, remediation and costs of remediation;
Some qualitative information (student learning outcomes)
Cross-functional evaluation of performance; cost per student; faculty workload; economic impact; student debt levels;
Measures are benchmarked in comparison to other institutions
<ENTER RATING HERE>: <ENTER COMMENTS HERE>
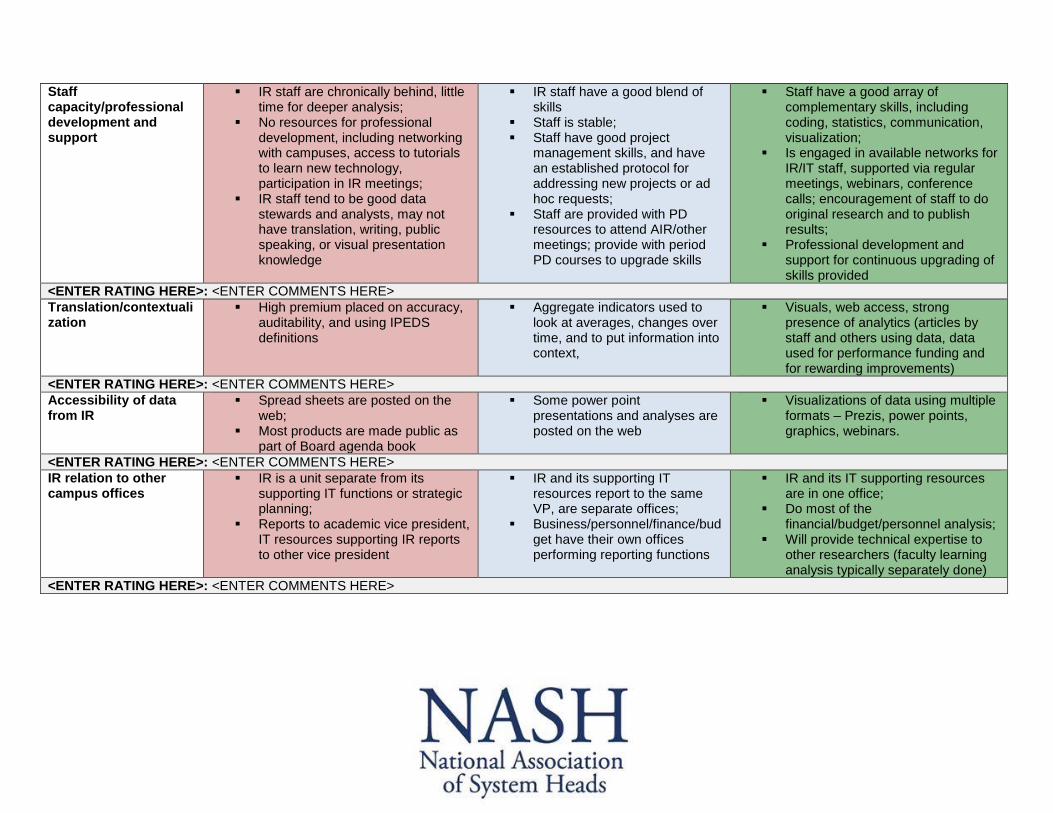
Staff capacity/professional development and support
IR staff are chronically behind, little time for deeper analysis;
No resources for professional development, including networking with campuses, access to tutorials to learn new technology, participation in IR meetings;
IR staff tend to be good data stewards and analysts, may not have translation, writing, public speaking, or visual presentation knowledge
IR staff have a good blend of skills
Staff is stable; Staff have good project
management skills, and have an established protocol for addressing new projects or ad hoc requests;
Staff are provided with PD resources to attend AIR/other meetings; provide with period PD courses to upgrade skills
Staff have a good array of complementary skills, including coding, statistics, communication, visualization;
Is engaged in available networks for IR/IT staff, supported via regular meetings, webinars, conference calls; encouragement of staff to do original research and to publish results;
Professional development and support for continuous upgrading of skills provided
<ENTER RATING HERE>: <ENTER COMMENTS HERE>
Translation/contextualization
High premium placed on accuracy, auditability, and using IPEDS definitions
Aggregate indicators used to look at averages, changes over time, and to put information into context,
Visuals, web access, strong presence of analytics (articles by staff and others using data, data used for performance funding and for rewarding improvements)
<ENTER RATING HERE>: <ENTER COMMENTS HERE>
Accessibility of data from IR
Spread sheets are posted on the web;
Most products are made public as part of Board agenda book
Some power point presentations and analyses are posted on the web
Visualizations of data using multiple formats – Prezis, power points, graphics, webinars.
<ENTER RATING HERE>: <ENTER COMMENTS HERE>
IR relation to other campus offices
IR is a unit separate from its supporting IT functions or strategic planning;
Reports to academic vice president, IT resources supporting IR reports to other vice president
IR and its supporting IT resources report to the same VP, are separate offices;
Business/personnel/finance/budget have their own offices performing reporting functions
IR and its IT supporting resources are in one office;
Do most of the financial/budget/personnel analysis;
Will provide technical expertise to other researchers (faculty learning analysis typically separately done)
<ENTER RATING HERE>: <ENTER COMMENTS HERE>
III. Data quality/IR-IT interactions, accessibility of data
IR & IT Dynamic IR/IT competing for resources, not well connected
IR/IT work together well, but IR office operates own IT systems outside of central IT,
Strong relationships, may be in one unit of strategic analytics, report to same people and understand priorities and resources
<ENTER RATING HERE>: <ENTER COMMENTS HERE>
Data Governance Common data definitions and common elements for data storage are lacking;
Data from separate functions are unevenly structures, creating multiple ‘truths’
Some areas have standardized data definitions;
Protocols for sharing between system and campus ‘in progress’;
Data is considered reliable but cannot be used until it is certified, which compromises timely access to information
Well-established data definitions; Established governance
procedures for collaboration and sharing;
Data are considered accurate, linked, tailored and timely
<ENTER RATING HERE>: <ENTER COMMENTS HERE>
Data Stewardship Sharing of data elements between system and system institutions is through flat-file transfers;
No web interface exists; Sharing of data requires significant
efforts by staff to manually clean data up upon data transfer between parties;
Some manual data conversion is required upon data transfer between parties due to a lack of standardized data definitions for the data that is shared;
There is no Enterprise Resource Planning (ERP) system or data warehouse structure that can integrate disparate data systems
Sharing of data is performed mostly between systems and campuses via flat-file transfers;
A web interface for collection exists;
No capacity for user-generated reports
Sharing of data requires some efforts by staff to manually clean data up upon data transfer between parties;
Little or no manual data conversation is required as data shared is based on standardized data definitions for the data that is shared;
The function has begun planning for the creation of an Enterprise Resource Planning (ERP) system or data warehouse
Sharing of data is performed by automated database to database transfers;
Established data definitions and data integrity are enforced by automated rules checking upon data transfer;
Minimal data cleanup is required; if required it is generally only for a limited number of exceptions;
Discrete information from multiple data sources and format efficiently interact and aggregate, creating ‘one truth’ that stems from a centralized source;
There is an optimal Enterprise Resource Planning (ERP) system or data warehouse that manages and integrates data
<ENTER RATING HERE>: <ENTER COMMENTS HERE>
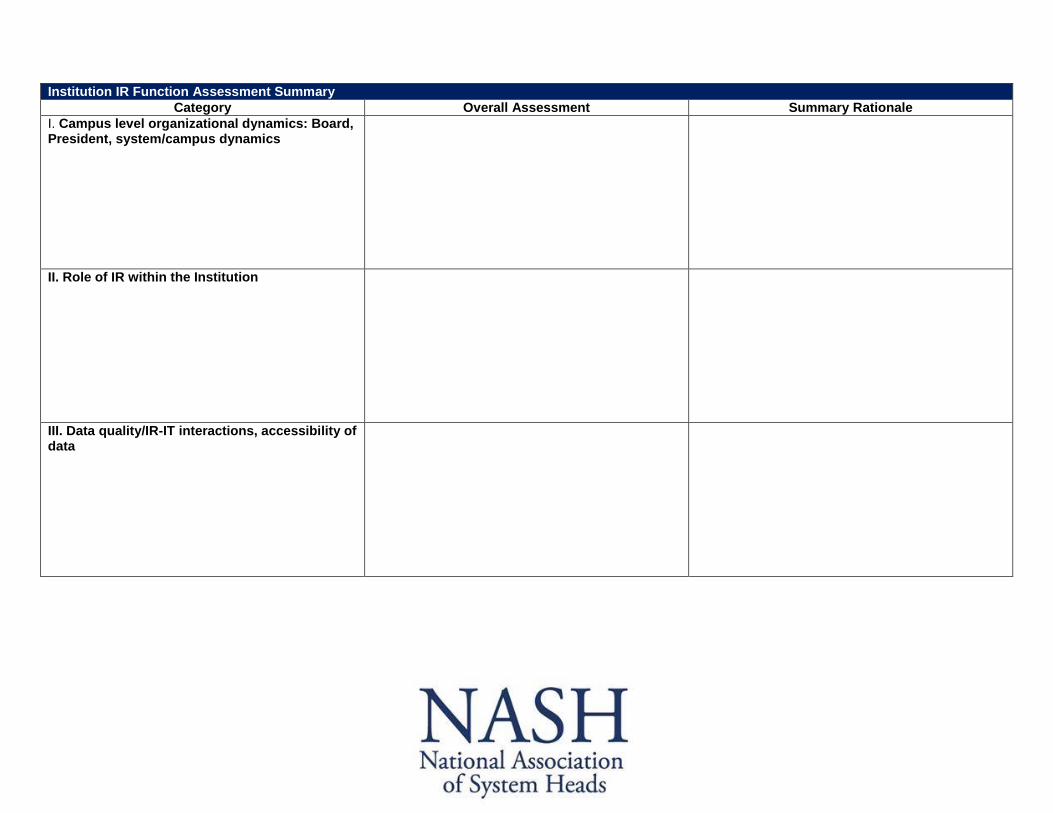
Institution IR Function Assessment Summary
Category Overall Assessment Summary Rationale
I. Campus level organizational dynamics: Board, President, system/campus dynamics
II. Role of IR within the Institution
III. Data quality/IR-IT interactions, accessibility of data