MEKETA INVESTMENT GROUP EMERGING MARKET EQUITIES M E K E T A I N V E S T M E N T G R O U P 100 LOWDER BROOK DRIVE SUITE 1100 WESTWOOD MA 02090 781 471 3500 fax 781 471 3411 www.meketagroup.com ABSTRACT In this document we examine the rationale behind investments in emerging market stocks, discuss whether such investments have intrinsic value, and review the various investment vehicles available to institutional investors. We conclude with a recommendation that emerging market equities should play an increasing role in most plan sponsors’ portfolios. BACKGROUND Before 1990, institutional investment in emerging markets was virtually non-existent. However, since then, hundreds of billions of dollars have been allocated to this asset class. According to a recent survey by Pension & Investments, the average allocation of a US pension fund to emerging markets equities was 4.5% as of September 30, 2010. This is a 50% increase from an average allocation of 3% just three years prior. Is this recent surge in interest justified? Do investors continue to allocate capital to emerging markets based on extensive analysis of the quantitative and qualitative risks, of the economic environment, and of potential returns? Or is it simply the siren-like allure of potentially high growth and inefficient markets? Even with this recent surge of interest, however, a case can be made that emerging markets remain underrepresented in most institutional portfolios. Though they comprise 80% of the world’s population, emerging markets account for roughly 37% of global economic output; and this does not even consider the growth prospects of these fast-developing nations. Furthermore, in contrast to their economic weight, the publicly traded stocks of these emerging markets still represent just 14% of the world’s total stock market capitalization. DEFINING AN EMERGING MARKET Clearly defining what makes a market “emerging” or “developing” is difficult. Is it possible for the capital markets to be emerging, but the economy to be developed? What if the debt and equity markets of the same country are at significantly different stages of sophistication and development? Are equities to be considered emerging if the companies are based in countries included in the MSCI Emerging Markets index? Because a uniform definition does not exist, different bodies use differing classification systems. For example, the IMF uses a system that is based on per capita income, export diversification, and integration into the global financial system. The United Nations uses a more complex approach based on factors such as income, life expectancy, and literacy, while the World Bank uses a simpler approach based solely on income. The average per capita income of the countries in the MSCI Emerging Markets index was $13,338 in 2010. As a reference, the US had a GDP per capita of approximately $47,400 in 2010. These determinants serve as a logical starting point for country inclusion in the emerging market benchmarks, and many investment managers and index providers utilize a similar methodology to define their universe. Still, this definition scheme allows for a broad universe that includes both the world’s second largest economy (China) and many smaller
Transcript
MEKETA INVESTMENT GROUP EMERGING MARKET EQUITIES
M E K E T A I N V E S T M E N T G R O U P 100 LOWDER BROOK DRIVE SUITE 1100 WESTWOOD MA 02090
781 471 3500 fax 781 471 3411 www.meketagroup.com
ABSTRACT In this document we examine the rationale behind investments in emerging market stocks, discuss whether such investments have intrinsic value, and review the various investment vehicles available to institutional investors. We conclude with a recommendation that emerging market equities should play an increasing role in most plan sponsors’ portfolios.
BACKGROUND
Before 1990, institutional investment in emerging markets was virtually non-existent. However, since then, hundreds of billions of dollars have been allocated to this asset class. According to a recent survey by Pension & Investments, the average allocation of a US pension fund to emerging markets equities was 4.5% as of September 30, 2010. This is a 50% increase from an average allocation of 3% just three years prior. Is this recent surge in interest justified? Do investors continue to allocate capital to emerging markets based on extensive analysis of the quantitative and qualitative risks, of the economic environment, and of potential returns? Or is it simply the siren-like allure of potentially high growth and inefficient markets? Even with this recent surge of interest, however, a case can be made that emerging markets remain underrepresented in most institutional portfolios. Though they comprise 80% of the world’s population, emerging markets account for roughly 37% of global economic output; and this does not even consider the growth prospects of these fast-developing nations. Furthermore, in contrast to their economic weight, the publicly traded stocks of these emerging markets still represent just 14% of the world’s total stock market capitalization.
DEFINING AN EMERGING MARKET
Clearly defining what makes a market “emerging” or “developing” is difficult. Is it possible for the capital markets to be emerging, but the economy to be developed? What if the debt and equity markets of the same country are at significantly different stages of sophistication and development? Are equities to be considered emerging if the companies are based in countries included in the MSCI Emerging Markets index? Because a uniform definition does not exist, different bodies use differing classification systems. For example, the IMF uses a system that is based on per capita income, export diversification, and integration into the global financial system. The United Nations uses a more complex approach based on factors such as income, life expectancy, and literacy, while the World Bank uses a simpler approach based solely on income. The average per capita income of the countries in the MSCI Emerging Markets index was $13,338 in 2010. As a reference, the US had a GDP per capita of approximately $47,400 in 2010. These determinants serve as a logical starting point for country inclusion in the emerging market benchmarks, and many investment managers and index providers utilize a similar methodology to define their universe. Still, this definition scheme allows for a broad universe that includes both the world’s second largest economy (China) and many smaller
MEKETA INVESTMENT GROUP EMERGING MARKET EQUITIES
2
economies. As of 2011, the most commonly used benchmark, the MSCI Emerging Markets index, included the following countries: Brazil, Chile, China, Colombia, Czech Republic, Egypt, Hungary, India, Indonesia, Korea, Malaysia, Mexico, Morocco, Peru, Philippines, Poland, Russia, South Africa, Taiwan, Thailand, and Turkey.
THE EMERGING MARKETS THESIS
For many, the rationale behind investing in emerging markets is simple: growth. But an argument can be made that many institutional portfolios are underexposed to emerging markets regardless of their future growth prospects. In sharp contrast to the average 4.5% pension fund allocation cited above, emerging markets today comprise roughly 80% of the world’s population and approximately 37% of global economic output.1 Furthermore, a case can be made that emerging markets are not only under-represented in investor portfolios, but also in the most commonly used stock market indices. While emerging markets companies represent about 31% of global equity capitalization, over half of this amount is not publicly traded. Thus, when adjusted for free float2, emerging markets represent only 14% of the MSCI All Country World index. This weighting is projected to grow in the coming decades to a point that more accurately reflects their share of the global economy (see the chart below3).
MSCI ACWI Index Market Weights
5%14% 19%
31%
45%38%
35%
28%
50% 48% 46% 41%
0%
10%
20%
30%
40%
50%
60%
70%
80%
90%
100%
2000 2010 2020 2030
Emerging Markets International Developed US & Canada
1 Source: IFC, World Bank. 2 “Free float” refers to the shares of a company that are freely traded on an exchange, and does not include
shares that are not publicly traded (i.e., held privately). 3 Projections for 2020 and 2030 are from Goldman Sachs Global ECS Research.
MEKETA INVESTMENT GROUP EMERGING MARKET EQUITIES
3
The Case for Growth
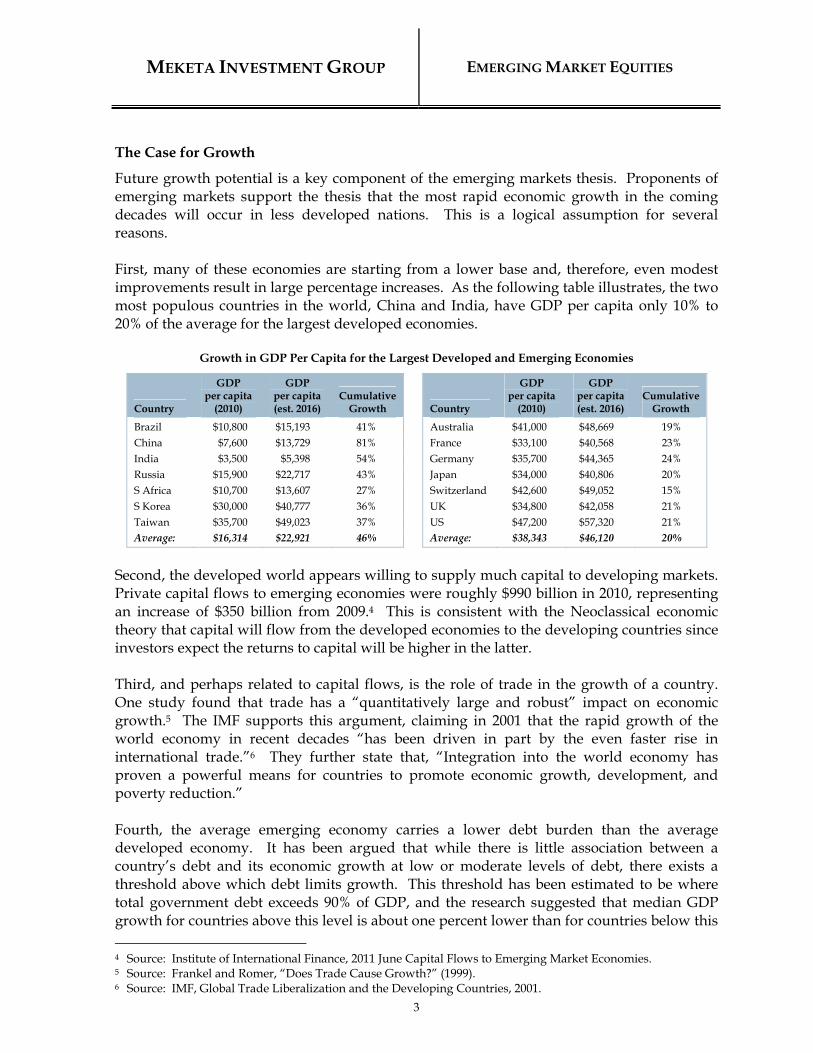
Future growth potential is a key component of the emerging markets thesis. Proponents of emerging markets support the thesis that the most rapid economic growth in the coming decades will occur in less developed nations. This is a logical assumption for several reasons. First, many of these economies are starting from a lower base and, therefore, even modest improvements result in large percentage increases. As the following table illustrates, the two most populous countries in the world, China and India, have GDP per capita only 10% to 20% of the average for the largest developed economies.
Growth in GDP Per Capita for the Largest Developed and Emerging Economies
Country
GDP per capita
(2010)
GDP per capita (est. 2016)
Cumulative Growth Country
GDP per capita
(2010)
GDP per capita (est. 2016)
Cumulative Growth
Brazil $10,800 $15,193 41% Australia $41,000 $48,669 19% China $7,600 $13,729 81% France $33,100 $40,568 23% India $3,500 $5,398 54% Germany $35,700 $44,365 24% Russia $15,900 $22,717 43% Japan $34,000 $40,806 20% S Africa $10,700 $13,607 27% Switzerland $42,600 $49,052 15% S Korea $30,000 $40,777 36% UK $34,800 $42,058 21% Taiwan $35,700 $49,023 37% US $47,200 $57,320 21% Average: $16,314 $22,921 46% Average: $38,343 $46,120 20%
Second, the developed world appears willing to supply much capital to developing markets. Private capital flows to emerging economies were roughly $990 billion in 2010, representing an increase of $350 billion from 2009.4 This is consistent with the Neoclassical economic theory that capital will flow from the developed economies to the developing countries since investors expect the returns to capital will be higher in the latter. Third, and perhaps related to capital flows, is the role of trade in the growth of a country. One study found that trade has a “quantitatively large and robust” impact on economic growth.5 The IMF supports this argument, claiming in 2001 that the rapid growth of the world economy in recent decades “has been driven in part by the even faster rise in international trade.”6 They further state that, “Integration into the world economy has proven a powerful means for countries to promote economic growth, development, and poverty reduction.” Fourth, the average emerging economy carries a lower debt burden than the average developed economy. It has been argued that while there is little association between a country’s debt and its economic growth at low or moderate levels of debt, there exists a threshold above which debt limits growth. This threshold has been estimated to be where total government debt exceeds 90% of GDP, and the research suggested that median GDP growth for countries above this level is about one percent lower than for countries below this
4 Source: Institute of International Finance, 2011 June Capital Flows to Emerging Market Economies. 5 Source: Frankel and Romer, “Does Trade Cause Growth?” (1999). 6 Source: IMF, Global Trade Liberalization and the Developing Countries, 2001.
MEKETA INVESTMENT GROUP EMERGING MARKET EQUITIES
4
level.7 Many of the largest developed markets are nearing or already above this level, while none of the largest emerging economies are close to it (see the following table). Hence, emerging economies are much less likely to suffer from a debt-driven headwind over the coming decade(s) than are the developed markets.
Debt Burden for the Largest Developed and Emerging Economies8
Country
Debt-to-GDP Ratio
Country
Debt-to-GDP Ratio
Brazil 61% Australia 22% China 17% France 83% India 56% Germany 79% Russia 10% Japan 226% South Africa 33% Switzerland 38% South Korea 24% United Kingdom 76% Taiwan 34% United States 59% Average: 34% Average: 83%
Finally, demographics favor emerging economies, as a greater proportion of their populations will be of working age over the next twenty years (see Appendix B for demographic data). There are numerous academic studies on the relationship between demographics and productivity that generally conclude that a higher ratio of working age population has led to higher productivity growth.9 The underlying theory is that the more “dependents” (i.e., children and the elderly) there are in a society, the more resources are allocated to their care. Hence, countries with a high proportion of working-age adults receive a “demographic dividend” in the form of increased productivity. Further, these productivity gains are even more pronounced for countries with high proportions of their populations between the ages of 40 and 49.10 Taken together, these arguments make a strong case for higher economic growth in emerging economies than in developed economies. The tables below provide GDP growth projections for some of the largest emerging and developed markets. These projections, which were developed by the International Monetary Fund, clearly show higher growth expectations for the major emerging economies than for any of the major developed economies over the next five years. While overall growth projections may change based on the economic environment, the relationship between growth in the emerging and developed markets is less likely to change in the near future.
7 Source: Reinhart and Rogoff, “Growth in a Time of Debt” (2010). 8 Source: CIA World Factbook. All data is as of December 2010. 9 Source: Bloom, Canning and Sevilla, “Economic Growth and the Demographic Transition” (2001). 10 Source: James Freyer, “Demographics and Productivity” (2005).
MEKETA INVESTMENT GROUP EMERGING MARKET EQUITIES
5
Projected Growth for the Largest Developed and Emerging Economies11
Country Projected 5-Year
Real GDP Growth
Country Projected 5-Year
Real GDP Growth
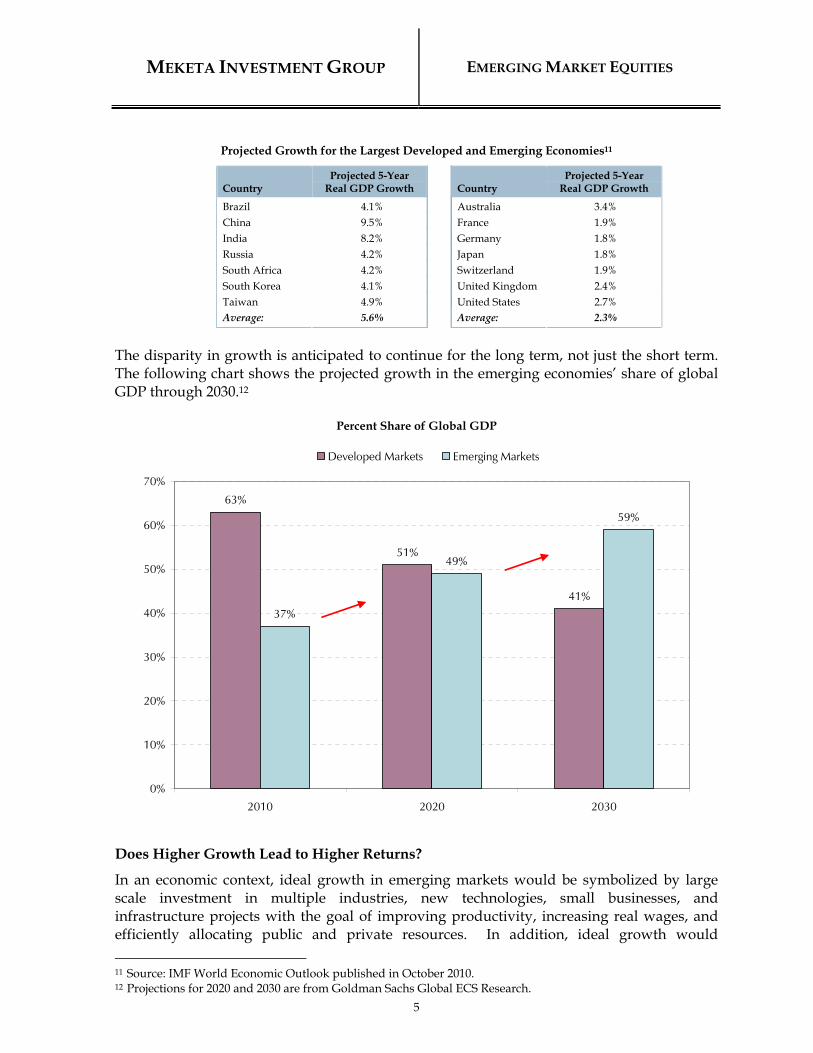
Brazil 4.1% Australia 3.4% China 9.5% France 1.9% India 8.2% Germany 1.8% Russia 4.2% Japan 1.8% South Africa 4.2% Switzerland 1.9% South Korea 4.1% United Kingdom 2.4% Taiwan 4.9% United States 2.7% Average: 5.6% Average: 2.3%
The disparity in growth is anticipated to continue for the long term, not just the short term. The following chart shows the projected growth in the emerging economies’ share of global GDP through 2030.12
Percent Share of Global GDP
63%
51%
41%37%
49%
59%
0%
10%
20%
30%
40%
50%
60%
70%
2010 2020 2030
Developed Markets Emerging Markets
Does Higher Growth Lead to Higher Returns?
In an economic context, ideal growth in emerging markets would be symbolized by large scale investment in multiple industries, new technologies, small businesses, and infrastructure projects with the goal of improving productivity, increasing real wages, and efficiently allocating public and private resources. In addition, ideal growth would
11 Source: IMF World Economic Outlook published in October 2010. 12 Projections for 2020 and 2030 are from Goldman Sachs Global ECS Research.
MEKETA INVESTMENT GROUP EMERGING MARKET EQUITIES
6
encompass the establishment and development of financial and banking systems able to effectively price risk and allocate resources. Model growth also requires the establishment and protection of property rights, widely regarded as the single most important factor in the long-term health of a free market system. In addition, the government must create a strong legal, fiscal, and financial infrastructure. The implications of such economic growth would be high personal income growth, job growth, and more disposable income (and likely consumerism). Meketa Investment Group believes that higher growth in emerging markets should lead to higher equity market returns. This is based in part on a relatively straight-forward building blocks approach to project long-term equity market returns. The model,13 shown below, is based on the theory that a region's companies will grow at roughly the same rate as its economy, as defined by GDP.
E(R) = Dividend Yield + Real GDP Growth + Inflation + Change in P-E + Currency Impact Higher economic growth does appear to have translated into better earnings growth for emerging market stocks. Indeed, emerging market companies have provided a better return on equity than have developed markets for much of the past decade (see the following table). Hence, all else equal, a market with an economy projected to grow faster should produce higher returns than slower-growing markets.
Developed vs. Emerging Markets ROE
0%
2%
4%
6%
8%
10%
12%
14%
16%
18%
20%
Jun-04
Oct-04
Feb-05
Jun-05
Oct-05
Feb-06
Jun-06
Oct-06
Feb-07
Jun-07
Oct-07
Feb-08
Jun-08
Oct-08
Feb-09
Jun-09
Oct-09
Feb-10
Jun-10
Oct-10
Feb-11
Jun-11
Emerging Developed
13 The equation is an expanded version of the basic dividend discount model. It uses real GDP growth as a proxy
for aggregate earnings growth. It allows for changes in the price investors are willing to pay for a dividend (i.e., earnings) stream and also for changes due to currency fluctuations for investments that are not denominated in the investor’s own currency.
MEKETA INVESTMENT GROUP EMERGING MARKET EQUITIES
7
The biggest determinant of future returns may, however, be the level of prices. That is, even if an economy (or a particular sub-segment, like technology stocks in the late 1990’s) is expected to grow at above average rates, there is a point at which the price paid for this higher expected growth can become unsustainable, especially if the growth estimates prove to be overly optimistic. Based on the price-earnings multiples in the summer of 2011, we do not believe that emerging market stocks broadly are priced substantially above developed market stocks. However, the data available for prices and historical earnings for emerging market should be viewed with some skepticism, as it is not nearly as transparent or robust as the equivalent data for US stocks. The historical evidence to support this argument is mixed. One study found that higher economic growth does not benefit stock market returns.14 This study argued that “although consumers and workers may benefit from economic growth, the owners of capital do not necessarily benefit.” Technological innovation, increased competition, and numerous other factors may prevent economic growth from translating to higher profitability. And it is only from profits (earning per share) that dividends are paid to existing shareholders, and such dividends may be suppressed to support capital expenditures during a period of growth. Moreover, many of the largest public companies are multi-nationals that derive their revenues from across the globe (see the table below). Hence, their profits do not depend solely on the prospects of the country in which they are domiciled. Because such multi-nationals command a large proportion of the major stock indices, the disparity between market returns in faster and slower growing economies may not be as dramatic as the disparate growth numbers imply.
Share of Multi-Nationals in Major Indices15
S&P 500 49%
MSCI EAFE 58%
MSCI EM 20%
However, a more recent study argued that, when examined over a shorter and more recent time period, there has been a positive correlation between GDP growth and public equity returns.16 Further, they argue that high expected economic growth was correlated with higher stock market returns even over longer time periods. Conceptually, it could be argued that investors are forward-looking, and hence more concerned with future growth prospects than contemporaneous growth. Hence, the publicly-traded stocks of economies that the market expects to grow faster should outperform their counter-parts.
14 Source: Ritter, J. R. “Economic growth and equity returns,” Pacific-Basin Finance Journal 13 (2005). 15 Source: FactSet. Data as of June 2011. Multi-nationals are defined as companies with Foreign Sales greater than
or equal to 25%. 16 Source: Goldman Sachs Asset Management, Linking GDP Growth and Equity Returns, May 2011.
MEKETA INVESTMENT GROUP EMERGING MARKET EQUITIES
8
EMERGING EQUITY MARKET RETURNS
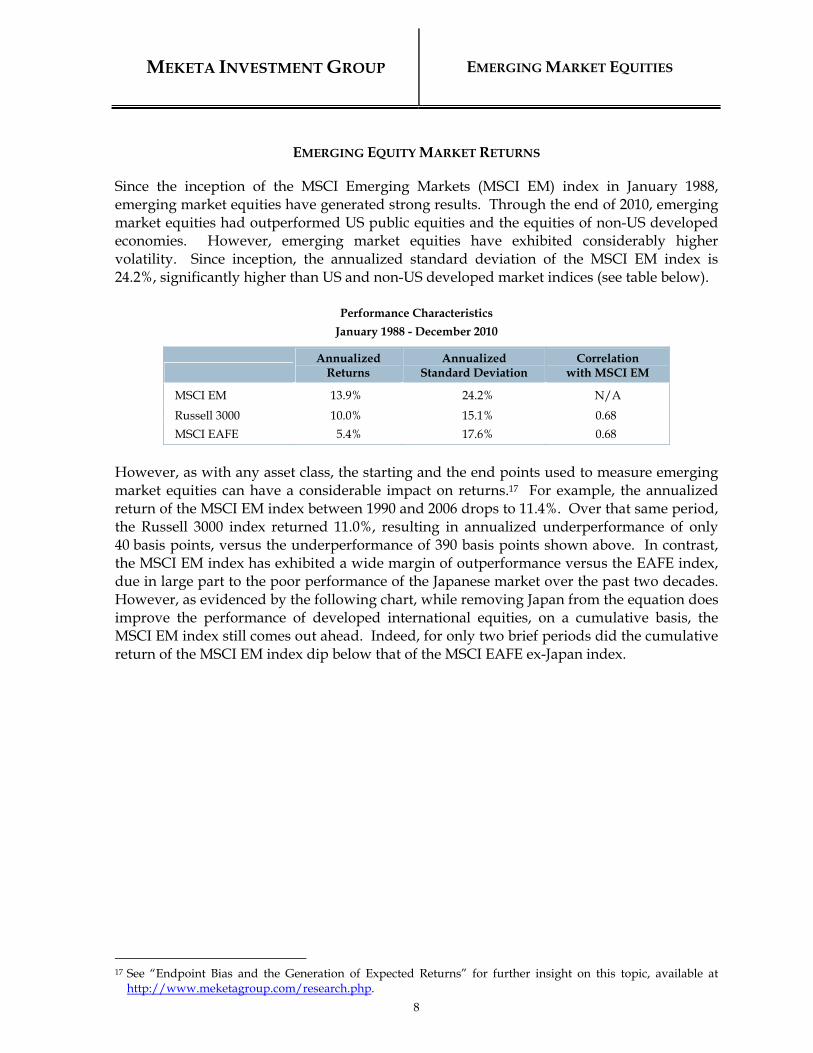
Since the inception of the MSCI Emerging Markets (MSCI EM) index in January 1988, emerging market equities have generated strong results. Through the end of 2010, emerging market equities had outperformed US public equities and the equities of non-US developed economies. However, emerging market equities have exhibited considerably higher volatility. Since inception, the annualized standard deviation of the MSCI EM index is 24.2%, significantly higher than US and non-US developed market indices (see table below).
Performance Characteristics
January 1988 - December 2010
Annualized
Returns Annualized
Standard Deviation Correlation
with MSCI EM
MSCI EM 13.9% 24.2% N/A
Russell 3000 10.0% 15.1% 0.68
MSCI EAFE 5.4% 17.6% 0.68
However, as with any asset class, the starting and the end points used to measure emerging market equities can have a considerable impact on returns.17 For example, the annualized return of the MSCI EM index between 1990 and 2006 drops to 11.4%. Over that same period, the Russell 3000 index returned 11.0%, resulting in annualized underperformance of only 40 basis points, versus the underperformance of 390 basis points shown above. In contrast, the MSCI EM index has exhibited a wide margin of outperformance versus the EAFE index, due in large part to the poor performance of the Japanese market over the past two decades. However, as evidenced by the following chart, while removing Japan from the equation does improve the performance of developed international equities, on a cumulative basis, the MSCI EM index still comes out ahead. Indeed, for only two brief periods did the cumulative return of the MSCI EM index dip below that of the MSCI EAFE ex-Japan index.
17 See “Endpoint Bias and the Generation of Expected Returns” for further insight on this topic, available at
http://www.meketagroup.com/research.php.
MEKETA INVESTMENT GROUP EMERGING MARKET EQUITIES
9
Cumulative Returns
1
10
100
1988
1989
1990
1991
1992
1993
1994
1995
1996
1997
1998
1999
2000
2001
2002
2003
2004
2005
2006
2007
2008
2009
2010
Emerging Markets EAFE EAFE ex-Japan
1903%
238%
624%
Individual emerging markets have the ability to deliver spectacular or spectacularly bad returns over one- or two-year periods. The following table provides a stark contrast of substantial short-term gains versus significant and sometimes long-term losses. Note that an 80% decline requires a subsequent 400% gain to offset that loss. Such volatility in individual markets explains why most investors build a diversified portfolio when allocating to emerging markets.
Cumulative Returns of MSCI Country Markets
Substantial Gains Significant Draw Downs
Argentina 1993 336% 1992-2001 -72% Russia 1990-1991 431% 1998 -83% Thailand 1996-1997 454% 1995-2001 -89% Indonesia 1993-1994 102% 1994-2002 -85%
The following chart demonstrates the year-over-year volatility in returns. Since the inception of the MSCI EM index, the returns have been negative in nine of the twenty-three years. Indeed, after the first six years of performance, the index posted losses in seven out of the next thirteen years, although it managed an aggregate gain over the period. In contrast, since 2003, the index has only had one negative calendar year (2008).
The chart illustrates the losses that resulted from the various emerging market crises that occurred in the 1990s. Many of crises that started in individual countries spread quickly as the local economies were exposed to similar risks (e.g., a decline in commodity prices) or generally not equipped to deal with large shifts in foreign cash flows. Over the past decade, many emerging market economies built up large foreign exchange reserves, primarily due to exports to a voracious US consumer. In addition, large increases in commodity prices have added to government coffers as many emerging economies are net producers of commodities. Importantly, and contrary to historical trends, these governments have used the capital to pay down debt, to encourage consumer demand, and to shore up their financial systems. In addition, numerous emerging markets have opened up to foreign ownership in what were formerly seen as “key industries,” such as banks and manufacturing. In aggregate, we believe these changes have led to a more stable group of markets with lower idiosyncratic risks than investors came to expect after the 1990s. The following chart18 shows that earnings within emerging markets have kept pace with the MSCI EM index (before dividends), indicating that much of the strong returns have been a result of earnings growth, not speculation.
18 Source: MSCI, FactSet
MEKETA INVESTMENT GROUP EMERGING MARKET EQUITIES
11
The MSCI Emerging Markets Equity Index and Emerging Markets Earnings
0
0.5
1
1.5
2
2.5
3
3.5
4
Jan-01
Jul-01
Jan-02
Jul-02
Jan-03
Jul-03
Jan-04
Jul-04
Jan-05
Jul-05
Jan-06
Jul-06
Jan-07
Jul-07
Jan-08
Jul-08
Jan-09
Jul-09
Jan-10
Jul-10
Ind
exed
to 1
EM Earnings MSCI EM Price Index
RISK DIVERSIFICATION BENEFITS
Theoretically, the greater the risk associated with a particular investment opportunity, the greater the reward to be sought by the investor. Emerging markets have arguably rewarded investors for the numerous risks they present. However, plan sponsors should also consider whether an allocation to emerging markets would benefit an institutional portfolio from a diversification perspective. The following table shows that emerging market equities have exhibited a modest correlation with the MSCI EAFE and Russell 3000 indices, and no correlation with the Barclays Aggregate index, suggesting that there are diversification benefits to be gained by adding emerging market equities to a portfolio that contains these other major asset classes.
Correlation with MSCI EM
1988 - 2010
MSCI EAFE 0.68
Russell 3000 0.68
Barclays Aggregate 0.01
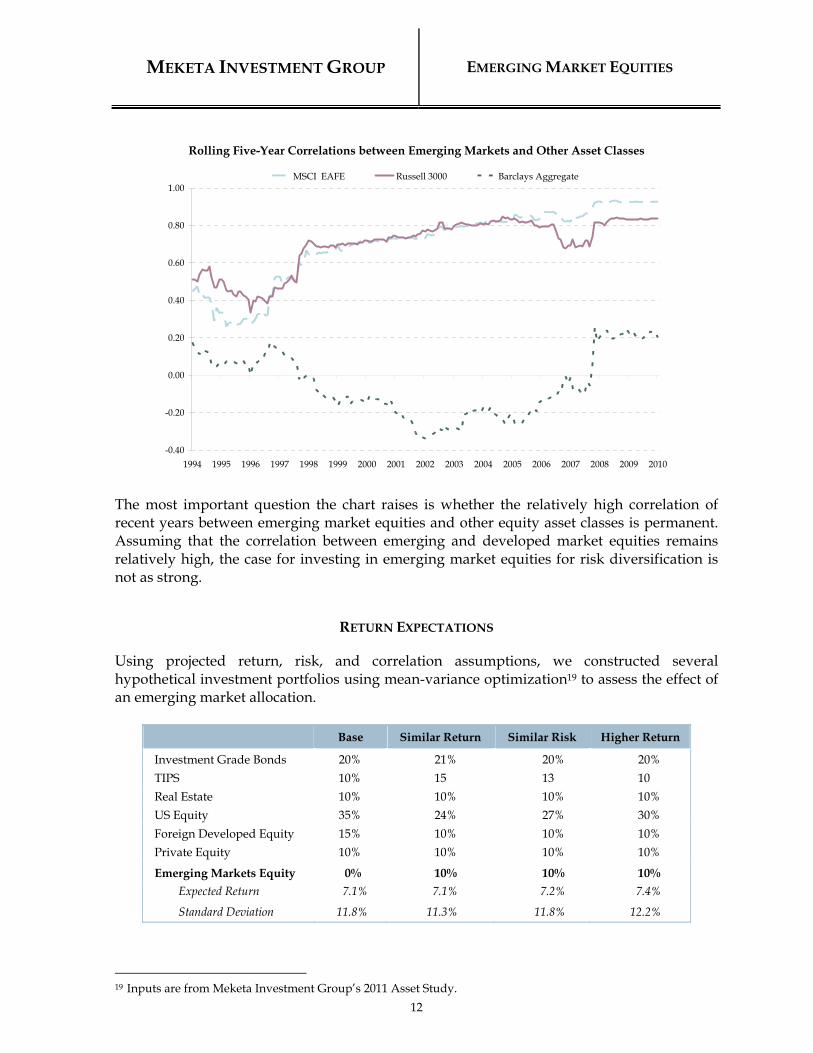
However, the correlation between the returns of emerging market equities and other major asset classes has been volatile. Moreover, as shown in the following chart, the correlations between the equity asset classes have been steadily rising, except during the Global Financial Crisis in 2008.
MEKETA INVESTMENT GROUP EMERGING MARKET EQUITIES
12
Rolling Five-Year Correlations between Emerging Markets and Other Asset Classes
The most important question the chart raises is whether the relatively high correlation of recent years between emerging market equities and other equity asset classes is permanent. Assuming that the correlation between emerging and developed market equities remains relatively high, the case for investing in emerging market equities for risk diversification is not as strong.
RETURN EXPECTATIONS
Using projected return, risk, and correlation assumptions, we constructed several hypothetical investment portfolios using mean-variance optimization19 to assess the effect of an emerging market allocation.
19 Inputs are from Meketa Investment Group’s 2011 Asset Study.
MEKETA INVESTMENT GROUP EMERGING MARKET EQUITIES
13
As the table above shows, the addition of emerging market equities allows for more efficient portfolios when using a mean-variance framework. By adding an allocation to emerging markets at the expense of developed (US and foreign) market equities, while adjusting the bond allocation as necessary, a plan sponsor can construct a portfolio that either has a higher expected return for the same level of risk, or a lower level of risk for the same expected return.
IMPLEMENTATION ISSUES
Passive and Active Management
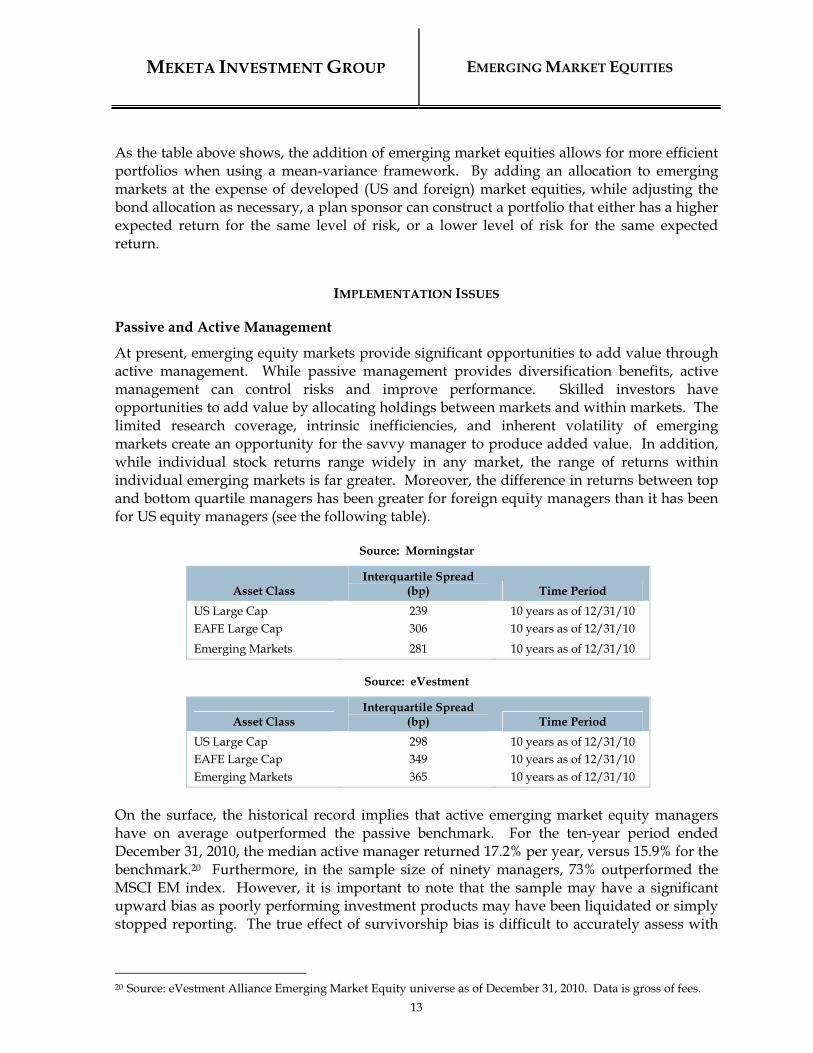
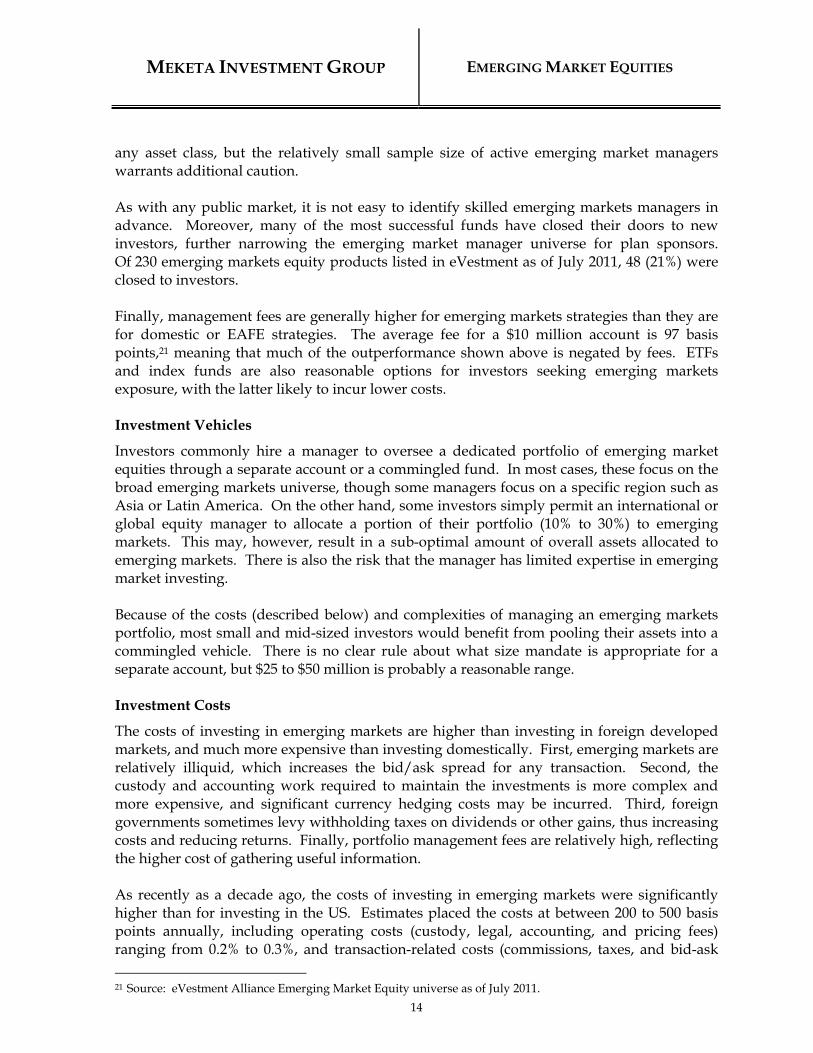
At present, emerging equity markets provide significant opportunities to add value through active management. While passive management provides diversification benefits, active management can control risks and improve performance. Skilled investors have opportunities to add value by allocating holdings between markets and within markets. The limited research coverage, intrinsic inefficiencies, and inherent volatility of emerging markets create an opportunity for the savvy manager to produce added value. In addition, while individual stock returns range widely in any market, the range of returns within individual emerging markets is far greater. Moreover, the difference in returns between top and bottom quartile managers has been greater for foreign equity managers than it has been for US equity managers (see the following table).
Source: Morningstar
Asset Class Interquartile Spread
(bp) Time Period
US Large Cap 239 10 years as of 12/31/10 EAFE Large Cap 306 10 years as of 12/31/10
Emerging Markets 281 10 years as of 12/31/10
Source: eVestment
Asset Class Interquartile Spread
(bp) Time Period
US Large Cap 298 10 years as of 12/31/10 EAFE Large Cap 349 10 years as of 12/31/10 Emerging Markets 365 10 years as of 12/31/10
On the surface, the historical record implies that active emerging market equity managers have on average outperformed the passive benchmark. For the ten-year period ended December 31, 2010, the median active manager returned 17.2% per year, versus 15.9% for the benchmark.20 Furthermore, in the sample size of ninety managers, 73% outperformed the MSCI EM index. However, it is important to note that the sample may have a significant upward bias as poorly performing investment products may have been liquidated or simply stopped reporting. The true effect of survivorship bias is difficult to accurately assess with
20 Source: eVestment Alliance Emerging Market Equity universe as of December 31, 2010. Data is gross of fees.
MEKETA INVESTMENT GROUP EMERGING MARKET EQUITIES
14
any asset class, but the relatively small sample size of active emerging market managers warrants additional caution. As with any public market, it is not easy to identify skilled emerging markets managers in advance. Moreover, many of the most successful funds have closed their doors to new investors, further narrowing the emerging market manager universe for plan sponsors. Of 230 emerging markets equity products listed in eVestment as of July 2011, 48 (21%) were closed to investors. Finally, management fees are generally higher for emerging markets strategies than they are for domestic or EAFE strategies. The average fee for a $10 million account is 97 basis points,21 meaning that much of the outperformance shown above is negated by fees. ETFs and index funds are also reasonable options for investors seeking emerging markets exposure, with the latter likely to incur lower costs. Investment Vehicles
Investors commonly hire a manager to oversee a dedicated portfolio of emerging market equities through a separate account or a commingled fund. In most cases, these focus on the broad emerging markets universe, though some managers focus on a specific region such as Asia or Latin America. On the other hand, some investors simply permit an international or global equity manager to allocate a portion of their portfolio (10% to 30%) to emerging markets. This may, however, result in a sub-optimal amount of overall assets allocated to emerging markets. There is also the risk that the manager has limited expertise in emerging market investing. Because of the costs (described below) and complexities of managing an emerging markets portfolio, most small and mid-sized investors would benefit from pooling their assets into a commingled vehicle. There is no clear rule about what size mandate is appropriate for a separate account, but $25 to $50 million is probably a reasonable range. Investment Costs
The costs of investing in emerging markets are higher than investing in foreign developed markets, and much more expensive than investing domestically. First, emerging markets are relatively illiquid, which increases the bid/ask spread for any transaction. Second, the custody and accounting work required to maintain the investments is more complex and more expensive, and significant currency hedging costs may be incurred. Third, foreign governments sometimes levy withholding taxes on dividends or other gains, thus increasing costs and reducing returns. Finally, portfolio management fees are relatively high, reflecting the higher cost of gathering useful information. As recently as a decade ago, the costs of investing in emerging markets were significantly higher than for investing in the US. Estimates placed the costs at between 200 to 500 basis points annually, including operating costs (custody, legal, accounting, and pricing fees) ranging from 0.2% to 0.3%, and transaction-related costs (commissions, taxes, and bid-ask
21 Source: eVestment Alliance Emerging Market Equity universe as of July 2011.
MEKETA INVESTMENT GROUP EMERGING MARKET EQUITIES
15
spreads) ranging from 1.1% to 4.0%22. However, as technology has improved (e.g., electronic trading and computerized custody systems) and trading volumes have increased, these costs have come more in line with those of the developed markets. As with US stocks, larger cap, more liquid names have lower bid-ask spreads. As of 2010, this spread was roughly 30 basis points for the largest quintile of emerging market stocks23. Many of the duties, taxes, and fees imposed by individual countries (e.g., a 10 basis point stamp duty in China) remain in place. While the total costs incurred by investing in emerging markets is still higher than for investing in US stocks, it is relatively small compared to the potential benefits. Furthermore, as markets become more “globalized,” these costs should continue to decline. Currency Hedging
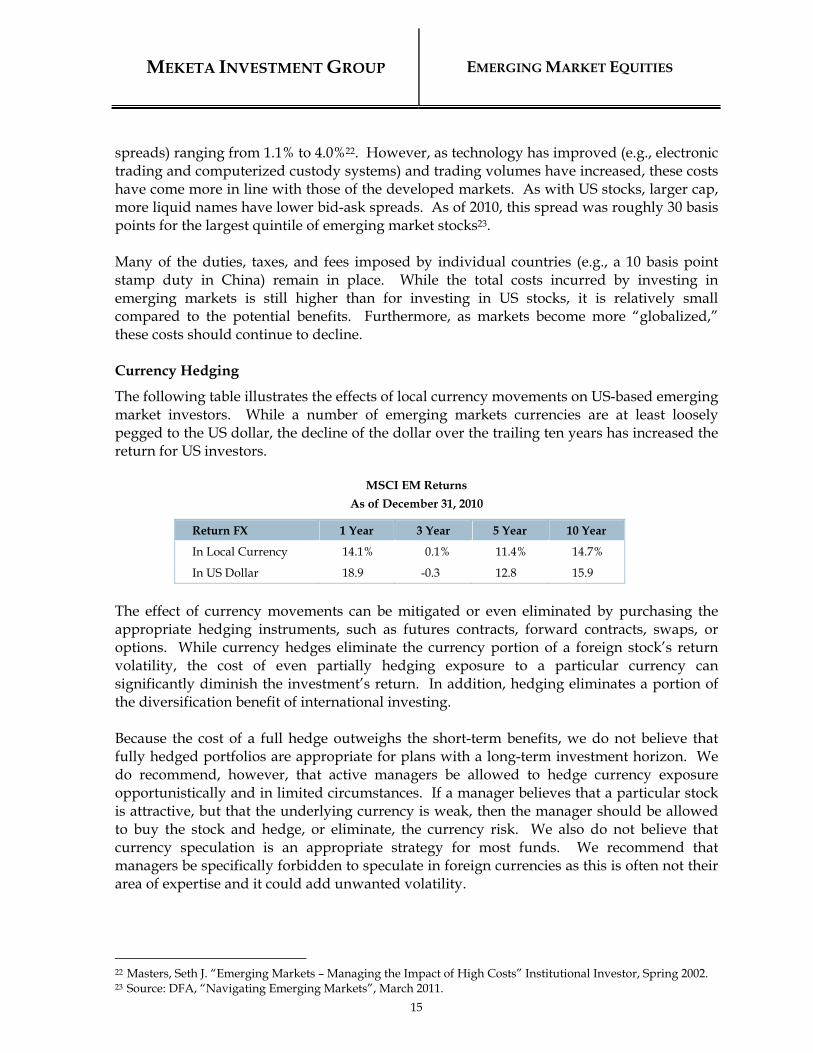
The following table illustrates the effects of local currency movements on US-based emerging market investors. While a number of emerging markets currencies are at least loosely pegged to the US dollar, the decline of the dollar over the trailing ten years has increased the return for US investors.
MSCI EM Returns
As of December 31, 2010
Return FX 1 Year 3 Year 5 Year 10 Year
In Local Currency 14.1% 0.1% 11.4% 14.7%
In US Dollar 18.9 -0.3 12.8 15.9
The effect of currency movements can be mitigated or even eliminated by purchasing the appropriate hedging instruments, such as futures contracts, forward contracts, swaps, or options. While currency hedges eliminate the currency portion of a foreign stock’s return volatility, the cost of even partially hedging exposure to a particular currency can significantly diminish the investment’s return. In addition, hedging eliminates a portion of the diversification benefit of international investing. Because the cost of a full hedge outweighs the short-term benefits, we do not believe that fully hedged portfolios are appropriate for plans with a long-term investment horizon. We do recommend, however, that active managers be allowed to hedge currency exposure opportunistically and in limited circumstances. If a manager believes that a particular stock is attractive, but that the underlying currency is weak, then the manager should be allowed to buy the stock and hedge, or eliminate, the currency risk. We also do not believe that currency speculation is an appropriate strategy for most funds. We recommend that managers be specifically forbidden to speculate in foreign currencies as this is often not their area of expertise and it could add unwanted volatility.
22 Masters, Seth J. “Emerging Markets – Managing the Impact of High Costs” Institutional Investor, Spring 2002. 23 Source: DFA, “Navigating Emerging Markets”, March 2011.
MEKETA INVESTMENT GROUP EMERGING MARKET EQUITIES
16
EVENT RISK
The harsh reality of the investment environment surrounding emerging market assets advanced to the forefront of investors’ minds in 1997 and 1998 with the arrival of the Asian Financial Crisis, along with subsequent crises involving a huge default by Russia on its sovereign debt. Events such as these led to massive investment losses that still permeate the minds of many investors. Yet, emerging markets have demonstrated a tendency to rebound quickly, and significantly, after major negative events. Detrimental events can occur in any country or region regardless of whether they are classified as developed or emerging. The two groups are now so integrated that systemic events such as the Global Financial Crisis of 2007-08 may pose a greater threat. Still, it is often the structure of a country’s legal and legislative infrastructure that affects the severity of their impact on investors. Countries with weak institutions may have suffered from greater macroeconomic volatility historically24. As has been discussed throughout this paper, many emerging markets have focused in the past decade on improving their financial stability. They have done so by becoming less reliant on foreign borrowing, and more importantly, converting their debt to their local currency. The former structure of most sovereign debts being issued in foreign currencies was a recipe for fiscal disaster when currencies began to fluctuate. This has also given them the ability to control their own monetary policy. Hence, while the risk of a significant economic event effecting emerging market investors has not disappeared, it has greatly diminished relative to similar risks posed by more developed economies.
POLITICAL RISKS
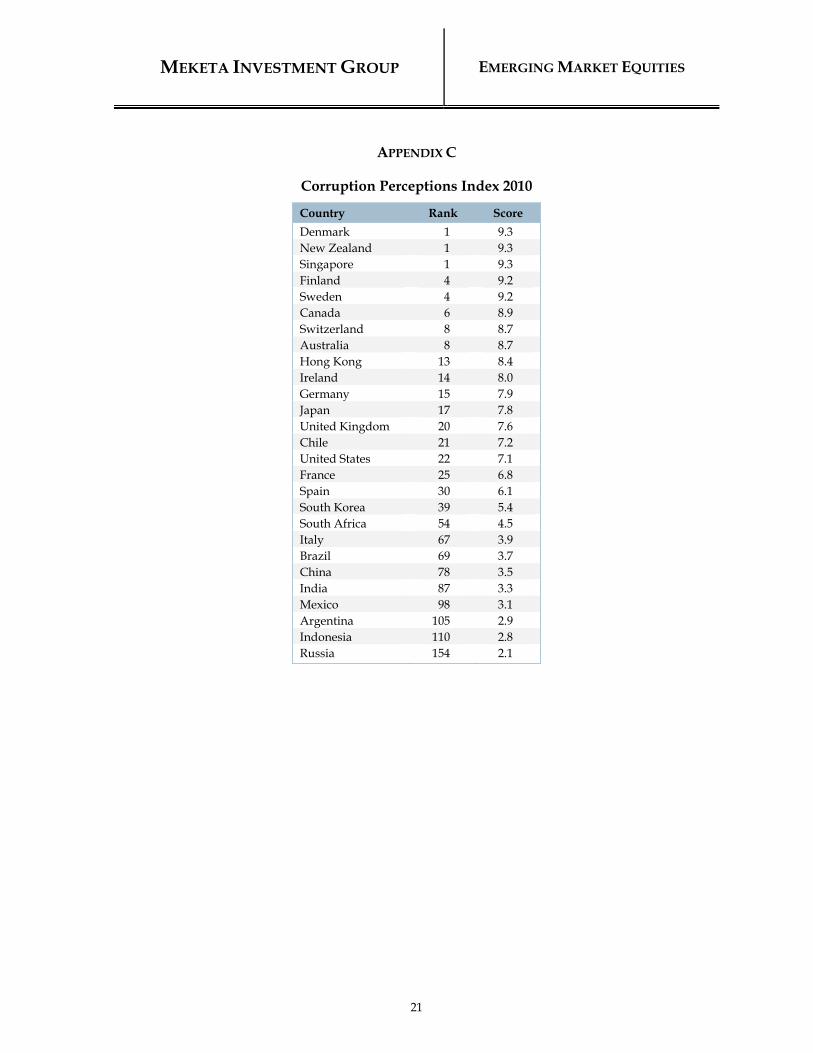
When assets are invested outside domestic markets, civil insurrection, repudiation of debts, and the state seizure of private assets are possibilities that must be considered. Even in a less extreme context, new legislation may alter tax laws, place limits on foreign ownership of domestic assets, or introduce regulatory or accounting costs to businesses. Corruption, graft, and corporate theft may prevent economic growth from translating into earnings growth for public shareholders. These represent political risks that are separate from ordinary market risks. Various entities have attempted to measure political risk. For example, they may attempt to measure the level of corruption or economic freedom (e.g., property rights, flexibility in the movement of labor, capital, and goods) in a country. Unsurprisingly, emerging market countries tend to fare less well in these measures than do developed markets countries. Most of the EAFE countries and the US rank within the top thirty of the Corruption Perceptions Index25 (i.e., they are the least corrupt). However, almost all of the major
24 Source: Daron Acemoglu, Simon Johnson, James Robinson, and Yunyong Thaicharoen, “Institutional Causes,
Macroeconomic Symptoms: Volatility, Crises and Growth” (2002). 25 Source: Transparency International, “Corruption Perceptions Index 2010”.
MEKETA INVESTMENT GROUP EMERGING MARKET EQUITIES
17
countries in the MSCI Emerging Markets index (with the notable exception of Russia) also fall within the top half of those rankings (see Appendix C). Similarly, most of the developed markets rank fairly highly in the Index of Economic Freedom,26 while most of the emerging market countries fall in the middle two quartiles (see Appendix D).
RECOMMENDATION
The prospects for emerging markets appear to be bright. Whereas in the past their growth was dependent on the more developed economies, that relationship appears to have changed, if not reversed. While emerging countries differ significantly in their attributes and prospects, we believe that, as a group, they present the potential for higher returns than what investors should expect from developed market. However, by their very nature, emerging market investments should continue to be volatile. Meketa Investment Group believes that emerging market investing is appropriate for long-term portfolios. We recommend that plan sponsors with large, well-diversified portfolios consider allocating up to 10% of total assets (or about one-third of their equity portfolio) to emerging markets. This essentially represents their level of importance in the global economy and their potential as a driver of long-term performance. Meketa Investment Group believes that both active and passive management are appropriate for gaining exposure to emerging markets. We believe that truly skilled active managers can add value in emerging markets, but that finding them is a difficult task, especially since some of the best managers may not be open to new investors. We also recommend a dedicated emerging markets mandate, as many international or global equity managers limit emerging markets to less than 20% of their portfolios. The decision about hedging currency should be made by the plan sponsor in the context of their entire portfolio’s exposure to foreign currencies. While we suggest that plan sponsors not explicitly hedge their emerging market portfolios, we believe that managers should be allowed to hedge currency opportunistically. Derivatives should be used primarily to control risk rather than as a speculative tool. We believe that constraints regarding country- or issue-specific weightings should be determined by the plan sponsor and the manager, rather than be dictated by the benchmark.
26 Source: Heritage Institute, “2011 Index of Economic Freedom”.
MEKETA INVESTMENT GROUP EMERGING MARKET EQUITIES
18
APPENDIX A
Benchmarking
The most commonly used benchmark for measuring the performance of emerging market equities is the MSCI Emerging Markets index. MSCI developed its initial index in late 1987, the MSCI Emerging Markets Free index. In 2004, MSCI dropped “Free” from the name. MSCI uses a capitalization-weighted approach to constructing its benchmark. However, MSCI frequently adjusts the weightings of individual country markets in the index based on the assumption that active managers would not be as country/regionally concentrated as the index frequently is. There are several major concerns with emerging equity benchmarks. The first is the potentially high concentration of certain markets or regions in the index. Perhaps the best explanation of this is the notion that foreign investment in emerging markets can be highly cyclical on a regional and country basis. Historically, emerging countries often found the attention of foreign investors (and their capital) when the government privatized certain industries or individual companies. These companies, many of which were previously state-owned, are attractive due to monopolistic advantages they enjoy in their home markets. Foreign investors increased their investment in these markets, leading to larger market capitalizations. Another explanation is that the various levels of economic, political, and social development in each emerging market cause them to evolve at different paces. Therefore, different countries and regions will dominate at different times. The Asian Financial Crisis is a good example. Throughout the first half of 1996, emerging Asian countries began to open various industries to foreign investment. During this period, Far East countries accounted for 44% of the MSCI EM index, based on market capitalization. Two years after the Crisis, these countries comprised only 28% of the index. By the end of 2002, Far East countries again dominated the index, comprising 49% of the country constituents. The following chart provides an example of the changing allocations represented by individual/regional markets. Note that it shows more gradual changes over the past decade.
Latin America Far East Middle East/Central Asia South Africa
MEKETA INVESTMENT GROUP EMERGING MARKET EQUITIES
19
The second major issue is that of individual security weights within each market and within the index as a whole. The top ten companies in the S&P 500 index accounted for approximately 37% of the overall market capitalization of that index as of December 31, 2010. Although this may seem high, it compares favorably to many country-specific emerging market indices, in which the top ten holdings can account for up to 60% of the index capitalization. The table below demonstrates how concentrated local markets may be, and how widely that concentration varies. For example, Gazprom dominates the Russian public equity landscape, while 63% of Brazil’s country index can be accounted for in the issues of only ten companies. Of the 815 companies in the MSCI EM index, the top five companies account for 10% of the overall market cap.
% of Overall Country Index Capitalization
As of December 31, 2010
Country Top 1 Top 3 Top 5 Top 10
Brazil 11% 29% 45% 63%
China 9 22 33 50
India 11 28 38 52
Russia 27 49 61 78
South Africa 11 28 41 58
Taiwan 13 26 32 45
The benchmarks are constructed to best represent the overall investable universe of emerging markets, and are comprised of the most liquid stocks in the most liquid emerging markets. Therefore, Korea dominates the index precisely because Korea offers not only the greatest investable market for foreign investors, but also the largest market capitalization. Despite concerns surrounding the effectiveness of emerging market benchmarks as true representatives of emerging market performance, they do offer a useful indicator of whether an active manager can add value through country and industry allocation, as well as security selection. It is prudent, however, to incorporate individual country and industry indices into the performance analysis used to assess a manager’s skill.
Poland $25,788 37,349,696 16.9% Taiwan $49,023 23,213,741 16.4% Russia $22,717 128,180,396 15.7% S Korea $40,777 49,372,307 15.1% Thailand $12,681 70,643,689 14.9% Brazil $15,193 231,886,946 14.1% Indonesia $6,556 278,502,882 14.0% China $13,729 1,394,638,699 13.7% Argentina $21,282 47,164,630 13.4% Australia $48,669 25,053,669 13.3% India $5,398 1,396,046,308 13.1% Mexico $18,339 130,198,692 13.1% Switzerland $49,052 7,774,334 12.9% Japan $40,806 117,816,135 12.6% UK $42,058 67,243,723 12.4% US $57,320 357,451,620 12.3% Israel $35,202 8,984,285 12.2% France $40,568 68,481,838 12.2% Germany $44,365 79,226,209 12.1% S Africa $13,607 48,714,478 10.8%
27 GDP per capita is as of 2016; Population and % Population 40-49 are as of mid-2025.
MEKETA INVESTMENT GROUP EMERGING MARKET EQUITIES
21
APPENDIX C
Corruption Perceptions Index 2010
Country Rank Score
Denmark 1 9.3 New Zealand 1 9.3 Singapore 1 9.3 Finland 4 9.2 Sweden 4 9.2 Canada 6 8.9 Switzerland 8 8.7 Australia 8 8.7 Hong Kong 13 8.4 Ireland 14 8.0 Germany 15 7.9 Japan 17 7.8 United Kingdom 20 7.6 Chile 21 7.2 United States 22 7.1 France 25 6.8 Spain 30 6.1 South Korea 39 5.4 South Africa 54 4.5 Italy 67 3.9 Brazil 69 3.7 China 78 3.5 India 87 3.3 Mexico 98 3.1 Argentina 105 2.9 Indonesia 110 2.8 Russia 154 2.1