Hong Kong Exchanges and Clearing Limited and The Stock Exchange of Hong Kong Limited take no responsibility for the contents of this announcement, make no representation as to its accuracy or completeness and expressly disclaim any liability whatsoever for any loss howsoever arising from or in reliance upon the whole or any part of the contents of this announcement. Melco International Development Limited (Incorporated in Hong Kong with limited liability) Website : www.melco-group.com (Stock Code : 200) OVERSEAS REGULATORY ANNOUNCEMENT (This overseas regulatory announcement is issued pursuant to Rule 13.10B of the Rules Governing the Listing of Securities on The Stock Exchange of Hong Kong Limited.) Melco Resorts & Entertainment Limited, a listed subsidiary of the Company, whose American depositary shares are listed on the NASDAQ Global Select Market in the United States, has filed a Form 6-K with the United States Securities and Exchange Commission in relation to its unaudited financial results for the second quarter ended 30 June 2018, amendment of its dividend policy and declaration of quarterly dividend. For details, please refer to the attached Form 6-K. Hong Kong, 24 July 2018 As at the date of this announcement, the board of directors of the Company comprises three Executive Directors, namely Mr. Ho, Lawrence Yau Lung (Chairman and Chief Executive Officer), Mr. Evan Andrew Winkler (President and Managing Director) and Mr. Chung Yuk Man, Clarence; two Non-executive Directors, namely Mr. Tsui Che Yin, Frank and Mr. Ng Ching Wo; and two Independent Non-executive Directors, namely Mr. Chow Kwong Fai, Edward and Dr. Tyen Kan Hee, Anthony.
Transcript
Hong Kong Exchanges and Clearing Limited and The Stock Exchange of Hong Kong Limited take no responsibility for the contents of this announcement, make no representation as to its accuracy or completeness and expressly disclaim any liability whatsoever for any loss howsoever arising from or in reliance upon the whole or any part of the contents of this announcement.
Melco International Development Limited (Incorporated in Hong Kong with limited liability)
Website : www.melco-group.com (Stock Code : 200)
OVERSEAS REGULATORY ANNOUNCEMENT
(This overseas regulatory announcement is issued pursuant to Rule 13.10B of the Rules Governing the Listing of Securities on The Stock Exchange of Hong Kong Limited.) Melco Resorts & Entertainment Limited, a listed subsidiary of the Company, whose American depositary shares are listed on the NASDAQ Global Select Market in the United States, has filed a Form 6-K with the United States Securities and Exchange Commission in relation to its unaudited financial results for the second quarter ended 30 June 2018, amendment of its dividend policy and declaration of quarterly dividend. For details, please refer to the attached Form 6-K. Hong Kong, 24 July 2018 As at the date of this announcement, the board of directors of the Company comprises three Executive Directors, namely Mr. Ho, Lawrence Yau Lung (Chairman and Chief Executive Officer), Mr. Evan Andrew Winkler (President and Managing Director) and Mr. Chung Yuk Man, Clarence; two Non-executive Directors, namely Mr. Tsui Che Yin, Frank and Mr. Ng Ching Wo; and two Independent Non-executive Directors, namely Mr. Chow Kwong Fai, Edward and Dr. Tyen Kan Hee, Anthony.
FORM 6-K
SECURITIES AND EXCHANGE COMMISSION
Washington, D.C. 20549
REPORT OF FOREIGN ISSUER
PURSUANT TO RULE 13a–16 OR 15d–16
OF THE SECURITIES EXCHANGE ACT OF 1934
For the month of July 2018
Commission File Number: 001-33178
MELCO RESORTS & ENTERTAINMENT LIMITED
36th Floor, The Centrium
60 Wyndham Street
Central
Hong Kong
(Address of principal executive offices)
Indicate by check mark whether the registrant files or will file annual reports under cover Form 20–F or Form 40–F. Form 20-F ☒Form 40-F ☐
Indicate by check mark if the registrant is submitting the Form 6-K in paper as permitted by Regulation S-T Rule 101(b)(1): ☐
Indicate by check mark if the registrant is submitting the Form 6-K in paper as permitted by Regulation S-T Rule 101(b)(7): ☐
Indicate by check mark whether by furnishing the information contained in this Form, the registrant is also thereby furnishing the
information to the Commission pursuant to Rule 12g3–2(b) under the Securities Exchange Act of 1934. Yes ☐ No ☒
If “Yes” is marked, indicate below the file number assigned to the registrant in connection with Rule 12g3–2(b): 82– N/A
MELCO RESORTS & ENTERTAINMENT LIMITED
Form 6–K
TABLE OF CONTENTS
Signature 3
Exhibit 99.1
SIGNATURE
Pursuant to the requirements of the Securities Exchange Act of 1934, the registrant has duly caused this report to be signed on its
behalf by the undersigned, thereunto duly authorized.
MELCO RESORTS & ENTERTAINMENT
LIMITED
By: /s/ Geoffrey Davis
Name: Geoffrey Davis, CFA
Title: Chief Financial Officer
Date: July 24, 2018
3
EXHIBIT INDEX
Exhibit No. Description
Exhibit 99.1 Unaudited Results for Second Quarter of 2018 and Quarterly Dividend Declaration
Exhibit 99.1
FOR IMMEDIATE RELEASE
Melco Announces Unaudited Second Quarter 2018 Earnings
and Increase in Quarterly Dividend to US$0.14505 per ADS
Macau, Tuesday, July 24, 2018 – Melco Resorts & Entertainment Limited (Nasdaq: MLCO) (“Melco” or the “Company”), a
developer, owner and operator of casino gaming and entertainment casino resort facilities in Asia, today reported its unaudited financial
results for the second quarter of 2018.
Net revenue for the second quarter of 2018 was US$1,228.6 million, representing a decrease of approximately 5% from
US$1,298.2 million reported for the comparable period in 2017. The decrease in net revenue was primarily attributable to higher
commissions reported as a reduction in revenue upon the Company’s adoption of a new revenue recognition standard issued by the
Financial Accounting Standards Board (the “New Revenue Standard”), partially offset by higher group-wide gross gaming revenues.
The Company adopted the New Revenue Standard using the modified retrospective method from January 1, 2018. Results for the
periods beginning on or after January 1, 2018 are presented under the New Revenue Standard, while prior year amounts are not adjusted
and continue to be reported in accordance with the previous basis. Under the previous basis, before the adoption of the New Revenue
Standard, net revenue for the second quarter of 2018 would have been US$1,337.4 million, which would have represented an increase
of approximately 3% from the US$1,298.2 million for the comparable period in 2017.
Operating income for the second quarter of 2018 was US$118.1 million, compared with operating income of US$127.4 million in the
second quarter of 2017, representing a decrease of 7%.
Adjusted property EBITDA(1) was US$355.5 million for the second quarter of 2018, as compared to Adjusted property EBITDA of
US$329.5 million in the second quarter of 2017, representing an increase of 8%. The year-on-year improvement in Adjusted property
EBITDA was mainly attributable to the higher contribution from City of Dreams Manila and Altira Macau.
Net income attributable to Melco Resorts & Entertainment Limited for the second quarter of 2018 was US$57.3 million, or US$0.12 per
ADS, compared with US$36.5 million, or US$0.08 per ADS, in the second quarter of 2017. The net loss attributable to noncontrolling
interests during the second quarters of 2018 and 2017 were US$4.1 million and US$8.0 million, respectively, which were related to
Studio City and City of Dreams Manila.
1
Mr. Lawrence Ho, our Chairman and Chief Executive Officer, commented, “I am delighted to announce the recent successful opening
of Morpheus, which we believe is the most luxurious integrated resort in the world. Named after the Greek god of dreams, this
US$1.1 billion iconic building is the latest addition to the Phase III development of City of Dreams, exemplifying Melco’s position as a
pioneer and innovator in premium travel, leisure and entertainment.
“Morpheus is the world’s first ever free-form exoskeleton high-rise, designed by legendary architect – the late Dame Zaha Hadid. With
a total of 772 guest rooms, suites and villas, a sky pool situated 130 meters above ground, the world’s most fashion-forward brands and
retail options, an in-house Spa Butler concept, as well as VIP gaming and VIP villas on the top floors, Morpheus offers guests world-
class experiences that exceed 5-star hotel standards.
“Morpheus offers best-of-the-best dining options including Alain Ducasse at Morpheus and Voyages by Alain Ducasse, the legendary
French chef’s restaurant inspired by his travels. Taste buds will also be awakened by Yi, which offers regional Chinese cuisine served
omakase-style, while the king of modern patisserie, Pierre Hermé, has created a sleek lounge serving the finest delicacies never seen
before in Asia. Lastly, Morpheus also features a living gallery with original contemporary art by internationally renowned artists
KAWS, Jean-Michel Othoniel and Thilo Heinzmann.
“The opening of Morpheus marks a new beginning for City of Dreams. Our premium portfolio now includes the sleek, modern
Morpheus; the chic, classic Chinese Nüwa; and the upcoming hotel Libertine, the funky rebel, which starts development in the second
half of 2019. They all offer guests premium and luxury experiences but each has its own distinctive style and design while maintaining
the same focus on quality and attention to detail.
“At Studio City, we are embarking on a series of property upgrades to refine the entertainment offerings, which include an incredible
new stunt show created with our new partner Stufish, a London-based world-renowned entertainment architect, Asia’s largest Virtual
Reality zone and a fantastic new street of food and beverage.
2
“The Board has, after evaluating the Company’s current liquidity position and future expected capital needs, decided to increase the
quarterly cash dividend by 7%.
“Lastly, Japan continues to be a core focus for us. We expect development of the next generation of integrated resorts to soon
commence in this incredibly exciting, yet currently underpenetrated, tourism destination. With our focus on the Asian premium
segment, high quality assets, dedication to world-class entertainment offerings, market-leading social safeguards and compliance
culture, and our commitment to being an ideal partner to local governments and communities alike, we believe Melco is in a strong
position to help Japan realize the vision for integrated resort development with a unique Japanese touch.”
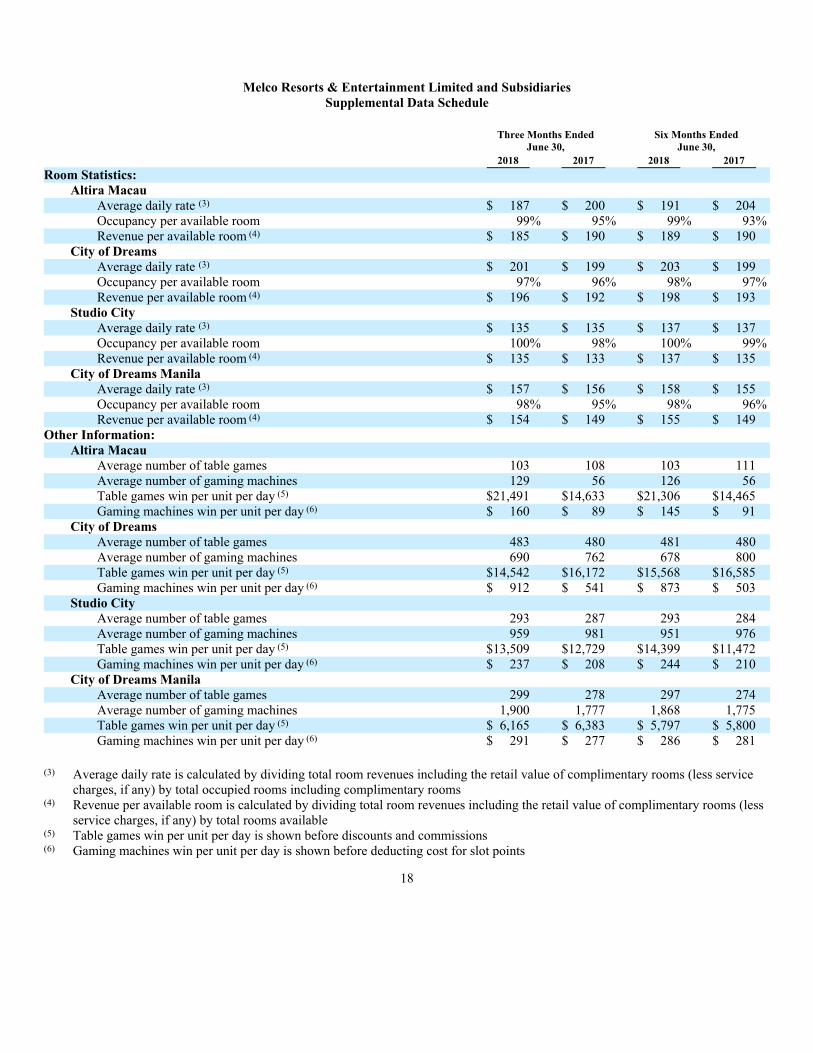
City of Dreams Second Quarter Results
For the quarter ended June 30, 2018, net revenue at City of Dreams was US$577.8 million compared to US$644.6 million in the second
quarter of 2017. City of Dreams generated Adjusted EBITDA of US$171.5 million in the second quarter of 2018 compared with
Adjusted EBITDA of US$175.3 million in the second quarter of 2017.
Rolling chip volume totaled US$10.5 billion for the second quarter of 2018 versus US$12.2 billion in the second quarter of 2017. The
rolling chip win rate was 2.9% for both quarters ended June 30, 2018 and 2017. The expected rolling chip win rate range is 2.7%-3.0%.
Mass market table games drop increased to US$1,182.4 million in the second quarter of 2018 compared with US$1,073.2 million in the
second quarter of 2017. The mass market table games hold percentage was 28.4% in the second quarter of 2018 compared to 32.4% in
the second quarter of 2017.
3
Gaming machine handle for the second quarter of 2018 was US$1,116.9 million, compared with US$937.9 million in the second quarter
of 2017. The gaming machine win rate was 5.1% in the second quarter of 2018 versus 4.0% in the second quarter of 2017.
Total non-gaming revenue at City of Dreams in the second quarter of 2018 was US$77.0 million, compared with US$74.6 million in the
second quarter of 2017.
Altira Macau Second Quarter Results
For the quarter ended June 30, 2018, net revenue at Altira Macau was US$123.1 million compared to US$107.6 million in the second
quarter of 2017. Altira Macau generated Adjusted EBITDA of US$18.3 million in the second quarter of 2018 compared with Adjusted
EBITDA of US$5.1 million in the second quarter of 2017. The year-on-year increase in Adjusted EBITDA was primarily a result of
better performance in all gaming segments.
Rolling chip volume totaled US$4.8 billion in the second quarter of 2018 versus US$4.0 billion in the second quarter of 2017. The
rolling chip win rate was 3.6% in the second quarter of 2018 versus 3.3% in the second quarter of 2017. The expected rolling chip win
rate range is 2.7%-3.0%.
In the mass market table games segment, drop totaled US$131.9 million in the second quarter of 2018, representing an increase from
US$91.9 million generated in the comparable period in 2017. The mass market table games hold percentage was 19.7% in the second
quarter of 2018 compared with 15.2% in the second quarter of 2017.
Gaming machine handle for the second quarter of 2018 was US$30.0 million, compared with US$7.6 million in the second quarter of
2017. The increase was primarily due to an increase in average number of gaming machines to 129 in the second quarter of 2018,
compared to 56 in the second quarter of 2017. The gaming machine win rate was 6.3% in the second quarter of 2018 versus 6.0% in the
second quarter of 2017.
Total non-gaming revenue at Altira Macau in the second quarter of 2018 was US$6.7 million, compared with US$6.1 million in the
second quarter of 2017.
4
Mocha Clubs Second Quarter Results
Net revenue from Mocha Clubs totaled US$28.0 million in the second quarter of 2018 as compared to US$29.3 million in the second
quarter of 2017. Mocha Clubs generated US$5.2 million of Adjusted EBITDA in the second quarter of 2018 compared with
US$5.6 million in the same period in 2017.
Gaming machine handle for the second quarter of 2018 was US$618.5 million, compared with US$592.4 million in the second quarter
of 2017. The gaming machine win rate was 4.5% in the second quarter of 2018 versus 4.8% in the second quarter of 2017.
Studio City Second Quarter Results
For the quarter ended June 30, 2018, net revenue at Studio City was US$314.1 million compared to US$332.1 million in the second
quarter of 2017. Studio City generated Adjusted EBITDA of US$73.2 million in the second quarter of 2018 compared with Adjusted
EBITDA of US$80.7 million in the second quarter of 2017. The decline in Adjusted EBITDA was primarily a result of poorer
performance in the rolling chip segment and lower non-gaming revenue, partially offset by better performance in the mass market table
games segment.
Rolling chip volume totaled US$6.1 billion for the second quarter of 2018 versus US$4.7 billion in the second quarter of 2017. The
rolling chip win rate was 2.7% in the second quarter of 2018 versus 3.3% in the second quarter of 2017. The expected rolling chip win
rate range is 2.7%-3.0%.
Mass market table games drop increased to US$814.3 million in the second quarter of 2018 compared with US$661.4 million in the
second quarter of 2017. The mass market table games hold percentage was 24.5% in the second quarter of 2018 compared to 26.8% in
the second quarter of 2017.
Gaming machine handle for the second quarter of 2018 was US$614.9 million, compared with US$502.9 million in the second quarter
of 2017. The gaming machine win rate was 3.4% in the second quarter of 2018 versus 3.7% in the second quarter of 2017.
Total non-gaming revenue at Studio City in the second quarter of 2018 was US$44.3 million, compared with US$48.6 million in the
second quarter of 2017.
5
City of Dreams Manila Second Quarter Results
For the quarter ended June 30, 2018, net revenue at City of Dreams Manila was US$173.9 million compared to US$176.2 million in the
second quarter of 2017. City of Dreams Manila generated Adjusted EBITDA of US$87.3 million in the second quarter of 2018
compared to US$62.8 million in the comparable period of 2017. The year-on-year increase in Adjusted EBITDA was primarily a result
of better performance in all gaming segments.
Rolling chip volume totaled US$3.0 billion for the second quarter of 2018 versus US$3.2 billion in the second quarter of 2017. The
rolling chip win rate was 3.7% in the second quarter of 2018 versus 3.5% in the second quarter of 2017. The expected rolling chip win
rate range is 2.7%-3.0%.
Mass market table games drop increased to US$196.9 million for the second quarter of 2018, compared with US$169.8 million in the
second quarter of 2017. The mass market table games hold percentage was 29.4% in the second quarter of 2018 compared to 28.5% in
the second quarter of 2017.
Gaming machine handle for the second quarter of 2018 was US$855.9 million, compared with US$759.0 million in the second quarter
of 2017. The gaming machine win rate was 5.9% for both quarters ended June 30, 2018 and 2017.
Total non-gaming revenue at City of Dreams Manila in the second quarter of 2018 was US$29.2 million, compared with
US$28.1 million in the second quarter of 2017.
6
Other Factors Affecting Earnings
Total net non-operating expenses for the second quarter of 2018 were US$62.5 million, which mainly included interest expenses, net of
capitalized interest, of US$61.4 million. We recorded US$10.0 million of capitalized interest during the second quarter of 2018 relating
to the development of Morpheus at City of Dreams.
Depreciation and amortization costs of US$131.8 million were recorded in the second quarter of 2018 of which US$14.3 million was
related to the amortization of our gaming subconcession and US$5.7 million was related to the amortization of land use rights.
Financial Position and Capital Expenditures
Total cash and bank balances as of June 30, 2018 were US$1.5 billion, including US$25.0 million of bank deposits with original
maturities over three months and US$47.6 million of restricted cash, primarily related to Studio City. Total debt, net of unamortized
deferred financing costs at the end of the second quarter of 2018, was US$3.5 billion.
Capital expenditures for the second quarter of 2018 were US$165.5 million, which predominantly related to Morpheus and other
various projects at City of Dreams.
Amendment of Dividend Policy
To reaffirm Melco’s commitment to returning surplus capital to shareholders, our Board, after evaluating Melco’s current liquidity
position and future expected capital needs, has amended its quarterly dividend policy from one targeting a quarterly cash dividend
payment of US$0.045 per ordinary share (equivalent to US$0.135 per ADS, each representing three ordinary shares) of the Company,
to one targeting a quarterly cash dividend payment of US$0.04835 per ordinary share (equivalent to US$0.14505 per ADS) of the
Company.
The new dividend policy will take effect beginning with any dividends declared by our Board for the second quarter of 2018 and
continue until amended or otherwise determined by our Board. Distribution of dividends under this new dividend policy is subject to the
Company’s accumulated and future earnings, cash availability and future commitments.
Our Board will continue to review our dividend policy from time to time as part of our commitment to maximizing shareholder value,
taking into consideration our financial performance and market conditions.
7
Dividend Declaration
On July 24, 2018, our Board considered and approved the declaration and payment of a quarterly dividend of US$0.04835 per ordinary
share (equivalent to US$0.14505 per ADS) for the second quarter of 2018 (the “Quarterly Dividend”). The Quarterly Dividend will be
paid on or about August 15, 2018 to our shareholders whose names appear on the register of members of the Company at the close of
business on August 6, 2018, being the record date for determination of entitlements to the Quarterly Dividend.
Conference Call Information
Melco Resorts & Entertainment Limited will hold a conference call to discuss its second quarter 2018 financial results on Tuesday,
July 24, 2018 at 8:30 a.m. Eastern Time (8:30 p.m. Hong Kong Time). To join the conference call, please use the dial-in details below:
US Toll Free 1 866 519 4004
US Toll / International 1 845 675 0437
HK Toll 852 3018 6771
HK Toll Free 800 906 601
Japan Toll 81 3 4503 6012
Japan Toll Free 012 092 5376
UK Toll Free 080 8234 6646
Australia Toll 61 290 833 212
Australia Toll Free 1 800 411 623
Philippines Toll Free 1 800 1612 0306
Passcode MLCO
An audio webcast will also be available at http://www.melco-resorts.com.
To access the replay, please use the dial-in details below:
US Toll Free 1 855 452 5696
US Toll / International 1 646 254 3697
HK Toll Free 800 963 117
Japan Toll 81 3 4580 6717
Japan Toll Free 012 095 9034
Philippines Toll Free 1 800 1612 0166
Conference ID 2498084
8
Safe Harbor Statement
This press release contains forward-looking statements. These statements are made under the “safe harbor” provisions of the U.S.
Private Securities Litigation Reform Act of 1995. Melco Resorts & Entertainment Limited (the “Company”) may also make written or
oral forward-looking statements in its periodic reports to the U.S. Securities and Exchange Commission (the “SEC”), in its annual
report to shareholders, in press releases and other written materials and in oral statements made by its officers, directors or employees to
third parties. Statements that are not historical facts, including statements about the Company’s beliefs and expectations, are forward-
looking statements. Forward-looking statements involve inherent risks and uncertainties, and a number of factors could cause actual
results to differ materially from those contained in any forward-looking statement. These factors include, but are not limited to,
(i) growth of the gaming market and visitations in Macau and the Philippines, (ii) capital and credit market volatility, (iii) local and
global economic conditions, (iv) our anticipated growth strategies, (v) gaming authority and other governmental approvals and
regulations, and (vi) our future business development, results of operations and financial condition. In some cases, forward-looking
statements can be identified by words or phrases such as “may”, “will”, “expect”, “anticipate”, “target”, “aim”, “estimate”, “intend”,
“plan”, “believe”, “potential”, “continue”, “is/are likely to” or other similar expressions. Further information regarding these and other
risks, uncertainties or factors is included in the Company’s filings with the SEC. All information provided in this press release is as of
the date of this press release, and the Company undertakes no duty to update such information, except as required under applicable law.
9
Non-GAAP Financial Measures
(1) “Adjusted EBITDA” is earnings before interest, taxes, depreciation, amortization, pre-opening costs, development costs, property
charges and other, share-based compensation, payments to the Philippine parties under the cooperative arrangement (the
“Philippine Parties”), land rent to Belle Corporation and other non-operating income and expenses. “Adjusted property EBITDA”
is earnings before interest, taxes, depreciation, amortization, pre-opening costs, development costs, property charges and other,
share-based compensation, payments to the Philippine Parties, land rent to Belle Corporation, Corporate and Other expenses and
other non-operating income and expenses. Adjusted EBITDA and adjusted property EBITDA are presented exclusively as
supplemental disclosures because management believes they are widely used to measure the performance, and as a basis for
valuation, of gaming companies. Management uses adjusted EBITDA and adjusted property EBITDA as measures of the
operating performance of its segments and to compare the operating performance of its properties with those of its competitors.
The Company also presents adjusted EBITDA and adjusted property EBITDA because they are used by some investors as ways to
measure a company’s ability to incur and service debt, make capital expenditures, and meet working capital requirements. Gaming
companies have historically reported adjusted EBITDA and adjusted property EBITDA as supplements to financial measures in
accordance with U.S. GAAP. However, adjusted EBITDA and adjusted property EBITDA should not be considered as
alternatives to operating income as indicators of the Company’s performance, as alternatives to cash flows from operating
activities as measures of liquidity, or as alternatives to any other measure determined in accordance with U.S. GAAP. Unlike net
income, adjusted EBITDA and adjusted property EBITDA do not include depreciation and amortization or interest expense and,
therefore, do not reflect current or future capital expenditures or the cost of capital. The Company compensates for these
limitations by using adjusted EBITDA and adjusted property EBITDA as only two of several comparative tools, together with
U.S. GAAP measurements, to assist in the evaluation of operating performance.
Such U.S. GAAP measurements include operating income, net income, cash flows from operations and cash flow data. The
Company has significant uses of cash flows, including capital expenditures, interest payments, debt principal repayments, taxes
and other recurring and nonrecurring charges, which are not reflected in adjusted EBITDA or adjusted property EBITDA. Also,
the Company’s calculation of adjusted EBITDA and adjusted property EBITDA may be different from the calculation methods
used by other companies and, therefore, comparability may be limited. Reconciliations of adjusted EBITDA and adjusted property
EBITDA with the most comparable financial measures calculated and presented in accordance with U.S. GAAP are provided
herein immediately following the financial statements included in this press release.
(2) “Adjusted net income” is net income before pre-opening costs, development costs, property charges and other, loss on
extinguishment of debt and costs associated with debt modification, net of noncontrolling interests and taxes calculated using
specific tax treatments applicable to the adjustments based on their respective jurisdictions. Adjusted net income attributable to
Melco Resorts & Entertainment Limited and adjusted net income attributable to Melco Resorts & Entertainment Limited per share
(“EPS”) are presented as supplemental disclosures because management believes they are widely used to measure the
performance, and as a basis for valuation, of gaming companies. These measures are used by management and/or evaluated by
some investors, in addition to income and EPS computed in accordance with U.S. GAAP, as an additional basis for assessing
period-to-period results of our business. Adjusted net income attributable to Melco Resorts & Entertainment Limited and adjusted
net income attributable to Melco Resorts & Entertainment Limited per share may be different from the calculation methods used
by other companies and, therefore, comparability may be limited. Reconciliations of adjusted net income attributable to Melco
Resorts & Entertainment Limited with the most comparable financial measures calculated and presented in accordance with U.S.
GAAP are provided herein immediately following the financial statements included in this press release.
10
About Melco Resorts & Entertainment Limited
The Company, with its American depositary shares listed on the NASDAQ Global Select Market (NASDAQ: MLCO), is a developer,
owner and operator of casino gaming and entertainment casino resort facilities in Asia. The Company currently operates Altira Macau
(www.altiramacau.com), a casino hotel located at Taipa, Macau and City of Dreams (www.cityofdreamsmacau.com), an integrated
urban casino resort located in Cotai, Macau. Its business also includes the Mocha Clubs (www.mochaclubs.com), which comprise the
largest non-casino based operations of electronic gaming machines in Macau. The Company also majority owns and operates Studio
City (www.studiocity-macau.com), a cinematically-themed integrated entertainment, retail and gaming resort in Cotai, Macau. In the
Philippines, a Philippine subsidiary of the Company currently operates and manages City of Dreams Manila
(www.cityofdreams.com.ph), a casino, hotel, retail and entertainment integrated resort in the Entertainment City complex in Manila.
For more information about the Company, please visit www.melco-resorts.com.
The Company is strongly supported by its single largest shareholder, Melco International Development Limited, a company listed on
the Main Board of The Stock Exchange of Hong Kong Limited and is substantially owned and led by Mr. Lawrence Ho, who is the
Chairman, Executive Director and Chief Executive Officer of the Company.
Note The Company adopted the New Revenue Standard using the modified retrospective method from January 1, 2018. Results for the periods beginning on or after
January 1, 2018 are presented under the New Revenue Standard, while prior year amounts are not adjusted and continue to be reported in accordance with the
previous basis.
12
Melco Resorts & Entertainment Limited and Subsidiaries
Condensed Consolidated Balance Sheets
(In thousands of U.S. dollars)
June 30, December 31,
2018 2017
(Unaudited) (Audited)
ASSETS
CURRENT ASSETS
Cash and cash equivalents $1,387,519 $ 1,408,211
Investment securities 92,334 89,874
Bank deposits with original maturities over three months 24,987 9,884
Restricted cash 47,470 45,412
Accounts receivable, net 188,323 176,544
Amounts due from affiliated companies 5,766 2,377
Inventories 36,002 34,988
Prepaid expenses and other current assets 73,999 77,503
Total current assets 1,856,400 1,844,793
PROPERTY AND EQUIPMENT, NET 5,736,756 5,730,760
GAMING SUBCONCESSION, NET 227,464 256,083
INTANGIBLE ASSETS 4,220 4,220
GOODWILL 81,915 81,915
LONG-TERM PREPAYMENTS, DEPOSITS AND OTHER ASSETS 187,567 189,645
RESTRICTED CASH 130 130
DEFERRED TAX ASSETS 81 11
LAND USE RIGHTS, NET 776,091 787,499
TOTAL ASSETS $8,870,624 $ 8,895,056
LIABILITIES AND SHAREHOLDERS’ EQUITY
CURRENT LIABILITIES
Accounts payable $ 21,953 $ 16,041
Accrued expenses and other current liabilities 1,522,002 1,563,585
Income tax payable 6,512 3,179
Capital lease obligations, due within one year 32,625 33,387
Current portion of long-term debt, net 191,147 51,032
Amounts due to affiliated companies 14,026 16,790
Total current liabilities 1,788,265 1,684,014
LONG-TERM DEBT, NET 3,337,943 3,506,530
OTHER LONG-TERM LIABILITIES 27,674 48,087
DEFERRED TAX LIABILITIES 54,781 53,994
CAPITAL LEASE OBLIGATIONS, DUE AFTER ONE YEAR 248,772 265,896
AMOUNTS DUE TO AFFILIATED COMPANIES — 919
SHAREHOLDERS’ EQUITY
Ordinary shares 14,830 14,784
Treasury shares (74) (90)
Additional paid-in capital 3,686,664 3,671,805
Accumulated other comprehensive losses (29,955) (26,610)
Accumulated losses (703,256) (772,338)
Total Melco Resorts & Entertainment Limited shareholders’ equity 2,968,209 2,887,551
Noncontrolling interests 444,980 448,065
Total equity 3,413,189 3,335,616
TOTAL LIABILITIES AND EQUITY $8,870,624 $ 8,895,056
13
Melco Resorts & Entertainment Limited and Subsidiaries
Reconciliation of Net Income Attributable to Melco Resorts & Entertainment Limited to
Adjusted Net Income Attributable to Melco Resorts & Entertainment Limited
(In thousands of U.S. dollars, except share and per share data)
Three Months Ended Six Months Ended
June 30, June 30,
2018 2017 2018 2017
(Unaudited) (Unaudited) (Unaudited) (Unaudited)
Net Income Attributable to Melco Resorts & Entertainment
Limited $ 57,273 $ 36,477 $ 213,906 $ 149,923
Pre-opening Costs 28,765 525 31,113 1,000
Development Costs 3,018 3,068 6,907 4,085
Property Charges and Other 9,637 7,063 16,183 12,527
Loss on Extinguishment of Debt — 31,459 — 31,459
Costs Associated with Debt Modification — 1,912 — 1,912
Income Tax Impact on Adjustments (179) (89) (179) (348)
Noncontrolling Interests Impact on Adjustments (478) (1,760) (1,440) (1,752)
Adjusted Net Income Attributable to Melco Resorts &
Entertainment Limited $ 98,036 $ 78,655 $ 266,490 $ 198,806