MELCOR Simulations of the Severe Accident at the Fukushima 1F3 Reactor Jeffrey Cardoni, Randall Gauntt, Donald Kalinich, Jesse Phillips Sandia National Laboratories: Albuquerque, NM 87185 Tel: (505) 844-8375; Fax: (505) 844-2829; Email:[email protected]In response to the accident at the Fukushima Daiichi nuclear power station in Japan, the US Nuclear Regulatory Commission and Department of Energy agreed to jointly sponsor an accident reconstruction study as a means of the assessing severe accident modeling capability of the MELCOR code. Objectives of the project included reconstruction of the accident progressions using computer models and accident data, and validation of the MELCOR code and the Fukushima models against plant data. I. INTRODUCTION The MELCOR 2.1 (Ref. 1) model for the 1F3 reactor simulates the thermal-hydraulic response of the reactor coolant system, primary containment, and the reactor building; this includes models for operator actions that affect the thermal-hydraulics of the plant, such as valve operation and seawater injection. The model calculates the decay heat generation in the core, fuel uncovering and heatup, core oxidation, hydrogen generation, core damage and relocation, and the degradation of support structures in the vessel. If MELCOR predicts vessel lower head failure, models exist to simulate the corium attack on concrete in the containment. Integral in this effort is the capability to calculate the fission product release from the core as it degrades and relocates, and to predict the transport of radionuclides throughout the entire plant. Ultimately, MELCOR estimates the fission product release to the environment from the severe accident at the 1F3 reactor. MELCOR can also predict hydrogen deflagrations that can damage plant structures and increase radionuclide releases to the environment. The basic plant nodalization for the 1F3 model is adopted from an existing MELCOR model for the Peach Bottom plant, which was used for the NRC’s State-of-the- Art Reactor Consequence Analysis (SOARCA). 2 Peach Bottom and 1F3 are similar power plants – both are BWR/4 reactors with a Mark I containment design. However, there exist substantial differences in power rating (3514 MWt vs. 2381 MWt for 1F3), fuel assemblies and core loading (e.g. MOX fuel), safety systems, and various dimensions of the RCS and containment. Most of the input for the 1F3 model was developed using plant data from TEPCO design documents. The model incorporates decay heat and power distribution information provided by TEPCO neutronics analyses. Certain models from the Peach Bottom deck are modified to better represent the conditions at the 1F3 plant, such as a higher-fidelity suppression chamber model that better reproduces the TEPCO containment pressures. Finally, every effort is made to include the latest known or assumed operator actions during the first four days of the accident, which have evolved significantly over time. Currently, the MELCOR 1F3 model simulates the first four days of the accident. Compared to the TEPCO pressure data, MELCOR appears to capture the essential features of the pressure response in the vessel and containment. The simulations also predict flammable conditions in the reactor building near the actual time of the explosion. II. CODE BACKGROUND MELCOR is a severe accident code developed by Sandia National Laboratories for the NRC. Its primary purpose is to simulate the evolution of accidents in light water nuclear reactors and to generate fission product source terms. MELCOR is composed of several different modules, called packages (which are fully integrated), that model the important phenomena that can occur during severe nuclear accidents. The thermal-hydraulic packages in MELCOR are based on the flexible use of control volumes, flow paths, and heat structures, which are assembled together in an appropriate manner to model the majority of the plant. Special models exist that are nuclear reactor-specific for simulating core damage phenomena, the attack on concrete by hot corium in the containment, and radionuclide behavior. 1 Modern MELCOR models are typically comprised of a few hundred control volumes, flow paths, and heat structures. In the reactor vessel, the computational mesh of fuel assemblies and other core structures for the calculation of heat transfer, core damage, oxidation, and material relocation is separate from the hydrodynamic nodalization in MELCOR. The core package (COR) in MELCOR models the core region and the lower plenum in 2-D cylindrical (axisymmetric) geometry. A typical modern core and lower plenum model in MELCOR is represented by 50-200 core cells. A separate hydrodynamic nodalization of the core and lower vessel is coupled to these core cells in order to provide thermal boundary conditions to the COR package. The upper vessel region is usually treated using only the MELCOR hydrodynamic packages; hence without corresponding input in the COR package, the structures in the upper vessel do not oxidize or relocate. Severe Accident Assessment and Management: Lessons Learned from Fukushima Dai-ichi San Diego California, November 11-15, 2012 346
Transcript
MELCOR Simulations of the Severe Accident at the Fukushima 1F3 Reactor
Jeffrey Cardoni, Randall Gauntt, Donald Kalinich, Jesse Phillips
In response to the accident at the Fukushima Daiichi
nuclear power station in Japan, the US Nuclear Regulatory Commission and Department of Energy agreed to jointly sponsor an accident reconstruction study as a means of the assessing severe accident modeling capability of the MELCOR code. Objectives of the project included reconstruction of the accident progressions using computer models and accident data, and validation of the MELCOR code and the Fukushima models against plant data.
I. INTRODUCTION
The MELCOR 2.1 (Ref. 1) model for the 1F3 reactor
simulates the thermal-hydraulic response of the reactor coolant system, primary containment, and the reactor building; this includes models for operator actions that affect the thermal-hydraulics of the plant, such as valve operation and seawater injection. The model calculates the decay heat generation in the core, fuel uncovering and heatup, core oxidation, hydrogen generation, core damage and relocation, and the degradation of support structures in the vessel. If MELCOR predicts vessel lower head failure, models exist to simulate the corium attack on concrete in the containment. Integral in this effort is the capability to calculate the fission product release from the core as it degrades and relocates, and to predict the transport of radionuclides throughout the entire plant. Ultimately, MELCOR estimates the fission product release to the environment from the severe accident at the 1F3 reactor. MELCOR can also predict hydrogen deflagrations that can damage plant structures and increase radionuclide releases to the environment.
The basic plant nodalization for the 1F3 model is adopted from an existing MELCOR model for the Peach Bottom plant, which was used for the NRC’s State-of-the-Art Reactor Consequence Analysis (SOARCA).2 Peach Bottom and 1F3 are similar power plants – both are BWR/4 reactors with a Mark I containment design. However, there exist substantial differences in power rating (3514 MWt vs. 2381 MWt for 1F3), fuel assemblies and core loading (e.g. MOX fuel), safety systems, and various dimensions of the RCS and containment. Most of the input for the 1F3 model was developed using plant data from TEPCO design documents. The model incorporates decay heat and power distribution information provided by TEPCO neutronics analyses. Certain models from the Peach Bottom deck are modified to better represent the conditions at the 1F3
Severe Accident Assessment and Management: Lessons Learned frSan Diego California, November 11-15, 2012
plant, such as a higher-fidelity suppression chamber model that better reproduces the TEPCO containment pressures. Finally, every effort is made to include the latest known or assumed operator actions during the first four days of the accident, which have evolved significantly over time.
Currently, the MELCOR 1F3 model simulates the first four days of the accident. Compared to the TEPCO pressure data, MELCOR appears to capture the essential features of the pressure response in the vessel and containment. The simulations also predict flammable conditions in the reactor building near the actual time of the explosion.
II. CODE BACKGROUND
MELCOR is a severe accident code developed by
Sandia National Laboratories for the NRC. Its primary purpose is to simulate the evolution of accidents in light water nuclear reactors and to generate fission product source terms. MELCOR is composed of several different modules, called packages (which are fully integrated), that model the important phenomena that can occur during severe nuclear accidents. The thermal-hydraulic packages in MELCOR are based on the flexible use of control volumes, flow paths, and heat structures, which are assembled together in an appropriate manner to model the majority of the plant. Special models exist that are nuclear reactor-specific for simulating core damage phenomena, the attack on concrete by hot corium in the containment, and radionuclide behavior.1
Modern MELCOR models are typically comprised of a few hundred control volumes, flow paths, and heat structures. In the reactor vessel, the computational mesh of fuel assemblies and other core structures for the calculation of heat transfer, core damage, oxidation, and material relocation is separate from the hydrodynamic nodalization in MELCOR. The core package (COR) in MELCOR models the core region and the lower plenum in 2-D cylindrical (axisymmetric) geometry. A typical modern core and lower plenum model in MELCOR is represented by 50-200 core cells. A separate hydrodynamic nodalization of the core and lower vessel is coupled to these core cells in order to provide thermal boundary conditions to the COR package. The upper vessel region is usually treated using only the MELCOR hydrodynamic packages; hence without corresponding input in the COR package, the structures in the upper vessel do not oxidize or relocate.
347om Fukushima Dai-ichi
346
III. MELCOR 2.1 MODEL FOR 1F3
III.A. Spatial nodalization and run-time
As summarized in Table I, the 1F3 model is a
relatively high-fidelity MELCOR representation of the core and reactor coolant system (RCS), and it includes the latest best practices models for the primary containment, safety relief valves (SRVs), safety systems, and reactor building for a BWR/4 reactor with a Mark I containment. The core and lower plenum are divided into 5 rings and 17 axial levels, which includes 10 axial levels for the active fuel region (for 50 total fuel cells). There is also a 6th ring in axial levels 2-4 to model the lower plenum region that extends past the radial perimeter of the core region. In total, the 1F3 MELCOR model is comprised of 88 core cells, 146 control volumes, 358 flow paths, and 172 heat structures. Nodalization diagrams of the core, reactor vessel, RCS, safety systems, primary containment, and reactor building can be found in Volume 1 of the SOARCA report.2 The only major nodalization differences between the 1F3 model and the SOARCA model are the steam lines, which are separated into four discrete lines (SOARCA used one discrete line + three lumped lines), and the nodalization of the suppression chamber, which is described in detail later in this paper. Naturally, the dimensions listed in the SOARCA document do not apply to the 1F3 model; all geometric input for the core, vessel, RCS piping, and containment has been modified according to data from TEPCO and GE design documents for 1F3.
Table I. Nodalization summary of 1F3 MELCOR model MELCOR
computational
element
Core
&
RPV
RCS &
safety
systems PCV
Reactor
building
COR cells 88 NA NA NA control volumes 57 28 21 40 flow paths 105 87 96 70 heat structures 24 37 26 85
The level of spatial discretization described in Table I
is relatively coarse compared to higher resolution CFD meshes (several million cells or more), or even to the typical plant nodalizations used in other system-level codes such as RELAP3 or TRACE4, which may consist of several hundred or thousands of elements. But by being a predominately lumped-parameter code, each computational element in MELCOR has several quantities that need to be solved for (e.g. multiple components in a core cell, multiple fluid and radionuclide properties in a control volume, and multiple nodes for a heat structure), and severe accident phenomena for nuclear reactors typically occur on relatively long time scales compared to most plant transients – several days to weeks as exemplified by the Fukushima Daiichi accidents. Such
Severe Accident Assessment and Management: Lessons Learned froSan Diego California, November 11-15, 2012
long transients necessitate hundreds of thousands to millions of time-steps in order to properly solve the governing equations in MELCOR. For example, each 96 hour simulation in this work required two- to three-million timesteps to be calculated by MELCOR, for an average timestep size on the order of 0.1 seconds. Each MELCOR simulation of 1F3 entailed ten to thirty days of CPU time on a 3.2 GHz quad-core Intel PC. Thus, although the spatial treatment of the plant may be relatively coarse in MELCOR, such simulations still require considerable CPU time on desktop PCs.
Complicating the modeling effort is the nature of the accident scenarios at the Fukushima Daiichi reactors: core damage is predicted to have occurred long after scram, e.g. 70+ hours for 1F2 and 40+ hours for 1F3, and under conditions of partial cooling from emergency water injection. Core damage and/or vessel breach may have been partially or totally mitigated by water injection into the core using fire engine pumps. These scenario “boundary conditions” complicate and prolong the progression of the core and vessel degradation in MELCOR (i.e. core degradation occurring over several hours due to seawater injection and lower decay heat at times long after scram), and this necessitates the use of small time steps over longer time periods in order to precisely simulate the problem. III.B. Improved suppression chamber (S/C) model
Previous analyses performed by ORNL, SNL,
TEPCO, JNES, and EPRI revealed a discrepancy in MELCOR and MAAP5 calculations of containment pressure, compared to the TEPCO pressure data from the plant.6,7,8,9 The thermal-hydraulic calculations were consistently under-predicting the pressurization rate in the containment during the first 22 hours of the accident. The initial 22 hours after scram are characterized by nearly continuous operation of the reactor core isolation cooling system (RCIC) and SRV-1 cycling, both of which discharge steam to the suppression chamber. (SRV-1 is the SRV with the lowest pressure set-point.) The steam discharged from RCIC turbine exhaust and SRV cycling results in a slow increase in drywell pressure due to incomplete steam condensation in the wetwell pool. Eventually the wetwell pool (or a subsection of it) is heated to saturation conditions and the pressurization of the drywell accelerates. Uncondensed steam and non-condensable gases flow from the suppression chamber into the drywell via vacuum breakers connected to the containment vent pipes.
Existing MELCOR and MAAP models used a single control volume to represent the ~6000 cubic meters of hydrodynamic volume in the torus, one downcomer flow path from a lumped vent volume to the wetwell, and one vacuum breaker flow path from the torus airspace back up to the lumped vent volume. While this may have been
348m Fukushima Dai-ichi
347
sufficient to capture the containment pressurization for other accident scenarios, this same nodalization was found to under-predict the containment pressure by 0.07-0.14 MPa (10-20 psi) for an accident scenario with extended SRV cycling and RCIC operation. The steam discharged from the SRVs and RCIC turbine is not dispersed homogenously over the entire torus, but is instead concentrated into a subsection of the torus. Azimuthal separation of the single-volume representation of the wetwell into a multi-volume representation, allowing for predictions of asymmetric heating from SRV and turbine steam discharge, is a physical model refinement that facilitates the MELCOR calculation of containment pressures that are in better agreement with TEPCO data. Besides a refined wetwell model, leakage from the seals on the recirculation pumps might also explain the some of the disagreement between the calculated containment pressures and the TEPCO data; i.e. pressurized RCS coolant would flash into steam in the containment.
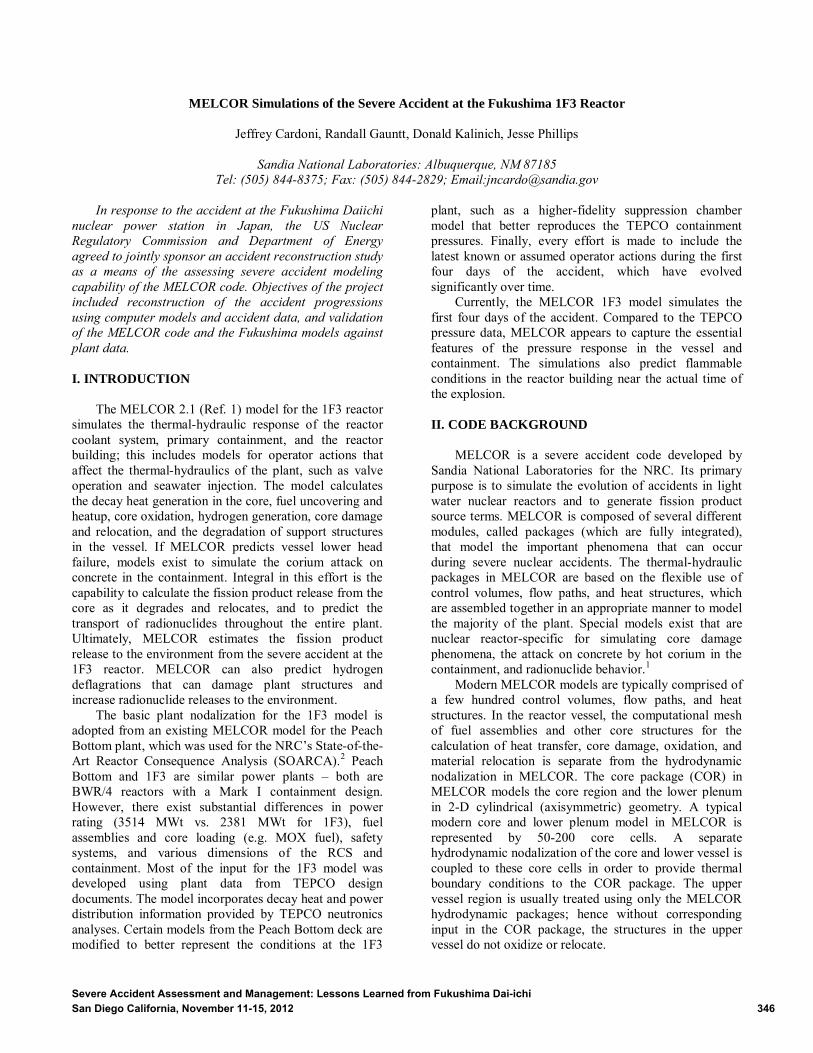
Modeling the suppression chamber with only one wetwell volume in the circumferential direction results in MELCOR under-predicting the pressure rise in the containment as SRV-1 cycles and RCIC operates (Fig. 1). The refined S/C model with 16-circumferential volumes allows for better simulation of the containment pressure. The steam discharged from SRV-1 effectively saturates a subsection of the torus before it saturates the entire wetwell pool, allowing steam to flow into the drywell via the wetwell-vent vacuum breakers. With only one control volume, MELCOR disperses the SRV steam homogenously over the entire wetwell, and the fluidic properties of the entire wetwell are converged within a single MELCOR timestep. In contrast, the 16-volume model predicts a temperature gradient across the torus, and the fluid conditions across the torus have a substantial time-delay in reaching equilibrium conditions.
Fig. 1. Drywell pressure response for 1F3 reactor compared to MELCOR models using 16- and 1-volume representations of the wetwell.
0.00
0.05
0.10
0.15
0.20
0.25
0.30
0.35
0.40
0.45
0.50
0 2 4 6 8 10 12 14 16 18 20 22 24
Pre
ssu
re [
MP
a]
time [hr]
16 azimuthal wetwell volumes
1 azimuthal wetwell volume
TEPCO drywell pressure data
RCIC stops, HPCI starts, sprays start
Severe Accident Assessment and Management: Lessons Learned fSan Diego California, November 11-15, 2012
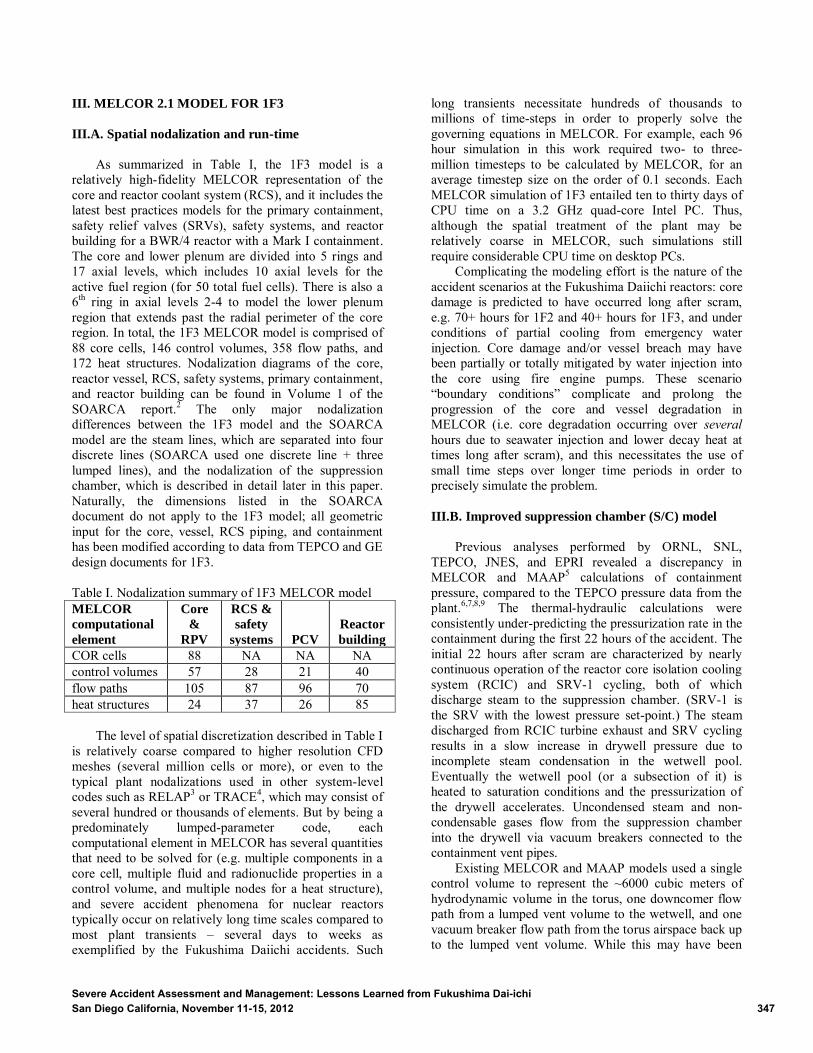
The refined wetwell model discretizes the torus into 16 equally sized control volumes. There is only 1 volume in the axial direction at each circumferential segment, and there is still the single lumped vent volume similar to the SOARCA model. [There are actually 8 vent pipes; initial models developed by ORNL used either 8 or 16 volumes in order to facilitate connectivity with the vent pipes.6] To allow thermal-hydraulic communication between the wetwell volumes, there are 16 interior flow paths connecting the circumferential volumes. The vent downcomers are separated into 16 flow paths – each is a one-way flow path from the lumped vent volume to the individual wetwell volumes. Finally, there are 16 vacuum breaker flow paths that permit flow from the wetwell back into vent volume. Similar to the vacuum breaker flow path in the SOARCA model, each of the 16 vacuum breaker flow paths in the refined model are controlled by 16 distinct valves and control functions. There may not exist 16 vacuum breakers in reality, but nonetheless the total vacuum breaker flow area is preserved in the model. Once the pressure in a particular wetwell volume exceeds the pressure in the vent volume by 0.5 psi, the “valve” for the associated vacuum breaker opens briefly allowing the pressure difference to be relieved. In this fashion, the steam discharged to the wetwell that cannot be condensed pressurizes the drywell.
Fig. 2 provides an illustration of the 16-volume wetwell model. The model is similar to the multi-volume wetwell models first investigated by ORNL analyses of 1F3 using MELCOR 1.8.5 (Ref. 6). In addition to the control volumes and flow paths shown in the figure, the model also incorporates 32 heat structures for the wetwell. The original Peach Bottom SOARCA model had 2 heat structures for the wetwell – therefore now each of the 16 circumferential volumes has 2 heat structures.
Fig. 2. Nodalization of azimuthally separated suppression chamber in 1F3 MELCOR model. Wetwell volumes are numbered from 221 to 236.
349rom Fukushima Dai-ichi
348
III.C. Decay power and inventory input
Critical to the calculation of source terms is the
accurate input of the initial core radionuclide inventory and overall decay heat. MELCOR has internal inventory data for “reference” BWR and PWR cores, as well as internal decay heat models, but plant-specific source terms require more realistic decay heat and core inventory input that are generated using neutronics codes. For example, SOARCA made use of input data generated by a series of TRITON calculations, along with auxiliary programs and core data from the licensee, for several power histories and three different cycles for the specific fuel assembly design in Peach Bottom.10 This integrated process generates radioisotope inventories and specific decay heats for each of the 50 core cells that comprise the active fuel region in the MELCOR model. Collapsed 2-D axial and radial decay power distributions calculated by neutronics codes are also important inputs for MELCOR. Variations in 2-D power distributions from plant to plant are usually considered a second order effect for MELCOR calculations of radionuclide releases to the environment. However, these effects may become more significant for accident simulations that involve partial core degradation during extended periods of partial core covering from emergency water injection. According to code predictions and TEPCO plant data for 1F3, RPV water level fluctuated below TAF and above BAF for several hours.
Initially the 1F3 model used scaled-down decay heat and inventories from the Peach Bottom SOARCA model, along with the same axial/radial power distributions, which would tend to increase the uncertainty of the MELCOR calculations. Later in the model development, TEPCO provided neutronics data for each unit at Fukushima Daiichi, which was implemented into each model to decrease model uncertainty. The TEPCO core data was post-processed into a format appropriate for MELCOR input: inventories for hundreds of isotopes and isomers were lumped into MELCOR radionuclide chemical classes, and 3-D power distributions were collapsed into 2-D axial and radial profiles over the 50 active core cells in the 1F3 model.
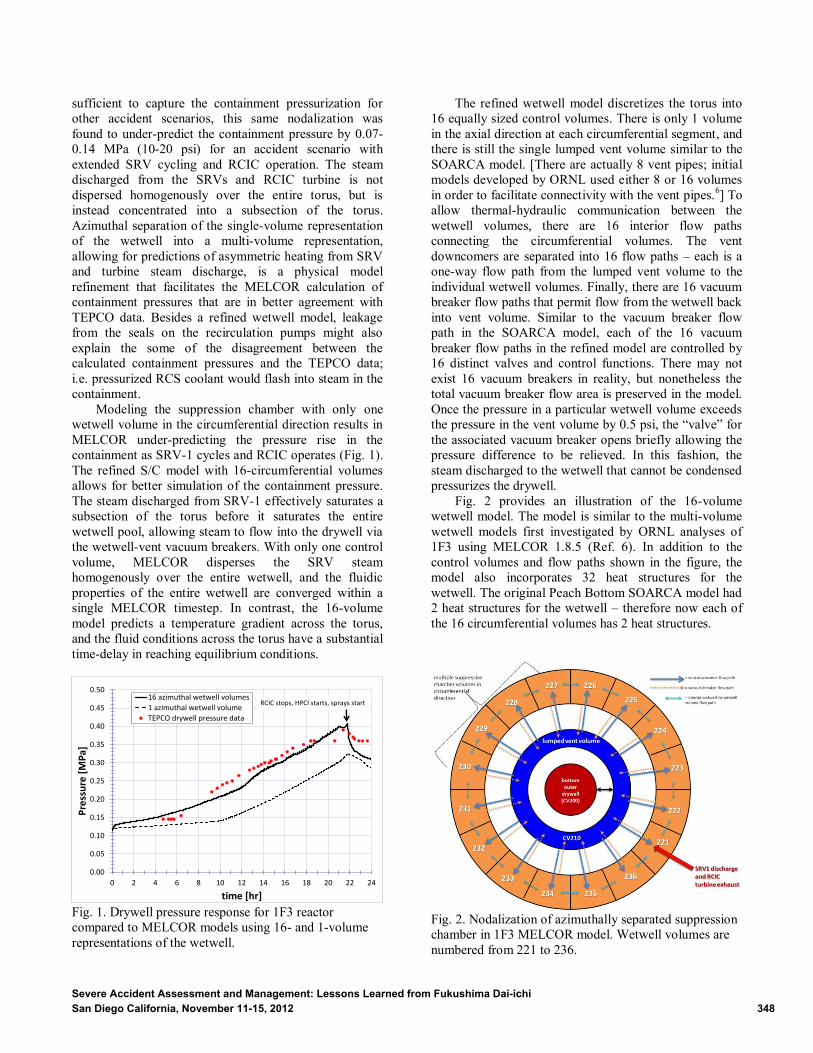
Fig. 3 shows that the original decay heat curves for the 1F3 model, obtained from scaled Peach Bottom data, overestimated the actual decay power for 1F2 and 1F3 by 5% to 20%, which is enough to significantly impact the thermal-hydraulic accident progression. The red and green curves (generated by TEPCO using ORIGEN2) are the decay powers for 1F2 and 1F3, respectively.11 It should be noted that the decay powers between these two units are very similar, despite the fact that 6% of the fuel assemblies in the 1F3 core were fuel assemblies containing MOX fuel. The original estimated decay power for 1F1 is very similar to the TEPCO-calculated decay powers. The MELCOR Fukushima models all incorporate the TEPCO-ORIGEN decay power data.6
Severe Accident Assessment and Management: Lessons Learned frSan Diego California, November 11-15, 2012
Fig. 3. Decay power vs. time after scram for 1F1, 1F2, and 1F3.
In order to accurately capture the radial distribution
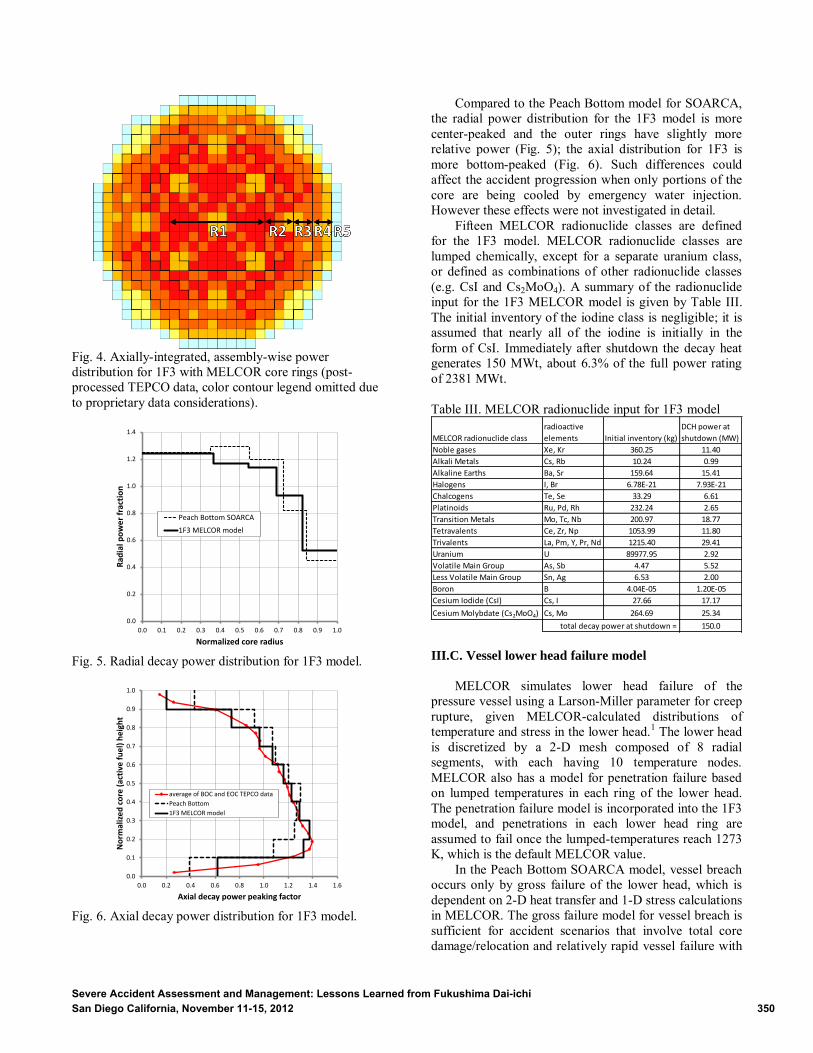
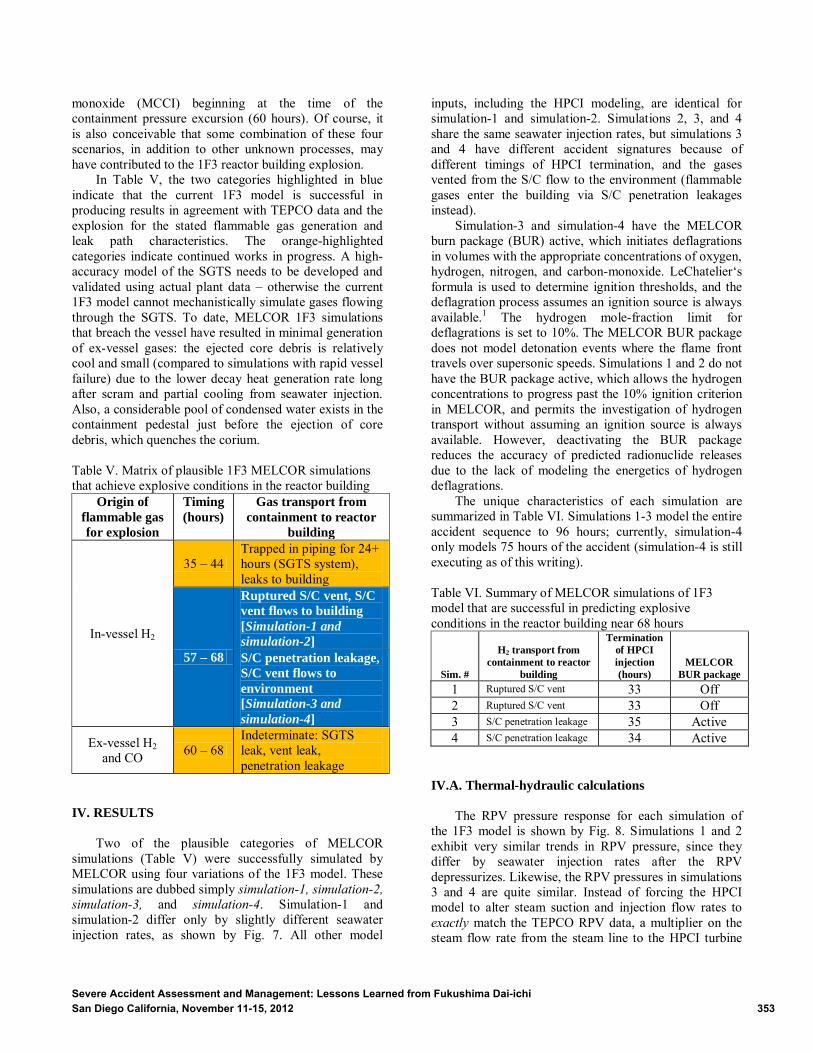
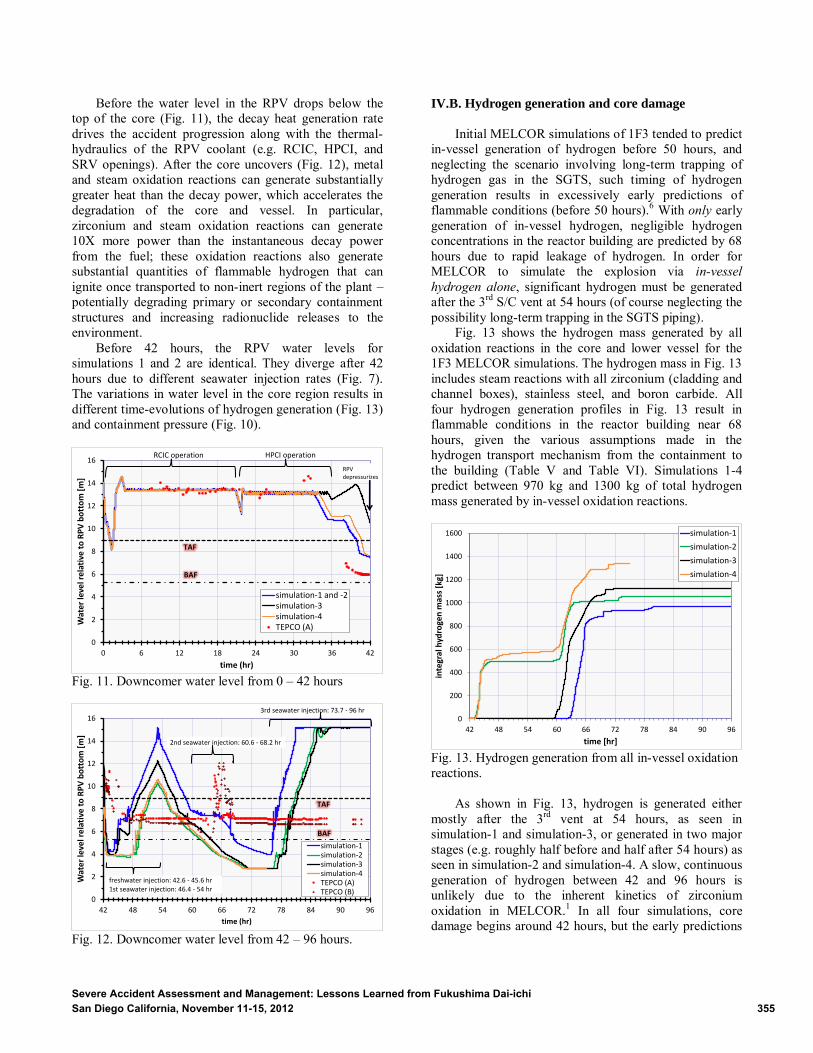
of decay power and radionuclides in the core, the size of the radial MELCOR rings must be carefully selected in order for the MELCOR input to be consistent. The number of fuel assemblies, the mass of each radionuclide group, the associated specific decay powers for each radionuclide group, and the radial power fraction in each ring must be consistent with each other and with the total core decay power. (With the radionuclide package active in MELCOR, the decay power distribution is not the same as the fission power distribution, and is determined by the 2-D mass distributions of each radionuclide group throughout the core and their specific decay powers.) Fig. 4 illustrates the use of TEPCO core data in guiding the radial nodalization of the core in the 1F3 model, which is summarized in Table II. In each MELCOR ring, the axially-integrated power fractions are summed and normalized to the number of assemblies in the ring. Radionuclide mass is then distributed in a manner consistent with the radial nodalization and power distribution. Finally, everything is normalized to the total core decay power shown in Fig. 3. Fig. 5 shows the radial power distribution for the 1F3 MELCOR model. The axial decay power distribution (Fig. 6) is generated in a similar manner, but this is a simpler process due to the axial symmetry of the core geometry and the use of equally sized axial nodes in the TEPCO neutronics data.
Table II. Radial nodalization of active fuel region core ring # Radius (m) # fuel assemblies
Fig. 4. Axially-integrated, assembly-wise power distribution for 1F3 with MELCOR core rings (post-processed TEPCO data, color contour legend omitted due to proprietary data considerations).
Fig. 5. Radial decay power distribution for 1F3 model.
Fig. 6. Axial decay power distribution for 1F3 model.
0.0
0.2
0.4
0.6
0.8
1.0
1.2
1.4
0.0 0.1 0.2 0.3 0.4 0.5 0.6 0.7 0.8 0.9 1.0
Rad
ial p
ow
er
frac
tio
n
Normalized core radius
Peach Bottom SOARCA
1F3 MELCOR model
0.0
0.1
0.2
0.3
0.4
0.5
0.6
0.7
0.8
0.9
1.0
0.0 0.2 0.4 0.6 0.8 1.0 1.2 1.4 1.6
No
rmal
ize
d c
ore
(ac
tive
fu
el)
he
igh
t
Axial decay power peaking factor
average of BOC and EOC TEPCO data
Peach Bottom
1F3 MELCOR model
Severe Accident Assessment and Management: Lessons Learned frSan Diego California, November 11-15, 2012
Compared to the Peach Bottom model for SOARCA, the radial power distribution for the 1F3 model is more center-peaked and the outer rings have slightly more relative power (Fig. 5); the axial distribution for 1F3 is more bottom-peaked (Fig. 6). Such differences could affect the accident progression when only portions of the core are being cooled by emergency water injection. However these effects were not investigated in detail.
Fifteen MELCOR radionuclide classes are defined for the 1F3 model. MELCOR radionuclide classes are lumped chemically, except for a separate uranium class, or defined as combinations of other radionuclide classes (e.g. CsI and Cs2MoO4). A summary of the radionuclide input for the 1F3 MELCOR model is given by Table III. The initial inventory of the iodine class is negligible; it is assumed that nearly all of the iodine is initially in the form of CsI. Immediately after shutdown the decay heat generates 150 MWt, about 6.3% of the full power rating of 2381 MWt. Table III. MELCOR radionuclide input for 1F3 model
III.C. Vessel lower head failure model
MELCOR simulates lower head failure of the
pressure vessel using a Larson-Miller parameter for creep rupture, given MELCOR-calculated distributions of temperature and stress in the lower head.1 The lower head is discretized by a 2-D mesh composed of 8 radial segments, with each having 10 temperature nodes. MELCOR also has a model for penetration failure based on lumped temperatures in each ring of the lower head. The penetration failure model is incorporated into the 1F3 model, and penetrations in each lower head ring are assumed to fail once the lumped-temperatures reach 1273 K, which is the default MELCOR value.
In the Peach Bottom SOARCA model, vessel breach occurs only by gross failure of the lower head, which is dependent on 2-D heat transfer and 1-D stress calculations in MELCOR. The gross failure model for vessel breach is sufficient for accident scenarios that involve total core damage/relocation and relatively rapid vessel failure with
MELCOR radionuclide class
radioactive
elements Initial inventory (kg)
DCH power at
shutdown (MW)
Noble gases Xe, Kr 360.25 11.40
Alkali Metals Cs, Rb 10.24 0.99
Alkaline Earths Ba, Sr 159.64 15.41
Halogens I, Br 6.78E-21 7.93E-21
Chalcogens Te, Se 33.29 6.61
Platinoids Ru, Pd, Rh 232.24 2.65
Transition Metals Mo, Tc, Nb 200.97 18.77
Tetravalents Ce, Zr, Np 1053.99 11.80
Trivalents La, Pm, Y, Pr, Nd 1215.40 29.41
Uranium U 89977.95 2.92
Volatile Main Group As, Sb 4.47 5.52
Less Volatile Main Group Sn, Ag 6.53 2.00
Boron B 4.04E-05 1.20E-05
Cesium Iodide (CsI) Cs, I 27.66 17.17
Cesium Molybdate (Cs2MoO4) Cs, Mo 264.69 25.34
150.0
0.063
total decay power at shutdown =
fraction of ration (2381 MWt) =
351om Fukushima Dai-ichi
350
complete dryout of the lower plenum. This is not representative of the 1F3 accident, whereby core damage, and perhaps vessel breach, most likely occurred long after scram and under conditions of partial cooling from emergency coolant injection. If lower head failure did occur at 1F3, it may have been the result of a localized failure of the vessel due to a hot debris bed resting on the lower head for a prolonged period of time under a pool of seawater. Localized failure of the lower head would occur at a weak point in the vessel steel, such as a control rod drive or instrument penetration. Therefore, in addition to the gross failure model, the MELCOR model for vessel penetration failure is also incorporated into the 1F3 model. In general, the penetration failure model predicts vessel breach significantly sooner than the gross failure model alone, especially for scenarios involving partial core damage and debris relocation to the lower head under sustained but inadequate coolant injection. Lower head failure marks the vital transition from an in-vessel to an ex-vessel accident scenario. The prediction of any vessel breach is important in characterizing the ex-vessel generation of flammable gases, the attack of hot corium on the containment concrete and steel, and the increased release of radioactivity from the system. III.D. Accident sequence and boundary conditions
The boundary conditions for the accident sequence in
the 1F3 MELCOR model are comprised of the (1) TEPCO pressure data, (2) operator actions, (3) safety system performance, and (4) witnessed events (e.g. the reactor building explosion). The most reliable boundary conditions are considered the TEPCO pressure data and the reactor building explosion. Hence some boundary conditions for operator actions and equipment behavior were modified according to this more reliable data. Then, input parameters with high uncertainty are adjusted until the results calculated by MELCOR are in reasonable agreement with TEPCO data and the timing of the explosion. (Reasonableness here is defined by the results reproducing the major features of the TEPCO data.) The final chosen values for these uncertainty parameters, in conjunction with the model’s fundamental boundary conditions, make up the accident sequence input for the 1F3 model.
At the time of this writing, there still remains considerable uncertainty in the operation of the high pressure coolant injection (HPCI), the containment venting, and the emergency coolant injection using fire engine pumps. Thus, these uncertainty parameters were varied until MELCOR-calculated pressures were in agreement with TEPCO data, and until MELCOR predicted flammable conditions in the reactor building near 11:01 on 3/14/2011 (68 hours after scram, the time of the 1F3 explosion). It should be noted that TEPCO data is not hardwired into the 1F3 model in anyway –
Severe Accident Assessment and Management: Lessons Learned froSan Diego California, November 11-15, 2012
MELCOR mechanistically calculates the plant thermal-hydraulics. Nevertheless, system uncertainties that have a major influence on the thermal-hydraulic calculations, namely the HPCI model and the seawater injections, were “tuned” using engineering judgments in order to capture the general trends and major features of the TEPCO pressure data.
The largest uncertainties related to core damage and vessel breach predictions are the details of the freshwater and seawater injections. There are numerous other uncertainties in the MELCOR model input; however, the flow rate for emergency water injection appears to be the most significant and capable of causing order-of-magnitude changes in the calculated results for a relatively small change in flow rate (i.e., ranging from minor core damage to total core relocation and vessel failure). Due to the ad-hoc nature of the emergency water injection at Fukushima, it is very uncertain how much water actually made it to the core region. Pump-head issues and possible leaks in the injections lines, RCS, and the vessel can affect the flow rate of cooling water delivered effectively to the core. Currently MELCOR does not have explicit models for seawater coolant; MELCOR does not simulate the effects that corrosion and flow blockages have on the accident progression.
The freshwater injection rate is taken to be constant in these analyses. The injection rates for the three separate periods of seawater injection are varied in order to grossly reproduce the TEPCO containment pressures. Moreover, seawater injection rates are varied in order to produce flammable conditions in the reactor building near 68 hours after scram. As will be explained further in the results section, four separate MELCOR simulations of 1F3 have predicted flammable conditions in the reactor building near the time of the explosion, and these four simulations use slight variations in HPCI and seawater injection input to provide a few different explanations for the explosion (Fig. 7).
Fig. 7. Mass flow rate for emergency injection of freshwater and seawater via core spray line.
0
1
2
3
4
5
6
7
8
9
10
11
0 10 20 30 40 50 60 70 80 90 100
Mas
s Fl
ow
Rat
e [
kg/s
]
time [hr]
simulation-1
simulations 2, 3 and 4
freshwater injection
seawater injections (uncertain parameter)
352m Fukushima Dai-ichi
351
The boundary conditions and accident sequence inputs for the 1F3 model are summarized in Table IV. Given these boundary conditions, MELCOR calculates the accident progression and the transport of radionuclides to the environment. The timing of events and the assumptions listed in Table IV are the values that are deemed to best characterize the TEPCO data and the reactor building explosion at 68 hours.
Table IV. Accident sequence and boundary conditions (simulations 1-4 are explained in the results sections). System / event Timing (hr) Notes / assumptions
Scram 0.0 Scram on seismic event. Recirc. pump seal leakage 1.0 – 96 5 gpm per pump assumed
RCIC 1.5 – 20.8 RCIC started briefly at 0.3 hours. (full flow rate = 97 t/hr)
Containment sprays 21.3 – 29.5
Flow rate chosen according to TEPCO pressure data (600 gpm). DW sprays in simulations-1&2. S/C sprays in simulations-3&4
HPCI 21.8 – 35.9
HPCI injection throttled via test line; injection ceases at 33 hours in simulations-1&2, at 34 hours in simulation-4, and 35 hours in simulation-3; (full flow rate = 965 t/hr)
SRV opens, RPV depressurized 42.1
Operators scavenge batteries to energize SRV solenoid.
Vents 1-3 correspond well with known events. Vents 4 and 5 were assumed by TEPCO to have occurred.7 Simulations-1&2 assume gas is vented to the lower reactor building. Simulations-3&4 assume gas is vented to the environment.
S/C penetration leakage After 60
Leakage begins once wetwell pressure reaches 0.4 MPa, and leakage area is greatest at 0.48 MPa. (Incorporated into simulations-3&4)
Emergency coolant injection See Fig. 7
Seawater injection modified in order to facilitate predictions of pressure data and the reactor building explosion
Severe Accident Assessment and Management: Lessons Learned fromSan Diego California, November 11-15, 2012
The HPCI is assumed to be throttled via the test flow line. With sufficient water in the condensate storage tank (CST), the HPCI pump takes suction from the CST and injects the water into the feedwater lines. The full flow rate of the HPCI (965 t/hr) is more than sufficient to rapidly fill the RPV; therefore excess HPCI injection is diverted from the feedwater lines and back to the CST via the test flow line. III.E. The reactor building explosion
Prior to the 1F3 explosion in the reactor building,
there is a rapid pressurization of the containment beginning near 60 hours, which levels out around 0.48 MPa at 65 hours. One hour before the explosion at 68 hours, the containment begins to rapidly depressurize, suggesting another vent by the operators or “self-venting” of the containment by an unidentified mechanism. TEPCO also assumes this vent occurred in its latest analyses.7
It is unknown exactly how the flammable gases responsible for the 1F3 explosion were generated (in-vessel and/or ex-vessel), the timing of the gas generation, and the process by which gases moved from the containment to the reactor building. For example, if in-vessel hydrogen generation near 40 hours caused the 1F3 explosion, it is unclear how hydrogen gas could linger for ~24 hours. Likewise, if later gas generation near 60 hours caused the 1F3 explosion, and if excess gases were somehow transported to 1F4, it is uncertain how flammable gases remained in the 1F4 building for ~20 hours (the 1F3 explosion severed the piping that connected 1F3 and 1F4).
Possible scenarios that may explain the 1F3 explosion include: ex-vessel core-concrete interactions generating flammable hydrogen and carbon-monoxide gases (which would also pressurize the containment around 60 hours and provide heavier carbon-monoxide gas for the 1F4 explosion), hydrogen generated around 40 hours being trapped in the piping of the standby gas treatment system (SGTS) for ~24 hours and eventually leaking into the reactor building at 68 hours, and flammable gases leaking from containment penetrations into the reactor building around 60 hours. Heavier carbon-monoxide gas, possibly generated in 1F3 by molten core-concrete interactions (MCCI) around 60 hours, may be more likely to have been transported to the 1F4 reactor building, where it could accumulate and remain for approximately 20 hours to cause the 1F4 explosion (87.2 hours after 1F3 scram). In light of the possible scenarios to explain the 1F3 explosion, four distinct categories of 1F3 simulations are proposed in Table V: (1) early in-vessel hydrogen trapped in and eventually leaking from the SGTS, (2) later in-vessel hydrogen with a S/C vent rupture, (3) later in-vessel hydrogen with S/C penetration leakage, and (4) ex-vessel hydrogen and carbon-
353 Fukushima Dai-ichi
352
monoxide (MCCI) beginning at the time of the containment pressure excursion (60 hours). Of course, it is also conceivable that some combination of these four scenarios, in addition to other unknown processes, may have contributed to the 1F3 reactor building explosion.
In Table V, the two categories highlighted in blue indicate that the current 1F3 model is successful in producing results in agreement with TEPCO data and the explosion for the stated flammable gas generation and leak path characteristics. The orange-highlighted categories indicate continued works in progress. A high-accuracy model of the SGTS needs to be developed and validated using actual plant data – otherwise the current 1F3 model cannot mechanistically simulate gases flowing through the SGTS. To date, MELCOR 1F3 simulations that breach the vessel have resulted in minimal generation of ex-vessel gases: the ejected core debris is relatively cool and small (compared to simulations with rapid vessel failure) due to the lower decay heat generation rate long after scram and partial cooling from seawater injection. Also, a considerable pool of condensed water exists in the containment pedestal just before the ejection of core debris, which quenches the corium.
Table V. Matrix of plausible 1F3 MELCOR simulations that achieve explosive conditions in the reactor building
Origin of
flammable gas
for explosion
Timing
(hours)
Gas transport from
containment to reactor
building
In-vessel H2
35 – 44 Trapped in piping for 24+ hours (SGTS system), leaks to building
simulations (Table V) were successfully simulated by MELCOR using four variations of the 1F3 model. These simulations are dubbed simply simulation-1, simulation-2, simulation-3, and simulation-4. Simulation-1 and simulation-2 differ only by slightly different seawater injection rates, as shown by Fig. 7. All other model
Severe Accident Assessment and Management: Lessons Learned froSan Diego California, November 11-15, 2012
inputs, including the HPCI modeling, are identical for simulation-1 and simulation-2. Simulations 2, 3, and 4 share the same seawater injection rates, but simulations 3 and 4 have different accident signatures because of different timings of HPCI termination, and the gases vented from the S/C flow to the environment (flammable gases enter the building via S/C penetration leakages instead).
Simulation-3 and simulation-4 have the MELCOR burn package (BUR) active, which initiates deflagrations in volumes with the appropriate concentrations of oxygen, hydrogen, nitrogen, and carbon-monoxide. LeChatelier‘s formula is used to determine ignition thresholds, and the deflagration process assumes an ignition source is always available.1 The hydrogen mole-fraction limit for deflagrations is set to 10%. The MELCOR BUR package does not model detonation events where the flame front travels over supersonic speeds. Simulations 1 and 2 do not have the BUR package active, which allows the hydrogen concentrations to progress past the 10% ignition criterion in MELCOR, and permits the investigation of hydrogen transport without assuming an ignition source is always available. However, deactivating the BUR package reduces the accuracy of predicted radionuclide releases due to the lack of modeling the energetics of hydrogen deflagrations.
The unique characteristics of each simulation are summarized in Table VI. Simulations 1-3 model the entire accident sequence to 96 hours; currently, simulation-4 only models 75 hours of the accident (simulation-4 is still executing as of this writing).
Table VI. Summary of MELCOR simulations of 1F3 model that are successful in predicting explosive conditions in the reactor building near 68 hours
Sim. #
H2 transport from
containment to reactor
building
Termination
of HPCI
injection
(hours)
MELCOR
BUR package
1 Ruptured S/C vent 33 Off 2 Ruptured S/C vent 33 Off 3 S/C penetration leakage 35 Active 4 S/C penetration leakage 34 Active
IV.A. Thermal-hydraulic calculations
The RPV pressure response for each simulation of
the 1F3 model is shown by Fig. 8. Simulations 1 and 2 exhibit very similar trends in RPV pressure, since they differ by seawater injection rates after the RPV depressurizes. Likewise, the RPV pressures in simulations 3 and 4 are quite similar. Instead of forcing the HPCI model to alter steam suction and injection flow rates to exactly match the TEPCO RPV data, a multiplier on the steam flow rate from the steam line to the HPCI turbine
354m Fukushima Dai-ichi
353
was varied until the calculated RPV pressure was reasonably close to the data. The full rating of the HPCI is sufficient to rapidly depressurize the RPV and restore water level, but the TEPCO pressure data does not support full-capacity operation of the HPCI at 1F3. Recent TEPCO-MAAP calculations have demonstrated that the step-like change in the TEPCO RPV pressure near 24 hours may be the result of a sudden change in HPCI injection rate into the feedwater lines, and a corresponding change in RPV water level.7
Fig. 8. RPV pressure response for 1F3.
The potential unreliability of the recorded data should
be taken into consideration when comparing MELCOR calculations to the TEPCO data. Generally, RPV and containment pressure data is more accurate than the water level data, which is a more complicated measurement that may become very unreliable after depressurization events in the RPV due to flashing of water in the reference leg. Also, RPV pressure data may be inaccurate at very low RPV pressures after a depressurization event. Unreliability in RPV pressure can be observed in drifting A/B TEPCO measurements hours after RPV depressurization. After the RPV depressurizes at 42 hours, the 1F3 analyses concentrate on capturing the TEPCO containment pressures and the reactor building explosion.
Fig. 9 and Fig. 10 compare the TEPCO pressure data to the drywell pressures calculated by MELCOR. In general, the calculated containment pressures are in reasonable agreement with the TEPCO data. From 0 to 42 hours, the pressure traces for simulations 1 and 2 are identical since these simulations differ only by seawater injection after 42 hours. The simulations are in close agreement until 22 hours, at which the differences in spray models become apparent – simulations 1 and 2 have drywell sprays, while simulations 3 and 4 use S/C sprays.
0.0
1.0
2.0
3.0
4.0
5.0
6.0
7.0
8.0
9.0
0 5 10 15 20 25 30 35 40 45 50
Pre
ssu
re [
MP
a]
time [hr]
simulation-1 and -2
simulation-3 and -4
TEPCO RPV pressure
SRV opens
RCIC operation HPCI operation
Severe Accident Assessment and Management: Lessons Learned frSan Diego California, November 11-15, 2012
Fig. 9. Containment pressure from 0 – 42 hours.
Simulation-4 matches the TEPCO data for
containment pressure best between 42 and 75 hours (Fig. 10). Simulation-3 also displays good agreement with the later containment pressure data, however it seems to somewhat under-predict containment pressures from 42 to 54 hours. Thus simulation-3 may slightly under-predict early oxidation and hydrogen generation in the RPV. Judging by the containment pressure, simulation-4 may best predict the time-evolution of in-vessel oxidation reactions and hydrogen generation.
Although simulation-1 assumes a S/C vent leak in order to move flammable gases to the reactor building, it predicts high enough containment pressures in order for the S/C penetration leak model (used in simulations-3&4) to transport hydrogen gas to the building; thus in principle, simulation-1 could be re-run with the addition of the model for S/C penetration leakage, while removing the S/C vent leak, and may still predict flammable conditions in the reactor building near 68 hours. In contrast, without the S/C vent leak assumption simulation-2 would not predict sufficient hydrogen transport to the reactor building for the explosion.
Fig. 10. Containment pressure from 42 – 96 hours.
0.0
0.1
0.2
0.3
0.4
0.5
0.6
0.7
0 6 12 18 24 30 36 42
Pre
ssu
re [
MP
a]
time [hr]
simulation-1 and -2simulation-3 and -4TEPCO drywell pressureTEPCO wetwell pressure
actual time of 1F3reactor building explosion (68.2 hr). S/C vent 1 hr before
355om Fukushima Dai-ichi
354
Before the water level in the RPV drops below the top of the core (Fig. 11), the decay heat generation rate drives the accident progression along with the thermal-hydraulics of the RPV coolant (e.g. RCIC, HPCI, and SRV openings). After the core uncovers (Fig. 12), metal and steam oxidation reactions can generate substantially greater heat than the decay power, which accelerates the degradation of the core and vessel. In particular, zirconium and steam oxidation reactions can generate 10X more power than the instantaneous decay power from the fuel; these oxidation reactions also generate substantial quantities of flammable hydrogen that can ignite once transported to non-inert regions of the plant – potentially degrading primary or secondary containment structures and increasing radionuclide releases to the environment.
Before 42 hours, the RPV water levels for simulations 1 and 2 are identical. They diverge after 42 hours due to different seawater injection rates (Fig. 7). The variations in water level in the core region results in different time-evolutions of hydrogen generation (Fig. 13) and containment pressure (Fig. 10).
Fig. 11. Downcomer water level from 0 – 42 hours
Fig. 12. Downcomer water level from 42 – 96 hours.
0
2
4
6
8
10
12
14
16
0 6 12 18 24 30 36 42
Wat
er
leve
l re
lati
ve t
o R
PV
bo
tto
m [
m]
time (hr)
simulation-1 and -2simulation-3simulation-4TEPCO (A)
Severe Accident Assessment and Management: Lessons Learned froSan Diego California, November 11-15, 2012
IV.B. Hydrogen generation and core damage
Initial MELCOR simulations of 1F3 tended to predict
in-vessel generation of hydrogen before 50 hours, and neglecting the scenario involving long-term trapping of hydrogen gas in the SGTS, such timing of hydrogen generation results in excessively early predictions of flammable conditions (before 50 hours).6 With only early generation of in-vessel hydrogen, negligible hydrogen concentrations in the reactor building are predicted by 68 hours due to rapid leakage of hydrogen. In order for MELCOR to simulate the explosion via in-vessel hydrogen alone, significant hydrogen must be generated after the 3rd S/C vent at 54 hours (of course neglecting the possibility long-term trapping in the SGTS piping).
Fig. 13 shows the hydrogen mass generated by all oxidation reactions in the core and lower vessel for the 1F3 MELCOR simulations. The hydrogen mass in Fig. 13 includes steam reactions with all zirconium (cladding and channel boxes), stainless steel, and boron carbide. All four hydrogen generation profiles in Fig. 13 result in flammable conditions in the reactor building near 68 hours, given the various assumptions made in the hydrogen transport mechanism from the containment to the building (Table V and Table VI). Simulations 1-4 predict between 970 kg and 1300 kg of total hydrogen mass generated by in-vessel oxidation reactions.
Fig. 13. Hydrogen generation from all in-vessel oxidation reactions.
As shown in Fig. 13, hydrogen is generated either mostly after the 3rd vent at 54 hours, as seen in simulation-1 and simulation-3, or generated in two major stages (e.g. roughly half before and half after 54 hours) as seen in simulation-2 and simulation-4. A slow, continuous generation of hydrogen between 42 and 96 hours is unlikely due to the inherent kinetics of zirconium oxidation in MELCOR.1 In all four simulations, core damage begins around 42 hours, but the early predictions
0
200
400
600
800
1000
1200
1400
1600
42 48 54 60 66 72 78 84 90 96
inte
gral
hyd
roge
n m
ass
[kg]
time [hr]
simulation-1
simulation-2
simulation-3
simulation-4
356m Fukushima Dai-ichi
355
of damage and oxidation in simulations 1 and 3 are significantly less compared to simulations 2 and 4.
The maximum hydrogen concentrations in the reactor building for each simulation are shown by Fig. 14. Given the lumped-parameter representation of 3-D space in MELCOR, and considering that the reactor building is composed of relatively large control volumes, a conservative flammable concentration of hydrogen may be on the order of 10%. Simulation-1 and -2 far exceed the 10% flammability limit in several control volumes of the reactor building, since the MELCOR BUR package is not active in these simulations. Maximum hydrogen concentrations exist in the lower reactor building volumes, which supports the features of the 1F3 explosion and the extensive damage observed in the lower regions of the reactor building. The vertical red line denotes the actual time of the 1F3 explosion at 68 hours.
Fig. 14. Hydrogen concentrations in 1F3 reactor building.
0.00
0.05
0.10
0.15
0.20
0.25
0.30
0.35
0.40
42 48 54 60 66 72 78 84 90 96
hyd
roge
n m
ole
fra
ctio
n [
-]
time [hr]
simulation-1simulation-2simulation-3simulation-4
actual time of 1F3reactor building explosion (68.2 hr)
hydrogenflammability criterion
hydrogen deflagrations in simulations 3 and 4
Severe Accident Assessment and Management: Lessons Learned froSan Diego California, November 11-15, 2012
Simulations 1 and 2 exhibit highly flammable conditions throughout most of the reactor building at 68 hours – due to the assumption of the pathway of hydrogen transport from the containment to the torus room and the mechanistic calculation of sufficient hydrogen accumulation in the containment leading up to the S/C vent at 67.6 hours. Simulations 3 and 4 predict ~10% hydrogen concentrations in several lower volumes in the reactor building near 62.5 hours, since the BUR package is set the initiate deflagrations once hydrogen concentrations reach 10%. In simulations 3 and 4, hydrogen leaks to the reactor building through S/C penetrations as a result of high containment pressure brought on by core damage and in-vessel oxidation. Simulations 3 and 4 do not exactly predict the timing of flammable conditions due to the slightly early prediction of pressure escalation in the containment near 60 hours (i.e. the S/C is leaking too soon). Further sensitivity studies may be able to resolve this slight inconsistency by modification to the first and second seawater injection flow rates, or by incorporating a mechanistic pump-head model for the fire engine pumps. Nevertheless, simulations 3 and 4 demonstrate that in-vessel hydrogen production and S/C penetration leakage are plausible explanations for the reactor building explosion at 1F3.
The progression of the core damage for simulation-3 is illustrated by Fig. 15. The figure contains four 2-D representations of the reactor core and lower-vessel at different points in time. The pink material is intact fuel and cladding, the blue material is water, the yellow material is steel, the green material is particulate debris, and the red material is molten debris. Core material relocation begins near 44 hours when steel and Zircaloy melt in the top code node, which is the upper tie plate where there is no fuel. The first major fuel relocation
Fig. 15. Core damage progression for simulation-3.
357m Fukushima Dai-ichi
356
starts at 63 hours when the fuel and cladding melt in rings 1 and 2, axial levels 11-16. By 96 hours, ring 1 and most of the top core node have relocated, and approximately half of rings 2 and 3 have relocated. The fuel in rings 4 and 5 has minimal damage and has not relocated by 96 hours. Significant steel, Zircaloy, and UO2 debris rests on the lower head and on the lower core plate at 96 hours. IV.C. Radionuclide releases
One of the ultimate goals of a MELCOR simulation
is to predict the degree of core damage and the associated radionuclide release to the environment. Starting from calculations of fuel and cladding damage, MELCOR then performs a mechanistic simulation of radionuclide transport from the fuel, through the reactor plant and containment, and the release to the environment. Fig. 16 shows the cesium-iodide (CsI) release to the environment for each 1F3 simulation. A majority of the radioactive iodine is released from the fuel in the form of cesium-iodide. A large fraction of the initial core inventory of radioactive cesium, such as Cs-134 and Cs-137, is also released in the form of CsI. In each simulation, over 80% of the initial core inventory of radioactive noble gases is released to the environment. Normalized to the initial core inventory, the noble gas group is always the greatest release of radionuclides to the environment. Table VII provides a summary of some radionuclide release fractions for each simulation.
Fig. 16. Environmental CsI release for 1F3 simulations, normalized to the initial core inventory of CsI. Table VII. Radionuclide release fraction for selected RN groups in 1F3 MELCOR model.
Severe Accident Assessment and Management: Lessons Learned froSan Diego California, November 11-15, 2012
From Fig. 16 and Table VII it is apparent that simulation-3 predicts a substantially larger environment release of the CsI radionuclide group. The enhanced CsI release in simulation-3 is due in part to its use of the MELCOR BUR package. With the BUR package active, MELCOR calculates the energy generated by deflagrations that can increase the release of radionuclides. Burns can propagate through several volumes, creating pressure impulses in the reactor building that increase the energetic release of radionuclides to the environment. Deflagrations can also damage certain sections of the reactor building in the 1F3 MELCOR model, opening flow paths that further increase the radionuclide release to the environment. Simulation-4 needs to finish completely before its radionuclide releases can be examined in detail.
Table VIII shows TEPCO estimates of radioactivity releases for units 1-3 from March 12 to March 31, 2011. The table includes the INES-based estimate of the total radioactivity released in the form of I-131 and Cs-137 based on an INES I-131 equivalent scale – the activity of Cs-137 is converted to a radiological-equivalent I-131 activity. It is calculated as 500 PBq (I-131 release) + 10 PBq (Cs-137 release) X 40 (conversion factor) = 900 PBq.12 Of the total 900 PBq released by all three units, 1F3 is estimated to have released 320 PBq by TEPCO. (Note: summing the INES releases for the three units leaves 90 PBq of radioactivity unaccounted for, i.e. it is indeterminate which reactor(s) it originated from.)
Table VIII. TEPCO-reported radioactivity releases.12,13
Quantity
TEPCO estimate
(PBq)
Cs-134 release for all units ~10 Cs-137 release for all units ~10 I-131 release for all units ~500 INES-based estimate for all units 900 1F1 INES release 130 1F2 INES release 360 1F3 INES release 320
Indeterminate excess activity 90
Taking the cesium and iodine class releases from simulation-3 of the 1F3 MELCOR model, which arguably provides the most accurate prediction of radionuclide releases with the BUR package active, and converting these releases into INES I-131 equivalents makes it apparent that the current MELCOR model for 1F3 may under-predict the environmental releases compared to the TEPCO estimates (see Table IX). Simulation-3 predicts 53.3 PBq of Cs-137 and I-131 released to the environment, while TEPCO estimates 320 PBq for 1F3 (both in terms of equivalent I-131). There are several possible explanations for this discrepancy, including differences in initial inventories and the release fractions
358m Fukushima Dai-ichi
357
of each isotope. Moreover, the TEPCO releases are for March 12 to March 31, while the MELCOR calculations only represent the releases from March 11 to March 15. Assuming a total inventory of 1600 PBq of cesium (Cs-134 and -137) and 6100 PBq of I-131 in all three units (based on TEPCO ORIGEN2 output), the unit-averaged cesium and iodine release fractions are roughly 1.3% and 8.2%, respectively. Hence, the effective TEPCO release fractions are considerably greater than those calculated by MELCOR for the SNL 1F3 model: the TEPCO release fraction for cesium is about seven times greater, and the TEPCO release fraction for iodine is about five times greater than the MELCOR-calculated release fractions.
Table IX. MELCOR-calculated radioactivity releases for simulation-3 of the 1F3 model.
Quantity
SNL 1F3 model
(Simulation-3)
Initial Cs-137 inventory (PBq) 232.4 Initial Cs-134 inventory (PBq) 318.0 Initial I-131 inventory (PBq) 2368.1 Overall cesium class release fraction 1.61E-03 Overall iodine class release fraction 1.62E-02 Total cesium release (PBq) 0.89 Total iodine release (PBq) 38.4 Total Cs-137 and I-131 release, converted to INES I-131 equivalent amount of radioactivity (PBq)
53.3
V. CONCLUSIONS
MELCOR appears well-suited for reproducing the thermal-hydraulic response of the severe accident at 1F3. Using the current SNL MELCOR 2.1 model of 1F3, the code calculates pressures in the RPV and the containment that agree reasonably well with the TEPCO data. Given rough agreement with the TEPCO data and the reactor building explosion, MELCOR predicts the degree of core damage in 1F3 and the associated radionuclide release to the environment. However, further research and analysis is necessary in characterizing the detailed release of radioisotopes and corroborating the MELCOR calculations with TEPCO estimates and dosimetry data.
In attempting to capture the principal boundary conditions for the 1F3 simulations, it is apparent that both the quantity and the timing of the hydrogen generation are important. A rapid generation rate of hydrogen increases containment pressures (with SRVs open) and allows the simulation of flammable conditions in the reactor building. A large mass of hydrogen generation is associated with a large release of oxidation energy that accelerates core and vessel damage. Hence, hydrogen generation and core damage can correlate with radionuclide releases and predictions of vessel breach. Future 1F3 analyses could relate dosimetry measurements
Severe Accident Assessment and Management: Lessons Learned froSan Diego California, November 11-15, 2012
by TEPCO to the calculations of core damage, oxidation, and radionuclide releases from MELCOR.
There are numerous alternative explanations for the explosion, even beyond the SGTS and ex-vessel scenarios identified in Table V that have not yet been successfully modeled. However, there is significant forensic value in investigating each plausible scenario individually. The MELCOR code can be used to identify which scenarios are possible (or even likely), assuming the current 1F3 model and the TEPCO data are in reasonable agreement. Additional MELCOR analyses of 1F3 will involve the incorporation of the SGTS system, as well as scenarios that generate significant amounts flammable gases due to MCCI after vessel breach.
The Fukushima Daiichi accidents highlight some potential areas of improvement for the MELCOR code. Most importantly, the MELCOR models for lower head failure may need to be extended to provide higher-fidelity simulations of scenarios involving gradual melt-thru of vessel penetrations; in such scenarios the use of the gross-failure model, even in conjunction with the simple penetration failure model, may never predict vessel rupture and may therefore be too optimistic. It might also be necessary to incorporate a new MELCOR fluid model for non-reactor grade water such as seawater. This is required in order to simulate the effects of seawater corrosion that can lead to enhanced lower head failure, salt and organic material accumulation that can cause reductions in flow, and the associated effects on the long-term coolability of reactor cores in degraded geometries. This may require enhancements to the numerical solvers in MELCOR to facilitate the simulation of longer transients that take into account the long-term effects of corrosion.
Severe accident codes such as MELCOR provide a valuable means of characterizing severe nuclear accidents. Uncertainty and variability ensure that such analyses will render wide variations in predicted accident progressions, and this is a reflection of true variability in the potential responses of complex systems undergoing severe accident conditions.
ACKNOWLEDGMENTS
The initial development of the 1F3 model used in this work was supported by an accident reconstruction study jointly sponsored by the US Nuclear Regulatory Commission and Department of Energy. Sandia National Laboratories is a multi-program laboratory managed and operated by Sandia Corporation, a wholly owned subsidiary of Lockheed Martin Corporation, for the U.S. Department of Energy’s National Nuclear Security Administration under contract DE-AC04-94AL85000.
359m Fukushima Dai-ichi
358
ACRONYMS
BAF bottom of active fuel BWR boiling water reactor CST condensate storage tank COR MELCOR core package CVH MELCOR control volume package DW drywell FL MELCOR flow path package HPCI high pressure coolant injection HS MELCOR heat structure package INES International Nuclear Events Scale JNES Japan Nuclear Energy Safety Organization MCCI molten core-concrete interaction MOX mixed oxide PCV primary containment vessel (drywell/wetwell) RCIC reactor core isolation cooling RCS reactor coolant system RN MELCOR radionuclide package RPV reactor pressure vessel S/C suppression chamber (i.e. torus or wetwell) SOARCA State of the Art Reactor Consequence Analysis STGS standby gas treatment system SRV safety relief valve (SRV-1 opens first) TAF top of active fuel TEPCO Tokyo Electric Power Company WW wetwell (i.e. suppression chamber or torus) REFERENCES
1. Sandia National Laboratories, MELCOR Computer Code Manuals, Version 2.1, DRAFT (2010).
4. C. Murray, “Overview of TRACE V5.0,” Proc. Regulatory Information Conference, Washington D.C., May 14 (2007).
5. Electric Power Research Institute, “Modular Accident Analysis Program (MAAP5) Version 5.0.1 for Windows – NQA,” EPRI Software Product 1021648, (2011).
6. R. Gauntt, et al., “Fukushima Daiichi Accident Study,” SAND2012-6173, Sandia National Laboratories: Albuquerque, NM (2012).
Severe Accident Assessment and Management: Lessons Learned froSan Diego California, November 11-15, 2012
7. TEPCO, “MAAP Code-based Analysis of the Development of the Events at the Fukushima Daiichi Nuclear Power Station,” http://www.tepco.co.jp/en/nu/fukushima-np/images/handouts_120312_04-e.pdf (2012).
8. M. Ogino (JNES), “Overview of Accident Analysis and Findings of Fukushima Daiichi Nuclear Power Station,” Proc. CSARP 2011, Bethesda, MD, September 20-23 (2011).
9. D. Luxat and J. Gabor, “EPRI Fukushima Technical Evaluation Project,” Proc. EPRI Fukushima Workshop, Washington D.C., May 8-9 (2012).
10. US. NRC. “State-of-the-Art Reactor Consequence Analysis (SOARCA) Report,” NUREG/CR-1935, U.S. Nuclear Regulatory Commission: Washington D.C. (2012).
11. A. G. Croff, “ORIGEN2 – A Revised and Updated Version of the Oak Ridge Isotope Generation and Depletion Code,” ORNL-5621, Union Carbide Corp., Nucl. Div., Oak Ridge National Laboratory: Oak Ridge, TN (1980).
12. TEPCO, “Method of Estimation of the Released Amount of Radioactive Materials into the Atmosphere,” http://www.tepco.co.jp/en/press/corp-com/release/betu12_e/images/120524e0203.pdf (2012).
13. TEPCO Press Release, “The Estimated Amount of Radioactive Materials Released into the Air and the Ocean Caused by Fukushima Daiichi Nuclear Power Station Accident Due to the Tohoku-Chihou-Taiheiyou-Oki Earthquake (As of May 2012),” http://www.tepco.co.jp/en/press/corp-com/release/2012/1204659_1870.html (2012).


![MELCOR Computer Code Manuals · PDF fileThis publication of the MELCOR computer code manuals corresponds to MELCOR 1.8.5, ... of Volume 1 contains the MELCOR User’s Guides, ... [1].....](https://static.documents.pub/doc/80x56/5a86a7f27f8b9a87368dc173/melcor-computer-code-manuals-publication-of-the-melcor-computer-code-manuals-corresponds.jpg)
