Page 1
8/6/2019 MEM Dissertation LAP
http://slidepdf.com/reader/full/mem-dissertation-lap 1/95
MORPHOLOGICAL AND PHYSIOLOGICAL ANALYSIS
OF URBAN ENVIRONMENT
Case Study: A Singapore New Town
BY
FAYSAL KABIR SHUVO
This book is based on the dissertation submitted for the partial fulfillment of
the requirements for Masters of Science in Environmental Management at
National University of Singapore
Page 2
8/6/2019 MEM Dissertation LAP
http://slidepdf.com/reader/full/mem-dissertation-lap 2/95
Dedication
This book is fully dedicated to my loving wife Farzana Afrin Tani
Faysal Kabir Shuvo
Singapore
22/06/2010
Page 3
8/6/2019 MEM Dissertation LAP
http://slidepdf.com/reader/full/mem-dissertation-lap 3/95
Morphological and Physiological Analysis for Measuring Urban Environmental
Performance: A Case Study of Bukit Panjang New Town
I
Acknowledgement
In the beginning, all praises belong to almighty Allah, the most kindhearted and the most
merciful to man and his actions, which provides me the opportunity to complete this study
successfully.
I wish to express my most sincere and profound gratitude to my dissertation supervisor
Dr. Perry Yang, former Assistant Professor, Department of Architecture, NUS, for his
constant supervision and encouragement, valuable advice and comments which had been
very much conducive in carrying out this research. I also feel his affectionate but
disciplined guidance has allowed me to reach my destination. My heartiest gratefulnessshould be for two famous Professor Emeritus of Urban Design, ETH Zurich, Franz
Oswald and Peter Baccini as well as Senior lecturer, Mark Michaeli for their
wholehearted cooperation in getting familiar with various terms of ‘Netzstadt’.
My deep gratitude also goes to Dr. Simon Yanuar Putra for his dedicated and benevolent
cooperation in making me familiar with ArcGIS and sometimes with sharing knowledge
of difficult design terms, I am really grateful to him. In same connection I am also owe to
Gunawan Tanuwidjaja, MEM graduate, Dr. Asim Kumar Debanath, Dr. Steve Cardinal
Jusuf, for their helps in various technical issues.
I recall the supports with warm appreciation and great regards, which were extended by
the various personnel of Singapore Land Authority, Urban Redevelopment Authority,
Singapore Power, and Building Construction Authority by providing me useful data for
carrying out the research.
Finally, we are grateful and humbly acknowledge that this work could not have been
completed without the moral support of our families.
Page 4
8/6/2019 MEM Dissertation LAP
http://slidepdf.com/reader/full/mem-dissertation-lap 4/95
Morphological and Physiological Analysis for Measuring Urban Environmental
Performance: A Case Study of Bukit Panjang New Town
II
Preface
The term ‘sustainability’ is given enormous momentum over the past few decades for
ensuring a vigorous living condition for the future generation which mostly has been
concentrated on the economic freedom and social equity while leaving the ‘environment’
issues apart; another important issue of sustainability. This environment is being
jeopardized with the pace of constant increasing rate of urbanization, giving birth to the
multiple environmental issues ranged from local like ‘urban heat island’ to global as
‘global climate change or global warming’. Policymakers, city planners and designers
therefore have recent given their deep attention to sustainable urbanization or urban form
which starts with individual buildings and deals up to city scale. For planning and
subsequent designing of a sustainable urban form require a finer scale environmental
performance analysis of what already built. Urban environment depends on the shape and
organization of spaces (morphology) on one side as well as on the physical resource
management and flow (physical process) within the built environment on the other hand
which are mainly anthropogenic modifications of the arrangements and orientations of the
environment. So a set of indicators are needed for an effective analysis of existing
environment to guide planning and designing of a potential urban area. Modern
geographic information technologies like GIS, remote sensing with diverse statistical
tools like MS Excel, SPSS, SAS, STATA have made it easy to a large extent to reach a
multiple objected decision making regarding urban environment. In this study, an
environmental performance analysis has been performed based on multiple morphological
and physiological indicators for Bukit Panjang, a new town of Singapore. Though
Singapore government is much vigilant in urban planning in terms of ecological and green
coverage perspectives, how the morphological properties like building density (plot ratio),
subdivision of land parcels, urban grain sizes and level of accessibility of land parcel are
correlated with the physiological process like material intensity and electricity use is still
unexplored. In this research an effort is made to make up the previous study gap; better to
say that the author hopes at least that the study approach will pave a nice way further
research in urban environmental performance analysis towards sustainable urban form.
Page 5
8/6/2019 MEM Dissertation LAP
http://slidepdf.com/reader/full/mem-dissertation-lap 5/95
Morphological and Physiological Analysis for Measuring Urban Environmental
Performance: A Case Study of Bukit Panjang New Town
III
The contents of this book are organized into eight chapters. The first chapter
includes mainly the background and purposes of the research based on which the base
thesis was done. The second chapter has summarized the literatures relevant to the
research issues like sustainability of built environment and the performance indicators of
urban built environment based on the morphological and physiological characteristics.
The methodology of the whole research is described in the chapter three, followed by a
short description of the study area in the chapter four. Chapter five includes the concept of
urban environment, the morphological and physiological indicators pertinent to analyze
the performance of urban environment. Chapter six described the GIS based analysis of
the indicators developed at the earlier chapter; the correlation analysis among the
indicators is also described in this chapter. Chapter seven incorporates the proposed
recommendation following the analysis result and chapter seven is followed by the
concluding chapter eight.
Page 6
8/6/2019 MEM Dissertation LAP
http://slidepdf.com/reader/full/mem-dissertation-lap 6/95
Morphological and Physiological Analysis for Measuring Urban Environmental
Performance: A Case Study of Bukit Panjang New Town
IV
Table of Contents
Title Page No.
ACKNOWLEDGEMENT I
PREFACE II
TABLE OF CONTENTS IV
LIST OF TABLES VI
LIST OF FIGURES VI
LIST OF MAPS VI
ACRONYMS VII
CHAPTER 1: INTRODUCTION AND BACKGROUND
1.1 Introduction 1-1
1.2 Motivation of the Study 1-2
1.3 Objectives of the study 1-3
1.4 Scopes of the Study 1-3
1.5 Research Questions and Hypothesis 1-4
1.6 Limitations 1-5
CHAPTER 2: LITERATURE REVIEW
2.1 Emergence of the issue of Sustainability 2-1
2.2 Sustainable Urban Form 2-2
2.3 Environmental Performance of the Built Environment 2-3
2.4 Sustainability Indicators of Urban form 2-4
2.4.1 Working with the morphological indicators 2-4
2.4.2 Working with the physiological indicators 2-11
2.5 Multi scale assessment of environmental performance and GIS 2-15
2.6 Knowledge Gap 2-18
Page 7
8/6/2019 MEM Dissertation LAP
http://slidepdf.com/reader/full/mem-dissertation-lap 7/95
Morphological and Physiological Analysis for Measuring Urban Environmental
Performance: A Case Study of Bukit Panjang New Town
V
CHAPTER 3: METHODOLOGICAL FRAMEWORK
3.1 Selection of the Study Area 3-1
3.2 Collection of Necessary Maps 3-1
3.3 Literature Survey 3-1
3.4 Identification and Principles of the Indicators 3-2
3.5 Collection and Compilation of the data and information 3-3
3.6 Calculation of the Indicators 3-3
3.7 Analysis and Visualization of the results 3-6
3.8 Proposal and Recommendations 3-6
CHAPTER 4: STUDY AREA
4.1 History and Location 4-1
4.2 Profile of the Study Area 4-1
CHAPTER 5: PROPOSED INDICATORS FOR ENVIRONMENTAL ANALYSIS OF
BUKIT PANJANG
5.1 Urban Environmental Performance 5-1
5.2 Morphological Indicators 5-2
5.3 Physiological Indicators 5-9
CHAPTER 6: ANALYSIS OF INDICATORS AND FINDINGS
6.1 Morphological Indicators 6-5
6.2 Physiological Indicators 6-16
6.3 Correlation and Multiple Linear Regression Analysis 6-21
6.4 Discussion 6-25
CHAPTER 7: RECOMMENDING PROPOSAL 7-1
CHAPTER 8: CONCLUSION 8-1
REFERENCES Ref-1
Page 8
8/6/2019 MEM Dissertation LAP
http://slidepdf.com/reader/full/mem-dissertation-lap 8/95
Morphological and Physiological Analysis for Measuring Urban Environmental
Performance: A Case Study of Bukit Panjang New Town
VI
List of Tables
Title Page No.
Table 5.1: Material Stock in Bukit Panjang from 1993-2005 5-11
Table 5.2: Average Household area of various building typologies in Singapore 5-13
Table 5.3: Average Electricity Consumption for all households
of the same house type 5-13
Table 5.4: SLA defined building types 5-13
Table 5.5: Calculated Electricity Use Intensity for Built Structures
in Bukit Panjang 5-15
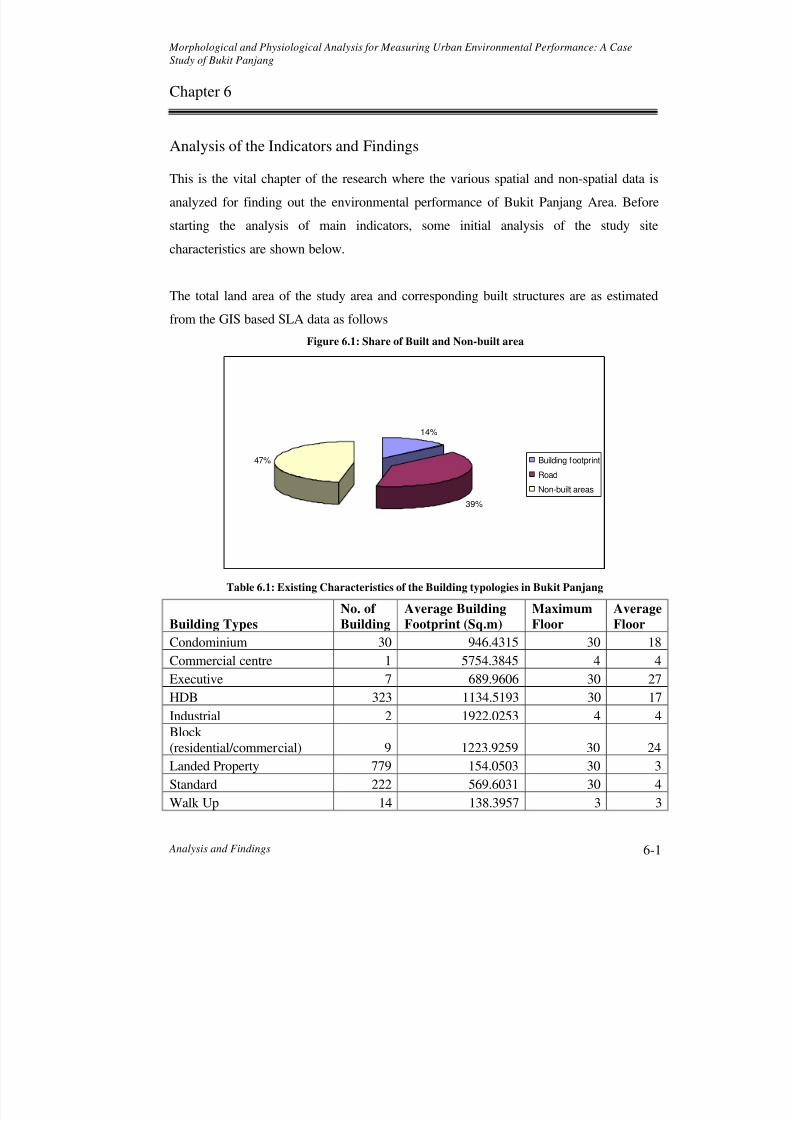
Table 6.1: Existing Characteristics of the Building typologies in Bukit Panjang 6-1
Table 6.2: Status of the Built Environment Data in Bukit Panjang 6-2
Table 6.3: Pearson Correlation Coefficients for two sets of Indicators 6-23
List of Figures
Title Page No.
Figure 3.1: Methodological Framework 3-7
Figure 6.1: Share of Built and Non-built area 6-1
List of Maps
Title Page No.
Map 4.1: Singapore Map 4-3
Map 4.2: Map of Study Area (Bukit Panjang) 4-3
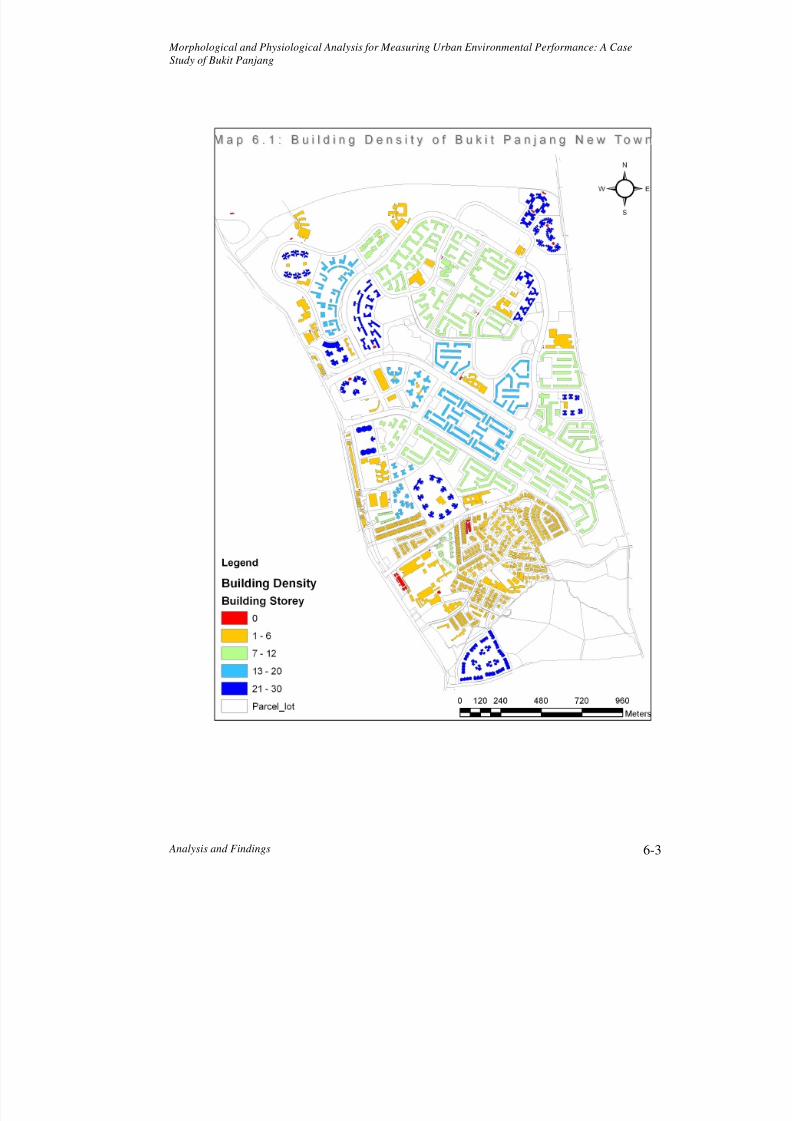
Map 6.1: Building Density of Bukit Panjang New Town 6-3
Page 9
8/6/2019 MEM Dissertation LAP
http://slidepdf.com/reader/full/mem-dissertation-lap 9/95
Morphological and Physiological Analysis for Measuring Urban Environmental
Performance: A Case Study of Bukit Panjang New Town
VII
Map 6.2: Building Status in Bukit Panjang New Town 6-4
Map 6.3: Topography of Plot Ratio in Bukit Panjang 6-6
Map 6.4: Plot Ratio Density in Bukit Panjang 6-7
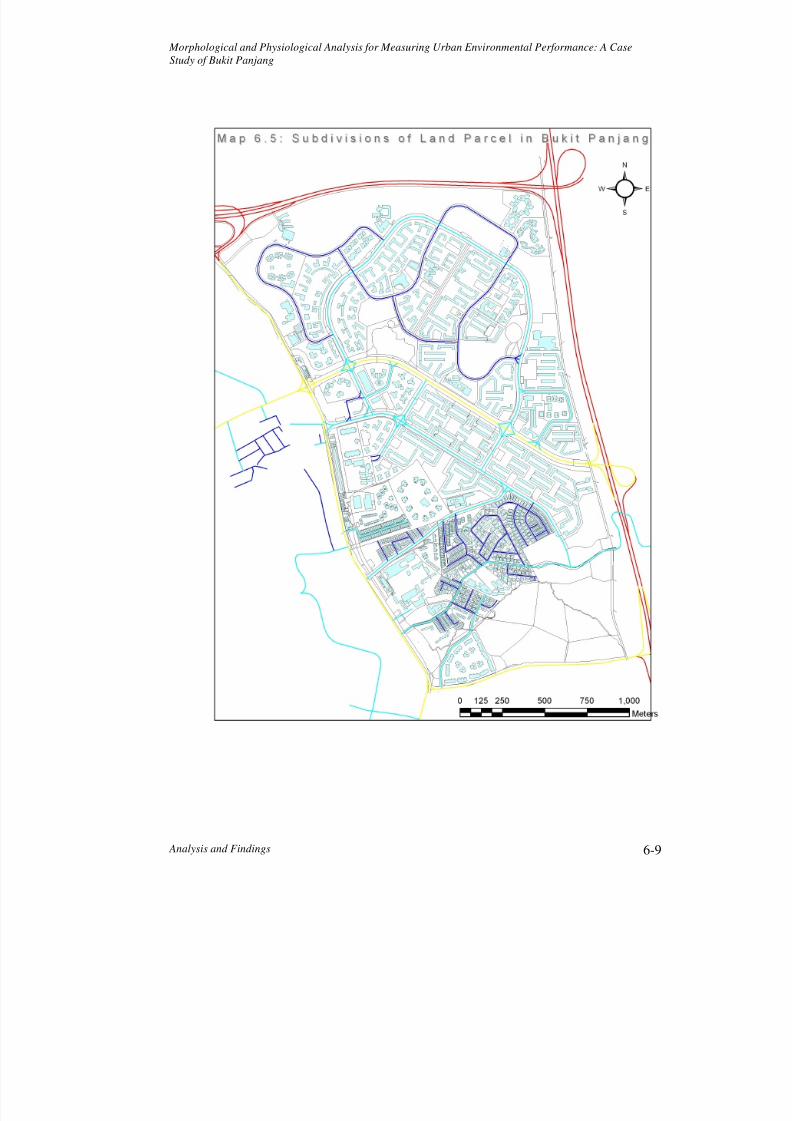
Map 6.5: Subdivisions of Land Parcels in Bukit Panjang 6-9
Map 6.6: Degree of Subdivision in Bukit Panjang 6-10
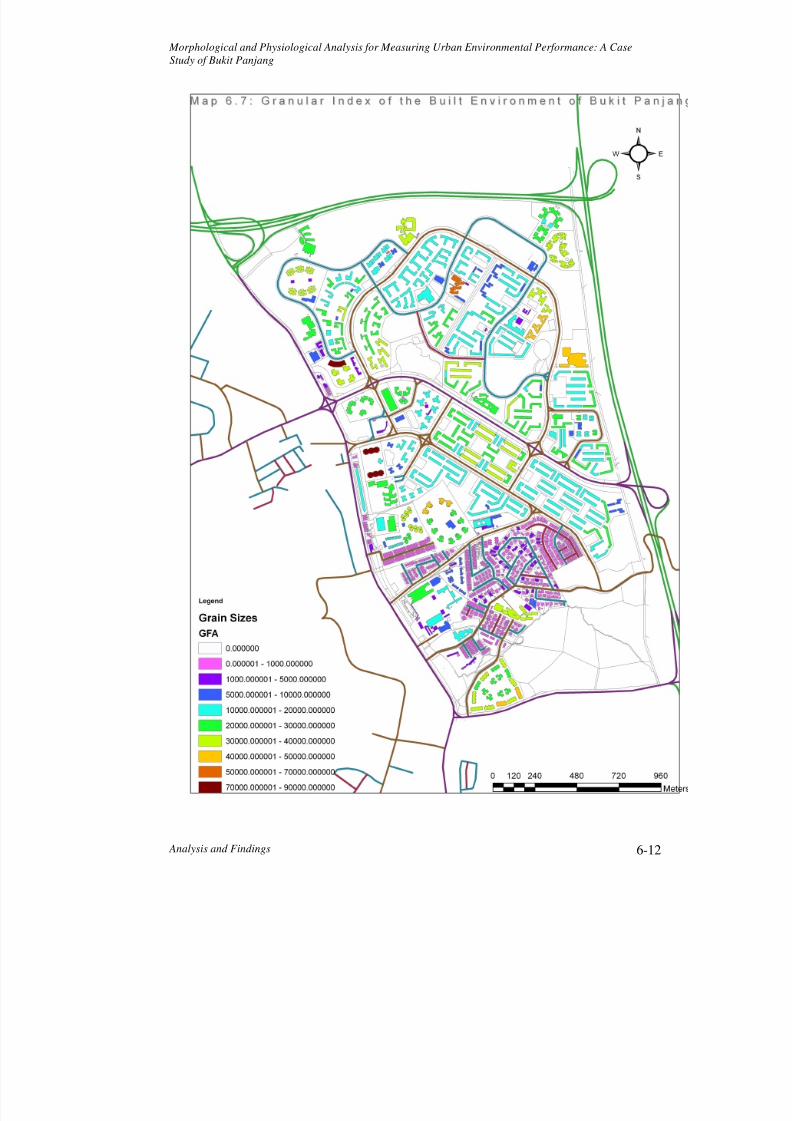
Map 6.7: Granular Index of Built Environment in Bukit Panjang 6-12
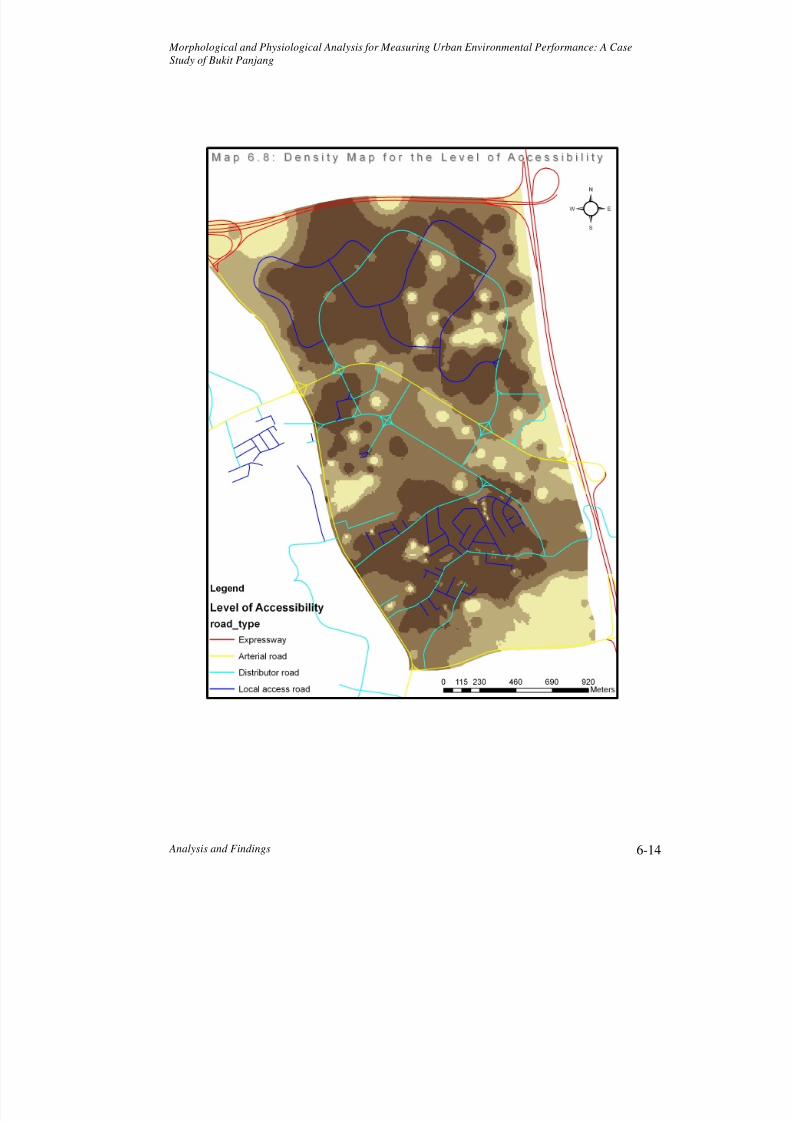
Map 6.8: Density Map for Level of Accessibility 6-14
Map 6.9: Topographical Representation for Level of Accessibility 6-15
Map 6.10: Density of Still (kg) in Bukit Panjang Buildings 6-17
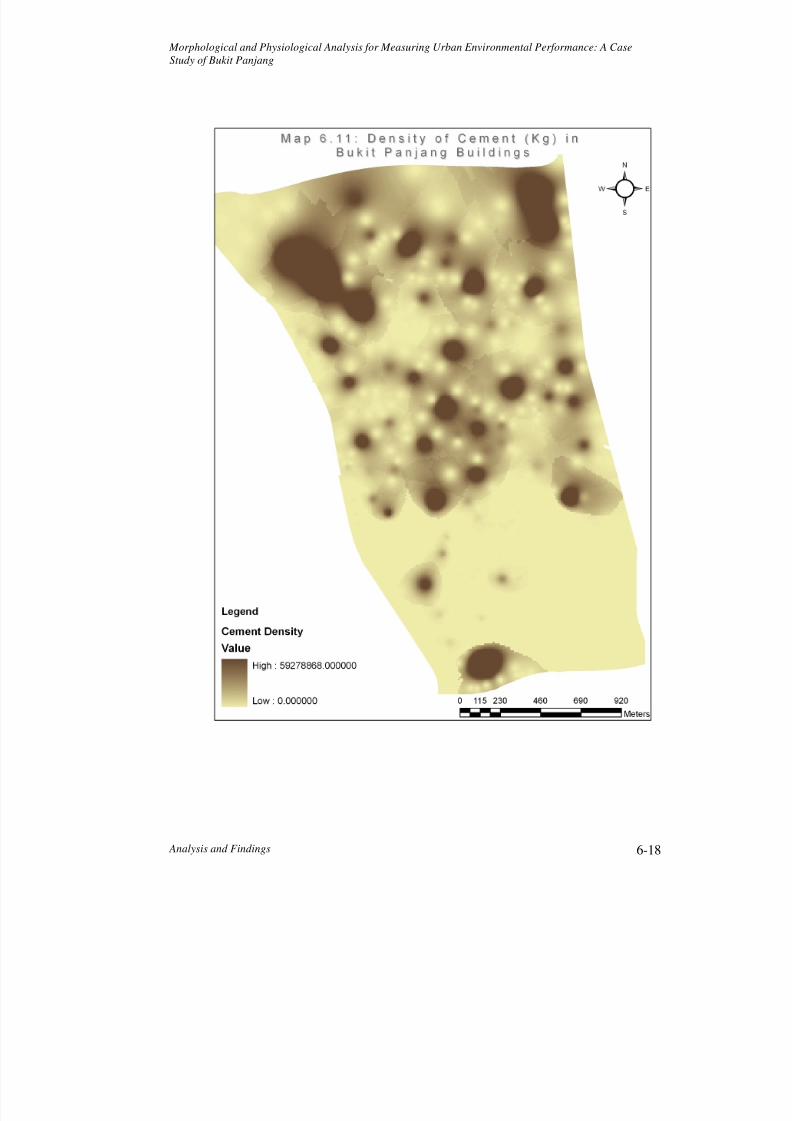
Map 6.11: Density of Cement (kg) in Bukit Panjang Buildings 6-18
Map 6.12: Density of Coarse Aggregate (kg) in Bukit Panjang Buildings 6-19
Map 6.13: Density of Fine Aggregate (kg) in Bukit Panjang Buildings 6-20
Map 6.14: Electricity Use Intensity (kWh/m2) of Bukit Panjang 6-22
Acronyms
GIS Geographic Information System
IT Information Technology
IUCN International Union for Conservation of Nature
WCED World Commission on Environment and Development
EPA Environmental Protection Agency
GHG Green House Gas
CIAT Chartered Institute of Architectural Technologists
USA United States of America
Page 10
8/6/2019 MEM Dissertation LAP
http://slidepdf.com/reader/full/mem-dissertation-lap 10/95
Morphological and Physiological Analysis for Measuring Urban Environmental
Performance: A Case Study of Bukit Panjang New Town
VIII
ULM Urban Landscape Model
EU European Union
LT Lighting and Thermal
NUS National University of Singapore
SLA Singapore Land Authority
URA Urban Redevelopment Authority
BCA Building Construction Authority
HDB Housing Development Board
MND Ministry of National Development
MRT Mass Rapid Transit
LRT Light Rail Transit
SP Singapore Power
GDP Gross Domestic Product
Page 11
8/6/2019 MEM Dissertation LAP
http://slidepdf.com/reader/full/mem-dissertation-lap 11/95
Introduction 1-1
Chapter 1
Introduction and Background
1.1 Introduction
When we note the term “Sustainable Development” or “Sustainability”, most of the
experts try to link between economics and environment. However, urban areas are key
objects for sustainable planning in terms of physical development of a country or region.
Urban system is centered in urban areas that are morphologically modified by the men
and in terms of ecosystem services, urban areas are primarily sites of consumption, use
and generating wastes, which are termed as ‘urban metabolism’ (outcome of physiological
processes). Urban areas are the major elements of the modern landscapes, and as such are
impacted by and are sources of significant ecological changes and landscapes
fragmentation (Perry, 2007). The urbanization process converts the vegetated landscapes
into fragmented building covers made of asphalt and concrete. These changes in nature of
landscapes (anthropogenic modification of urban morphology) have primarily affected
solar reflectivity, evaporative efficiency, and roughness of surface therefore
anthropogenic energy flows have come to an important role (i.e. electricity) through it.
Energy is necessarily required for various activities in urban ecosystem and it comes from
various sources. Energy has very vital implications in various activities (physiology of
city) in urban areas which in turn determine the urban morphology or vice versa.
Not only does the consumption of non-renewable resources deplete the world’s finite
material and energy stocks upon which economic and social development depend, but the
use of both renewable and non-renewable resources cause environmental degradation
during transportation, storage, processing and disposal (Guy et.al, 2001). The demands
for high energy consumption in modern industrialized cities are usually filled through
electricity and combustion of oil, gases and coal which ultimately produce another kind of
waste energy flow named ‘heat’. This phenomenon is popularly known as “Urban Heat
Page 12
8/6/2019 MEM Dissertation LAP
http://slidepdf.com/reader/full/mem-dissertation-lap 12/95
Introduction 1-2
Island (UHI)”. UHI is largely dependent on the urban form that determines the
physiological processes like energy flow and material flow etc within the urban
environment. Therefore needless to say that to understand the sustainability of any urban
environment there are an acute need to analyze the morphological and physiological
characteristics of the urban system.
1.2 Motivation of this Study
The motivation behind this work is to put emphasis on the significance of scientific
knowledge in evidence-based policy-making for sustainable development. The book
contents come within the scopes of the built environment and energy and material
consumption (flow) which is incorporated into the GIS as the principle interface for data
input, storage, retrieval, and manipulation. With the help of advanced IT capacity, further
various geo-process functions of queries, mapping, modeling, visualization and spatial
analysis have been carried out which is highly useful for the environmental decision
making space. The famous book of Oswald and Baccini (2003) named ‘Netzstadt’-
German word which means the ‘The Network of City’ has motivated a lot to carry out the
research. In fact, few indicators, terms and processes used in this thesis are mostly
replicated from the book.
It is known that the provision of electricity (physiological character) in cities is one of the
main drivers for sustainability, which helps to trade off the availability of natural
ventilation and natural light. Steemer (2003) notes that the energy and environmental
implications of buildings are much more significant than that for transport; however,
transport issues receive greater political attention as there is a stronger connection of local
pollution to cars; and because cars are associated with other issues, such as accidents and
social impacts. Given the effects of urban form on electricity consumption, it is highly
advisable to look at the particular unit of urban environment as a whole. However, the
majority of past studies mainly focused on individual buildings which not only limit the
progress towards sustainability, but also have the opposite effect on the building itself and
adjacent environments as well.
Page 13
8/6/2019 MEM Dissertation LAP
http://slidepdf.com/reader/full/mem-dissertation-lap 13/95
Introduction 1-3
This work is the author’s dissertation to fulfill the requirement of Masters of Science in
Environmental Management and aimed at formulating a correlation between urban form
and anthropogenic physical flows, specifically the issues of electricity consumption to
investigate their mutual influence over each other at the neighborhood blocks with the
ultimate aim to help the urban policy-makers and practitioners.
1.3 Objectives of the Study
Every research is ascertained to achieve few objectives. This study has also a set of
objectives to be achieved, they are to
- assess the selected morphological indicators for the study area
- identify very simple physiological behavior of the area
- see the correlation between two sets of indicators, and
- draw conclusion based on the two sets analysis for future urban
planning of Singapore.
1.4 Scopes of the Study
While sustainability is a prevailing issue in every kind of development, let alone the urban
development which is supposed to be the base of all other type of developments e.g.
infrastructures, industries, land development etc; therefore, sustainable urban development
requires transdisciplinary actions. Various disciplines like architecture, engineering,
natural science involved in this analysis could be able to address the specific problems
emerged from urban planning tasks. The long term objectives of these multi-criteria
analyses of urban environment may accomplish various aspects of whole urban system
e.g. to develop urban form or whole of the territories, the allowable metabolism for the
global and regional conditions, integration of other disciplines like social sciences,
economics, politics, anthropology as well as understanding of the whole urban system
processes like norms, institutions and technical infrastructures. When evaluating
environmental performance based on multi criteria analysis, electricity consumption as
energy flow has been considered. Though in small scale, the inclusion of energy in
Page 14
8/6/2019 MEM Dissertation LAP
http://slidepdf.com/reader/full/mem-dissertation-lap 14/95
Introduction 1-4
assessing environmental performance will bring a good result for energy efficiency for
various uses in urban areas for sustaining urban form.
1.5 Research Questions and Hypothesis
In the research following research questions are to be address:
1. On what components and elements the quality of an urban system depends and
how they are described, analyzed and visualized?
2. What tools are available to analyze urban environment? and
3. How the sustainable urban planning and design is governed by the
morphological and physiological analysis of an urban environment.
To address the above questions and from literature review some hypothesis were needed
to be tested. The testable hypotheses are as follows:
1. The urban environment depends on both its morphology e.g. arrangement of the
environmental fields and physiology e.g. the management, flow and consumption
of the resources.
2. Urban system is merely seen as a hierarchical arrangement rather than network
of nodes where high density of population and flow of energy and goods are
marked.
3. Urban system has three distinct elements namely nodes, connecting network
between nodes and a visible or empirical boarder.
4. Consumption of electricity varied from households to households is the
principal source of energy flows through urban system and material flow due to
Page 15
8/6/2019 MEM Dissertation LAP
http://slidepdf.com/reader/full/mem-dissertation-lap 15/95
Introduction 1-5
infrastructure and building constructions are considered the main material flow
through the urban environment for metabolism.
Apart from the above generalized hypotheses, hypotheses are made for analyzing various
indicators based on those depicted mainly in ‘Netzstadt’1
in subsequent chapters.
1.6 Limitations
Multifold limitations have been faced during carrying out the research, data collection and
data analysis. Firstly, an urban scale research is very time and resource consuming which
restricted the author to go in depth to analyze scenario. Use of GIS tools, the most
sophisticated software packages is costly therefore had to manage the GIS operation and
analysis in combined computer lab. Limitations also have been faced in the collected data
from the only land information provider agency (SLA) in Singapore; mismatches of shape
files in various layers were found which further impeded fine analysis. Again various
spatial data is not available to any single agency. For example building heights, landuse
data were not available to Singapore Land Authority (SLA) for which needed to contact
with Urban Redevelopment Authority (URA). Mismatches were found also in their data
i.e. in SLA data it is shown no building in some lots where as in URA data a particular
plot ratio is assigned for the buildings. To overcome with these type difficulties needed
extensive fieldworks, which are again self-supported, after all within such a short time
such an analysis with huge data volume is really much tedious.
1Oswald, F., & Baccini, P., in association with Michaeli, M. (2003) “ Netzstadt – Designing the Urban”.
Switzerland: Birkhauser.
Page 16
8/6/2019 MEM Dissertation LAP
http://slidepdf.com/reader/full/mem-dissertation-lap 16/95
Literature Review 2-1
Chapter 2
Literature Review
The principal components of this research are built on the sustainability of urban
environment and tools (morphological and physiological here in this research) for
analyzing urban environment to ensure sustainable urban planning and design. Therefore,
during literatures reviews from various resources, concentration is given put on the
relevant topics of sustainability, spatial and physical characteristics of city and built
environment, application of GIS in analysis etc.
2.1 Emergence of the issue of Sustainability
The Stockholm Environmental Conference of the United Nations (1972) was the first
major meeting of the international community to express grave concern over the
deteriorating environment (Hamm & Muttagi, 1998 p.1). At this conference 113 nations
pledged to begin cleaning up the environment and most importantly to begin the process
of tackling environmental issues on a global scale.
The combined term sustainable development was coined in the “World Conservation
Strategy” of the IUCN in 1980 (Huber, 1995), but it never gained paradigmatic appeal
before its use and interpretation in the WCED report. Since then, in addition to its political
impact, the term rapidly became a new research paradigm in a wide range of disciplines,
from the social sciences to biology (Becker, 1997).
The etymological roots of sustainability as a derivation from the Latin verb sustenere (=
uphold) (Redclift, 1994). This etymology is also reflected in the debate among Spanish-
speaking scientists; that is, whether sostenibilidad (from sostener ) or sustentabilidad
(from sustentar ) is the more accurate translation (Becker, 1997). The first term is closer to
the passive connotation of “being upheld,” while the latter reflects more the active aspect
of “to uphold.”
Page 17
8/6/2019 MEM Dissertation LAP
http://slidepdf.com/reader/full/mem-dissertation-lap 17/95
Literature Review 2-2
These considerations of terminology indicate that there is a strong normative component
in the concept of sustainable development. This value-driven normative aspect makes
sustainable development attractive for policymakers because it permits a direct translation
of political objectives into a broadly agreed overall concept (Becker, 1997).
Sustainability has come from a global political process that has tried to bring together,
simultaneously, the most powerful needs of the current decade:
the need for economic development to overcome poverty,
the need for environmental protection upon which we all ultimately depend, and
the need for social equity to enable local communities to express their values in
solving these issues.
Thus when the issue of sustainability is referred, it will be the simple idea that means the
simultaneous achievement of social, economic and environmental sustainability.
However, in my study the prime focus is on the environmental sustainability and its
consequences.
2.2 Sustainable Urban form
The emergence of “sustainable development” as a popular concept has received the
enormous discussions about the form of cities (Jabareen, 2004). The urban form directlyaffects habitat, ecosystems, endangered species, and water quality through land
consumption, habitat fragmentation, and replacement of natural cover with impervious
surfaces or surface sealing (EPA, 2001). Urban form also induces or reduces the length of
automobile travel, helps choosing mode of travel which ultimately affects the urban
environment.
In searching sustainable urban form we should try to answer- to what extent and in what
ways does urban form contribute to sustainability? Ideally sustainable urban form is the
orientation and arrangement of building clusters, their densities and layout, road
infrastructures and other physical infrastructures that would ensure:
- Environmental sustainability
- Social sustainability
- Economic sustainability
Page 18
8/6/2019 MEM Dissertation LAP
http://slidepdf.com/reader/full/mem-dissertation-lap 18/95
Literature Review 2-3
While sustainable development is to be ensured, the contemporary urban planners and
policy makers are on brain storming debates to find out the sustainable urban form so that
above mentioned three sustainability indicators can be ensured in various scales namely
regional, city, neighborhood and individual building level. In this regard, traditional urban
planners or designers attention has been more diverted to resource optimizing andefficient city or town planning.
The outcome from this debate, particularly in Europe, the USA and Australia was a strong
advocacy of the ‘compact city’ model. Essentially this is a high-density, mixed-use city,
with clear (i.e. non-sprawling) boundaries (Jenks et al., 1996; Williams et al., 2000).
Jabareen (2006) identified seven concepts for designing Sustainable Urban Form; they are
i) Compactness, ii) Sustainable Transport, iii) Density, iv) Mixed Land Uses, v) Diversity,
vi) Passive Solar Design and vii) Greening.
2.3 Environmental Performance of the Built Environment
The popularization of Sustainable Development has contributed to the promotion of the
urban compactness idea by enhancing the ecological and environmental justification
behind it (Yosef, 2006). It is believed that compact city is prescribed for its environmental
advantages. Less road networks, connected mixed used buildings with planned parks,
green areas and other landscaping provide sufficient greenery that has good environmental
effect on the surface sealed land cover i.e. buildings, courtyards, parking areas and streets.It is found that compact cities have an adverse environmental implication like the
generation of heat if the sufficient greenery and other environmental indicators are not
properly maintained.
Landscape plays an important psychological role in the urban areas and help to reduce the
effect of “urban heat island”, filters pollution, accommodates diverse wild life. Plants can
absorb noise and pollution. Urban landscape absorbs rain, reducing the discharge of urban
rainfall and storm water. As discussed earlier, compact city reduces the amount of travel
which in turn helps to generate more waste energy like CO2 and any other GHG. But
energy implication for buildings and other impervious surfaced structures are still
unknown for compact cities.
Page 19
8/6/2019 MEM Dissertation LAP
http://slidepdf.com/reader/full/mem-dissertation-lap 19/95
Literature Review 2-4
2.4 Sustainability Indicators of Urban form
The resource uses and environmental impacts of household consumptions are identified as
key aspects of sustainable development. Holden et al’s (2003) study also supports the
hypothesis that there is a connection between the characteristics of land uses andhousehold consumption of energy. Adolphe (2001) again found the conclusive evidence
of the influences of urban configuration on outdoor climatic conditions, on the energy
balance of buildings, and on diffusion of pollutants. The analysis of key indicators is
important for making decision about sustainable use and management of environmental
resources especially when environment is a dynamic concept. Indicators for the economic
and social development have already been developed and rigorously adopted. But
sustainable tools for assessing environmental development have been not yet discovered.
For assessing environmental performance we need to look for various environmental
indicators. Environmental indicators vary from scales to scales as we want to assess.
Typically air, water and land are considered the main component of an environment
therefore sustainability indicators are mainly based on the maintaining the quality of these
three components. On the other hand, indicators related to the arrangement of land and its
modification by people are considered as morphological indicators and the consumption,
process and management of air, water and other resources are related to physiological
indicators. In addition, when the issues of sustainable urban form arise, some relatively
new indicators come into discussion like material stock, energy flow, and green ratio.
2.4.1 Working with Morphological Indicators
Adolphe (2001) tried to obtain some generic behavior laws covering the complexity of
urban morphology and the variety of climatic conditions which have been put in a
substantial form through a scheme of morphological indicators which further had been
gone through a kind of rectification by a set of general criteria at the system level which
has been described in the paper as follows
(a) Completeness,
(b) No redundancy,
(c) Operationality,
Page 20
8/6/2019 MEM Dissertation LAP
http://slidepdf.com/reader/full/mem-dissertation-lap 20/95
Literature Review 2-5
At the indicator level, she has concentrated on the following criteria:
(1) Physical consistency, by looking for consistency of indicators with the physical
phenomena they are supposed to cope with;
(2) Spatial consistency, with indicators consistent with geographical (macroscopic) scale;
(3) Measurability, the availability of required data from common sources
(4) Legibility, with indicators easy to interpret;
(5) Comparability, by choosing indicators for which absolute values are not highly
significant, but for which relative variations (range and direction) are significant.
The hypothesis behind the selection of these set of indicator is as follows
The city is subjected to various interactive climatic considerations. This approach is
focused on the four most significant ones: wind, temperature, solar radiation (heat and
light), and humidity.
Adolphe’s model defined a set of indicators to measure the environmental performance of
urban fabrics: namely density, rugosity, porosity, sinuosity, occlusivity, compacity,
contiguity, solar admittance, and mineralization. This model has been embedded in a GIS
called Morphologic and applied to the analysis of existing urban fabric.
Applying the above indicators on three different urban areas i.e. a medieval neighborhood
in the center Toulouse (France), a suburban area predominant with detached house in
Blagnac (France), and a dense downtown area of Portland (USA) Adolphe summarized
the result as follows:
Page 21
8/6/2019 MEM Dissertation LAP
http://slidepdf.com/reader/full/mem-dissertation-lap 21/95
Literature Review 2-6
Building density: The lower building density (built area/total area ratio) prevails in the
suburban area, where it is four times lower than in a dense medieval fabric; in the US city,
the low footprint area of high-rise buildings is balanced by their height, but the density is
twice as low as in the European historic center.
Rugosity: The absolute rugosity which is the mean height of the urban canopy, variations
of which have been considered three times more important than those of mean building
height, because the area of non-built outdoor areas is used in the first calculation. Despite
large variations of the building height between a medieval fabric and a downtown district
in the United States, the absolute rugosity of the latter is only twice that of the first. The
comparisons between the three relative rugosity roses (defined as is the mean square
deviation of canopy height) give information about changes in the mean wind speed in a
given direction.
Porosity: The number of open `pores' in the urban canopy is significant in a high-rise
urban center, especially when compared with a dense medieval pattern but the comparison
with a suburban area with a high rate of non-built open spaces shows small variations
between them.
Sinuosity: This parameter characterizes the corridor effect of the street pattern. The author
put the example of the gridiron street pattern of Portland where the two perpendicular
directions corresponding to the street axis created a strong effect of wind canalization
(with sinuosity values close to zero, for a wide angle of distribution).
Occlusivity: The distributions of the built to non-built perimeter against height were found
varied widely between the different patterns. The medieval fabric corresponds to a high-
density city with relatively uniform building height, and can be related to a very narrow
mean sky-view angle when compared with the openness of the second pattern. The
suburban area has a low density and a wide distribution of the occlusivity ratio. The high-
rise pattern generates a narrow variation of the occlusivity factor with height.
Page 22
8/6/2019 MEM Dissertation LAP
http://slidepdf.com/reader/full/mem-dissertation-lap 22/95
Literature Review 2-7
Compacity: The analysis of compacity resulted in that the tall and isolated buildings
generate a low compacity. Contrastly, an established dense medieval fabric remains
insignificant (2.5 times) because the low height of each individual building (high exterior
area for the volume) is evened out by the high contiguity between buildings.
Contiguity: The author found the factor ‘contiguity’, which showed much variation (one
hundred times) between the US downtown and the medieval fabric. The high variations of
this parameter when compared to the low relative variations of the compacity factor show
the importance of using both parameters to qualify the geometry of buildings in an urban
pattern.
Solar admittance: The effect of shading neighboring buildings from sunlight is very
important with low and dense patterns such as the historic center. When compared with
suburban areas, there patterns can be seen to induce a lower solar admittance (less than
twice). Despite high and large glazed facades, a high-rise urban area suffers from mutual
shading between buildings.
Mineralization: Mineralization has been defined in this study as the presence of
substantial area covered with vegetation and water body which play significantly in
modifying local climate. The values of these indicators have been marked with very
slight variations between the three examples.
The indicators have been used in this research highly significant for small scale like
neighborhood level and it requires very complex data calculation (including various 3D
data), lot of metaphors have been used for these indicators so why seems very confusing
for beginner researcher. Particularly Adolphe’s research only concentrated on the
territorial arrangements but didn’t include the effects of these arrangements on the
physical consumption of the particular urban unit. It is also subject to further research
whether the indicators applicable for whole city scale.
Page 23
8/6/2019 MEM Dissertation LAP
http://slidepdf.com/reader/full/mem-dissertation-lap 23/95
Literature Review 2-8
In Urban Landscape Model (ULM) developed by Yoshida et.al (2005), the authors used
the six types of morphological properties, e.g. (1) surface area per projected area; (2)
volume per projected area; (3) building to land ratio; (4) mean height of buildings; (5)
surface area of buildings per unit volume of buildings; and, (6) mean volume of buildings
on city block wise over a study area sized of 2Km*2Km in Tokyo of Japan. In this study
remotely sensed LIDAR data has been used and converted into GIS platform to analyze
the selected properties on various types of residential, commercial and sub-urban blocks.
Yoshida et. al. expressed the first two properties by a featured space and represented as a
scattergram which is as follows:
For the third and forth properties the authors used two regulatory indicators namely BTL
(building to land ratio) and FAR (floor area ratio) which are shown by the following
histograms:
Page 24
8/6/2019 MEM Dissertation LAP
http://slidepdf.com/reader/full/mem-dissertation-lap 24/95
Literature Review 2-9
The fifth property named as surface area of buildings per unit volume of buildings has
been termed as ‘Compactness’ also. The compactness value found here according to the
calculating procedure depicted by the authors are different from the more conventional
compactness and it is called 3-dimensional compactness and the derivation of the formula
was as follows:
The variable, surface area per building volume was expressed as:
C = S/V
Where C, S and V denote respectively compactness, surface area and volume. For
comparison with the 2-dimensional compactness explained above, the variable for a
sphere can be calculated as follows. Surface area of a sphere is:
Page 25
8/6/2019 MEM Dissertation LAP
http://slidepdf.com/reader/full/mem-dissertation-lap 25/95
Literature Review 2-10
S = 4πr2
Here r is radius. Volume of a sphere is:
V = 4πr3 /3
Hence, in the case of a sphere, the ratio of surface area to volume is:
C = S/V = 3/r
This means that the larger the radius of a sphere is, the smaller the ratio becomes. In
reality spherical building is really rare however the authors favored the application of
same principle.
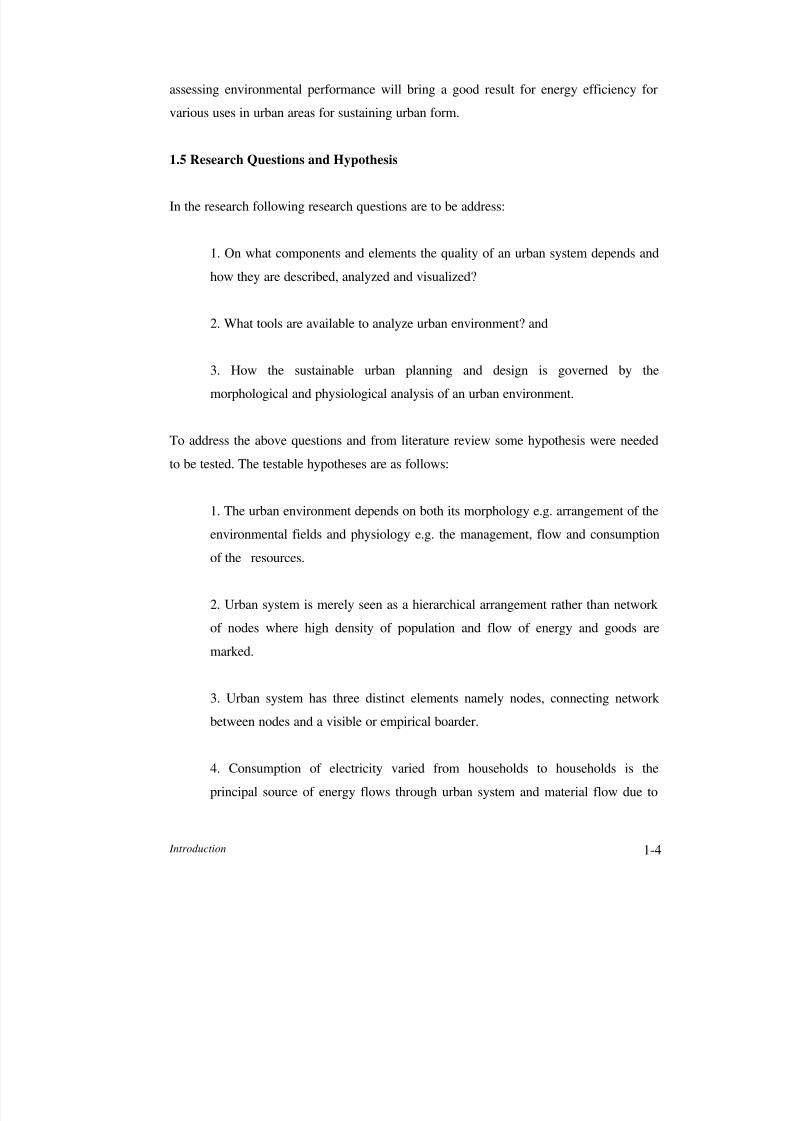
The last morphological property is derived simply by dividing total volume of buildings
by the number of buildings for each block, mean building volume can be derived and
expressed as below:
Regarding the limitations of the morphological indicators or properties used in ULM the
authors themselves found two items; one, the availability of data as the study area is
commercially very important city of Japan so they faced much obstacles to get the
required data and Second, there wide applications of ULM for comparison and analysis
internationally as well as domestically.
Page 26
8/6/2019 MEM Dissertation LAP
http://slidepdf.com/reader/full/mem-dissertation-lap 26/95
Literature Review 2-11
In “Netzstadt” method Oswald et.al (2003) used four morphological indicators on the
Wigger city of Switzerland and suggested how the analysis of those indicators can be
applied for the future sustainable urban planning and designing. These four indicators are
- Building Density
- Shredding
- Granulation
- Accessibility
The Netzstadt model proposes five criteria of urban quality namely identification,
diversity, flexibility, self-sufficiency and resource efficiency and relates these to specific
types of activity in the urban system. The Netzstadt method has put emphasizes on the
analysis of the morphological tools that describe the spatial characteristics of a territory
and as well as physiological tools--these refer more specifically to processes.
2.4.2 Working with Physiological Indicators
During finding the challenges for the compact city as a sustainable urban form, with the
support from past literatures Holden et al (2005) identified that three activities namely
housing, transport and food are the main source of the highest physical consumption in
the form of material flow, energy flow and waste generation and account for as much as
80 per cent of the direct and indirect environmental impacts by the households. The
authors have studied the relationships between land use characteristics and following four
distinct consumption categories:
- energy use for heating and operating the house;
- energy use for everyday travel;
- energy use for long leisure-time travel by plane; and,
- energy use for long leisure-time travel by car.
These four consumption categories have been regarded as ‘household consumption’
throughout the article. The authors conducted study on eight residential areas and tried to
Page 27
8/6/2019 MEM Dissertation LAP
http://slidepdf.com/reader/full/mem-dissertation-lap 27/95
Literature Review 2-12
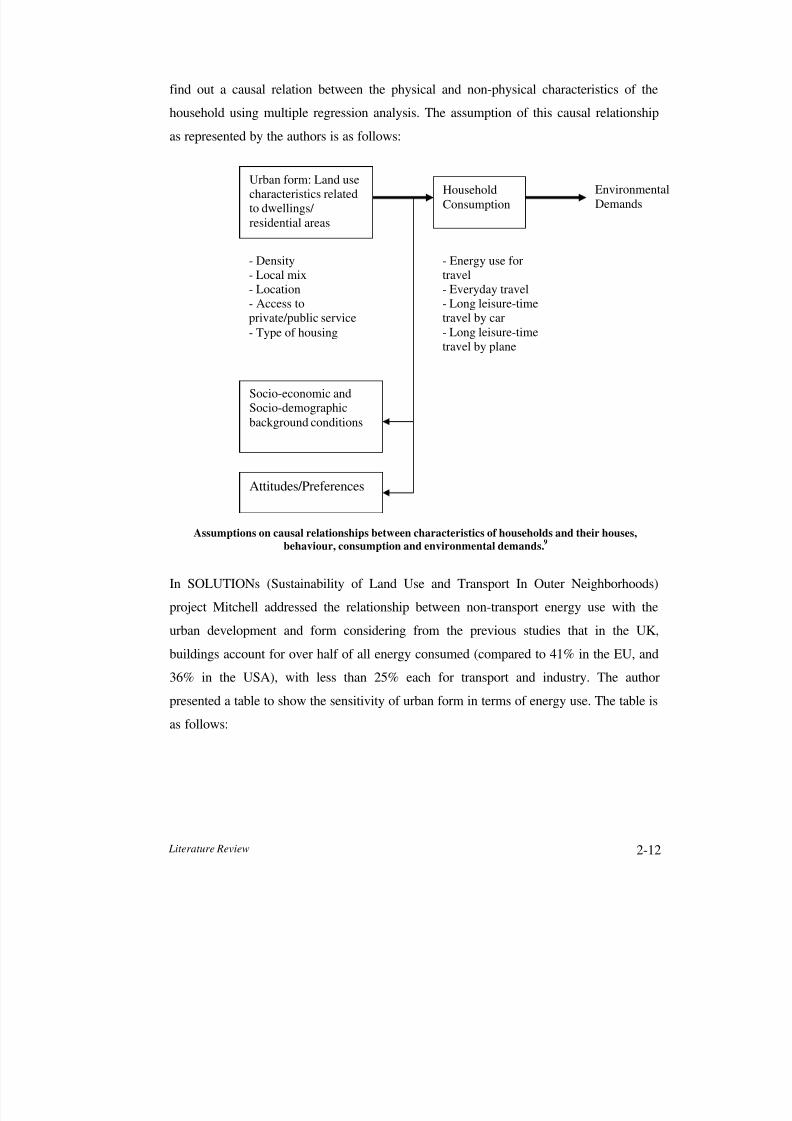
find out a causal relation between the physical and non-physical characteristics of the
household using multiple regression analysis. The assumption of this causal relationship
as represented by the authors is as follows:
Assumptions on causal relationships between characteristics of households and their houses,
behaviour, consumption and environmental demands.9
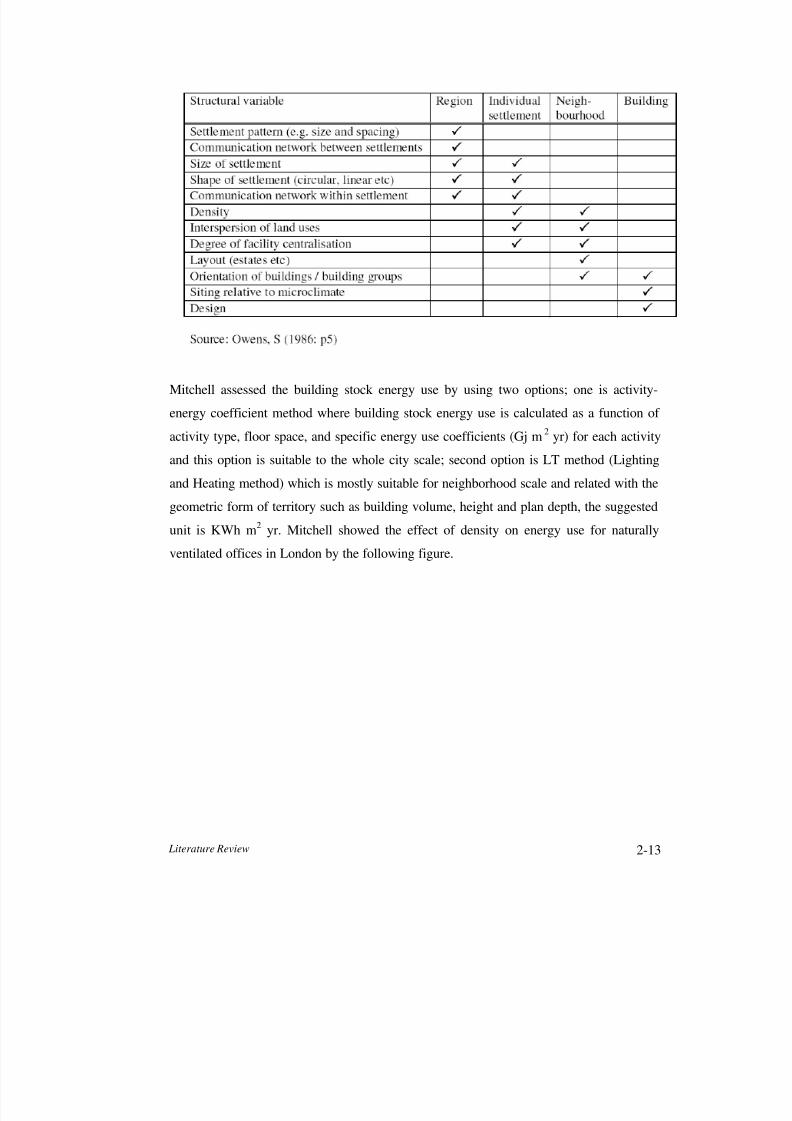
In SOLUTIONs (Sustainability of Land Use and Transport In Outer Neighborhoods)
project Mitchell addressed the relationship between non-transport energy use with the
urban development and form considering from the previous studies that in the UK,
buildings account for over half of all energy consumed (compared to 41% in the EU, and
36% in the USA), with less than 25% each for transport and industry. The author
presented a table to show the sensitivity of urban form in terms of energy use. The table is
as follows:
Urban form: Land use
characteristics related
to dwellings/
residential areas
- Density
- Local mix
- Location
- Access to
private/public service
- Type of housing
Socio-economic and
Socio-demographic
background conditions
Attitudes/Preferences
Household
Consumption
Environmental
Demands
- Energy use for
travel
- Everyday travel
- Long leisure-time
travel by car
- Long leisure-time
travel by plane
Page 28
8/6/2019 MEM Dissertation LAP
http://slidepdf.com/reader/full/mem-dissertation-lap 28/95
Literature Review 2-13
Mitchell assessed the building stock energy use by using two options; one is activity-
energy coefficient method where building stock energy use is calculated as a function of
activity type, floor space, and specific energy use coefficients (Gj m2
yr) for each activity
and this option is suitable to the whole city scale; second option is LT method (Lighting
and Heating method) which is mostly suitable for neighborhood scale and related with the
geometric form of territory such as building volume, height and plan depth, the suggested
unit is KWh m2
yr. Mitchell showed the effect of density on energy use for naturally
ventilated offices in London by the following figure.
Page 29
8/6/2019 MEM Dissertation LAP
http://slidepdf.com/reader/full/mem-dissertation-lap 29/95
Literature Review 2-14
Oswald et.al (2003) again in the ‘Netzstadt’ proposed a set of indicators for the analysis of
physical process of the cities. They compared the urban system with living organism and
selected the transport and transformation of materials and energy as the physiological
processes i.e. urban metabolism. According to the authors, physiological tools are
required to understand an urban system’s physical resources and management so that the
findings can be implemented for planning a new urban system. In the ‘Netzstadt’ method
four basic activities are identified which provoke the flows of material, water, energy and
waste in an urban system; these activities are
Page 30
8/6/2019 MEM Dissertation LAP
http://slidepdf.com/reader/full/mem-dissertation-lap 30/95
Literature Review 2-15
- to nourish
- to clean
- to reside and work
- to transport and communicate
Assuming that the urban metabolism system is highly driven by the anthropogenic
activities, the proposed physiological indicators are as follows:
i. Density of inhabitants (inhabitants/sq. km of settlement area)
ii. Density of workplaces (workplaces/workforce inhabitants)
iii. Density of services (workforce of tertiary sector/total workforce)
iv. Density of institutions (number of specific institutions/ 2000 inhabitants)
v. Workforce (flows) (Commuter ratio)
vi. Students (flows) (Commuter ratio)
The two other desirable indicators are as suggested by the authors are
- Consumers (flows)
- Information (flows in bits and bytes)
2.5 Multi Scale Assessments of Environmental Performance and GIS
Planners and policy makers operate at various scales to deal with different types of
environmental problems of interest within their jurisdictions and seek solutions to handle
the complexities of natural and human actions cause these problems. Indicators for
assessing environmental performance vary from various levels we want to assess e.g.
indicators for assessing a country will be different for the indicators assessing a region or
city, similarly the indicators to assess the latter will not be effective to assess in case of
community level. Also within each level there are multiple variables that needed to assess
for measuring sustainability. Therefore, planners and decision makers sometimes
concentrate on the evaluation of multi-scale assessment of environmental indicators to
measure the performance of environment. This integrated approach enables to create a
planning space where it is possible to take planning decision in more scrutinized way that
embrace possible all aspects of environment.
Page 31
8/6/2019 MEM Dissertation LAP
http://slidepdf.com/reader/full/mem-dissertation-lap 31/95
Literature Review 2-16
Isabelle (1999) developed a model based on the statistical tool i.e. regression analysis
which establishes a relationship between the electricity consumption per capita per year
with some demographic and socio-economic characteristics or variables of few Canadian
cities i.e. average inhabitant age, the annual degree-days below 180C, the urban density
(inhabitants per km2
), the share of homes heated by electricity, the standardized landwealth per inhabitant and planning, leisure and cultural expenditure per inhabitant which
the authors represented respectively by AVGAGE, DEGDAY, DENSITY, ELECTRIC,
LANDWEAL, PLANLEAS and established the model as:
Y = -16964+389.47*AVGAGE+1.016*DEGDAY -
0.498*DENSITY+86.47*ELECTRIC+0.1159*LANDWEAL
By Y she indicated the dependent variable, the annual city electricity consumption perinhabitant. The author excluded industrial electricity because the electricity consumption
per capita for industrial use is not congruent with cities electricity consumption.
The model seems very interesting and simply represented an important relationship
between the urban population density and electricity consumption but in this model no
morphological characteristics have been included.
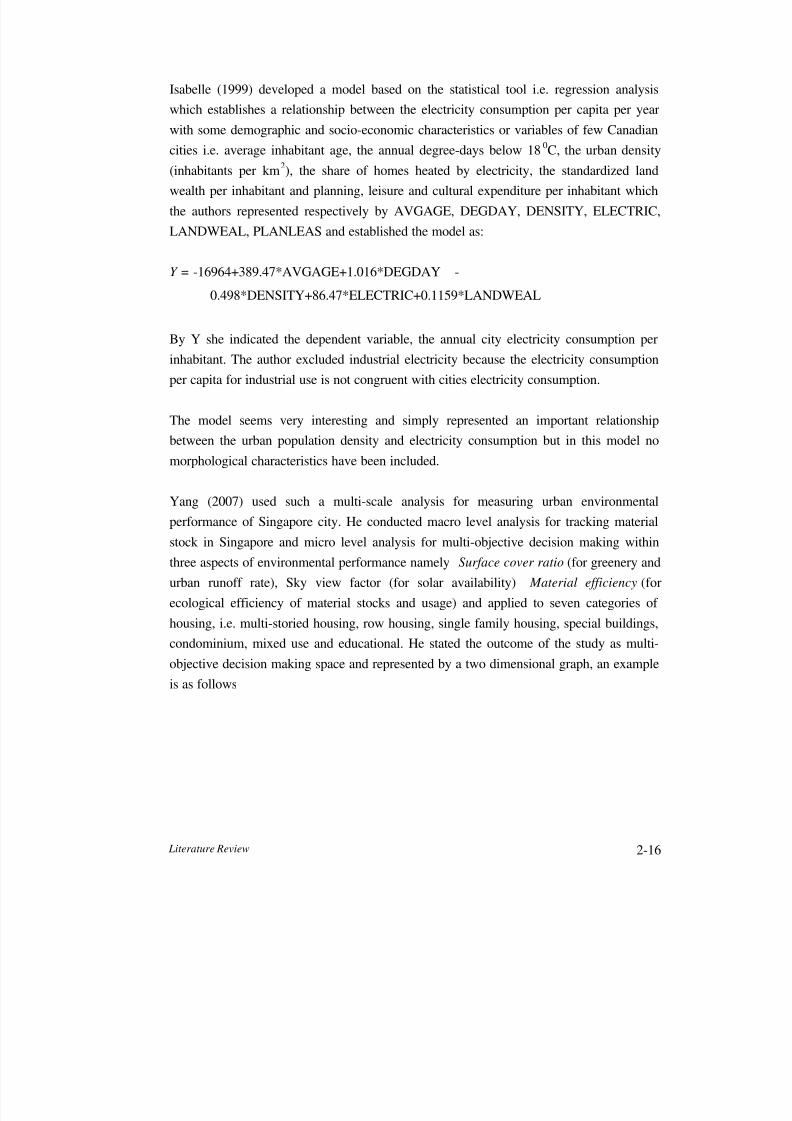
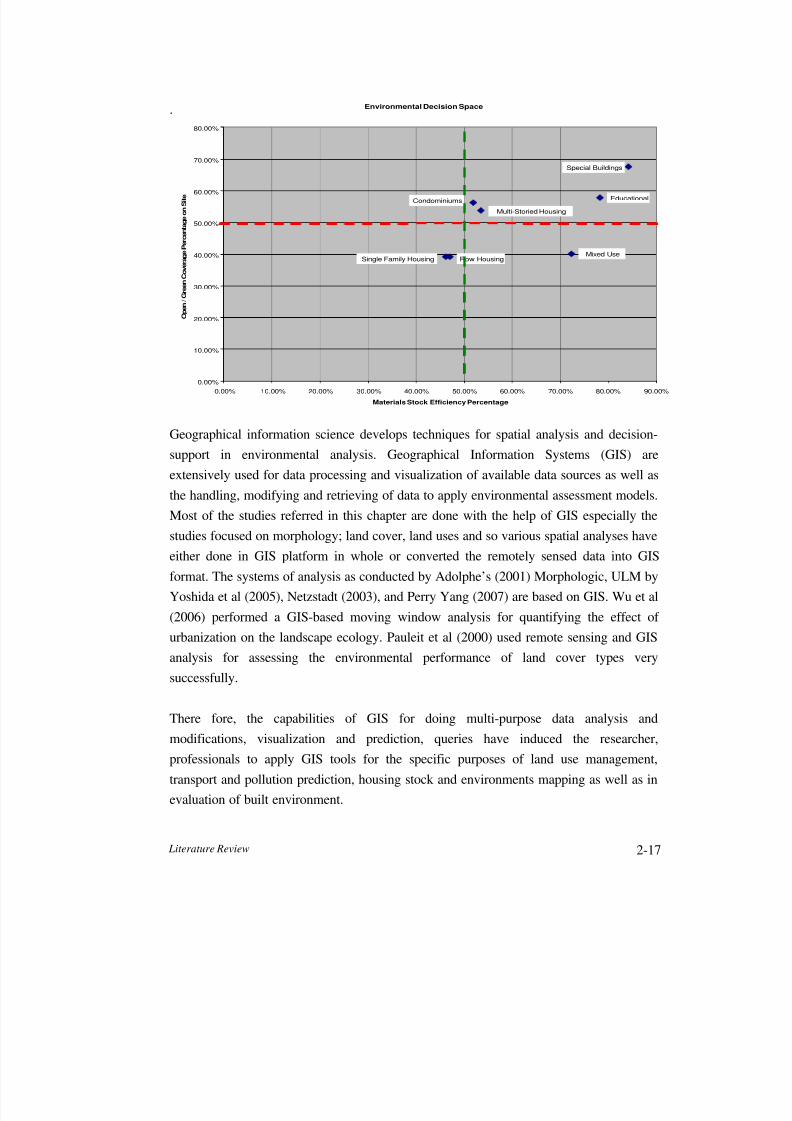
Yang (2007) used such a multi-scale analysis for measuring urban environmental
performance of Singapore city. He conducted macro level analysis for tracking material
stock in Singapore and micro level analysis for multi-objective decision making within
three aspects of environmental performance namely Surface cover ratio (for greenery and
urban runoff rate), Sky view factor (for solar availability) Material efficiency (for
ecological efficiency of material stocks and usage) and applied to seven categories of
housing, i.e. multi-storied housing, row housing, single family housing, special buildings,
condominium, mixed use and educational. He stated the outcome of the study as multi-
objective decision making space and represented by a two dimensional graph, an example
is as follows
Page 32
8/6/2019 MEM Dissertation LAP
http://slidepdf.com/reader/full/mem-dissertation-lap 32/95
Literature Review 2-17
.
Geographical information science develops techniques for spatial analysis and decision-
support in environmental analysis. Geographical Information Systems (GIS) are
extensively used for data processing and visualization of available data sources as well as
the handling, modifying and retrieving of data to apply environmental assessment models.
Most of the studies referred in this chapter are done with the help of GIS especially thestudies focused on morphology; land cover, land uses and so various spatial analyses have
either done in GIS platform in whole or converted the remotely sensed data into GIS
format. The systems of analysis as conducted by Adolphe’s (2001) Morphologic, ULM by
Yoshida et al (2005), Netzstadt (2003), and Perry Yang (2007) are based on GIS. Wu et al
(2006) performed a GIS-based moving window analysis for quantifying the effect of
urbanization on the landscape ecology. Pauleit et al (2000) used remote sensing and GIS
analysis for assessing the environmental performance of land cover types very
successfully.
There fore, the capabilities of GIS for doing multi-purpose data analysis and
modifications, visualization and prediction, queries have induced the researcher,
professionals to apply GIS tools for the specific purposes of land use management,
transport and pollution prediction, housing stock and environments mapping as well as in
evaluation of built environment.
Environmental Decision Space
0.00%
10.00%
20.00%
30.00%
40.00%
50.00%
60.00%
70.00%
80.00%
0.00% 10.00% 20.00% 30.00% 40.00% 50.00% 60.00% 70.00% 80.00% 90.00%
Materials Stock Efficiency Percentage
O p e n / G r e e n C o v e r a g e P e r c e n t a g e o n S i t e
Special Buildings
Row Housing
Educational
Mixed UseSingle Family Housing
Multi-Storied Housing
Condominiums
Page 33
8/6/2019 MEM Dissertation LAP
http://slidepdf.com/reader/full/mem-dissertation-lap 33/95
Literature Review 2-18
2.6 Knowledge Gap
It can be certainly said that there are a number of very influential researches on both the
morphological and physical characteristics of the city but very limited efforts have been
made on the relationship between these two at the same time and in GIS environment.
Though Holden et al’s (2005) research pointed on the relation between land use
characteristics and household energy consumption; however, merely accounted the
electricity consumption and considered only one spatial indicator. Similarly, hardly any
research found that dealt with the relationship between spatial characteristics of any urban
unit and the material flow. Therefore, in this research a multi-criteria analysis of
morphological indicators and physiological indicators are to be carried out within a GIS
platform.
Page 34
8/6/2019 MEM Dissertation LAP
http://slidepdf.com/reader/full/mem-dissertation-lap 34/95
Morphological and Physiological Analysis for Measuring Urban Environmental Performance: A Case
Study of Bukit Panjang
Methodological Framework 3-1
Chapter 3
Methodological Framework
3.1 Selection of Study Area
In the process of selecting study area some factors like data availability, recent
development as urban area, presence of diverse environmental attributes are considered.
One of the new towns of Singapore named ‘Bukit Panjang’ was selected, therefore, as
study area with the consultation of distinguished research supervisor and past researchers
under his supervision.
3.2 Collection of Necessary Maps
There was no individual map so far prepared for Bukit Panjang that meets the research
interests. Therefore, a wide range of digital data were needed to collect from Singapore
Land Authority and Urban Redevelopment Authority; paper based maps from Information
Resource Centre of School of Design and Environment, NUS and from various other
discrete sources from which the concerned areas and features were delineated using
various software.
3.3 Literature Survey
The literatures that deal with simultaneously urban morphological and physiological
characteristics are not satisfactorily available. Very limited literary resources could be
gathered to enhance the knowledge of these two diverse fields of urban environment andthen tried to explain their implications on my research subjects. Especially while
considering the human induced indicators e.g. fossil fuel or electricity consumption, the
concepts of urban physiological analysis are relatively new field of knowledge. Therefore,
searching literatures to find effective physiological analysis parameter for sustainable
urban planning appeared as a daunting task. Various journals namely ‘Journal of Urban
Page 35
8/6/2019 MEM Dissertation LAP
http://slidepdf.com/reader/full/mem-dissertation-lap 35/95
Morphological and Physiological Analysis for Measuring Urban Environmental Performance: A Case
Study of Bukit Panjang
Methodological Framework 3-2
Design’, ‘Computers, Environment and Urban Systems’, ‘Environment and Planning B’,
‘Landscape and Urban Planning’, as well as few chapters of some text books especially
‘Netzstadt’ were very useful for realizing my research subjects.
3.4 Identification and principles of Indicators
For morphological analysis of the study area, a number of indicators were primarily
selected from various literatures (discussed in literature review chapter). Ironically, most
of them involved 3 dimensional calculations of urban elements and required time
consuming manual calculations from diverse fields of data. Therefore, considering our
time and resource constraints some indicators were chosen mainly based on the indicators
used by Oswald and Baccini in ‘Netzstadt’ by modifying few variables used for
mathematical calculations. It should be claimed that, the indicators used in this study are
not similar to the indicators used in ‘Netzstadt’. These three indicators are:
i. Plot ratio
ii. Degree of subdivision
iii. Granular index
iv. Level of accessibility
Similarly, few indicators were available for urban physiological analysis but most of them
are concentrated on highly voluminous data collection and complex calculations so very
simple indicators have been chosen for their relatively availability and calculability. The
two indicators considered in this research are:
i. Material Intensity
ii. Electricity Use Intensity
The major activities and materials in the urbanization process are the construction
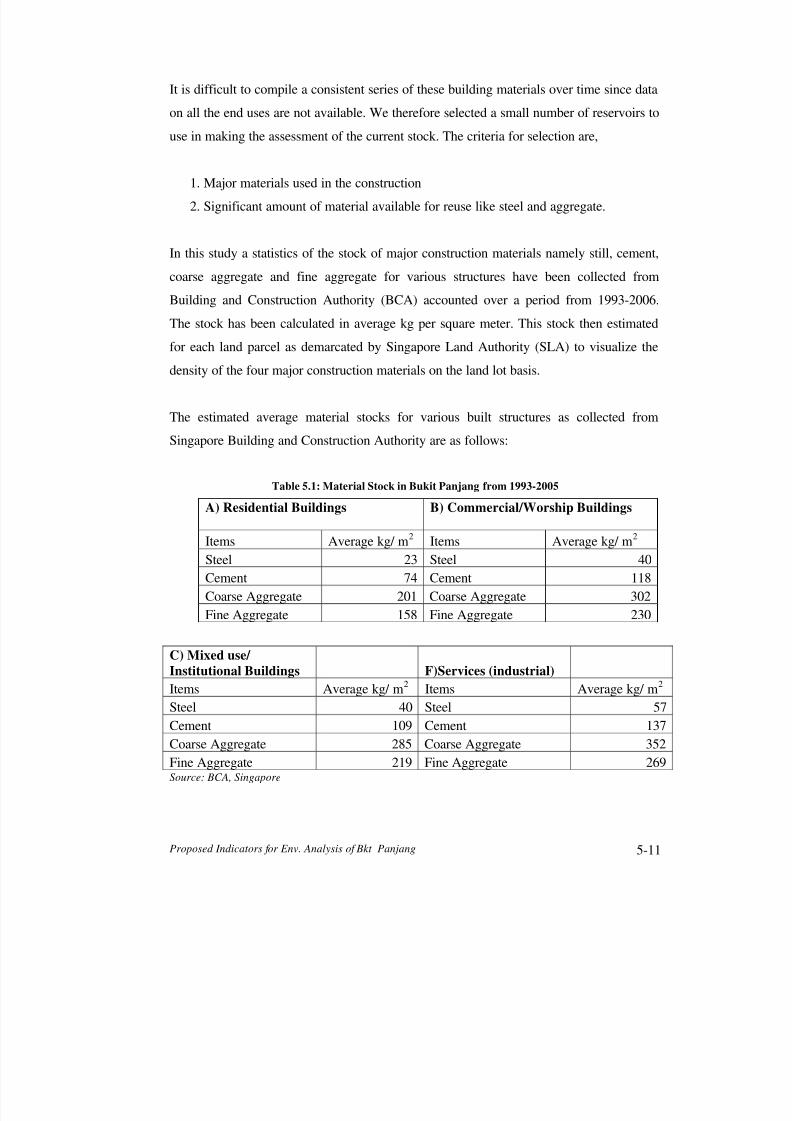
industries and the building materials respectively. It is difficult to compile a consistent
series of these building materials information over time since data on all the end uses are
Page 36
8/6/2019 MEM Dissertation LAP
http://slidepdf.com/reader/full/mem-dissertation-lap 36/95
Morphological and Physiological Analysis for Measuring Urban Environmental Performance: A Case
Study of Bukit Panjang
Methodological Framework 3-3
not available. We therefore select a small number of reservoirs to use in making the
assessment of the current stock. The criteria for selection are,
1. Major materials used in the construction
2. Significant amount of material available for reuse like steel and aggregate.
3.5 Collection and Compilation of Data and Information
The main source of data was the Singapore Land Authority from where copyright
protected land information of whole Singapore was collected in GIS format with the help
of the research supervisor. However, unfortunately all the required information on details
of a parcel of land were not included in the SLA data therefore data and information also
were collected from URA and synchronized with SLA data in ArcGIS 9.2 platform. The
construction materials data have been collected from BCA and HDB and the electricity
consumption data has been collected from Singapore Power, questionnaire survey and
concerned official interview.
After the collection of the data they are compiled in ArcMap 9.2 and Arc Catalog 9.2 as
well as in MS Excel and STATA according to desired order of necessary calculations.
3.6 Calculation of the Indicators
The following mathematical equations are used to visualize the data and the equations
have been derived by slight modifying of the original equations as are in ‘Netzstadt’. All
necessary variables have been calculated in ArcMap using command like ‘Calculate
Geography’, ‘Select by Attributes’, Select by Location’, etc as the base database only
contain the spatial and oracle attributes.
Page 37
8/6/2019 MEM Dissertation LAP
http://slidepdf.com/reader/full/mem-dissertation-lap 37/95
Morphological and Physiological Analysis for Measuring Urban Environmental Performance: A Case
Study of Bukit Panjang
Methodological Framework 3-4
a. Building Density:
The mathematical formula used for visualizing the building density of Bukit Panjang is as
below
Plot Ratio =
b. Degree of Subdivision
Degree of subdivision is realized using the relationship between Degree of coherence, C
and Degree of Subdivision, S is
S = 1/C
The Degree of Coherence indicator targets the very serious problem of fragmentation or
shredding the totality of the territory into numerous parts, which ultimately hinder future
development of the land. A highly splintered (i.e. because of road cutting through or small
scale allotment structure) land offers less opportunity for urban intervention, than a
coherent one. Degree of Coherence is an index for the statistic probability of individual
building (Ai) to be superimposed if the building footprints divide land parcel in various
segments. For calculating the degree of coherence for land parcel the formula used in this
study as follows:
C= ∑ (Ai /A tot)2, which equals C = 1/ A tot
2∑ Ai
2
Where Ai = Building footprint (BF) area (m2) of building i; and A tot = total BFA of all
buildings within the same parcel with building i.
∑ (Building Footprint*No of stories)
Area of the particular parcel of land
Page 38
8/6/2019 MEM Dissertation LAP
http://slidepdf.com/reader/full/mem-dissertation-lap 38/95
Morphological and Physiological Analysis for Measuring Urban Environmental Performance: A Case
Study of Bukit Panjang
Methodological Framework 3-5
c. Grain Sizes
In this study to visualize the granular index or grain size differences the gross floor area
has been considered to see the mixing rate of the various types and heights of buildings.
d. Degree of Accessibility
Accessibility has been measured here based on the land parcels’ proximity to nearest level
of road network where a hierarchy of road network is made based on their functions
namely Expressway, Arterial road, Distributor road and Access road which are again
weighted respectively as 1, 2, 3 and 4. Finally a 50 meter buffer is used to estimate level
of accessibility of the land parcels and the built elements within them. 50 meter buffer is
used because previous researches showed that a person’s approximate ability to walk 50
meter without much trouble.
e. Material intensity
In this study actually material intensity has been elucidated with the concept of the stock
of four major construction materials namely still, cement, coarse aggregate and fine
aggregate for various structures statistics of which have been collected from Building and
Construction Authority (BCA) accounted over a period from 1993-2006. The stock has
been calculated in average kg per square meter. This stock then estimated for each land
parcel as demarcated by Singapore Land Authority (SLA) to visualize the density of the
four major construction materials on the land lot basis.
This stock (kg/m2) is then converted in to the density by multiplying the Gross Floor Area
(m2) of various built structures with corresponding average material stock value.
Therefore,
Material intensity = Material Stock (kg/m2) * GFA (m
2), which is calculated on the parcel
basis.
Page 39
8/6/2019 MEM Dissertation LAP
http://slidepdf.com/reader/full/mem-dissertation-lap 39/95
Page 40
8/6/2019 MEM Dissertation LAP
http://slidepdf.com/reader/full/mem-dissertation-lap 40/95
Morphological and Physiological Analysis for Measuring Urban Environmental Performance: A Case
Study of Bukit Panjang
Methodological Framework 3-7
The whole methodological framework can be shown by the following chart:
Online ResourcesOnline Resources
Proposals and Recommendations
Collection of Data and Information
Calculation of the Indicators
Analysis and Visualization of the Indicators
Secondary SourcePrimary Source
Identification and Principles of the Indicators
Selection of Study Area
Collection of Necessary Maps
Literature Survey
Online ResourcesJournal Text Books
Figure 3.1: Methodological Framework
Page 41
8/6/2019 MEM Dissertation LAP
http://slidepdf.com/reader/full/mem-dissertation-lap 41/95
Morphological and Physiological Analysis for Measuring Urban Environmental Performance: A Case
Study of Bukit Panjang
Study Area 4-1
Chapter 4
Study Area2
4.1 History and Location
Urban Redevelopment Authority (URA), a statutory board of Singapore under Ministry of
National Development (MND) divided whole Singapore in 55 planning areas in its aim to
create a tropical city of excellence. The study area for this research, Bukit Panjang, is one
of the planning areas of Singapore. It is situated in the Central North-Western part of
mainland Singapore. Bukit in the Malay Language means "hill" and Panjang mean "long".
Bukit Panjang literally means "long hill" which gets its name from the long range of low
hills which ends in Bukit Timah to the south (Wikipedia).
This area used to comprise rural settlements in early 1990's. Today, it has many suburban
facilities like the Cold Storage Dairy Farm, as well as factories and granite quarries. Bukit
Timah Hill, which means 'tin hill' in Malay, is Singapore's first and largest Nature
Reserve. Today, Bukit Timah Nature Reserve is set aside of the Bukit Timah expressway
for the propagation, protection and preservation of the indigenous fauna and flora of
Singapore.
Bukit Panjang can be found in the Central North-Western region of Singapore. There are
seven sub-zones in Bukit Panjang; Senja, Sujana, Fajar, Bangkit, Bukit Panjang, Dairy
Farm and the Nature Reserve. The size of Bukit Panjang Planning area is about 9 Sq Km
with an estimated 55,000 residents.
4.2 Profile of the Study Area
There are many new HDB Towns here, namely Senja, Bukit Panjang, Fajar and Bangkit
as well as private estates comprising of both condominiums and landed property like
terrace housing can be found here. Bukit Panjang has been planned by URA to develop as
2http://www.streetdirectory.com/travel_guide/singapore/singapore_district/244/bukit_panjang.php
Page 42
8/6/2019 MEM Dissertation LAP
http://slidepdf.com/reader/full/mem-dissertation-lap 42/95
Morphological and Physiological Analysis for Measuring Urban Environmental Performance: A Case
Study of Bukit Panjang
Study Area 4-2
residential and nature reserve area. As Bukit Panjang is situated opposite to Choa Chu
Kang, the town is accessible via the Bukit Panjang LRT from the Choa Chu Kang MRT
station. The Light Rapid Transit or LRT is a smaller Rapid Transit line transport
passengers deeper into the residential areas.
The study area is surrounded by Kranji expressway at the northern side, Bukit Timah
expressway on the eastern side, dairy farm road on the southern side and interconnected
Woodland roads and Upper Bukit Timah road on the western side have made the study
area almost like a trapezium. Buikt Panjang road goes through the study area connecting
Woodland and Upper Bukit Timah Road with Bukit Timah expressway.
A map of Singapore and the study area generated from Google map are shown in the next
page.
Page 43
8/6/2019 MEM Dissertation LAP
http://slidepdf.com/reader/full/mem-dissertation-lap 43/95
Morphological and Physiological Analysis for Measuring Urban Environmental Performance: A Case
Study of Bukit Panjang
Study Area 4-3
Map 4.1: Singapore Map3
3 http://www.mightyminds.com.sg/images/Maps/sing%20map%20large%20lam.jpg
Map 4.2: Study Area (Bukit Panjang)
Page 44
8/6/2019 MEM Dissertation LAP
http://slidepdf.com/reader/full/mem-dissertation-lap 44/95
Proposed Indicators for Env. Analysis of Bkt Panjang 5-1
Chapter 5
Proposed Indicators for Environmental Analysis of Bukit Panjang
5.1 Urban Environmental Performance
Urban areas should be the domain of accelerating sustainable human settlement
development keeping pace with the ever increasing rate of urbanization. For this sake, it is
an essential step to analysis the particular urban environment, which is the most
significant aspect for ensuring sustainable development. Urban environment among others
is primarily comprised of the spatial patterns developed by human activities as well as the
management, process and flow of resources used in various spatial units by human.Referring various studies Alberti (1999) mentioned that urban spatial configuration
implies the individual choices that have consequences for the environment. In fact energy
flow is considered the major environmental implications when considered the
morphological character of the cities which is supported by various studies (Perry, 2007;
Adolphe, 2001; McPherson, 1994) that found the relationship between the spatial
structures and solar radiation distribution and also the spatial structures are supposed to be
an important set of indicators for future energy supply and distribution (Owens, 1986).
In this research, analyzing urban environmental is mainly concerned with the concept
“urban metabolism’ and material flow in terms of construction materials and energy flow
in terms of electricity uses. So it is required to account material intensity by material
types, by structure types as well as change of their intensity over time. Therefore these
two play vital role in analyzing environmental performance for urban areas. To measure
urban environmental performance therefore need to find relation between the urban
morphological characteristics which are subjected to be modified by human interventions
and the energy-material flow to accomplish various anthropogenic activities. In this
research two different set of indicators namely morphological and physiological are
selected for analyzing urban environment of Bukit Panjang.
Page 45
8/6/2019 MEM Dissertation LAP
http://slidepdf.com/reader/full/mem-dissertation-lap 45/95
Proposed Indicators for Env. Analysis of Bkt Panjang 5-2
5.2 Morphological Indicators
The understanding of urban environment using morphological indicators are mainly based
on long time experimental knowledge where some apprehended and easily understandable
rules are used to define the environment. These rules i.e. geographical, geometrical,
economical, topological, social etc. interact with each other again in various complex
ways for various new urban areas and therefore sometimes very difficult to ascertain their
phenomena. In effect an urban environment is the out come of the both effects of
generation of urban shape and change of the shape which in turn determine the quality of
environment. In Netzstadt (Oswald and Baccini, 2003) three factors are mentioned behind
the generation and change of the urban shapes namely resistance, aggregation and
coherence. The resistance may be external and internal factors which affect both systems
of urban shape either by hindering or keeping the prevailing stand. The surrounding
neighborhoods are believed to have significant effect on the urban environment by
segregating or integrating features in urban system.
In this research four set of morphological indicators have been used to understand the
environmental conditions of the urban system:
i. Plot ratio
ii. Degree of subdivision
iii.Granular index
iv. Level of accessibility
The explicit objectives for working with these indicators are to find out the weakness and
strength of a particular shape of urban environment therefore directing way to enhance
new design shape to improve the urban environmental quality. Another substantial aim of
using morphological indicators is to get enough bases to assess the strength and weakness
of the selected urban environment with excellent interpreting abilities and directing to
desired conditions.
Page 46
8/6/2019 MEM Dissertation LAP
http://slidepdf.com/reader/full/mem-dissertation-lap 46/95
Proposed Indicators for Env. Analysis of Bkt Panjang 5-3
i. Plot Ratio:
It can be undoubtedly said that urban landscape are frequently disturbed by the
morphological elements i.e. loss of natural vegetation, land destruction and erosion,
unsuitable and exotic species introduction due to gardening and landscaping, and the
restriction of wildlife movements by infrastructures and subdivision of land parcels. One
of the morphological effects is related to buildings in the urban environment as a spatial
function in the form of density and pattern on one side and the temporal component in
another side in the form of changing of density and pattern over time. Understanding the
effects of buildings density and pattern on urban environment and landscape and its
temporal changes may give implicit view of current environmental performance and
provide sufficient responses for future urban design. Building density can have positively
correlation with the environmental attributes of a specific site because the density exhibits
the concentration of activities, consequent flows of materials and energy.
Plot ratio is the simple measure of building density i.e. the ratio between gross floor areas
(GFA) in respect of surface occupied by sealed structures to the land parcel. Plot ratio is
usually computed as the ratio of the gross total of the areas of all floors of the buildings on
a site to the area of land within the land lot areas. Plot ratio is a very important planning
tool for land development particularly in zoning regulations as well as an analytical tool
for existing situation of any urban scale; sometime it is not only an urban planning tool
and land management issue, but also an indicator of a city’s historical evolution, because
the buildings constructed in different periods have different plot ratio as they are of
various styles and vary greatly in land occupancy. In Singapore plot ratio is used as
predefined number that is used to control the height/form of a particular development.
Each plot of land is assigned a particular plot ratio albeit not always the same. Architects
are not to exceed this plot ratio in their design or development charge may be imposed. In
all cases the plot ratios to be maximized will depend on the spatial context that includes
built form, character and sizes of land parcel and existing or potential public transport
capacity to avoid over development of sites and to prevent congestion. Plot ratio has also
Page 47
8/6/2019 MEM Dissertation LAP
http://slidepdf.com/reader/full/mem-dissertation-lap 47/95
Proposed Indicators for Env. Analysis of Bkt Panjang 5-4
played an important role in the process of preservation and conservation of built form
within the City Centre.
Plot-ratio as well as other urban design criteria has been a generally effective method of
controlling building height and density for new urban development. It is an important
indicator to promote resource efficiency of a parcel of land. It relates the built up area
with the total size of the parcel.
The mathematical formula used for visualizing the building density of Bukit Panjang is as
below
Plot Ratio =
ii. Degree of subdivision
The subdivision of land is an integral part of the development and uses of land are very
often regarded as the first step in the development process along with several
environmental implications. Subdivision and land use are closely related, because
subdivision generally creates new allocation of land for other uses that obviously differ
from the main use from where the new uses are sub-divided. Subdivision also establishes
the pattern and shape of development for a locality as well as impact on a range of
environmental values e.g. ecological amenities, cultural and biophysical values. A single
land parcel can be subdivided for multiple purposes in various ways that may be visible
and invisible sometimes like road infrastructures, building establishments as visible
elements and administrative boundaries of various scales may be as invisible. It is
hypothesized that the higher subdividing thresholds to overcome during passing a land
parcel the less interaction between the subdividing elements therefore high resource
consumption should be observed. Subdivision of land provides for the changing of
∑ (Building Footprint*No of stories)
Area of the particular parcel of land
Page 48
8/6/2019 MEM Dissertation LAP
http://slidepdf.com/reader/full/mem-dissertation-lap 48/95
Proposed Indicators for Env. Analysis of Bkt Panjang 5-5
property boundaries and creation of new allotments. These changes of explicit and
implicit boundaries of a land parcel together with subsequent developments can give rise
to adverse environmental and social effects and resource management issues within the
urban system.
Sometimes land subdivision may not have a direct impact itself but establishes a pattern
and disposition of land that may result in significant costs to the community and degree of
subdivision is required to estimate to know how shredding effect created by subdivision
may appear as unsustainable in the long run, such as:
i) The demands for infrastructures services and resources may appear beyond planning
projections by the urban community in the long term. The need for public facilities arises
from development, but is most appropriately integrated with the subdivision of land.
ii) The ecological habitation can be fragmented by the shredding effect of subdividing the
land in various competing uses.
iii) The visual quality of the urban environment may change through unsuitable intensity
or direction of development.
iv) Absorption ability of the ground for rain water and other effluents may be reduced due
to increase of impervious surfaces in any subdivision by increasing road, parking spaces
and building roof.
vi) New subdivisions certainly need access to nearest higher order transportation network.
As well as divisions of land parcels for providing new road infrastructures may
disintegrate the functional coherence of a land parcel as well as hinder free movement,
communications and mutual interchange of all kind of goods, services and living beings.
vii) Shredding of land by subdividing existing developments in the form of different titles
and consequent developments may need to conciliation the amenity values and the
Page 49
8/6/2019 MEM Dissertation LAP
http://slidepdf.com/reader/full/mem-dissertation-lap 49/95
Proposed Indicators for Env. Analysis of Bkt Panjang 5-6
environmental quality including access, utilization of outdoor space and maintenance, and
can also trade off redevelopment potential.
viii) The surrounding splendid natural landscapes can be adversely affected by the means
of habitat fragmentation and introduction of pests that may lead to the removal of
indigenous species.
ix) Lack of coordination between subdivision and infrastructure will require the explicit
trade off between environmental impacts and necessary provision of infrastructures as
individual and isolated subdivisions are closely integrated with the development process
which generally requires the provision of infrastructure to occur and in this case
sustainability is an issue.
x) The subdivision and development of land also bring confliction between the city’s
natural and cultural features. The subdivision processes may lead to the creation of a
fragmented parcel that is inappropriate for planned development, boundaries or building
platforms therefore sometimes overlook the effective protection of natural ecosystems and
vulnerable environment.
The environmental effects of subdivision are highly dependent upon the extent, scale, and
type of land use changes. Generally other things being equal, that the smaller the average
area of subdivision, the larger the impact of subdivision. To understand the effect of land
subdivision on urban environment a term ‘degree of subdivision’ is used as a
morphological tool which is a reciprocal term of degree of coherence. Degree of
coherence then can be defined in a simple way in this regard that how freely the elements
of one subdivision including living organisms can interact with those of other
subdivisions. The higher degree of subdivision in a site means the elements of thesubdivisions are less coherent as the bondings among the congruent features of
environment become much shredded. Discontinuity or splitting up lands can inevitably
weaken the smooth functioning of ecological and environmental services. Therefore
measuring the degree of subdivision of the land parcels is a very important step to analyze
a particular urban environment.
Page 50
8/6/2019 MEM Dissertation LAP
http://slidepdf.com/reader/full/mem-dissertation-lap 50/95
Proposed Indicators for Env. Analysis of Bkt Panjang 5-7
In calculating the degree of subdivision, another related term ‘degree of coherence’ also
needs to be calculated and in this regard, the formula of ‘degree of coherence’ has been
modified based on the tenet as explained in the ‘Netzstadt’ i.e. the probability of
encounters and prevented contacts within a single land lot’
The Relationship between Degree of coherence, C and Degree of Subdivision, S is
S = 1/C
Degree of Coherence is an index for the statistic probability of individual building (Ai) to
be superimposed if the building footprints (BF) divide land parcel in various segments. C
has been calculated for this study based on ‘Netzstadt’ with minor modification to fit it for
the current study scale as follows:
C= ∑ (Ai /A tot)2, which equals C = 1/ A tot
2∑ Ai
2
Where Ai = BFA (m2) of building i; and A tot = total BFA (m
2) of all buildings within the
same parcel with building i.
BFA= Building Footprint Area of built structures present in a land parcel;
due to ample building structures in the study site, the GFA has been
considered here for the formula.
iii. Granular Index-1
The indicator has been developed and manipulated for urban analysis from the discipline
named ‘Petrography’ or the study of rocks where the relationship between the content of
mineral and textures in a stone is described in detail. Used as metaphor this indicator
represents the relation of the elements i.e. buildings of a land parcel to itself in terms of
quantity and size. In fact granular index is a matrix of grains that are emerged from
various anthropogenic and natural or ecological features in a land parcel or by their
subdivisions. As granular index is the aggregations of the grains come up with the
breaking up a continuous and bigger object, this can be hypothesized that this index is
helpful to understand the corresponding urban environment in terms of its arrangement in
Page 51
8/6/2019 MEM Dissertation LAP
http://slidepdf.com/reader/full/mem-dissertation-lap 51/95
Proposed Indicators for Env. Analysis of Bkt Panjang 5-8
a larger scale environment. This grains are diverse in size and shape and this mingle can
be called as ‘mixing ratio’. Grain size of the urban elements is useful for measuring
permeability i.e. the movement of people, air, light and other basic amenities. Very
common example can be mentioned here as two building with contrasting height on a
same land parcel; the taller one must hinder the lower one on the way of air and light
flow. This situation may appear more complex. The permeability of the environmental
and anthropogenic flow to a large extent depends on the buildings occupied space as well
as their rate of mixing with each other therefore. The higher mixing ratio and grain area
mean less permeability and vice versa (Netzstadt, 2003).
It is very difficult to show the obvious relation between the heterogeneous shape and area
of various elements in a land parcel and the degree of permeability by any mathematical
formula rather it is a qualitative indicator that can be perceived on visual ability from a
satellite or GIS translated map. In this study a granular index mapping has been created
based on the gross floor area.
vi) Level of Accessibility:
Accessibility simply refers to access to nearby public transit, easy mobility along streets
and through buildings, and explicit routes of way out in emergency situations. These are
much expected features of an urban environment for smooth functioning for most of the
physical elements of environment. Level of accessibility defines the relative easiness at
which local amenities and facilities can be reached. Accessibility determines one selected
land parcel’s relation with the overall network system from or to the location. This
indicator is useful to determine the importance of a selected lot in terms of its access to
diverse modalities and transit lines.
One land parcel’s accessibility level determines the relative importance of the parcel in
terms of equity, economic value and no of links connecting across scale. In this study the
level of accessibility of each parcel is determined using its proximity to the nearest road
hierarchy. The road has been given weight according to their hierarchy namely,
Page 52
8/6/2019 MEM Dissertation LAP
http://slidepdf.com/reader/full/mem-dissertation-lap 52/95
Proposed Indicators for Env. Analysis of Bkt Panjang 5-9
1 – Expressway
2 – Arterial Road
3 – Distributor Road
4 – Access Road
A buffer of 50 meter has been used to find land lot within the mentioned distance of
selected hierarchy of land. It can be hypothesized that a piece of land’s accessibility level
is determined from its proximity to higher level network. As the highest level road
network is ‘expressway’ and this is not allowed to have direct access from any settlement
lot; therefore within its proximity any parcel of land is not desirable. Consequently, the
expected closest proximity of road network is arterial road which is supposed to be the
interface for a leap in scale of destination.
5.3 Physiological Indicators
Physiological indicators are used in this research to analyze the environmental
performance of an urban system as to augment the morphological indicators from the
material and energy flow viewpoint. The physiological parameters provide suitable
measures of the magnitude of resource exploitation and waste generation to be used as
indicators for sustainable urban planning and designing. This can be compared that an
urban system is like a human being that needs materials and energy for metabolism and
hence anthropogenic resource management is concerned. And the built environment is an
unavoidable outcome of this physiological process or to say ‘urban metabolism’. Recently
significant numbers of studies, researches, articles and journals have been published on
this highly postulated topic especially this aspect of urban environmental sustainability
has brought multiple stakeholders to be engaged to play corresponding role cautiously. It
is believed the morphological characteristics of cities are one of the factors for pushing up
of urban metabolism (The encyclopedia of earth). Metabolism can be quantified by
tracking the flow of matter and energy within the city illustrating trends in human energy
and material fluxes.
Page 53
8/6/2019 MEM Dissertation LAP
http://slidepdf.com/reader/full/mem-dissertation-lap 53/95
Page 54
8/6/2019 MEM Dissertation LAP
http://slidepdf.com/reader/full/mem-dissertation-lap 54/95
Proposed Indicators for Env. Analysis of Bkt Panjang 5-11
It is difficult to compile a consistent series of these building materials over time since data
on all the end uses are not available. We therefore selected a small number of reservoirs to
use in making the assessment of the current stock. The criteria for selection are,
1. Major materials used in the construction
2. Significant amount of material available for reuse like steel and aggregate.
In this study a statistics of the stock of major construction materials namely still, cement,
coarse aggregate and fine aggregate for various structures have been collected from
Building and Construction Authority (BCA) accounted over a period from 1993-2006.
The stock has been calculated in average kg per square meter. This stock then estimated
for each land parcel as demarcated by Singapore Land Authority (SLA) to visualize the
density of the four major construction materials on the land lot basis.
The estimated average material stocks for various built structures as collected from
Singapore Building and Construction Authority are as follows:
Table 5.1: Material Stock in Bukit Panjang from 1993-2005
A) Residential Buildings B) Commercial/Worship Buildings
Items Average kg/ m2
Items Average kg/ m2
Steel 23 Steel 40
Cement 74 Cement 118
Coarse Aggregate 201 Coarse Aggregate 302
Fine Aggregate 158 Fine Aggregate 230
C) Mixed use/
Institutional Buildings F)Services (industrial)
Items Average kg/ m2
Items Average kg/ m2
Steel 40 Steel 57
Cement 109 Cement 137
Coarse Aggregate 285 Coarse Aggregate 352
Fine Aggregate 219 Fine Aggregate 269Source: BCA, Singapore
Page 55
8/6/2019 MEM Dissertation LAP
http://slidepdf.com/reader/full/mem-dissertation-lap 55/95
Proposed Indicators for Env. Analysis of Bkt Panjang 5-12
This stock (kg/m2) is then converted in to the density by multiplying the Gross Floor Area
(m2) of various built structures with corresponding average material stock value.
Therefore,
Material intensity = Material Stock (kg/m2) * GFA (m
2), which is calculated on the parcel
basis.
ii) Electricity Use Intensity
Electricity is the major energy flow in urban system dominantly driven by anthropogenic
activities and intensity of its use is increasing with the rate of increasing urbanization. But
it is evident that urban energy consumption is higher in developed countries than the
developing countries. High energy consumption has vital implications in urban
environment as it is itself produced from depleting natural resources like natural gas,
water, air as well as produce additional polluting gas like CO2, waste energy like heat
during the production process of electricity as well as its use in cooling and heating the
built structures. Previous study (Perry, 2007) found that Singapore is a compact city and
studies also show that compact cities consume high electricity.
There are various indicators to track electricity consumption in urban uses like per capita
electricity consumption, household electricity consumption, GDP per electricity
consumption etc so. Each indicator has its own limitations to represent exact scenario. For
this research, a different indicator namely ‘Electricity Use Intensity’ is tried to find out
where electricity consumption by per unit area of a household has been accounted. There
is both the building gross floor area for various built structures of Bukit Panjang as well
secondary data on electricity consumption by various housing typologies has been
collected from Singapore. As most of the built structures in Singapore including Bukit
Panjang are combined or row, so individual household area has been calculated based on
GIS data, Google image, field survey and online Singapore properties information. Again
synchronization has to be made between the housing typologies defined separately by
SLA and SP.
Page 56
8/6/2019 MEM Dissertation LAP
http://slidepdf.com/reader/full/mem-dissertation-lap 56/95
Page 57
8/6/2019 MEM Dissertation LAP
http://slidepdf.com/reader/full/mem-dissertation-lap 57/95
Proposed Indicators for Env. Analysis of Bkt Panjang 5-14
K Block (can be residential or commercial)
S Standard
U Walkup
A Apartment
E Executive Condominium
R ResidentialUM Walkup (Main address)
US Walkup (Sub address)Source: Singapore Land Authority (SLA)
With the help of SLA official the ambiguity of the descriptions again removed by the
following clarifications:
HDB = Public Housing/flats developed by Housing Development Board
Residential = Private residential (eg. landed properties)
Standard = Standard buildings built by BCA (usually Public/ Commercial
buildings)
Executive Condo = Condo housing developed by HDB
Condominiums = Private Development
Walkup = Usually old HDB without elevators (eg. 4 storey flats)
Apartment = service apartments
UM = Part of U (with main address)
US = Part of U (with sub-address)
To include the electricity intensity data in GIS database the author needed to bring the
terms for building typologies used in table 5.2 and 5.3 with the SLA defined building
typologies, so few adjustments and assumptions are needed especially five types of HDB
buildings had to bring under one typology namely ‘H’ or ‘HDB’ as for getting final output
and regression analysis. From the field survey it was assured that the HDB (3+ rooms) is
predominant therefore the average electricity consumption is made based on that of HDB
3-rooms, 4-rooms and 5-rooms by calculating weighted average. Same statistical method
has been followed for other buildings which have no unique features i.e. building size.
Formulation of this indicator is mainly focused on residential buildings as the commercial
and industrial building are not unique in character so determination of electricity
Page 58
8/6/2019 MEM Dissertation LAP
http://slidepdf.com/reader/full/mem-dissertation-lap 58/95
Proposed Indicators for Env. Analysis of Bkt Panjang 5-15
consumption per unit area of buildings may raise the question of validity. As this is a very
time constraint research, an approximation was highly required to exhibit kind of
relationship with other indicators.
Thus, based on above estimation and cross-estimation the following table has been
generated:
Table 5.5: Calculated Electricity Use Intensity for Built Structures in Bukit Panjang
Code Electricity Use Intensity (kWh/ m2)
C 8.76
I Unknown
H 3.53
K ~ H
S Unknown
U ~ H
A ~ C
E 3.49
R 9.22
UM ~ H
US ~ H
Page 59
8/6/2019 MEM Dissertation LAP
http://slidepdf.com/reader/full/mem-dissertation-lap 59/95
Morphological and Physiological Analysis for Measuring Urban Environmental Performance: A Case
Study of Bukit Panjang
Analysis and Findings 6-1
Chapter 6
Analysis of the Indicators and Findings
This is the vital chapter of the research where the various spatial and non-spatial data is
analyzed for finding out the environmental performance of Bukit Panjang Area. Before
starting the analysis of main indicators, some initial analysis of the study site
characteristics are shown below.
The total land area of the study area and corresponding built structures are as estimated
from the GIS based SLA data as follows
Figure 6.1: Share of Built and Non-built area
14%
39%
47% Building footprint
Road
Non-built areas
Table 6.1: Existing Characteristics of the Building typologies in Bukit Panjang
Building Types
No. of
Building
Average Building
Footprint (Sq.m)
Maximum
Floor
Average
Floor
Condominium 30 946.4315 30 18
Commercial centre 1 5754.3845 4 4
Executive 7 689.9606 30 27
HDB 323 1134.5193 30 17
Industrial 2 1922.0253 4 4
Block
(residential/commercial) 9 1223.9259 30 24
Landed Property 779 154.0503 30 3
Standard 222 569.6031 30 4
Walk Up 14 138.3957 3 3
Page 60
8/6/2019 MEM Dissertation LAP
http://slidepdf.com/reader/full/mem-dissertation-lap 60/95
Morphological and Physiological Analysis for Measuring Urban Environmental Performance: A Case
Study of Bukit Panjang
Analysis and Findings 6-2
Calculated from the GIS data of SLA, the above table clearly shows that Bukit Panajng is
mainly a residential area as designated in the Singapore Master Plan 2003 with highly
dense development (Map 6.1). It is also evident that the Master Plan of Singapore city has
put emphasize on the vertical expansion rather than horizontal expansion. At the same
time sufficient provision for accessibility and open space has been provided to cater the
population living on these skyscrapers. These observations are supported by the building
density mappings based on the plot ratio which have been collected from URA which is
described the next section..
The following table is showing the status of built structures in Bukit Panjang planning
area.
Table 6.2: Status of the Built Environment Data in Bukit Panjang
Building Status Count
Estimated 15
Existing 1284
Proposed 57
Under Construction 31
Out of 57 proposed buildings major are landed properties (R) which are in total 35,followed by Standard buildings built by BCA which are 15 and Condominiums are 7; in
case of under 31 construction buildings 29 are landed properties or terrace houses and
other twos are school buildings under Standard Building category (Map 6.2).
Government’s future plan seems concentrated on the disperse settlement as manifested
from the dominance of landed property like terrace and low height settlement in the
proposed building outlines of the SLA data.
The main reason for highlighting the proposed and under construction buildings is to find
out their impact on the urban physiological process based on the physiological indicators.
Page 61
8/6/2019 MEM Dissertation LAP
http://slidepdf.com/reader/full/mem-dissertation-lap 61/95
Morphological and Physiological Analysis for Measuring Urban Environmental Performance: A Case
Study of Bukit Panjang
Analysis and Findings 6-3
Page 62
8/6/2019 MEM Dissertation LAP
http://slidepdf.com/reader/full/mem-dissertation-lap 62/95
Morphological and Physiological Analysis for Measuring Urban Environmental Performance: A Case
Study of Bukit Panjang
Analysis and Findings 6-4
Page 63
8/6/2019 MEM Dissertation LAP
http://slidepdf.com/reader/full/mem-dissertation-lap 63/95
Morphological and Physiological Analysis for Measuring Urban Environmental Performance: A Case
Study of Bukit Panjang
Analysis and Findings 6-5
6.1 Morphological Analysis
i. Building Density
The contour mapping based on the plot ratio (Map 6.3) is representing the topographical
scenario of Bukit Panjang where the various colored lines are drawn along buildings of
same plot ratio. Building density mapping of Bukit Panjang based on the plot ratio (Map
6.4) does not show consistently high dense built up area rather the plot ratio values are not
more than 3.5 and not less than 0.35. The darker color shows the maximum plot ratio, as
the contour lines tending to be lighter indicates low maximum density and tending to be
white indicates plots with no building. No significant fluctuation or variation of building
density is observed in the actual condition than the master plan 2003 developed by Urban
Redevelopment Authority for this area. Thus, a good tendency can be observed inimplementing planning principles of the Singapore master plan 2003.
The plots having higher plot ratio (>2.48) are mainly HDB building followed by landed
property and standard buildings. Again the highest plot ratio contained lots are mostly
occupied by condominiums and executive apartments. In condominium a series of
luxurious facilities e.g. swimming pool, tennis court etc services are provided for the
economically well off residents which mutually benefit all the residents of the
corresponding condominiums. This can be regarded as a sustainable approach in response
to land crisis of Singapore. The contour lines with lower plot ratios (< 1) represent 54% of
the total study area. The extreme low plot ratios indicate the presence of low building
volume means the morphology of built areas is consuming less resource. Again the
density map notice that the most of the low dense or no developed plots are ring shaped;
surrounded by plots with medium to high plot ratio therefore the ring shaped plot can be
used as community gathering or activity generating place.
As the plot ratio of various values are in a continuous shape along the periphery of the
study area, it can be envisaged that significant amount of primary ecological features has
been sacrificed. However, the make up attempts have been taken later to compensate the
natural vegetation undergone for development.
Page 64
8/6/2019 MEM Dissertation LAP
http://slidepdf.com/reader/full/mem-dissertation-lap 64/95
Morphological and Physiological Analysis for Measuring Urban Environmental Performance: A Case
Study of Bukit Panjang
Analysis and Findings 6-6
Page 65
8/6/2019 MEM Dissertation LAP
http://slidepdf.com/reader/full/mem-dissertation-lap 65/95
Morphological and Physiological Analysis for Measuring Urban Environmental Performance: A Case
Study of Bukit Panjang
Analysis and Findings 6-7
Page 66
8/6/2019 MEM Dissertation LAP
http://slidepdf.com/reader/full/mem-dissertation-lap 66/95
Morphological and Physiological Analysis for Measuring Urban Environmental Performance: A Case
Study of Bukit Panjang
Analysis and Findings 6-8
ii. Degree of Sub-division
Map 6.5 is showing the map of the degree of subdivisions due to various built features
e.g. building outlines, road network, and land allotments. Map 6.6 is showing the map of
degree of subdivision where the dark shade is showing the corresponding plots and
surrounding plots are more subdivided. That means the more intense the color, more
subdivided and as discussed in the previous chapter that subdivision is the inverse value
of the degree of coherence, therefore more the intense colored plots are less coherent; the
built structures of the plots are less related to each other.
The significant subdivision is done by the street networks at the community level but high
to medium degree of subdivision also have been observed due to property boundaries.
However, it’s remarkable that relatively high degree of subdivisions is few in the study
area. An intensity of subdivisions is apparent in the portion of the map where mainly
landed properties i.e. terrace housings are present. This phenomenon is caused because of
the individualities of the terrace houses. The nil degree of subdivisions is observed in the
south east portion of the study area where because that portion of land parcels have no
built parcels, however some shredding is observed for the parcel boundary.
The study area is confined by two expressways namely Kranji expressway from north side
and Bukit Timah express way from east side, major arterial roads as woodland road and
upper Bukit Timah road in western side and by Dairy Farm road in the southern side.
Though a high degree of subdivision is marked in the northern side at the edge of Kranji
expressway, due to the presence of regional highway further subdivision may not be
possible towards north. However, a degree of subdivision is stands out along the edge of
western edges which is also accessible by arterial road showing development trend across
the road. Relatively less subdivision is observed along the Bukit Timah expressway. It
means there is no intensity of development is towards Bukit Timah expressway as on the
other side there is reservoir, which is a nature reserve of Singapore.
Page 67
8/6/2019 MEM Dissertation LAP
http://slidepdf.com/reader/full/mem-dissertation-lap 67/95
Morphological and Physiological Analysis for Measuring Urban Environmental Performance: A Case
Study of Bukit Panjang
Analysis and Findings 6-9
Page 68
8/6/2019 MEM Dissertation LAP
http://slidepdf.com/reader/full/mem-dissertation-lap 68/95
Morphological and Physiological Analysis for Measuring Urban Environmental Performance: A Case
Study of Bukit Panjang
Analysis and Findings 6-10
Page 69
8/6/2019 MEM Dissertation LAP
http://slidepdf.com/reader/full/mem-dissertation-lap 69/95
Morphological and Physiological Analysis for Measuring Urban Environmental Performance: A Case
Study of Bukit Panjang
Analysis and Findings 6-11
iii) Granular Index
Granular index based on the Gross Floor Area (GFA) (which considers both height and
footprint area) has been shown in the map 6.7, indicates very heterogeneous granulation
interspersed with capacious grain sizes. Already mentioned in previous sections that Bukit
Panjang is mainly a residential area, and most of the buildings have been designed to
accommodate ever increasing population of Singapore without consuming lateral land
surfaces as well as having a uncompromising policies to let develop any squatter and slum
settlements. Therefore, the tall buildings are ideally predominant across the study area.
But the people are living in these residential buildings must need some social services like
schooling, commercial activities, medical services etc which have been provided mixing
with some residential units which have been categorized as ‘standard buildings’; this
buildings are not so tall as some HDB residential building situated at the North-western
side of the study area. Thus a complex mixture of grain sizes has been observed in some
part of Bukit Panjang especially around the Bukit Panjang ring road.
A homogeneous structure of grain sizes can be seen where the terrace houses are located.
As these are the landed properties, no scope for Governments intervention in future for
high density development. In terms of environmental permeability, the terrace housingparts are in suitable position as no larger grains are around those so there is easy
movement of air, sun and sound through the spaces. Of course the largest sizes of grains
are very few as in the granular index map, only 3 grains are found to have largest value
two of which have a visible buffer from the surrounding grains so they might not appear
as blocking the environmental flow to surrounding grains.
Page 70
8/6/2019 MEM Dissertation LAP
http://slidepdf.com/reader/full/mem-dissertation-lap 70/95
Morphological and Physiological Analysis for Measuring Urban Environmental Performance: A Case
Study of Bukit Panjang
Analysis and Findings 6-12
Page 71
8/6/2019 MEM Dissertation LAP
http://slidepdf.com/reader/full/mem-dissertation-lap 71/95
Morphological and Physiological Analysis for Measuring Urban Environmental Performance: A Case
Study of Bukit Panjang
Analysis and Findings 6-13
iv) Accessibility Index
Accessibility has been measured here based on the land parcels’ proximity to nearest road
network where a hierarchy of road network is made based on their functions namely
expressway, arterial road , distributor road and access road. These roads are again
weighted respectively as 1, 2, 3 and 4 therefore higher order road network is having lower
weight. Finally a 50 meter buffer is used to estimate level of accessibility of the land
parcels and the built elements within them. The concept behind 50 meter buffer is taken
from transport engineers that a person can comfortable walk up to 50 meters.
Map 6.8 shows the topographical findings of the level of accessibility in the Bukit
Panjang. The lighter areas represent accessible to highest order (lowest weighted)
network, the darker areas have access to the lower to lowest order road of the hierarchy.
Similar results have been represented in the Map 6.9 where the accessibility level has
been shown on parcel basis. Some plots have no accessibility in the southern parts of the
map which are mainly vegetated areas. As the closest residential areas are mainly terrace
houses, the inaccessibility of the vegetated sites will retard the potential developers to
develop those ecologically important lands.
When land market is considered, those plots have higher values which have easy access to
the higher order transport network for traveling without delay and with minimum
distance. In that case the land parcels having close proximity to expressway but
expressways do not have interfaces with the local access; they are only accessible through
arterial road. Thus the land parcels are showing easy accessible to the expressway in a bad
position in a sense that they have to depend on either distributor road or local access road
for accessibility and in fact most of the settlements have been formed in the land parcels
which are in proximity of either distributor road or local access road. So, it can be said
that higher level accessibility has a prohibiting effect on the settlement development.
Page 72
8/6/2019 MEM Dissertation LAP
http://slidepdf.com/reader/full/mem-dissertation-lap 72/95
Morphological and Physiological Analysis for Measuring Urban Environmental Performance: A Case
Study of Bukit Panjang
Analysis and Findings 6-14
Page 73
8/6/2019 MEM Dissertation LAP
http://slidepdf.com/reader/full/mem-dissertation-lap 73/95
Morphological and Physiological Analysis for Measuring Urban Environmental Performance: A Case
Study of Bukit Panjang
Analysis and Findings 6-15
Page 74
8/6/2019 MEM Dissertation LAP
http://slidepdf.com/reader/full/mem-dissertation-lap 74/95
Morphological and Physiological Analysis for Measuring Urban Environmental Performance: A Case
Study of Bukit Panjang
Analysis and Findings 6-16
6.2 Physiological Indicator
i. Material intensity
In this research the main reason for accounting Material intensity is to analyze the stock of
major construction materials for various buildings as a part of urban physiological
process. Here four construction materials namely still, cement, coarse aggregate and fine
aggregate are used to visualize the concentration of their uses on the plot basis. Another
main intention for this analysis is to find out the material efficiency for various building
blocks.
The maps 6.10 to 6.13 indicate the density of four construction materials in the Bukit
Panjang. Ideally all the four materials’ intensity show similar trend in terms of their share
in construction for various types of building. Thus it is clear that materials stocks may
vary from building typologies but the share of construction materials remain same. There
is a direct and positive relationship between the GFA and material stocks in buildings,
therefore material intensity is higher in those parcel of lands where more than 20 storied
condominiums and other buildings are situated. And low materials are concentrated in the
region where average three storied terrace housings are located. The material stocks arestill growing as there are lot of estimated and proposed buildings but as discussed early of
this chapter that majority of proposed buildings are terrace building which has the highest
material efficiency (kg/m2) according to a study done by Perry (2007) on the material
stocks for various building typologies, the likely material flow can be possible to keep
limited. These maps are simple representations of the four types of materials’ stock in the
Bukit Panajng without accounting their life cycle assessment, inclusion of which must
give truer picture of the effect of material flow in urban environment. But it can be
assumed that after demolition of a buildings, the still can be reused out of the four
materials, but cement should remain as a binding material with the two types of aggregate
which are most of the times are dumped as wastes and this wastes have again adverse
impact on the environment.
Page 75
8/6/2019 MEM Dissertation LAP
http://slidepdf.com/reader/full/mem-dissertation-lap 75/95
Morphological and Physiological Analysis for Measuring Urban Environmental Performance: A Case
Study of Bukit Panjang
Analysis and Findings 6-17
Page 76
8/6/2019 MEM Dissertation LAP
http://slidepdf.com/reader/full/mem-dissertation-lap 76/95
Morphological and Physiological Analysis for Measuring Urban Environmental Performance: A Case
Study of Bukit Panjang
Analysis and Findings 6-18
Page 77
8/6/2019 MEM Dissertation LAP
http://slidepdf.com/reader/full/mem-dissertation-lap 77/95
Morphological and Physiological Analysis for Measuring Urban Environmental Performance: A Case
Study of Bukit Panjang
Analysis and Findings 6-19
Page 78
8/6/2019 MEM Dissertation LAP
http://slidepdf.com/reader/full/mem-dissertation-lap 78/95
Morphological and Physiological Analysis for Measuring Urban Environmental Performance: A Case
Study of Bukit Panjang
Analysis and Findings 6-20
Page 79
8/6/2019 MEM Dissertation LAP
http://slidepdf.com/reader/full/mem-dissertation-lap 79/95
Morphological and Physiological Analysis for Measuring Urban Environmental Performance: A Case
Study of Bukit Panjang
Analysis and Findings 6-21
ii. Electricity Use Intensity
The very simple indicator to account the energy flow into the urban environment based on
the relationship between building area and electricity consumption is named as Electricity
Use Intensity also indicate same trend as like the Material intensity (Map 6.14). Thus it
can be hypothesized that the physiological indicators used in this study are positively
correlated with each other. The main use of electricity in the high rise buildings are air
condition. Due to the stable weather condition in Singapore, electricity doesn’t need
notably for heating purposes in the buildings. An explicit positive mutual relationship
among the socio-economic conditions, population density and electricity consumption
could be found. In case of both factors per capita income and population density are high
for Singapore; so literally it can be assumed that electricity is highly consumed in
Singapore.
Electricity is the only static source for producing heat in urban environment for the
building cooling process. Therefore high electricity consumption by the residential
buildings in the Bukit Panjang inevitably affect the micro-climate and induces along with
other dense settlements the effect of urban heat island for whole the island wide state.
6.3 Correlation and Multiple Linear Regression Analysis
Apart from the individual analysis of the two sets of indicators another important part of
this research is to find the mutual effects of the two different set of indicators that affect
urban environment. Keeping this in mind, Pearson correlation coefficients have been
measured using commercial statistical software STATA. Granular index represents at the
calculation level based on land parcels exhibits same result as plot ratio therefore
excluded while measuring correlation to avoid data redundancy.
The coefficients of Pearson correlation for the two sets of indicators are given at table 6.3
where PR, SUB, ACS, STLL, CMT, C_AGT, F_AGT and EUI denote respectively plot
Page 80
8/6/2019 MEM Dissertation LAP
http://slidepdf.com/reader/full/mem-dissertation-lap 80/95
Morphological and Physiological Analysis for Measuring Urban Environmental Performance: A Case
Study of Bukit Panjang
Analysis and Findings 6-22
Page 81
8/6/2019 MEM Dissertation LAP
http://slidepdf.com/reader/full/mem-dissertation-lap 81/95
Morphological and Physiological Analysis for Measuring Urban Environmental Performance: A Case
Study of Bukit Panjang
Analysis and Findings 6-23
Ratios, degree of subdivision, level of accessibility, still, cement coarse aggregate, fine
aggregate and electricity use intensity.
Table 6.3: Pearson Correlation Coefficients for two sets of Indicators
PR SUB ACS STLL CMT C_AGT F_AGT EUI
PR 1
SUB -0.6846 1
ACS -0.1551 0.1406 1
STLL 0.3349 -0.2315 -0.0824 1
CMT 0.3542 -0.2425 -0.0798 0.9966 1
C_AGT 0.3581 -0.2447 -0.0791 0.9950 0.9998 1
F_AGT 0.3604 -0.2460 -0.0788 0.9938 0.9996 0.9999 1
EUI 0.2814 -0.2171 -0.0799 0.9360 0.9238 0.9202 0.9180 1
This table represents relationships between the indicators whether they are positively or
negatively correlated but these do not necessarily indicate the any statistical significance
of the coefficients, for which a Multiple Linear Regression Model is run with the two sets
of indicators proceeded by the objective to measure the dependency of the physiological
indicators on the morphological indicators. This objective is stemmed from thehypotheses that Bukit Panjang already has got its territorial shape so nothing to plan about
the arrangement of the land parcels rather how to make efficient the physiological process
taking place on the territory.
The multiple linear regressions equation therefore formulated as follows:
ii ACSbSUBbPRbaY ε ++++= *** 321
Where,
Yi = Dependent variables (physiological indicators)
a = Regression Constant
b1 , b2 , b3 = Co-efficients of explanatory variables
iε = Regression errors
Page 82
8/6/2019 MEM Dissertation LAP
http://slidepdf.com/reader/full/mem-dissertation-lap 82/95
Morphological and Physiological Analysis for Measuring Urban Environmental Performance: A Case
Study of Bukit Panjang
Analysis and Findings 6-24
Based on this equation, a Multiple Linear Regression Model has been run in STATA for
each dataset of physiological indicators and morphological indicators. The estimated
results are tested for statistical significance at 95% confidence level, which means that if
the estimated mean of the coefficients are within 95% confidence interval of a t
distribution, then the corresponding P-values are lower than 5%. The P-value is the
probability of seeing a result as extreme as can be found in a collection of random data in
which the variable had no effect. A P-value of 5% or less is the generally accepted, where
decision can be made to accept/reject the null hypothesis that a coefficient is zero. If the
P-value of a coefficient is lower than 0.05, the null hypothesis can be rejected, and can be
concluded that the coefficient has reasonable effect on the dependent variable.
Constant values are excluded from the regression equation which can be explained this in
this way that, when the values of all the variables will be zero, the value of Y would be
equal to the constant which is not expected; therefore, running the models with the
constant term can be erroneous. As calculated in STATA, the multiple linear equations
have become as follows:
(i) STLL = 694468.5*PR – 216474.5*SUB – 154887.8*ACS
Where the P-values for PR, SUB and ACS are respectively 0.000, 0.403 and 0.168
(significant values therefore respectively 1, 0.597 and 0.832) with R2
value and Adjusted
R2
are 0.1888 and 0.1822.
(ii) CMT = 2192165*PR – 757032.8*SUB – 474797.9*ACS
Where the P-values for PR, SUB and ACS are respectively 0.000, 0.332 and 0.161
(corresponding significant level are 1, 0.668 and 0.839) with R2 value and Adjusted R2 are
0.2033 and 0.1968
(iii) C_AGT = 5930590*PR – 2089239*SUB – 1277210*ACS
Page 83
8/6/2019 MEM Dissertation LAP
http://slidepdf.com/reader/full/mem-dissertation-lap 83/95
Morphological and Physiological Analysis for Measuring Urban Environmental Performance: A Case
Study of Bukit Panjang
Analysis and Findings 6-25
Where the P-values for PR, SUB and ACS are respectively 0.000, 0.317 and 0.159
(significant level therefore 1, 0.683 and 0.841) with R2
value and Adjusted R2
are 0.2062
and 0.1998
F_AGT = 4651046*PR – 1657359*SUB – 998256.7*ACS
The P-values for PR, SUB and ACS are respectively 0.000, 0.309 and 0.159 (the
significant level are then 1, 0.691 and 0.841) for the regression equation with R2 value and
Adjusted R2 are respectively 0.2079 and 0.2014
The last regression equation is correlating electricity use intensity with the selected
morphological indicators which found as follows,
EUI = 114.99*PR – 53.71*SUB – 22.22*ACS
With the P-values for the independent variables are 0.000, 0.305 and 0.328
(corresponding significant level are 1, 0.695 and 0.673) and containing R2
value and
Adjusted R2
are respectively 0.1343 and 0.1273
6.4 Discussion
Every regression equation assume physiological indicators as dependent variable found
and noted above shows that physiological indicators have a positive relationship with Plot
Ratio (PR) and negative relationship with the other two morphological indicators, namely
Degree of Subdivision (SUB) and Level of Accessibility (ACS). The P-values of SUB and
ACS are found to be higher that 5% whereas these should be 0.05 or lower for accepting
their influence on physiological indicators.
Again while considered Adjusted R2 value which exhibit the predictability of the model
should be close to 1 for making decision based on the analysis result but in all the four
Page 84
8/6/2019 MEM Dissertation LAP
http://slidepdf.com/reader/full/mem-dissertation-lap 84/95
Morphological and Physiological Analysis for Measuring Urban Environmental Performance: A Case
Study of Bukit Panjang
Analysis and Findings 6-26
equations the Adjusted R2
value is very low so the predictability is stumpy. So, the model
will not be effective for any decision making based on the result.
There may be several reasons for very low predictability of the model. These may include
simple issues like the selection of the indicators for measuring correlation is not well
justified, or may have multiple effects of same set of indicators on the other set of
indicators. After all the two set of indicators may not linear with each other. Another
practical reason for failure of the predicting a rational relationship between the two sets
indicators can be quoted here that all the physical indicators calculated here based on the
buildings properties resulting significant relationship only with plot ratio that contains the
building information only from the morphological set of indicators. Other two indicators
obviously represent the characteristics of land parcels but not linked with the buildings
material stock or electricity consumption therefore does not show any significant
relationship with the physiological indicators.
So, planning decision for Bukit Panjang for improving environmental performance based
on this research should focus on the individual analysis of the indicators merely on the
correlation analysis. In the future endeavors if more diverse physiological indicators like
household fuel consumption, material stock for road networks etc would be integrated themodel may show good predictability.
Page 85
8/6/2019 MEM Dissertation LAP
http://slidepdf.com/reader/full/mem-dissertation-lap 85/95
Morphological and Physiological Analysis for Measuring Urban Environmental Performance: A Case
Study of Bukit Panjang
Recommending Proposals 7-1
Chapter 7
Recommending Proposal
From the previous chapter the findings can be summarized as follows:
i. The total built up areas is very low for Bukit Panjang with a significant
percentage is totally dedicated for road network. For smooth functioning, an
urban area should have 40% road network of the total area where Bukit Panajng
has 39% which is a very strong indication of good urban planning. The total area
dedicated for buildings is only 14% of the total study area which implies that the
area is developed compactly and less convoluted.
ii. The plot ratio or building density mapping of Bukit Panjang indicates the
overall scenario of Singapore as part of the master plan 2003 (which
designates Bukit Pangang as mainly residential and nature reserve) which
explicitly represents the Government’s wholehearted effort to make
Singapore a garden city by preserving land horizontally for green and intensifying
development vertically. However, the plot ratios again can not be said so high
compared to other dense and compact cities like New York Manhattan because of
relatively small population size of Singapore.
iii. The degree of subdivision is also not so high because of compact settlements;
only subdivisions are higher where the individual landed properties are
concentrated. One of the main subdividing elements is the road hierarchies;
however, the road networks have not subdivided the land parcels in Bukit Panajng
because most of the HDB housing estates have only access way to get out from
the boundary which is absent in case of individual housings.
iv. In case of the granular index based on the GFA, the study area is composed of
heterogeneous grain sizes therefore it can be assumed that the low storied
Page 86
8/6/2019 MEM Dissertation LAP
http://slidepdf.com/reader/full/mem-dissertation-lap 86/95
Morphological and Physiological Analysis for Measuring Urban Environmental Performance: A Case
Study of Bukit Panjang
Recommending Proposals 7-2
buildings behind the tall buildings may face less exposure to sunlight, air
circulation and sound transmission, but in this case the high density development
also has made it possible to have less effect due to varied grain sizes.
v. Most of the terrace houses are far from the top hierarchy road network, it can be
hypothesized that people who live in terraced houses want to live with some kind
of tranquility which can be ensured partly by living far from the roads to avoid
noise. Therefore, there may a car dependency be observed. But from sustainable
township viewpoint car dependency should be reduced so concentrations of
terraced houses are not advisable.
vi. The physiological indicators all are related to the buildings’ consumptions and
stocks that are positively correlated with the buildings height and area, therefore
less significant with the other non-building morphological indicators. Two
physiological indicators show different efficiency rates for same building
typologies. Where the terrace houses show materially efficient, they appear
inefficient for electricity consumption. This is a very crucial planning issue to
trade off as still there are still some proposed building lots catered for future
terraced housings. It is also found that terraced houses cause higher degree of subdivision as well as higher intensity of electricity use.
vii. The material flow has been only considered in terms of their density or stocks
in various buildings but the materials must have an end use which is not
included in the analysis due to unavailability of end use data.
The above proposals have included the obvious features of built urban environment that
deal with the critical tasks for the urban planner and policy makers to address in planning
or policy making. The most important part of dealing with the built urban environment is
to take corrective measures so that the built morphological characteristics can have less
impact on the environment. Therefore some proposals can be drawn towards the
Page 87
8/6/2019 MEM Dissertation LAP
http://slidepdf.com/reader/full/mem-dissertation-lap 87/95
Morphological and Physiological Analysis for Measuring Urban Environmental Performance: A Case
Study of Bukit Panjang
Recommending Proposals 7-3
sustainability of the environment of Bukit Panjang based on the findings which are
discussed below.
The plot ratio for Bukit Panjang is already planned by the Urban Redevelopment
Authority therefore planning decision should focus on the building functions as to reduce
their impact on the environment by energy modeling and rational calculation of building
materials. As the building density positively correlated with material intensity and
electricity consumption and as electricity consumption is the only static source of urban
heat island, building technologies should adopt to reduce dependency on air cooling
appliances at the building architecture level. On the other hand, selecting materials for
building should consider the efficiency at the end-use level as each building has its life
time and after that time the building may need reconstruction. This process must require
putting material stock on the same land unit. In addition, wastes can be produced within
the lifecycle of buildings, during the construction, modification and demolition phases
which become serious environmental problems in many countries.
The primary environmental target regarding these two physiological consumptions of
buildings should be the prevention and reduction of construction waste generation and
reducing electricity consumption. One of the optimum solutions to reduce the materialintensity in Bukit Panjang can be the recover and re-use of the demolished materials in
reconstruction process in future. Policies to reduce the electricity use intensity should be
accompanied by the adoption of technologies to reduce the impact of high electricity and
fuel consumption. Though the effects and diversities of vehicular fuel consumption have
not been covered in this study; a detailed investigation for the environmental effects of
vehicular fuel consumption in Bukit Panjang should be carried out.
Land allocations for individual terrace housing result more subdivisions of the
corresponding land accompanied by more land requirements for their accessibility. The
scarce land for Singapore therefore is not suitable for allocating to development of landed
properties like terrace houses. The accessibility required for the terrace houses also
subject to supply of more construction materials like gravel, asphalt may result inducing
Page 88
8/6/2019 MEM Dissertation LAP
http://slidepdf.com/reader/full/mem-dissertation-lap 88/95
Morphological and Physiological Analysis for Measuring Urban Environmental Performance: A Case
Study of Bukit Panjang
Recommending Proposals 7-4
low albedo5
which again exaggerate the ‘urban heat island’. On the electricity
consumption site the indicator used here electricity consumption per unit area shows the
higher value for the terrace houses. Thus, in terms of electricity supply terrace housing is
not advisable as Singapore has to spend a high premium to produce electricity from
natural gas which is comparatively environment friendly electricity source in Singapore.
The government of Singapore is already largely engaged with tree plantation and
increasing green coverage over the Singapore which can be multiplied by increasing
green plot ratio (Lay, 2003) in the highly dense residential areas. This can be enhanced by
promoting greening the roof top as well as vertical gardening, façade and balcony
planting. The urban park planning can be the most effective approach for not only
absorbing the CO2 but also by providing shade so that less solar radiation can reach the
building surfaces which causes further worsening the heat situation of urban environment.
National Parks Board of Singapore is charged to promote and enhance green coverage by
implementing opens space and park connecting plan for Singapore. Singapore
government’s long time efforts to build Singapore have attenuated the environmental
impact of anthropogenic energy consumptions to a remarkable limit.
Government can think economic incentives for materially efficient buildings to promotematerially efficient buildings but the problem of inflation in status quo may hinder the
positive effects of economic incentives for resource efficient buildings. The purposes of
buildings again should be considered if government really thinks about the economic
incentives for the improved building technology. This is because a building might have
living or financial investment option in which case the latter one will not be purposeful.
Finally, for sustainability of an urban environment, an integrated effort by the authorities
e.g. URA, SLA, BCA and Singapore power authority is needed to generate a
multipurpose valid and quality database for evaluating the environmental performance of
various urban infrastructures ranging from the morphological properties to physiological
5 Albedo refers to the ability of a surface to reflect solar radiation but it differs from the reflectivity as it
accounts all kind of incoming radiation to the surface. The asphalt has low albedo value range 0.05-0.20
where grass has high albedo value of 0.25-0.35. (Dhakal, Shobhakar)
Page 89
8/6/2019 MEM Dissertation LAP
http://slidepdf.com/reader/full/mem-dissertation-lap 89/95
Morphological and Physiological Analysis for Measuring Urban Environmental Performance: A Case
Study of Bukit Panjang
Recommending Proposals 7-5
attributes. And more research regarding the material and energy flows in urban
environment should be carried out to find out the efficient metabolism process. Recently,
a research wing is established at the School of Design and Environment of National
University of Singapore named as ‘Center for Sustainable Asian Cities’, where some
researches on the industrial ecology is going on. Industrial ecology is the field of science
that deals with the material and energy flow through an urban and industrial system. As
the name suggests, the principles of this studies are the natural ecological rules, i.e.
closing the energy and material loop.
Page 90
8/6/2019 MEM Dissertation LAP
http://slidepdf.com/reader/full/mem-dissertation-lap 90/95
Morphological and Physiological Analysis for Measuring Urban Environmental Performance: A Case
Study of Bukit Panjang
Conclusion 8-1
Chapter 8
Conclusion
Urbanization takes place in terms of spatial, temporal and demographic change associated
with modification and generation of spatial form, the changes in physical consumptions
which ultimately determine the performance of the environment. To find the relationship
between the urban form and its physiological process has been the main focus of this
research to ascertain the environmental analysis for the selected study area, Bukit
Panajng, a new town of Singapore planned for residential and nature reserve. Two sets of
indicators namely morphological and physiological have been used to see their correlationby multiple regression analysis. Morphologically Bukit Panajng has been analyzed by the
plot ratio of land parcels, degree of subdivision of the same parcels, buildings grain sizes
based on its gross floor area and the parcels’ level of accessibility. To measure the effects
of these morphological characteristics on the physiological process the material intensity
as construction materials’ stock in the buildings of Bukit Panjang and electricity use
intensity as electricity consumption per unit area of buildings have been used as
physiological indicator.
The physiological indicators used here have not shown so remarkable correlation with the
morphological indicators except plot ratio therefore planning decision based with the
multiple objectives should not be practiced in this case; rather planning focus should be
based on the individual indicators’ responses to the built environment. Morphologicall,
Bukit Panjang has indicated the Singapore’s government’s intention to make this area as a
compact residential area with natural vegetated area by allowing steady building density
over the maximum plots of the area and providing almost strong accessibility for the plots
at the same time less degree of subdivision. In terms of physical consumptions, the land
parcels containing landed properties or terrace houses have shown the highest rate of
aggregate consumption. These morphologies have appeared as more land subdividing and
irrational in respect of Singapore’s land crisis and aim to be city in garden.
Page 91
8/6/2019 MEM Dissertation LAP
http://slidepdf.com/reader/full/mem-dissertation-lap 91/95
Morphological and Physiological Analysis for Measuring Urban Environmental Performance: A Case
Study of Bukit Panjang
Conclusion 8-2
Singapore is a small island city; due to have very good per capita income and being
strategically a very good business hub, the city’s metabolism process is also excessively
high which eventually gives rise to the effect of heat island, environmentally an
unexpected event for healthy and sound urban life. To attenuate this effect would require a
rational selection of material for building construction and electricity i.e. energy efficient
building operation. In this research a very small part of Singapore’s metabolism process
has been considered by relating with the morphology; future extensive studies which may
account more energy and material flow in Singapore’s urban environment should give a
platform for sensible planning decision to ensure a livable community by optimum
resource allocation for urban buildings and infrastructures. However, it is not wise to
make any decision about the sustainable performance of Singapore’s urban environment
without expanding the analysis towards other dimensions like ground water availability,
the albedo values across the island as well as more extensive behavior of urban energy
and material consumption.
Page 92
8/6/2019 MEM Dissertation LAP
http://slidepdf.com/reader/full/mem-dissertation-lap 92/95
Morphological and Physiological Analysis for Measuring Urban Environmental Performance: A Case study
of Bukit Panjang New Town
References Ref-1
References
Adolphe, L (2001) “A simplified model of urban morphology: applications to an analysis
of the environmental performance of cities” Environment and Planning B:
Planning and Design Vol. 28 Pp 183-200
Alberti, M. (1999) “Urban Patterns and Environmental Performance: What do we
know?” Journal of Planning Education and Research, Vol. 19 (2) Pp 151-163
Becker, B, (1997); “Sustainability Assessment: A Review of Values, Concepts, and
Methodological Approaches (Issues in Agriculture 10)”, Consultative Group on
International Agricultural Research (CGIAR), Washington DC, United States
Decker, E.H.; Elliott, S; Smith,F.A.; Blake, D.R.; Rowland, F.S. (2000) “Energy and
Material Flow Through the Urban Ecosystem” Annual Review Energy
Environment Vol. 25 Pp 685-740
Dhakal, S. (2002) The Urban Heat Environment and Urban Sustainability In: F.
Moavenzadeh et al (eds.) Future Cities: Dynamics and Sustainability, Pp149-172Kluwer Academic Publishers, Netherlands
Farina A, (1998), Principles and Methods in Landscape Ecology, Chapman & Hall Press,London.
Forman, R. (1995) Land Mosaics – The Ecology of Landscape and Regions (9th
ed.). UK:
Cambridge University Press.
Graedel T, Lanzano T, Pott W, Araujo, R: “Multiscale Life Cycle Assessment”, Published
in Yale School of Industrial Ecology, 2005
Guy S, Marvin S & Moss T (2001), Infrastructure in Transition, Earthscan Publication
Ltd, London and Sterling, VA
Hamm, B & Muttagi. Pandurang K., (1998) “Sustainable Development and the Future of
Cities”; Intermediate Technology Publications, London, UK.
Holden and Norland, (2005) “Three Challenges for the Compact City as a Sustainable
Urban Form: Household Consumption of Energy and Transport in Eight Residential Areas in the Greater Oslo Region” Urban Studies Vol. 42 No.12
Pp 2145-2166
Huber, J. (1995) “Nachhaltige Entwicklung durch Suffizienz, Effizienz und Konsistem.”
In Nacbbaltigkeit in naturwissenschafilicher und sozialwissenschaflitcher
Perspektive, edited by P. Fritz, J. Huber, and H. W. Levi, Pp 31-46. Stuttgart:
Hirzel. Cited in Becher, 1997
Page 93
8/6/2019 MEM Dissertation LAP
http://slidepdf.com/reader/full/mem-dissertation-lap 93/95
Morphological and Physiological Analysis for Measuring Urban Environmental Performance: A Case study
of Bukit Panjang New Town
References Ref-2
Jabareen, Y.R. (2004) “A knowledge map for describing variegated and conflict domains
of sustainable development”. Journal of Environmental Planning and
Management Vol47 (4): Pp 632-42.
Jabareen, Y.R (2006) “Sustainable Urban Forms: Their Typologies, Models, and Concepts” Journal of Planning Education and Research 2006; Vol 26; Pp 38-52
Jenks, M, Elizabeth. B, and Katie Williams. (1996) “A sustainable future through the
compact city?” Urban intensification in the United Kingdom. Environment by
Design Vol.1 (1): Pp 5-20.
Jenks, M., and Burgess, R. (Eds.) (2000) Compact Cities – Sustainable Urban Forms for
Developing Countries. London: Spon Press.
Kytzia, S (2003). Material Flow Analysis as a Tool for Sustainable Management of the
Built Environment . In: Koll-Schretzenmayr, M.; Keiner, M., Nussbaumer, G.(Hrsg.), The Real and The Virual World of Spatial Planning. Springer-Verlag2003
Longley, P; Goodchild, M; Maguire, D and Rhind, D (2001) Geographic Information
System and Science John Wiley & Sons Ltd, England
Master Plan 2003, Urban Redevelopment Authority, Singapore
McPherson, E.G. (1994). Energy-saving potential of trees in Chicago. In Chicago’s Urban
Forest Ecosystem: Results of the Chicago Urban Forest Climate Project, eds. E.G.
McPherson, D.J. Nowak, and A. Rountree, 7.1-7.22. Radnor, Pa: NortheasternForest Experiment Station.
Miller, D. and de Roo, G. (2004) Integrating City Planning and Enviromental
Improvement . USA: Ashgate Publishing.
Mitchell, G (2005)“Urban Development, Form and Energy Use in Building: A Review for
the SOLUTIONS Project” First Draft ERSRC University of Cambridge,University of West of England, The Young Foundation, University of Leeds,
University of Newcastle.
Lay, Ong-Boon (2003), “Green plot ratio: an ecological measure for architecture and
urban planning”, Journal of Landscape and Urban Planning Vol.63 pp 197-211
Oswald, F., & Baccini, P., in association with Michaeli, M. (2003) “ Netzstadt – Designing
the Urban”. Switzerland: Birkhauser.
Owens, S. (1986) Energy, Planning, and Urban Form. London, U.K.: Pion.
Page 94
8/6/2019 MEM Dissertation LAP
http://slidepdf.com/reader/full/mem-dissertation-lap 94/95
Morphological and Physiological Analysis for Measuring Urban Environmental Performance: A Case study
of Bukit Panjang New Town
References Ref-3
Pauleit, S., Duhme, F. (2000) “Assessing environmental performance of land cover types
for urban planning” Landscape and Urban Planning, Vol. 52, Pp 1-20
Redclift, M. (1994) “Sustainable Development: Economics and the Environment.” In
Strategies for Sustainable Development: Local Agendas for the Southern
Hemisphere, edited by M. Redclift and C. Sage, Pp 17-34. Chichester, U.K.:John Wiley and Sons.
Steemers, K. (2003). Energy and the city: density, buildings and transport. Energy
andBuildings, Vol. 35 Pp 3-14.
Tan, W. (2007) Practical Research Method. Third Edition. Prentice Hall, Singapore.
User’s Manual, ArcGIS 9.2, ESRI
Williams, K; Burton, E and Mike Jenks. (2000) Achieving the compact city through
intensification: An acceptable option. In The compact city: A sustainable urban
form? ed. Mike Jenks, Elizabeth Burton, and Katie Williams, Pp 83-96. London:E & FN Spon.
Wu, Q; Hu, D; Wang, R, Li, H; He, Y; Wang, M; Wang, B (2006) “A GIS-based moving
window analysis of landscape pattern in the Beijing metropolitan area, China”
International Journal of Sustainable Development & World Ecology Vol 13,Pp
419-434
Yang, P. P. J. (2007) “Multi-scale assessment of Urban Environmental Performance: An
approach to measuring sustainable urban form and material flows”, Presented in
UPE7 “World class cities: environmental impacts, planning opportunities?”,
Bangkok, Thailand.
Yang, P. P. J. (2007) “Tracking sustainable urban forms and material flows in
Singapore” In M. Jenks, D. kozak, and P. Takkanon (Eds.), World Cities and
Urban Form. Taylor & Francis Books Ltd., (To be published in 2008).
Yoshida, H and Omae, M (2005) “An Approach for analysis of urban morphology:
methods to derive morphological properties of city blocks by using an urban
landscape model and their interpretations” Computers, Environment and Urban
System Vol.29 Pp 223-247
Zetter, R., and Watson, G. B. (Eds.) (2006) Designing Sustainable Cities in the
Developing World . England: Ashagate.
Page 95
8/6/2019 MEM Dissertation LAP
http://slidepdf.com/reader/full/mem-dissertation-lap 95/95
Morphological and Physiological Analysis for Measuring Urban Environmental Performance: A Case study
of Bukit Panjang New Town
Online Resources:
EPA (2001) “Urban Form and Thermal Efficiency: How the Design of Cities Can
Influence the Urban Heat Island Effect”
http://cfpub.epa.gov/ncer_abstracts/index.cfm/fuseaction/display.abstractDetail/abstract/6
805/report/0
Ministry of Agriculture and Forestry, New Zealandhttp://www.maf.govt.nz/mafnet/rural-nz/sustainable-resource-use/land-
management/impacts-of-rural-subdivision/subdiv08.htm
Sub-division of land
http://www.goredc.govt.nz/documents/district_plan/Chapter_08_Subdivision.pdf
Subdivision http://www.wairoadc.govt.nz/documents/27subdivision
Subdivision and Development of Landhttp://data.hcc.govt.nz/District_Plan/Policy%204.4%20Subdivision%20and%20Develop
ment.pdf
The Encyclopedia of Earth “Urban Metabolism”
http://www.eoearth.org/article/Urban_metabolism Accessed on 08/07/08
Urban Metabolism: Ecologically sensitive construction for a sustainable New Orleanshttp://www.holcimfoundation.org/Portals/1/docs/F07/Student-
Posters/David%20Quinn%20MIT%20Student.pdf
Energy Market Authority, Singapore
http://www.ema.gov.sg/FILES/historical_electricity_consumption.pdf
Singapore Property Glossary and Common Terms Definition
http://www.sg-house.com/about286130.html
Th R l f C t d i R l ti t Ai T t f U b D lli i Ath