Date post: | 27-Dec-2015 |
Category: |
Documents |
Upload: | blake-carter |
View: | 216 times |
Download: | 0 times |
Mem
ber
of
the H
elm
holt
z A
ssoci
ati
on
OS2010| Institute of Energy Research–Plasma Physics | Association EURATOM – FZJ
Spectroscopy on laser released particles from plasma facing materials in a tokamak
B. Schweer, A. Huber, V. Philipps, M. Zlobinski, N. Gierse and U. Samm
Institut für Energieforschung – Plasmaphysik, Forschungszentrum Jülich,
Association EURATOM-FZJ, Trilateral Euregio Cluster, D-52425 Jülich, Germany
OPEN SYSTEMS 2010| Institute of Energy Research – Plasma Physics | Association EURATOM – FZJJuly 6th, 2010 No 2
• Introduction
• Wall characterisation with laser based methods
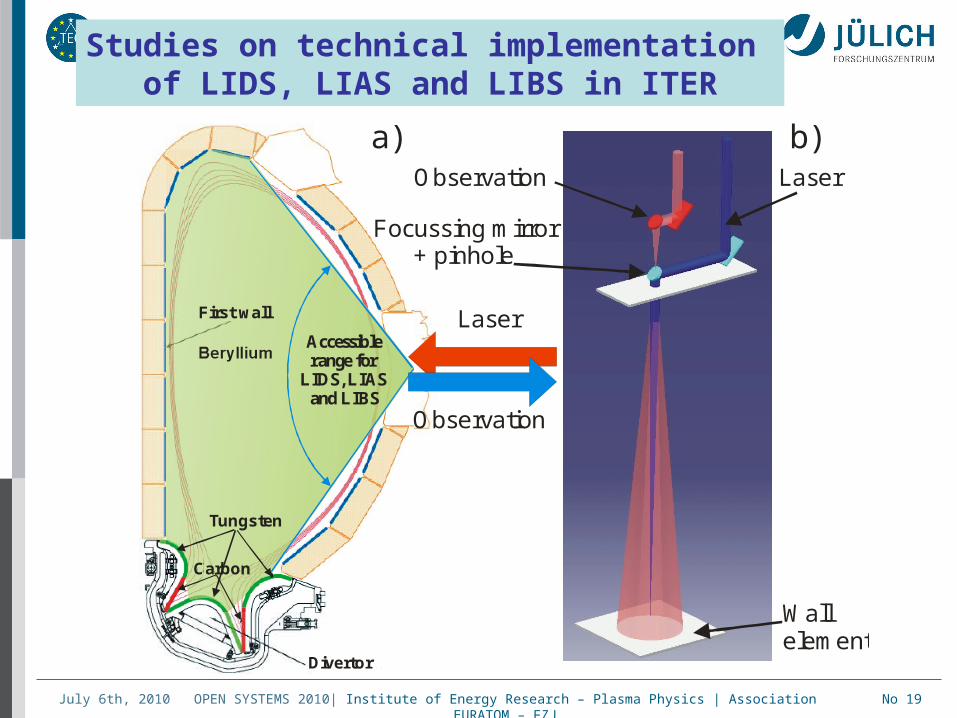
• Application in tokamaks (ITER)
outline
OPEN SYSTEMS 2010| Institute of Energy Research – Plasma Physics | Association EURATOM – FZJJuly 6th, 2010 No 3
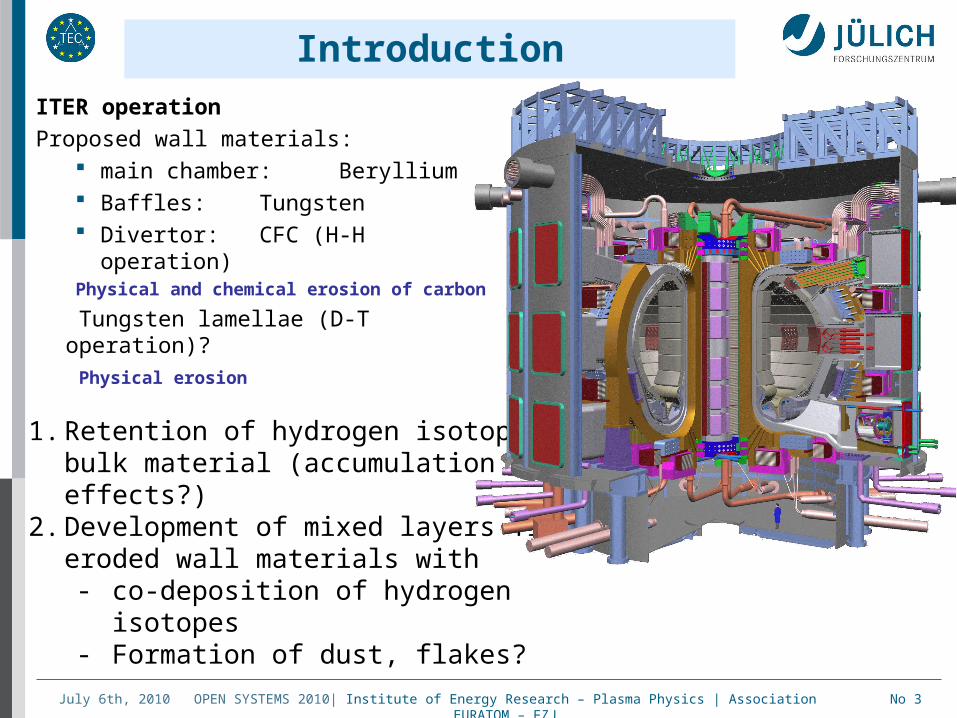
Introduction
1. Retention of hydrogen isotopes in bulk material (accumulation effects?)
2. Development of mixed layers fromeroded wall materials with - co-deposition of hydrogen isotopes- Formation of dust, flakes?
ITER operation
Proposed wall materials: main chamber: Beryllium Baffles: Tungsten Divertor: CFC (H-H
operation)Physical and chemical erosion of carbon
Tungsten lamellae (D-T operation)?
Physical erosion
OPEN SYSTEMS 2010| Institute of Energy Research – Plasma Physics | Association EURATOM – FZJJuly 6th, 2010 No 4
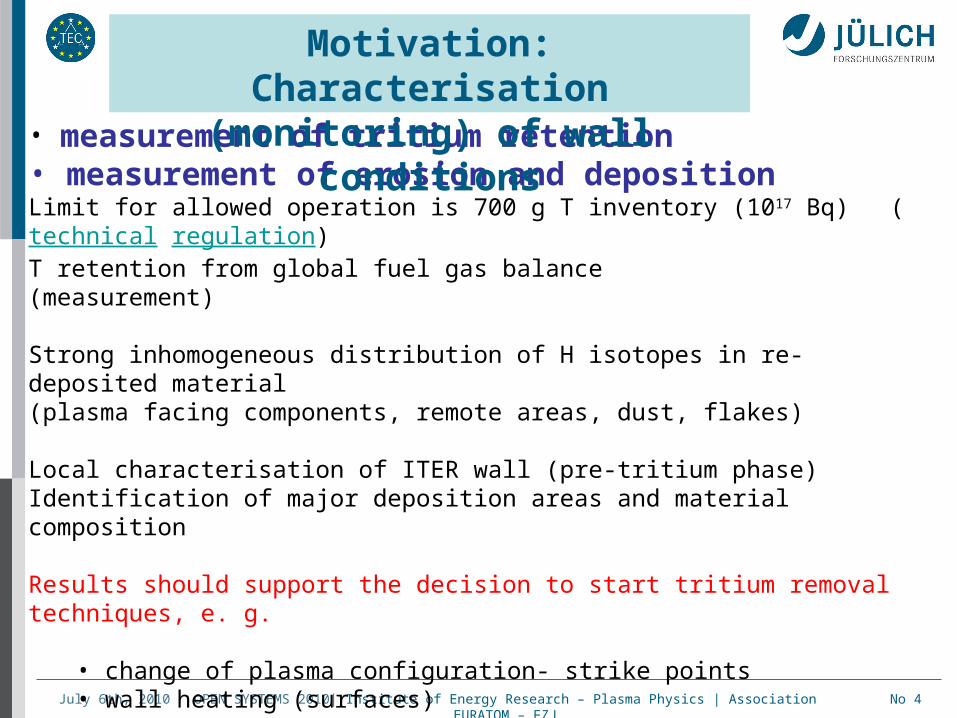
• measurement of tritium retention• measurement of erosion and depositionLimit for allowed operation is 700 g T inventory (1017 Bq) (technical regulation) T retention from global fuel gas balance (measurement)
Strong inhomogeneous distribution of H isotopes in re-deposited material (plasma facing components, remote areas, dust, flakes)
Local characterisation of ITER wall (pre-tritium phase)Identification of major deposition areas and material composition
Results should support the decision to start tritium removal techniques, e. g.
• change of plasma configuration- strike points • wall heating (surfaces)• chemical reaction-oxidation, cleaning discharges• remote access-local heating of surface layer (flashlamp, laser)• exchange of components
Motivation: Characterisation (monitoring) of wall conditions
OPEN SYSTEMS 2010| Institute of Energy Research – Plasma Physics | Association EURATOM – FZJJuly 6th, 2010 No 5
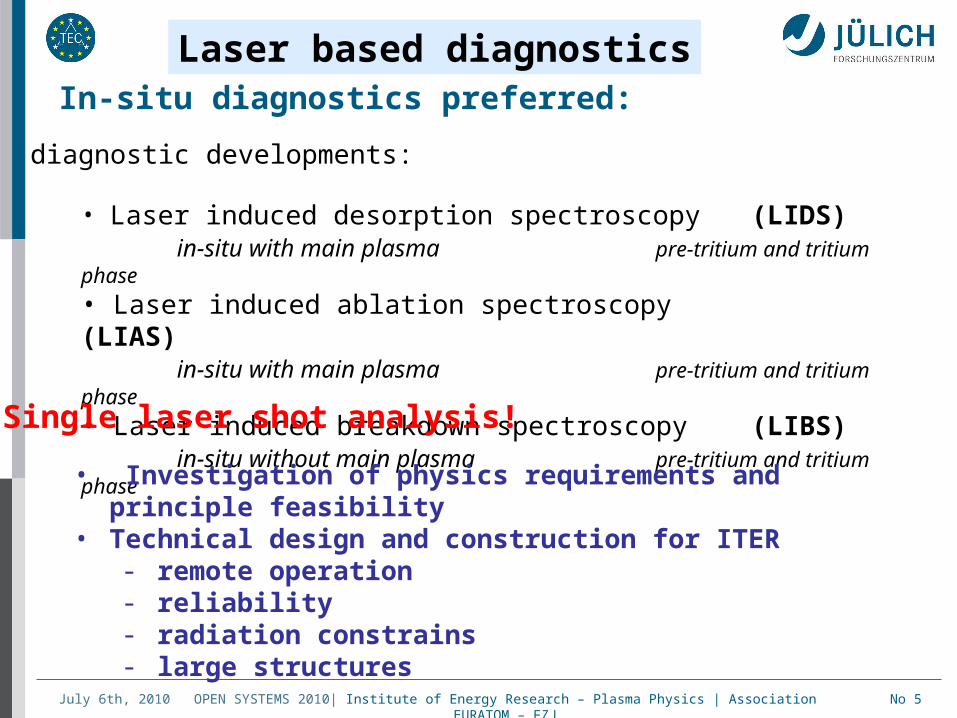
In-situ diagnostics preferred:
diagnostic developments:
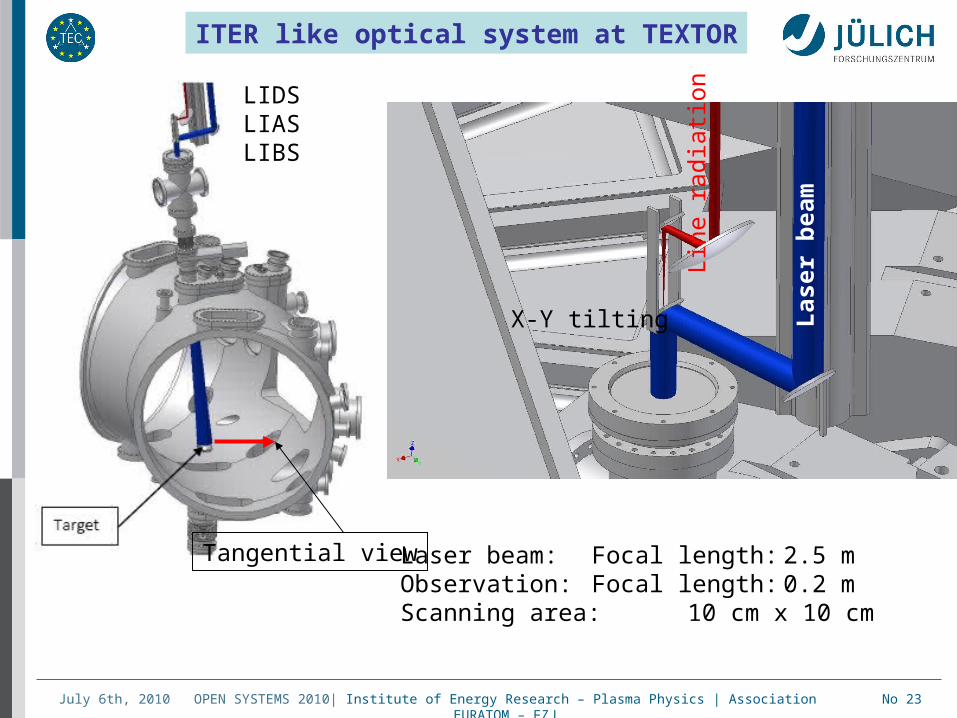
• Laser induced desorption spectroscopy (LIDS)in-situ with main plasma pre-tritium and tritium phase
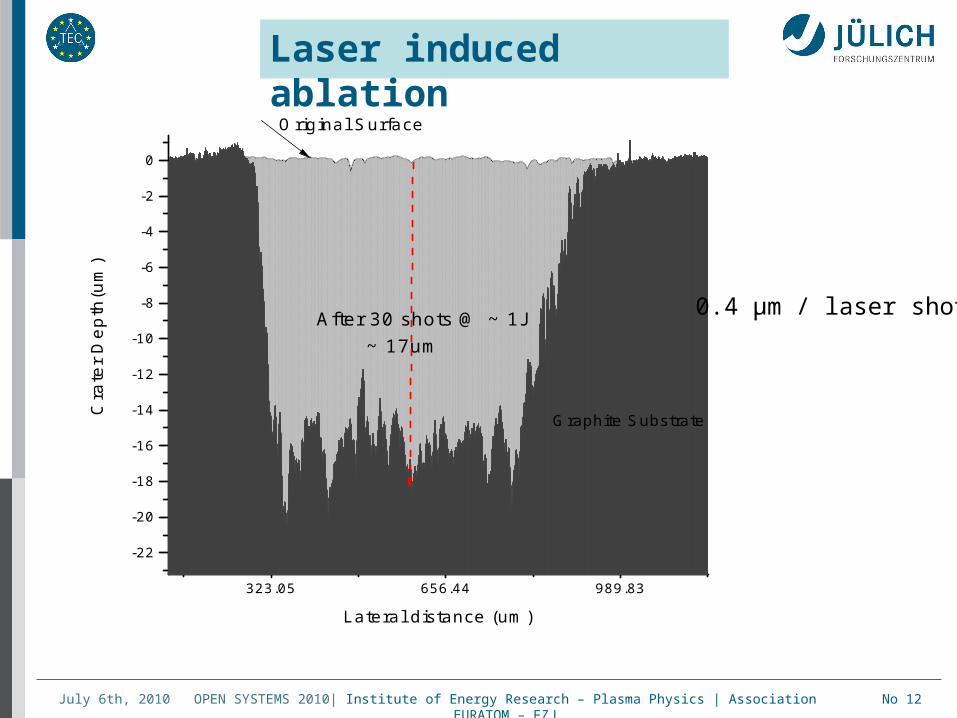
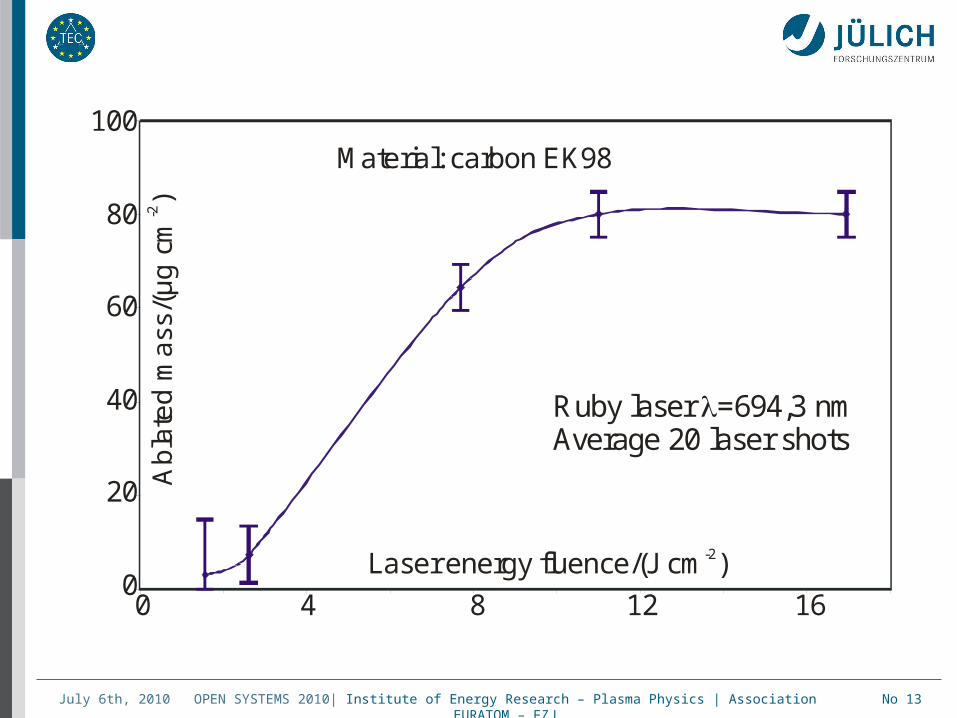
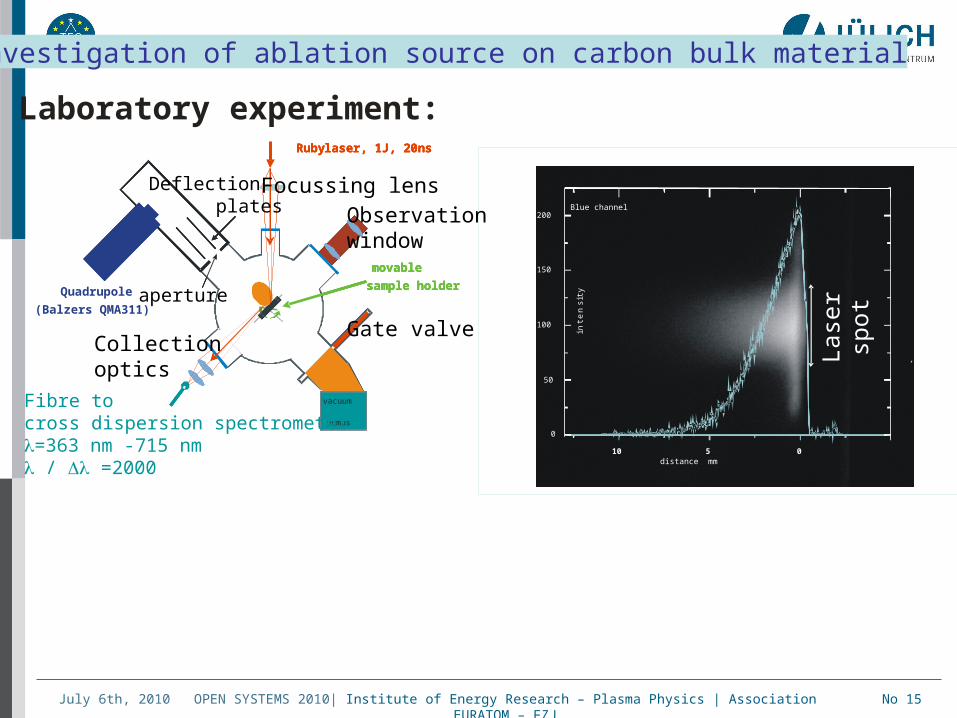
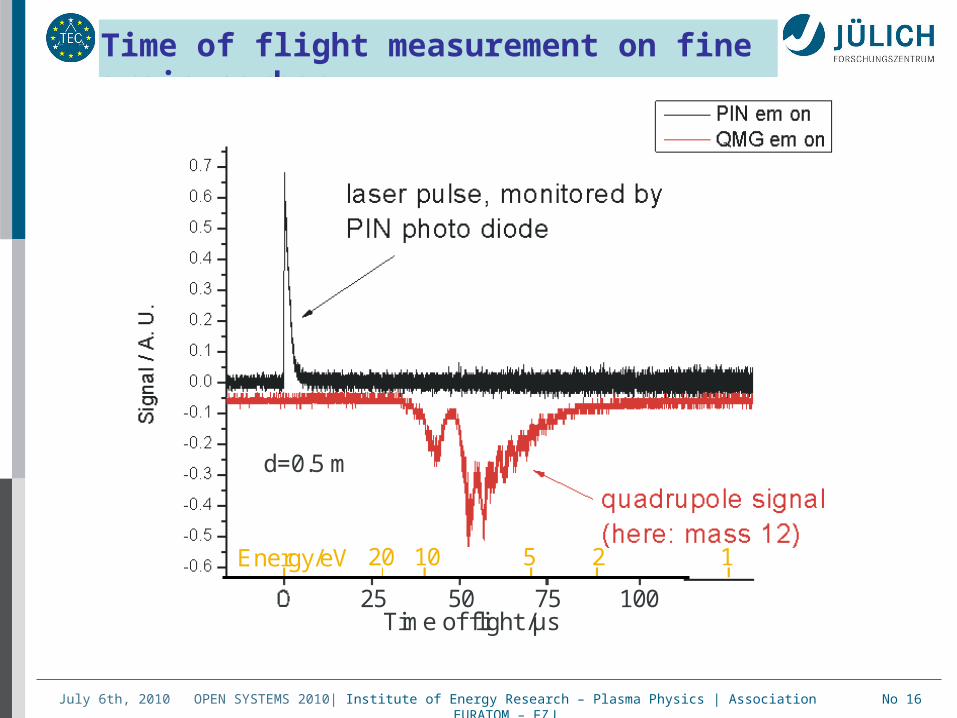
• Laser induced ablation spectroscopy (LIAS)in-situ with main plasma pre-tritium and tritium phase
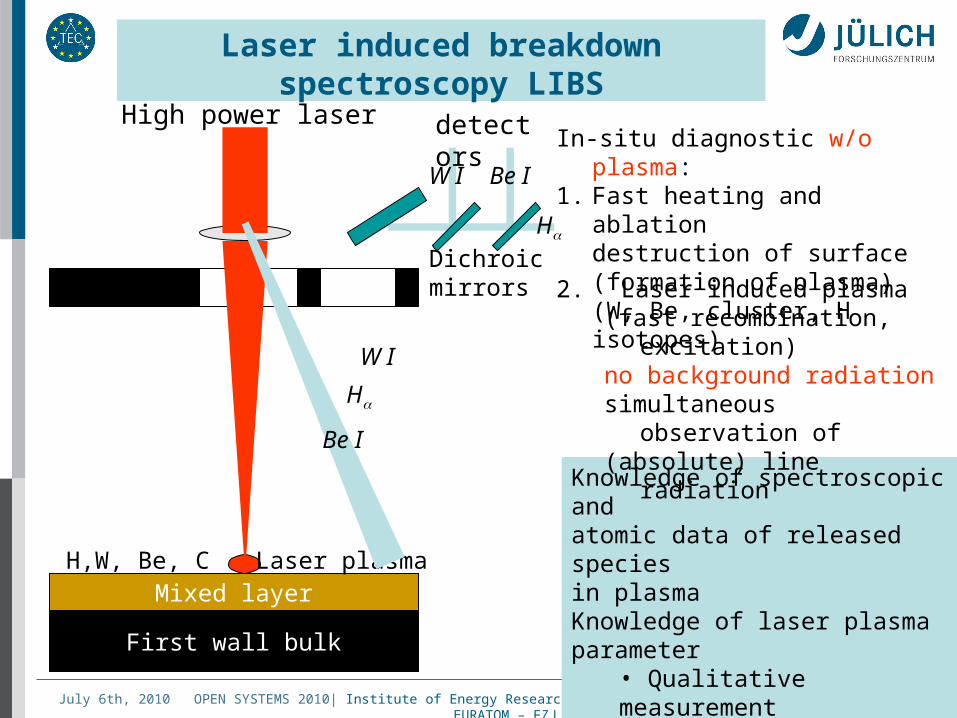
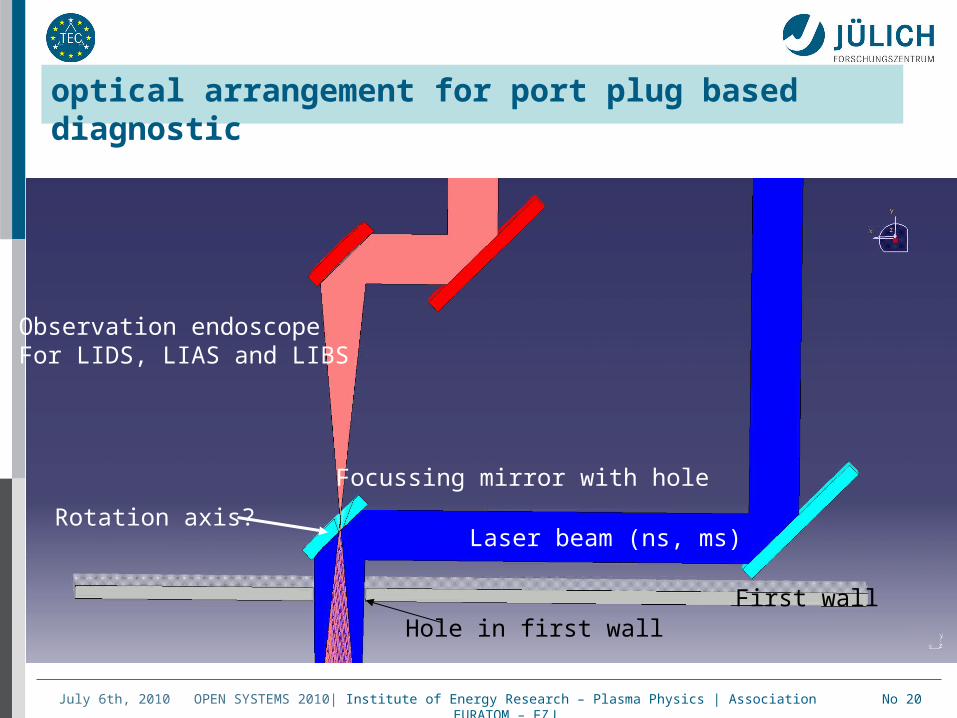
• Laser induced breakdown spectroscopy (LIBS)in-situ without main plasma pre-tritium and tritium phase
• Investigation of physics requirements and principle feasibility• Technical design and construction for ITER
- remote operation - reliability- radiation constrains- large structures
Laser based diagnostics
Single laser shot analysis!
OPEN SYSTEMS 2010| Institute of Energy Research – Plasma Physics | Association EURATOM – FZJJuly 6th, 2010 No 6
Knowledge of molecules decay process: • (dissociation, excitation, ionisation)
D2 D* + D* 2D++ 2e
h• (ionisation, dissociation, excitation) D2D2
++ e D++ D* + e 2D++ 2e
hMeasurement of absolute H intensitiesKnowledge of plasma parameter and conversion factors (S/XB)
Laser induced desorption spectroscopy LIDS
First wall bulk
Mixed layer (a:C-H)
Main plasma
H2, (HnCm)
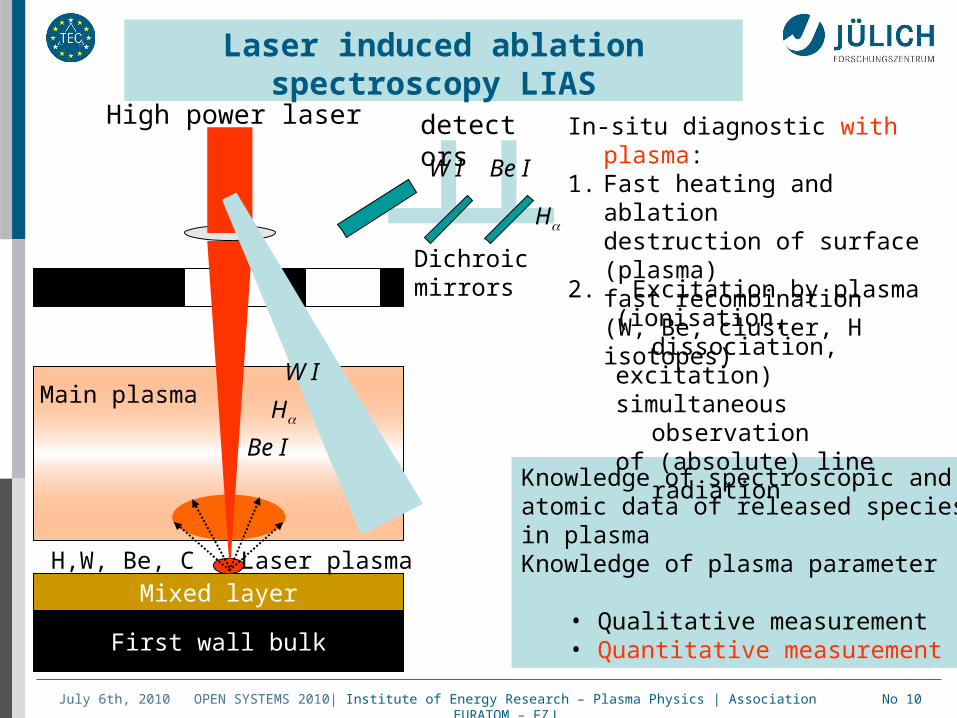
Laser In-situ diagnostic:1. Fast heating and desorption
release of hydrogen isotopes(H2, hydrocarbon)
H
H
H
detector
2. Excitation by plasma(ionisation, dissociation, excitation) observation of line radiation
OPEN SYSTEMS 2010| Institute of Energy Research – Plasma Physics | Association EURATOM – FZJJuly 6th, 2010 No 7
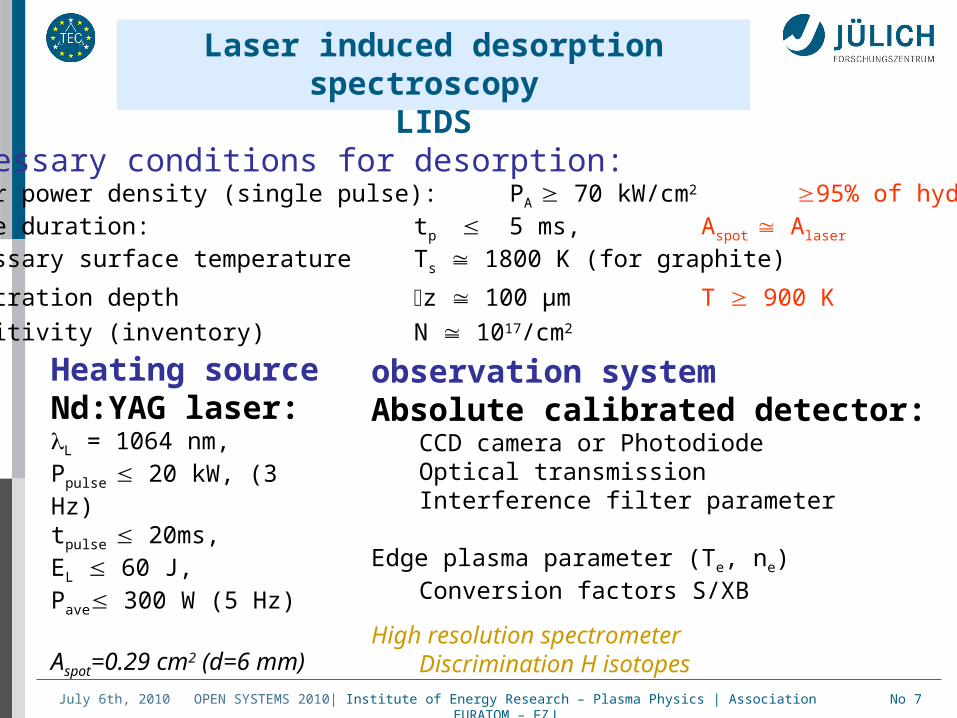
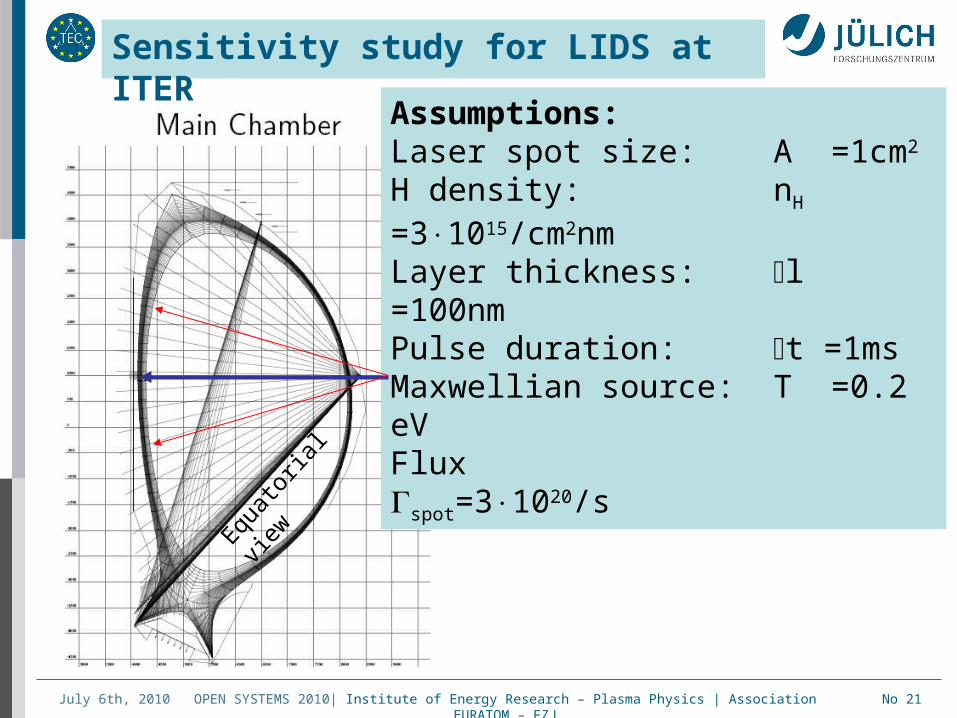
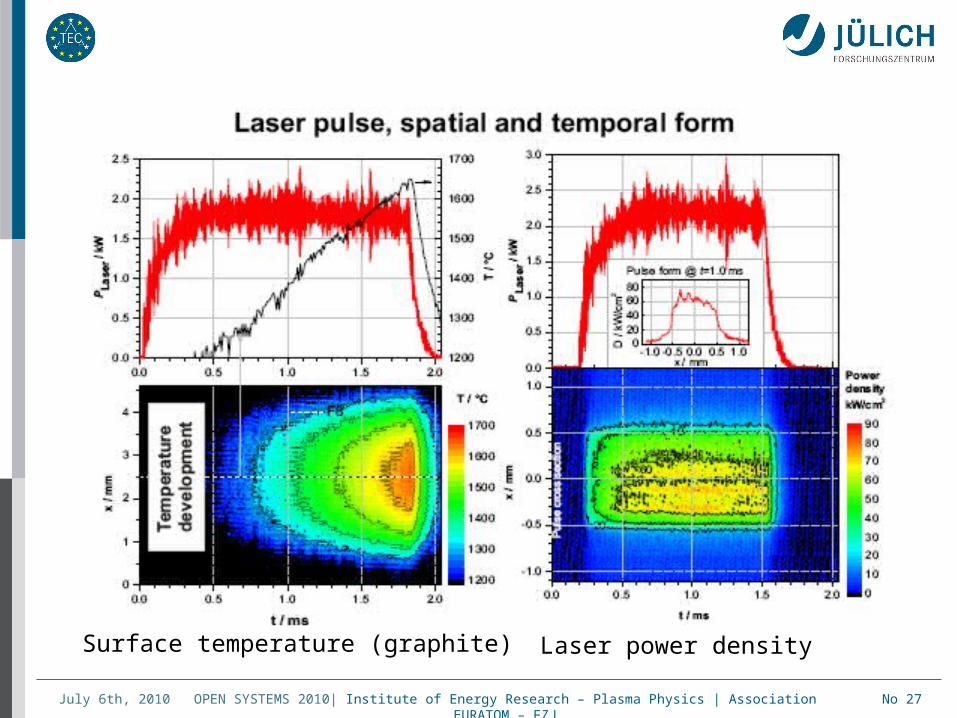
Heating sourceNd:YAG laser: L = 1064 nm, Ppulse 20 kW, (3 Hz)tpulse 20ms, EL 60 J, Pave 300 W (5 Hz)
Aspot=0.29 cm2 (d=6 mm)
Laser induced desorption spectroscopy
LIDSnecessary conditions for desorption: laser power density (single pulse): PA 70 kW/cm2 95% of hydrogenpulse duration: tp 5 ms, Aspot Alaser
necessary surface temperature Ts 1800 K (for graphite)
Penetration depth z 100 µm T 900 K
Sensitivity (inventory) N 1017/cm2
observation systemAbsolute calibrated detector:
CCD camera or PhotodiodeOptical transmissionInterference filter parameter
Edge plasma parameter (Te, ne)Conversion factors S/XB
High resolution spectrometer Discrimination H isotopes
OPEN SYSTEMS 2010| Institute of Energy Research – Plasma Physics | Association EURATOM – FZJJuly 6th, 2010 No 8
system
Laser outsideconcrete shieldingFibre length 35 mCore diameter 400 µm
Fast camera: 7000 frames/sStandard:500 frames/shigh resolution spectrom.H/D
Experimental arrangement at TEXTOR
OPEN SYSTEMS 2010| Institute of Energy Research – Plasma Physics | Association EURATOM – FZJJuly 6th, 2010 No 9
LIDS on graphite (roof limiter)
Camera frame frequency 1500 Hz
OPEN SYSTEMS 2010| Institute of Energy Research – Plasma Physics | Association EURATOM – FZJJuly 6th, 2010 No 10
First wall bulk
Mixed layer
Main plasma
Laser induced ablation spectroscopy LIAS
High power laser
H,W, Be, C Laser plasma
In-situ diagnostic with plasma:1. Fast heating and ablation
destruction of surface (plasma)fast recombination(W, Be, cluster, H isotopes)
Knowledge of spectroscopic and atomic data of released species in plasmaKnowledge of plasma parameter
• Qualitative measurement• Quantitative measurement
2. Excitation by plasma(ionisation, dissociation,excitation)simultaneous observationof (absolute) line radiationH
detectors
Dichroicmirrors
W I
Be I
W I Be I
H
OPEN SYSTEMS 2010| Institute of Energy Research – Plasma Physics | Association EURATOM – FZJJuly 6th, 2010 No 11
Heating source: (e.g.)
Nd:YAG laser (Q-switch): Laser = 1064 nm, (512nm, 353 nm)Ppulse 300 MW, (Q switch)tpulse = 8 ns, ELaser 2.5 J, Pav 25 W (10 Hz)
Aspot=3 cm2 (d=10 mm)(w/o fibre)
Laser induced ablation spectroscopy LIAS
necessary conditions for ablation: laser power density (single pulse): PA 100 MW/cm2
pulse duration: tp 10 ns, Laser ind. plasma temperature Tp 1-10 eV
Penetration depth z 1 µm
observation systemAbsolute calibrated detector:
CCD camera or diodeOptical transmission (UV to IR)Interference filter parameter
Edge plasma parameter (Te, ne)Conversion factors S/XB
Wide range high resolution spectrometer
OPEN SYSTEMS 2010| Institute of Energy Research – Plasma Physics | Association EURATOM – FZJJuly 6th, 2010 No 12
Laser induced ablation
323.05 656.44 989.83
-22
-20
-18
-16
-14
-12
-10
-8
-6
-4
-2
0
Graphite Substrate
After 30 shots @ ~ 1J ~ 17um
Cra
ter
De
pth
(um
)
Lateral distance (um)
Original Surface
0.4 µm / laser shot
OPEN SYSTEMS 2010| Institute of Energy Research – Plasma Physics | Association EURATOM – FZJJuly 6th, 2010 No 13
0,00E+00
2,00E-05
4,00E-05
6,00E-05
8,00E-05
1,00E-04
0 2 4 6 8 10 12 14 16 180 4 8 12 16
Laser energy fluence/(J cm )-2
0
20
40
60
80
100
Ab
late
d m
ass
/(µ
g c
m)
-2Material: carbon EK98
Ruby laser =694,3 nmAverage 20 laser shots
OPEN SYSTEMS 2010| Institute of Energy Research – Plasma Physics | Association EURATOM – FZJJuly 6th, 2010 No 14
580 600 620 640 660 6800
100
200
300
400
500
600
CII(678.4nm)
CII(658nm)H(656nm)CII(589nm)
1st laser pulse 0.25J/cm2, spot No2, #96692
2nd laser pulse 0.25J/cm2, spot No2, #96693
3d laser pulse 0.25J/cm2, spot No2, #96694
inte
nsity
/ a.
u.
wavelength / nm
Laser-induced ablation spectroscopyon TEXTOR
Tungsten test limiter with 140 nm a-C:D coating
Ruby lasertlaser=10 nsP=25 MW/cm2
E=0.25 J/cm2
Threshold for ablation of layers is much lower
OPEN SYSTEMS 2010| Institute of Energy Research – Plasma Physics | Association EURATOM – FZJJuly 6th, 2010 No 15
Investigation of ablation source on carbon bulk material
10 5 0
0
50
100
150
200
inte
ns
ity
distance mm
Blue channel
10 5 0
0
50
100
150
200
inte
ns
ity
distance mm
Blue channel
Laboratory experiment:
Vacuum
Pumps
vacuum
pumps
Ruby laser, 1J, 20ns
movable
sample holder
Vacuum
Pumps
vacuum
pumps
Ruby laser, 1J, 20ns
movable
sample holder
Vacuum
Pumps
vacuum
pumps
Ruby laser, 1J, 20ns
Quadrupole
(Balzers QMA311)
movable
sample holder
Fibre to cross dispersion spectrometer=363 nm -715 nm / =2000
Collectionoptics
Gate valve
Observationwindow
Focussing lensDeflection plates
aperture
Las
ersp
ot
OPEN SYSTEMS 2010| Institute of Energy Research – Plasma Physics | Association EURATOM – FZJJuly 6th, 2010 No 16
Time of flight measurement on fine grain carbon
25 50 75 100Time of flight /µs
d=0.5 m
12 5 10 20 Energy/eV
OPEN SYSTEMS 2010| Institute of Energy Research – Plasma Physics | Association EURATOM – FZJJuly 6th, 2010 No 17
First wall bulk
Mixed layer
Laser induced breakdown spectroscopy LIBS
Knowledge of spectroscopic and atomic data of released species in plasmaKnowledge of laser plasma parameter
• Qualitative measurement• Quantitative measurement
High power laser
H,W, Be, C Laser plasma
In-situ diagnostic w/o plasma:1. Fast heating and ablation
destruction of surface (formation of plasma)(W, Be, cluster, H isotopes)
H
detectors
Dichroicmirrors
W I
Be I
2. Laser induced plasma(fast recombination, excitation)no background radiationsimultaneous observation of(absolute) line radiation
W I
H
Be I
OPEN SYSTEMS 2010| Institute of Energy Research – Plasma Physics | Association EURATOM – FZJJuly 6th, 2010 No 18
8
6
4
2
0Int
ensi
ty /
10co
unts
4
350 400 450 500 550 600 650 700
LIBS spectra on graphite
Reproducibility?Calibration?
OPEN SYSTEMS 2010| Institute of Energy Research – Plasma Physics | Association EURATOM – FZJJuly 6th, 2010 No 19
Carbon
Divertor
First wall
Accessible range for
LIDS, LIAS and LIBS
Tungsten
Observation
Focussing mirror + pinhole
Laser
Observation
Laser
a) b)
Wallelement
Studies on technical implementation of LIDS, LIAS and LIBS in ITER
OPEN SYSTEMS 2010| Institute of Energy Research – Plasma Physics | Association EURATOM – FZJJuly 6th, 2010 No 20
optical arrangement for port plug based diagnostic
Laser beam (ns, ms)
Observation endoscopeFor LIDS, LIAS and LIBS
Focussing mirror with hole
Rotation axis?
First wallHole in first wall
OPEN SYSTEMS 2010| Institute of Energy Research – Plasma Physics | Association EURATOM – FZJJuly 6th, 2010 No 21
Sensitivity study for LIDS at ITER
Assumptions:Laser spot size: A =1cm2
H density: nH =31015/cm2nmLayer thickness: l =100nmPulse duration: t =1msMaxwellian source: T =0.2 eVFlux spot=31020/s
Equat
oria
l vie
w
OPEN SYSTEMS 2010| Institute of Energy Research – Plasma Physics | Association EURATOM – FZJJuly 6th, 2010 No 22
Modelling studies on LIDS and LIAS during running ITER shots
2.5 3.0 3.5 4.0 4.5 5.0 5.5 6.0Distance from strike point along separatrix / m
1017
1018
1019
1020
Equatorial plane
ITER: equatorial view low density caseLIDS: N=10 17 D2
background
Line integrated H signal
Lin
e i
nte
gra
l H
/ph
oto
ns/
(ms
r s)
2
OPEN SYSTEMS 2010| Institute of Energy Research – Plasma Physics | Association EURATOM – FZJJuly 6th, 2010 No 23
ITER like optical system at TEXTOR
Laser beam: Focal length: 2.5 mObservation: Focal length: 0.2 mScanning area: 10 cm x 10 cm
Las
er b
eam
Lin
e ra
diat
ion
X-Y tilting
Tangential view
LIDSLIASLIBS
OPEN SYSTEMS 2010| Institute of Energy Research – Plasma Physics | Association EURATOM – FZJJuly 6th, 2010 No 24
Summary
Laser based diagnostic for ITER:
LIDS: in-situ method with plasma for Tritium retention in the divertor
and main chamber (poloidal distribution in equatorial view)
Promising results at TEXTOR
LIAS: in-situ method with plasma for first wall characterisation in the divertor and main chamber (equatorial view)
Needs more investigation of the source (bulk / layer)
dependence on pulse duration and exposure time
LIBS: in-situ method without plasma for first wall characterisation in the divertor and main chamber
Needs more investigation of the source (bulk / layer)
dependence on pulse duration and exposure time
parameter of laser plasma must be known (dynamic)
ITER: coaxial injection and observation feasible
modelling of line integrated signals in edge plasma requested
OPEN SYSTEMS 2010| Institute of Energy Research – Plasma Physics | Association EURATOM – FZJJuly 6th, 2010 No 25
OPEN SYSTEMS 2010| Institute of Energy Research – Plasma Physics | Association EURATOM – FZJJuly 6th, 2010 No 26
0.0 0.4 0.80
1000
2000
Radius r / mm
calculatedradial temperatureafter1 ms x 80 kW/cm
SpotRadius
2
Tem
pera
ture
T/o C t = pulse length
D = diffusion coefficient K = heat conductivity = specific densityc = specific heat
cK
tDT
2
1-dim heat conduction sufficient for spot centre temperature calculation:
Microscopic image of a laser-desorbed spot on an a-C:D layer on graphite