28


2

PowerOptions is an on-line suite of options research and analysis tools that are designed for self-directed options investors. We provide our customers with:
⇒ Current pricing, calculated percentages for returns, maximum risks and probabilities, liquidity values, Greeks on the 300,000+ options on the 3,300+ optionable stocks and indexes on the US Exchanges. Prices and other data are available in 20 minute delayed quotes or Real Time quotes.
⇒ On-line software tools that allow you to quickly search all options for only those positions that match your personal risk-reward tolerances.
⇒ Quick links to help you research the stocks, indexes and options in detail.⇒ Tools to help you not only track the positions but also manage them effectively as
well.⇒ An on-line library of help articles and educational resources.
In addition to the Married Put strategy, PowerOptions also offers patented tools in over 20 other options investment strategies as well.
Members of PowerOptions and RadioActive Trading have the advantage!
⇒ Patented tools offer simple one click searching to find only those RPM’s (RadioActive Profit Machines – Married Puts) that match your personal risk levels
⇒ Web based interface…no need to load programs onto your computer.⇒ Free access to market news, blogs, and the PowerOptions Expert Staff.⇒ Quick links to detailed stock and options research pages.⇒ Portfolio tools that are designed to track RadioActive Trades and…⇒ The only tool available to help you manage the RPM’s and show you potential
Income Methods, with all the calculations done for you!!!
Home Page: Direct your browser to http://www.poweropt.com
(If you are not already a member of PowerOptions, go to: http://www.poweropt.com/rat)
3

Logon Page: After you click ‘Client Login,’ enter your information:
My Home: Once you log on you will be taken to the My Home menu:
4

When you first log on to your PowerOptions account you will see the default Tab Menu selections.
Set Tabs: Strategy Tabs:* Alternate Tabs:Home Covered Call Custom SpreadsMy Portfolio Naked PutOther Strategies Married Put
Long CallCollarBull Put CreditBear Call Credit
If you do not have the Married Put or Collar Tab added to your main tab menu, simply click the “Other Strategies” tab (the last available tab):
5

To remove a strategy click the Remove button next to the listed tab. Once the strategy field is empty, simply select the strategy that you wish to add from the available strategies list on the left. You can use the ‘Add’ button or simply double click your preferred strategy to add it into the empty tab slot.
Once you have selected your strategies, you can re-order them based on your preference using the arrow buttons next to each tab number, then simply click the Save button. You will now see your preferred strategies and selected order on the Main Tab Menu.
In order to access the search and analysis tools for the Married Put strategy, simply click the Married Put tab now that it has been added to your available strategies. This will open the Married Put home tab.
6

Once you access the Married Put tab you will not only be able to access the patented search and analysis tools for the strategy on PowerOptions, you will also be able to access a variety help pages and free white papers regarding the strategy. The various sections are separated into informational pods.
Pod 1: Married Put Overview
The Married Put Overview pod contains several bullet points that describe the basics of the Married Put strategy. If you require further information on the strategy, you can click the link for ‘Married Put Strategy Help’. The Strategy Help page will give you a more in depth description of a particular strategy (a Strategy Help page is available for all strategies supported on PowerOptions).
Pod 2: Married Put Tools
The Married Put Tools pod allows you to link to the patented PowerOptions tools for the strategy.
Search: The patented SmartSearchXL tool will allow you to scan across the entire universe of options to find only those positions that match your personal Risk – Reward tolerance.
Sample Search: Pre-themed searches that you can use as a stepping stone to create your own personal search.
Search by Symbol: Search for potential positions in a given strategy one stock at a time to compare the risk vs. reward in a single expiration month or across all expiration months.
Back Test: Search Historically based your personal criteria or one stock at a Time and analyze the positions forward to view the calculated
7

Returns at expiration or at any time over the life of the position. Insurance: A unique tool developed for the Married Put and Collar strategies.
If you have a stock that is currently trading above your cost basis, The Insurance tool will find options for you to lock in profits whileStill having unlimited upside potential.
My Portfolio: Quickly view your current positions entered into the My Portfolio Tools, Setup a new Portfolio to track and manage your Married PutPositions or paper trade a methodology and track your historical returns.
Quick Links: Notice that underneath the main Married Put tab there are also quick links to access all the available tools. You can use these quick links to quickly navigate to the tool that applies to your search preference.
Pod 3: Learning Center:
This pod has links to a variety of informational articles that apply to the Married Put strategy. You can link directly to ‘The Sketch’ that was written by Kurt Frankenberg, plus a four part article that was written by Ernie Zerenner. Links to various educational products are also available in the Learning Center. This pod will be continuously updated with other useful articles related to the Married Put strategy and the RadioActive Trading Methodology.
Pod 4: Trading Tips:
Pod 4 contains revolving quick tips regarding the Married Put strategy and using the tools on PowerOptions to help you more effectively use the PowerOptions tools when searching for potential trades and managing your positions.
The PowerOptions tools will greatly reduce your time spent on research and analysis without shortcutting you on any valuable or necessary stock or option data. These tools are your guides for navigating through the entire universe of optionable stocks and various combinations to help you find only those Married Put positions that match your risk threshold.
The patented SmartSearchXL tool is the most powerful options search tool available to options investors. Think of it as your own personal Virgil, your guide through the various levels of chaos in the optionable stock market.
8

When you first access the Search tool, you will see a variety of potential Married Put positions:
These selections are not recommendations or suggestions on what you should trade! These are merely the results that match the default set of criteria in the parameter settings field located below the Results Table. Before we analyze the Results Table, let’s take a look at the Parameter Settings Field.
The Parameter Settings Field may seem daunting at first, but the key is to only use the criteria that apply to your options investment research and analysis. To begin using the Parameter Settings Field in conjunction with RadioActive Trading, locate the ‘Search Settings Saved As’ drop down menu at the top of the Parameter Settings Field.
Change the Default search from ‘**An Initial Value Set’ to ‘**Radioactive’. Once you select the new search, the system will automatically run the new criteria and display the results that match the RadioActive default criteria.
The criteria for this search were created by Kurt and Ernie and reflect the principles outlined in the Blueprint and presented in the seminar. You can make any changes you like to the criteria to find only those positions that match your personal risk-reward
9

tolerances, but you do not want to deviate too much from the initial settings. Let us review the default RadioActive search criteria:
The following settings are part of the “**Radioactive” search:
• Sorted by % Max Risk• Put expirations between 150 to 900 days out in time• Put up to 20% In The Money (ITM)• % Risk between 2.5 and 11%• Put open Interest greater than 0• Stock price between 9 and 200• Average stock volume greater than 300K• In an up trend based on the Stock Price > 50 Day Moving Avg.• Stocks chosen also appears on the IBD 100 or CANSLIM lists
Sort Results Table By: When trading RadioActively we want to focus on limiting our risk first…that is why the default settings are sorting the results by the % Maximum Risk from lowest to highest. If you wish to change the sort fields, simply click the drop-down menu and select the data field you wish to sort the results by.
Option Expiration Time Frame: Applying the concepts of the REDLine (RadioActive Exponential Decay) we want to purchase our Protective Put at least 5 months out in time. The default settings are looking for an Expiration Time Frame of All Months, but restricted to be at least 150 days to 900 days out in time. If you wanted to only look for put options that were at least 9 months out in time, simply change the ‘150’ Days to Expiration minimum requirement to ‘250’ or ‘270’
If you only wanted to look at LEAP options, those expiring in January one or two years out in time, simply change the Option Expiration Time Frame drop down menu to ‘All LEAPS’ or select the January expiration month that matches your requirements.
10

* If you change the Expiration Time Frame to a specific month, make sure to remove the ‘Days to Expiration’ limitations or adjust those numbers appropriately so you do not have conflicting search values.
Show In / Out-of-the-money: Applying the concepts of the ATM Bell Curve, we want to find put options that are In-the-Money (ITM) to maximize our protection. However, we do not want to go too deep In-the-Money when we are initially looking for new RPM positions, as going too deep ITM might hinder the correct application of various Income Methods. We limit the % In-the-Money range to be less than 20% in the default search criteria.
% Maximum Risk: This is probably the most important field for the RadioActive technique. The default setting limits the % maximum risk on the results from 2.5% to 11%. If you wished to only see positions with a lower maximum risk, simply click in the box, delete the upper level restriction and input your desired risk amount, in this example, the maximum risk is limited to 8.0%.
Open Interest: We put a minimum value into the Open Interest field to make sure there was some activity. Adjust the values to match your specific requirements.
Stock Price: The default settings are looking for stocks that trade between $9.00 per share and $200.00 per share. If you wish to look for stocks that are priced less than $200.00, simply click in the field and change the maximum stock price amount to your desired level:
Stock Criteria: There are three settings for the stock criteria in the default search:
Average Stock Volume > 300This shows us only those stocks that on average trade at least 300,000 shares per day (averaged over the last 90 days). If you preferred to look for stocks with a higher average daily volume, simply adjust the filter to match your requirements.
Stock Price > SMA 50This criterion allows us to find only those stocks that are trading above their 50-day moving average (currently in an uptrend). If you wished to screen for a different moving average, simply use the drop down menus to select your preferred moving average requirement.
Recommended Lists: IBD 100 and CANSLIM ListThis limits all of the stocks in this screen to be members of the IBD100 or CANSLIM list, which are considered companies with good growth prospects. There are many other company lists you can screen against including the S&P Five Star Stocks, Value Line Lists or you can create your own personal stock list to screen against using the ‘Create / Modify List’ function.
11

You can also select ‘No Lists’ from the Recommended List drop down menu. Selecting No Lists will allow you to screen across the entire universe of optionable stocks without any Company List restrictions. If you select No Lists, you may want to use the various fundamental and technical filters in the Parameter Field to limit your results to a manageable number (perhaps two dozen or less).
Once you have made your adjustments, simply click the Submit button to run your search and see your results. (Once you have run your search, you can click the Save button. This will allow you to name your new search criteria so you can always access it, or toggle between your new search and the default **Radioactive Search).
The Results Table
Once you run your search, you will see the potential trades that match your criteria:
The default data columns that are selected show the essential data for the Married Put position: Company Name, Stock Symbol, Last Stock Price and Change, Put Option Symbol, Expire / Strike and Days to Expiration, Put Option Ask Price, Open Interest, Net Debit (total cost of Stock + Put Ask), Maximum Risk (Net Debit – Put Strike Price), % Maximum Risk (Percentage of Risk for the Position) and % In-the-Money.
You can customize the Results Table to show the criteria that you would use to analyze the position or underlying security. Any of the criteria that you can filter by in the parameter field can be viewed in the Results Table. For example, if you adjusted the default criteria to show only those stocks that paid a 1% Dividend Yield or greater, you may wish to view the % Dividend Yield field in the Results Table. To do this, simply click ‘See More / Less Columns’ located just above the Results Table:
This will link you to a Configuration Page where you can select which columns you wish to view in the Results Table and also set the order in which you wish to view them.
12

Once you select the new order, click ‘Save and Return’. Your new columns will appear in the Results Table.
Once you have run your search and customized your screen, should you automatically place the trade that appears at the top of the results? Of course not, you want to further research the underlying stock to make sure there you are comfortable with the trading history and that there are no outstanding events that may be a problem in the future. The first column on the results table to the left of each trade is labeled ‘More Info’. The ‘More Info’ key will give you access to additional information about each of the stocks selections presented in the results table.
The ‘More Info’ button is basically a one-stop shop for everything you would need to know about a company.
• Broker Link – provides access to the order page of a Broker, if you want to place that trade. The Broker Link currently supports optionsXpress and BrokersXpress accounts.
• Stock Chart – Link directly to Big Charts or a 1-Year Snapshot. Make sure the stock is moving in your desired trend.
• Company Info – provides information on company specific news, earnings and events like splits or dividends, and a company profile, which highlights the companies business with financials. You always want to check the news to see if there are any outstanding patent lawsuits, CEO concerns, merger rumors, etc.
• Option Chain – to display the other strike prices and months of options available for this stock.
• Research – provides a display of fundamental and technical data or both the stock and this option.
13

• Calculators – allows you to calculate the returns, which may include commissions or other costs and access to a Black-Scholes model for calculating the theoretical value of an option.
• Search by Symbol – allow you to view the risk-reward for the other strike price combinations on that stock for the different expiration months.
• Add to Portfolio – allows easy insertion of the information to track your stock and option position over time until expiration of the option.
• Profit/Loss Chart – a graphic of this issue’s option and stock price on a profit/loss chart.
What have we done so far? We accessed our PowerOptions account and opened the Married Put tab. We went into the “Search” tool to access the patented SmartSearchXL tool on PowerOptions. We adjusted some of the criteria and in less than a second found only those positions that matched our criteria. We then customized the columns in the Results Table to match our specific needs. Now, we can access More Information to do further Research and Analysis. Here are our standard steps for further researching the results:
Step 1: Stock ChartYou can view the 1-year snapshot or link to Big Charts. On Big Charts, you can customize the chart to show a variety of various data (SMA’s, EMA’s, Bollinger Bands, MACD and many more). This allows you to make sure that the underlying stock is moving in your desired direction and has a strong and stable trend. We are not going to spend time discussing how to analyze a chart, as every investor has their own personal method of chart analysis.
Step 2: Company Info – NewsOnce you have determined that you like the current trend, you next want to review the latest headlines and news items just to make sure there are no hidden surprises or pending events that are not shown on the chart.
Step 3: Comparing Other Married Puts: You have found a stock, you like the trend and you did not recognize any pending news that would cause you concern. Now, even though the listed result matched your criteria you might want to look for other Married Put positions on that stock to compare the risk values for other strikes. You could link to the Option Chain to look at other available puts that you could purchase on your stock, but it is more convenient to link to the Search By Symbol tool.
14

As mentioned earlier, the “Search By Symbol” tool allows you search for potential positions in a given strategy one stock at a time to compare the risk vs. reward in a single expiration month or across all expiration months. You can access this tool directly from the Married Put tools if you are just look for opportunities on a given stock, or link to the “Search By Symbol” tool from the “Search” tool.
Let’s say we were considering the following TEVA position:
Buy 100 shares of TEVA @ $42.35 Buy 1 SEP 50 put @ $ 8.00Total Cost $51.52Guaranteed Price $50.00Total At Risk $ 1.52Total % At Risk 3.0%
If we wanted to compare the Married Put risk to the September 45 Strike or the September 55 Strike, we will simply select “Search By Symbol” from the More Info Menu using the blue button on the left hand side of each position.
Search By Symbol Results for TEVA:
We can now quickly compare the calculated maximum risk and % maximum risk for the other Married Put combinations for TEVA. For convenience, the option symbol for the position that we linked over from in the Search tool is highlighted in red.
The Search by Symbol tool shows us that if we purchased the SEP 55 put, we would have a much smaller risk of $0.92, or 1.7%, though we would be deeper ITM and have a higher Net Debit.
If we purchased the SEP 47.5 put option, we would have a higher maximum risk of $2.22, or 4.5% but our Net Debit would be lower. If we wished to compare protective put positions with a longer time frame, we can simply click ‘Put Option Expiration Month’ to see the calculated risks for TEVA Married Put positions for other months, including the LEAP expirations that may be up to 2 years out in time. Linking to the Search by Symbol tool will help us select just the right position that matches our risk threshold.
Step 4: Profit/Loss Chart
15

Now that we have analyzed the stock chart, reviewed the upcoming news and events, compared the Married Put potential trade to other combinations we now want to view the Profit/Loss Chart and run some ‘What-if’ Scenarios. From the More Information Menu, select Profit/Loss Chart.
We can now view a graphical interpretation of our potential position. The values for the Total Cost, Maximum Risk, Maximum Profit and % Maximum Risk are displayed at the top of the new window, and our graphical risk-reward chart appears at the bottom. The angled, hockey stick chart is our profit/loss at expiration. The curved line shows the theoretical return on the Married Put position at the Half Way point (in this example on June 19th).
Underneath the Profit/Loss Chart there is a field to Calculate Expected Profit/Loss. This allows us to run ‘What-if’ Scenarios for the position. If we wanted to know what the return might be if TEVA runs up to $48.00 per share on April 13th, we can will simply change the values and click calculate:
16
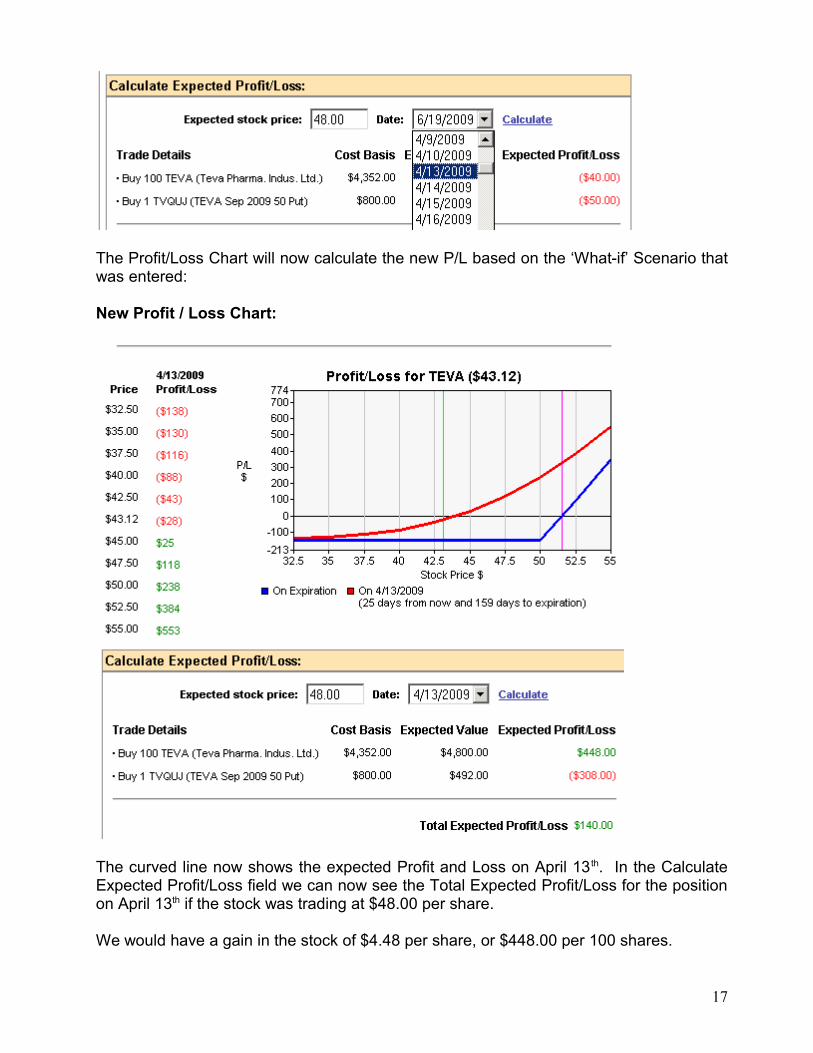
The Profit/Loss Chart will now calculate the new P/L based on the ‘What-if’ Scenario that was entered:
New Profit / Loss Chart:
The curved line now shows the expected Profit and Loss on April 13 th. In the Calculate Expected Profit/Loss field we can now see the Total Expected Profit/Loss for the position on April 13th if the stock was trading at $48.00 per share.
We would have a gain in the stock of $4.48 per share, or $448.00 per 100 shares.
17

The put option would have a loss of $3.08 per contract, or $308.00 after the stock moves up in price. This would result in a total theoretical gain of $140.00 if the stock is trading at $48.00 on April 13th. This value is not set in stone, however, as the calculated put value is based on the Black-Scholes pricing model.
Step 5: Trade Entry Now that we have researched the position, compared other trades and analyzed the ‘What-if’ scenarios, we are now ready to place and track the trade.
If you have an optionsXpress account or a BrokersXpress account, you can click ‘Broker Link’ from the More Information menu to link the trade directly to the trading account. You can select to either ‘Buy the Stock’ or ‘Buy the Put’. The symbols and prices will be transferred over to an entry page from PowerOptions. You can then adjust the order price or select to enter the trade as a limit order (recommended) or a market order. The entry page will also allow you to enter your position simultaneously into the PowerOptions Portfolio.
If you do not have an optionsXpress or BrokersXpress account, simply log on to your brokerage account and enter the Married Put trade. If you do not have a Broker Link to your broker you can manually insert the transaction into the Profit/Loss Portfolio.
Step 6: TrackingOnce you have entered the trade with your broker, go back to the PowerOptions search screen and select ‘Add to Portfolio’ from the More Information menu from your selected trade. The PowerOptions Portfolio tools are the most efficient and reliable tools to use to properly track and manage your RadioActive trades. We do the work for you…
When you first click ‘Add to Portfolio’ you will need to select if you want to create a new Portfolio to track the position or Insert the trade into an existing Portfolio.
If you are creating a new Portfolio, simply type in a name for the Portfolio and click ‘Insert’ at the bottom of the page. This will link you to the Portfolio entry field.
18
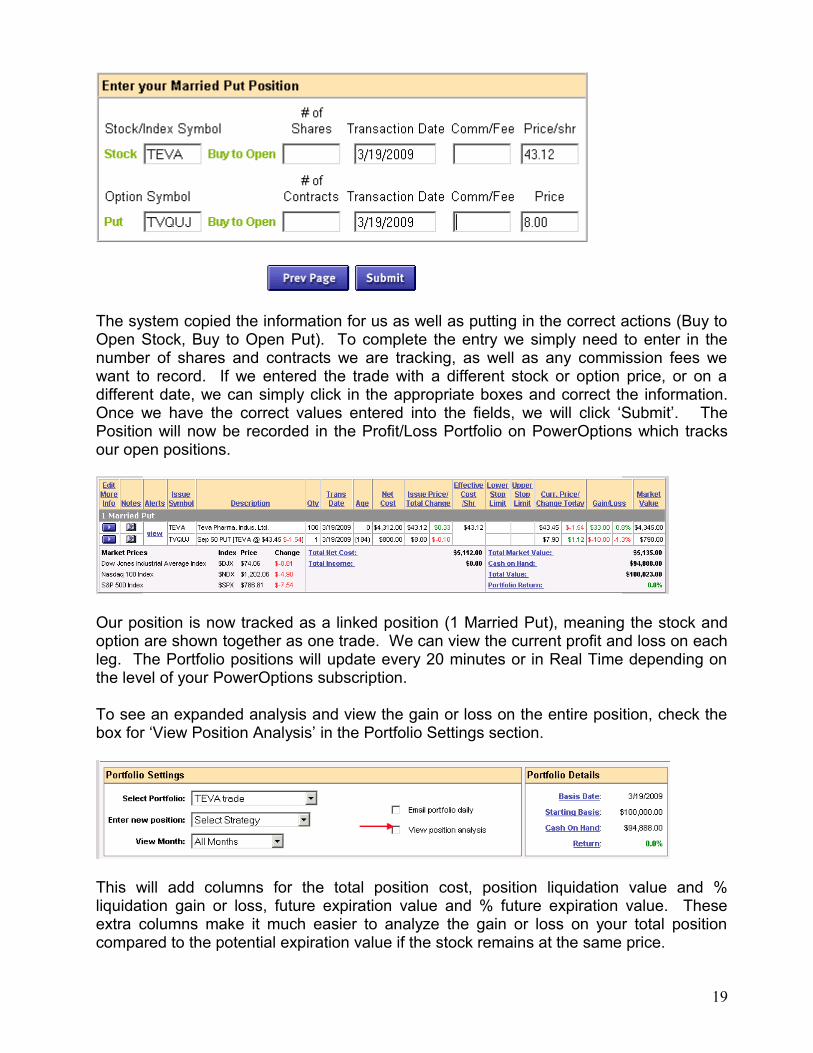
The system copied the information for us as well as putting in the correct actions (Buy to Open Stock, Buy to Open Put). To complete the entry we simply need to enter in the number of shares and contracts we are tracking, as well as any commission fees we want to record. If we entered the trade with a different stock or option price, or on a different date, we can simply click in the appropriate boxes and correct the information. Once we have the correct values entered into the fields, we will click ‘Submit’. The Position will now be recorded in the Profit/Loss Portfolio on PowerOptions which tracks our open positions.
Our position is now tracked as a linked position (1 Married Put), meaning the stock and option are shown together as one trade. We can view the current profit and loss on each leg. The Portfolio positions will update every 20 minutes or in Real Time depending on the level of your PowerOptions subscription.
To see an expanded analysis and view the gain or loss on the entire position, check the box for ‘View Position Analysis’ in the Portfolio Settings section.
This will add columns for the total position cost, position liquidation value and % liquidation gain or loss, future expiration value and % future expiration value. These extra columns make it much easier to analyze the gain or loss on your total position compared to the potential expiration value if the stock remains at the same price.
19

You can manually enter your existing trades into the Profit/Loss Portfolio tool by selecting the ‘Enter New Position’ drop down menu and selecting ‘Married Put’. The entry field previously shown will appear, but you will need to enter in the stock and option symbol, prices, trade date, commissions and your prices manually.
Once you have entered the trade into the Portfolio tool, you can make any adjustments to the position using the More Information button next to each leg of the trade. From the More Information menu in the Portfolio select ‘Position Actions’. You can then select to: Delete Leg, Delete Position, Close Leg, Close Position, Edit Position, Add Option Leg as well as other actions.
Simply select the action and the Portfolio tool will link you to the appropriate entry, exit or edit page to make your changes. Once you close a position or an individual leg, that information will be removed from the Profit/Loss Portfolio and recorded in the Historical Portfolio view. The gain or loss value will be taken into account in the overall portfolio value.
When trading RadioActively, you have the knowledge and ability to trade Nine different Income Methods against your RPM’s. You could spend hours going through option chains and calculating your new maximum risks by hand…or you can let PowerOptions do the work for you…quickly, easily and painlessly.
If you think it is time to apply an Income Method to your position, simply click the ‘More Information’ button next to your trade, select ‘Position Actions’ and then ‘Position Analysis’. This will link you to the Position Analysis page for your current position.
Position Analysis Page:The first part of the Position Analysis Page will break down your initial position values and where the position stands at the current moment to give you an overall view of the Married Put / RPM: (For this example we will look at the Advanced Auto Parts RPM recently selected in the Plain Vanilla Portfolio at RadioActive Trading).
20

Position Analysis Section 1: Position Overview
Position Analysis Section 2: Liquidation / Expiration Calculations
The next section breaks down the calculations for the Original Position Value, Current Liquidation Value and Liquidation Gain / Loss and the Future Expiration Value and Future Expiration Gain / Loss (based on if the stock is trading at the same price it is now at the Put option expiration date).
21

Position Analysis Section 3: Roll Out Opportunities
The most important function of the Position Analysis Page is the third section which shows the calculations for the RadioActive Roll Out Opportunities!
It is not our intent to recommend what specific income methods you should trade. What we have done is to calculate the potential alternatives based on income methods discussed in The Blueprint.
Some of the alternatives may at times seem in conflict. One suggestion may recommend moving the put in (moving it closer in time) while another may suggest moving the put out. Each roll may be valid depending on your expectations. It is important to apply the CEGA model to your individual position to assess which approach would be the most appropriate for your risk-reward tolerance.
22

Here we see potential Roll Out Opportunities for Income Method #1, Income Method #3 and Income Method #6 (the methods discussed in the free RadioActive Trading webinars). The new maximum risk, calculated returns and new probabilities (in the case of Income Method #1) are calculated for you. This will allow you to easily compare the Income Methods and decide which one might best suit your CEGA model for the existing RPM.
But, before you roll out to a potential Income Method, you will want to simulate the potential trade. Let’s take the Income Method #1 Roll Out Opportunity for Advance Auto Parts, selling the April 45 call against the RPM. To run the simulation and analyze the new risk-reward on your RPM when adding an Income Method, simply click the More Information button next to the Roll Out Opportunity and select ‘Simulate Trade’.
This will link us to the Position Comparison page where we can compare the initial RPM position to the new Profit/Loss values and chart if we add the income method.
23

Here we see our initial RPM position values on the left hand side (highlighted in red) and the simulated new RPM with the income method on the right hand side (highlighted in blue). Underneath the calculated values for the original RPM and the new position we can view the profit/loss charts for the two positions together, to better help us decide if this is the correct Income Method for us to apply to the RPM based on our CEGA model.
Once you have run your comparison and have decided that this is the Income Method you wish to apply to your initial RPM, simply use the ‘Add to Portfolio’ field below the comparison profit/loss charts to easily add the new Income Method to your open RPM:
24

Enter in any changes to the transaction date, your personal commission costs or the price and click ‘Submit Change to Portfolio’.
- OR -
You can also enter the new leg from the Position Analysis Page. Using the More Information button to the left of the Roll Out Opportunity you will be able to add the new Income Method onto your existing RPM with a simple click. For our Income Method #1 example, we will select ‘Make a Collar’ from the More Information button:
This will link us to an entry page for the new call option:
The option symbol and the number of contracts will be transferred over, as well as the Transaction Date. Select the proper action (for Income Method #1 we would select ‘Sell’) and input the premium you would have received for selling the call. Once you verify the information is correct, click ‘Submit’.
When we are linked back to the Profit / Loss
Portfolio we will see our Married Put positions plus one new Collar position on Advanced Auto Parts now that we have added Income Method #1.
25

As we continue to track the RPM’s in the Portfolio tool, we can make adjustments to each leg or to the entire position using the More Information buttons. Whenever one leg is closed or adjusted, the Portfolio tool’s total value will reflect the gain or loss from the position, and all closed transactions will be recorded in the Historical Portfolio tool.
If you currently own a stock position that is profitable, it is possible to create a married put position to guarantee some of that profit. Rather than take the risk of losing that gain to the vagaries of the market, it might be more prudent to lock in some of the gain and not give back those hard earned dollars. The first tool to be discussed uses put option insurance to lock in a defined profit. The position insurance tool on PowerOptions provides a means to assess the merits of different insurance positions using put options.
From the Married Put Quick Links or Tools pod, click Insurance
As an example, HPQ will be used with the following parameters submitted as data for:
• Stock Symbol for Hewlett Packard HPQ• Cost Basis / Share of $39.00 (cost basis for a profitable stock)• Buy Put Month of January 2009 (insurance for 204 days)
26

Position Insurance example for HPQThis shows a matrix of results for the creation of a married put for the HPQ stock position having experienced a profit. The column labeled “Locked In Profit” shows how much of the current profit can be locked in using of each put position considered. The resulting locked in profit is sorted from
highest to lowest. Even though the $40 strike has the lowest put premium, it sacrifices several points from the $44.28 current price and actually result in a slight loss if the stock were to decline substantially from these levels.
Writing a covered call against the stock position can enhance the locked in profit as shown above. Below, a covered call for the month of August has been added to each put insurance position and sorted by Locked In Profit. The use of a covered call with a protective put is called a Collar Strategy:
Creating a Collar from a married put option position:
Adding a covered call can enhance returns. The Aug. 08 call options were used because they were within 2 months of expiration. Since the protective put will not expire until Jan. 09, there will be several more opportunities to write calls against this position if the position is not called away. It should be noted you are seeking insurance because the stock has performed well and you want to lock in some of those profits, therefore, you should give the stock some room to continue this trend and choose a strike for the call that is OTM (at or higher than the purchased put strike price).
27

494 First State Blvd | Wilmington, DE 19804 | Tel: (302) 992-7971 | Fax: (302) 992-9859Printed In USA
PowerOptions® is a registered trademark of Power Financial Group, Inc.Patented Technologies
©2009 by Power Financial Group, Inc. – All Rights Reserved.Options involve risk and are not suitable for all investors.
28


