Page 1
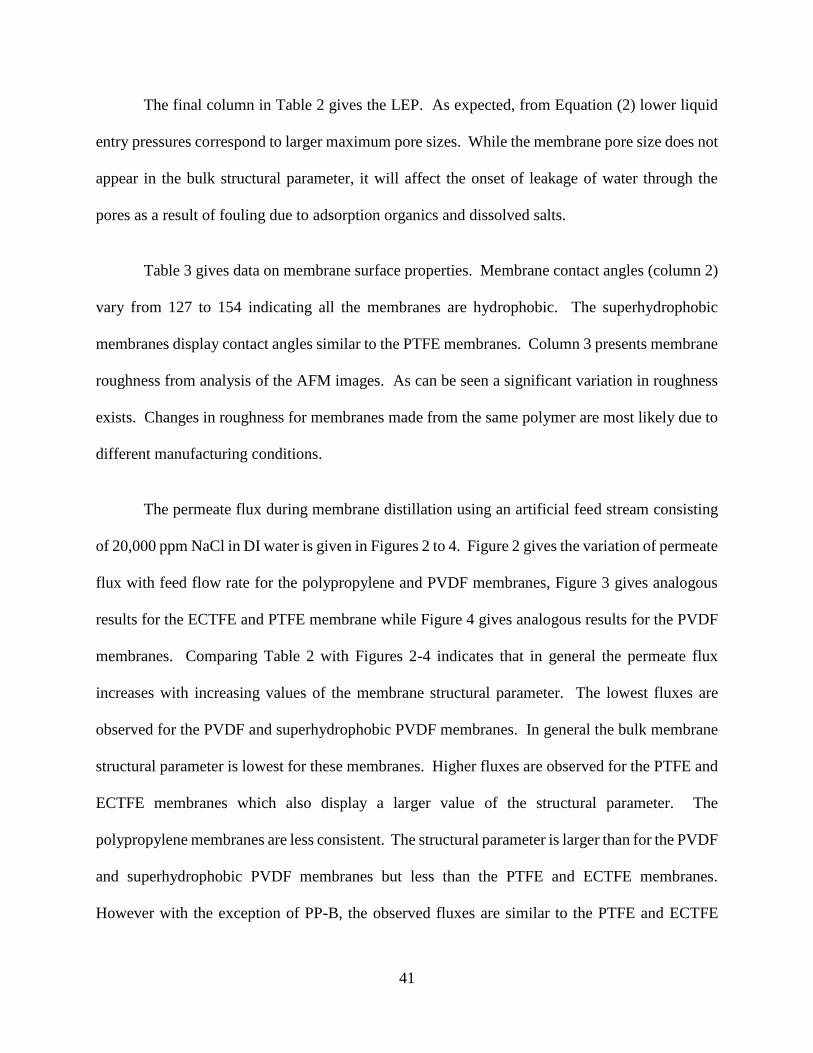
University of Arkansas, FayettevilleScholarWorks@UARK
Theses and Dissertations
8-2018
Membrane-based Separation Processes for TreatingHigh Salinity Produced WatersKamyar SardariUniversity of Arkansas, Fayetteville
Follow this and additional works at: http://scholarworks.uark.edu/etd
Part of the Membrane Science Commons
This Dissertation is brought to you for free and open access by ScholarWorks@UARK. It has been accepted for inclusion in Theses and Dissertations byan authorized administrator of ScholarWorks@UARK. For more information, please contact [email protected] , [email protected] .
Recommended CitationSardari, Kamyar, "Membrane-based Separation Processes for Treating High Salinity Produced Waters" (2018). Theses and Dissertations.2840.http://scholarworks.uark.edu/etd/2840
Page 2
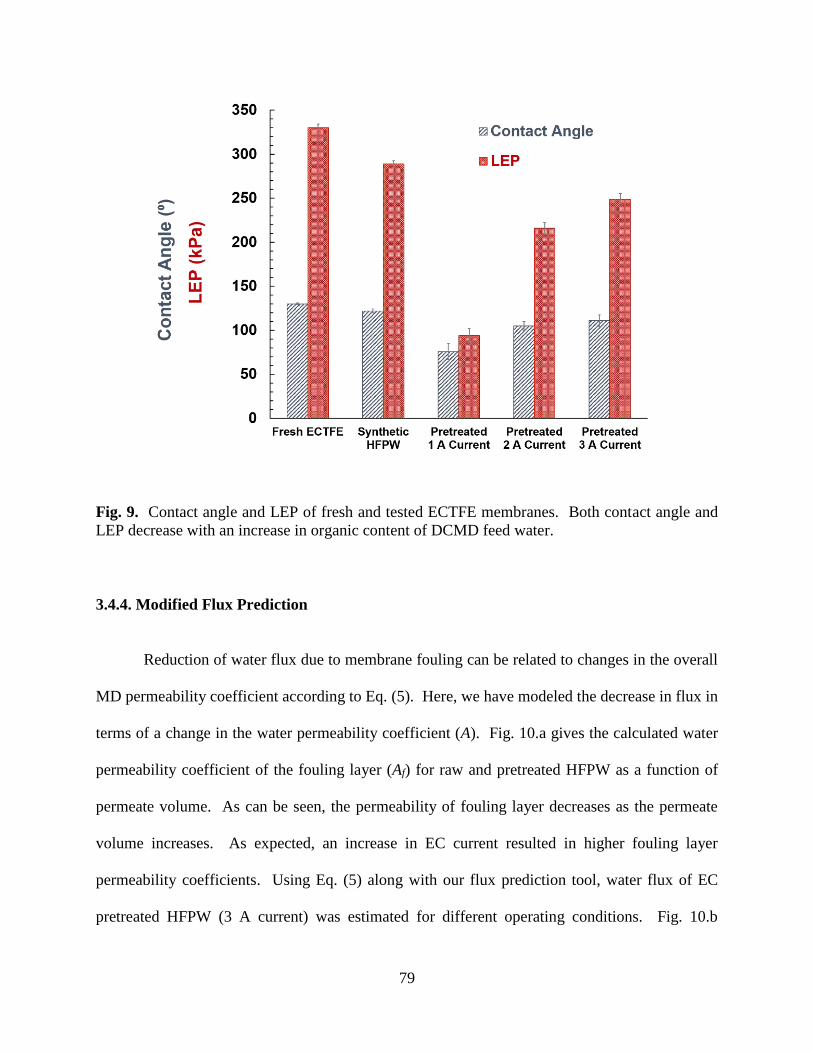
Membrane-based Separation Processes for Treating High Salinity Produced Waters
A dissertation submitted in partial fulfillment
of the requirements for the degree of
Doctor of Philosophy in Engineering with a concentration in Chemical Engineering
by
Kamyar Sardari
University of Tehran
Bachelor of Science in Chemical Engineering, 2014
August 2018
University of Arkansas
This dissertation is approved for recommendation to the Graduate Council.
S. Ranil Wickramasinghe, Ph.D.
Dissertation Director
David Ford, Ph.D.
Committee Member
Xianghong Qian, Ph.D.
Committee Member
Lauren Greenlee, Ph.D.
Committee Member
Wen Zhang, Ph.D.
Committee Member
Page 3
i
Abstract
Produced waters (PW) generated in the oil and gas industry within the United States often
contain extreme levels of total dissolved solids (TDS). These high TDS waste streams need to be
treated cost-effectively as the costs associated with the current management techniques can exceed
15 USD per barrel of discharged PW. Thermally and osmotically-driven membrane separation
technologies can show promising potential for treating high TDS waste streams, as onsite low-
grade waste heat may be used for their operation. In this dissertation, the application of membrane
distillation (MD), forward osmosis (FO) and a hybrid FO-MD process for treating synthetic and
actual high TDS PW is investigated. The aim is to maximize water recovery and minimize the
high TDS sludge volume.
A number of commercially available hydrophobic membranes with varying properties have
been extensively characterized and tested in a bench-scale MD system. A bulk membrane
structural parameter has been defined and used to identify membranes that display the highest
permeate fluxes. Then, the maximum achievable brine concentration for higher flux membranes
was determined. When treating actual PW feed streams, which contain not only high TDS, but
also dissolved organics, surfactants and low surface tension contaminants, pretreatment of the feed
is essential to suppress the onset of membrane fouling. In this study, the feasibility of
electrocoagulation (EC) followed by MD is investigated. EC was reported effective in mitigating
fouling during MD.
FO is another emerging membrane-based separation technology that could find niche
applications in the treatment of oil and gas PW. Here, the feasibility of treating hydraulic
fracturing PW using a combined EC-FO process has been investigated. EC is shown to be effective
Page 4
ii
for removing suspended solids and organic compounds which foul the membrane during FO. By
accounting for internal and external concentration polarization as well as fouling, the expected FO
flux may be determined. Finally, we have studied hybrid FO-MD system and shown that this
process integration can combine the advantages of both processes; low fouling tendency and high
quality permeate. The actual treatment used, EC-MD, EC-FO or EC-FO-MD will depend on the
quality of the PW.
Page 5
iii
Acknowledgements
First and foremost, I would like to express my sincere gratitude to my advisor Prof. Ranil
Wickramasinghe for the continuous support of my Ph.D. study and research, for his patience, trust
and immense knowledge. I appreciate all his contributions of time, ideas, and funding to make my
Ph.D. experience productive. I could not have imagined having a better advisor and mentor for
my Ph.D. study. I also would like to thank my committee members, Dr. Wen Zhang, Dr. Lauren
Greenlee, Dr. Xianghong Qian and Dr. Jamie Hestekin along with all other professors in the Ralph
E. Martin Department of Chemical Engineering for their advice and help along the way. In
addition, I need to thank all members of my research group for their help.
The membrane characterization studies discussed in this dissertation would not have been
possible without the high quality SEM and EDX analysis from the Arkansas Nano-Bio Materials
Characterization Facility. I have appreciated the collaboration from Dr. Mourad Benamara, Dr.
Liu and Dr. Sengupta for their help with the above-mentioned analysis. In addition, I would like
to thank Mr. Kamaz and Mr. Chaio for their help during membrane distillation and forward
osmosis experiments. Moreover, I would like to thank Dr. Vu for his help with AFM, contact
angle and FTIR measurements.
Raw and treated produced waters have been extensively characterized and discussed in this
dissertation. All these efforts could not have been possible without the help form Arkansas Water
Resources Center, University of Arkansas staff. In specific, my sincere acknowledgement goes to
Mr. Keith Trost and Ms. Jennifer Purtle for conducting the water analysis experiments and
preparing the reports. I would also like to thank Mr. George Fordyce for all his technical supports
in establishment of the experimental setups.
Page 6
iv
I gratefully acknowledge the funding sources that made my Ph.D. work possible. I was
funded by Southwestern Energy through the National Science Foundation Industry/University
Cooperative Research Center for Membrane Science, Engineering and Technology, the National
Science Foundation and the University of Arkansas. I also would like to appreciate the industrial
mentorship received from Mr. Peter Fyfe, Mrs. Dianne Lincicome, Mr. Derk Dehn, Mr. Uwe
Beuscher and Mr. John Askegaard.
Lastly, I would like to thank my family for all their love and encouragement. For my
parents who raised me with a love of life and for my brother Mazyar who supported me in all my
pursuits, and most of all for my loving, supportive, encouraging, and patient wife Negin whose
faithful support during this Ph.D. is so appreciated. Thank you.
Kamyar Sardari
Ralph E. Martin Department of Chemical Engineering
University of Arkansas
May 2018
Page 7
v
Dedication
To my father, who sacrificed his life for a better world
To my beloved mother, a strong soul who taught me to believe in hard work
To Mazyar, my brother and my best friend, for his unending support
and to Negin, the love of my life
Page 8
vi
Table of Content
Chapter 1. Introduction ............................................................................................................... 1
1.1. Membrane Separation ....................................................................................................... 4
1.2. Membrane Distillation ....................................................................................................... 5
1.2.1. Mass Transfer in Membrane Distillation ....................................................................... 7
1.2.2. Heat Transfer in Membrane Distillation ........................................................................ 9
1.3. Forward Osmosis.............................................................................................................. 11
1.3.1. Mass Transfer in Forward Osmosis ............................................................................. 13
1.4. Integrated Forward Osmosis-Membrane Distillation .................................................. 14
1.5. Membrane Fouling and Pretreatment............................................................................ 15
1.5.1. Electrocoagulation ....................................................................................................... 16
1.6. Research Objectives ......................................................................................................... 18
1.6.1. Membrane Distillation Studies .................................................................................... 18
1.6.2. Forward Osmosis Studies ............................................................................................ 19
1.6.3. Integrated Forward Osmosis-Membrane Distillation .................................................. 19
Symbols .................................................................................................................................... 20
References ................................................................................................................................ 21
Chapter 2. Selecting Membranes for Treating Hydraulic Fracturing Produced Waters by
Membrane Distillation ................................................................................................................ 26
Abstract .................................................................................................................................... 26
2.1. Introduction ...................................................................................................................... 26
Page 9
vii
2.2. Material and Methods ...................................................................................................... 30
2.2.1. Bulk Membrane Properties .......................................................................................... 30
2.2.1.1. Porosity ................................................................................................................. 31
2.2.1.2. Thickness .............................................................................................................. 32
2.2.1.3. Tortuosity .............................................................................................................. 32
2.2.1.4. Liquid Entry Pressure (LEP) ................................................................................. 33
2.2.2. Membrane Surface Properties ..................................................................................... 34
2.2.2.1. Contact Angle ....................................................................................................... 34
2.2.2.2. Atomic Force Microscopy (AFM) ........................................................................ 34
2.2.3. Direct Contact Membrane Distillation ........................................................................ 34
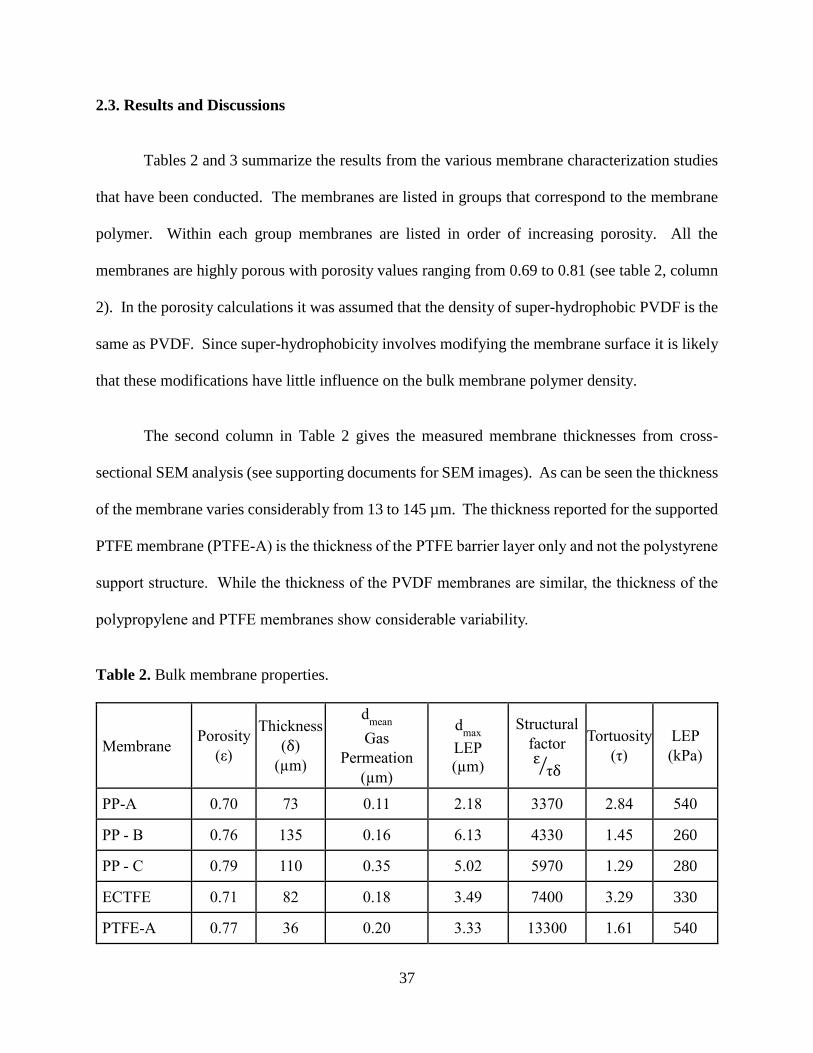
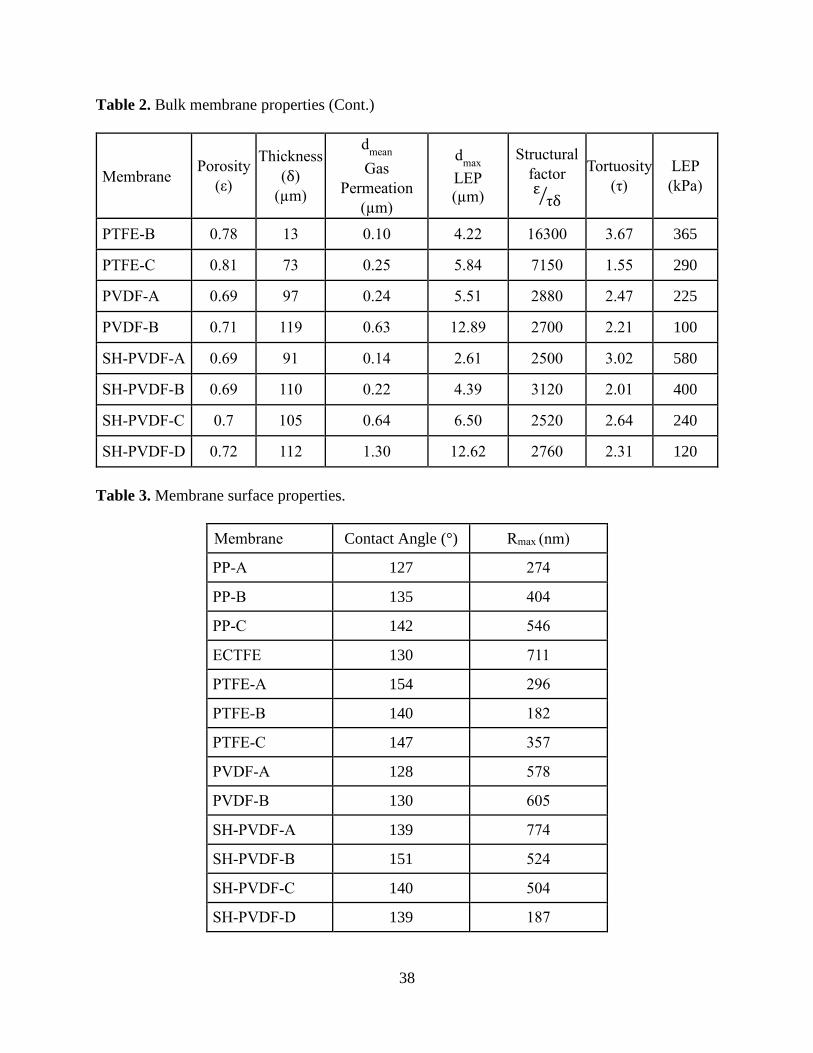
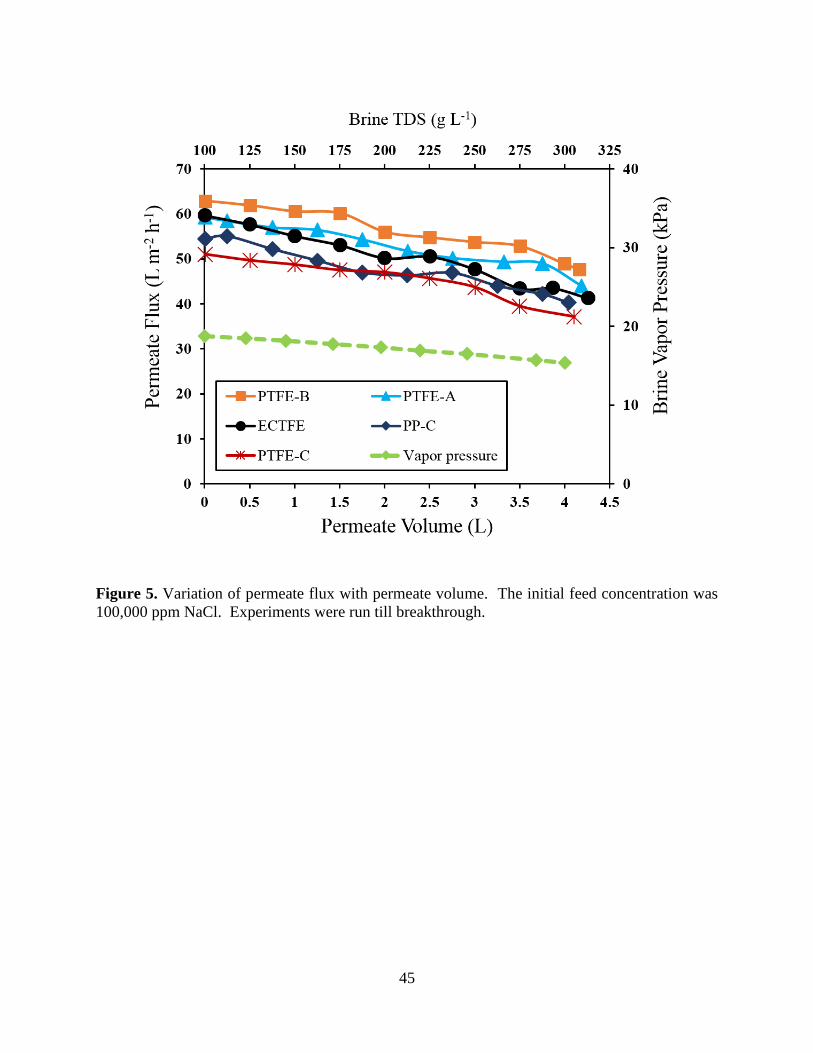
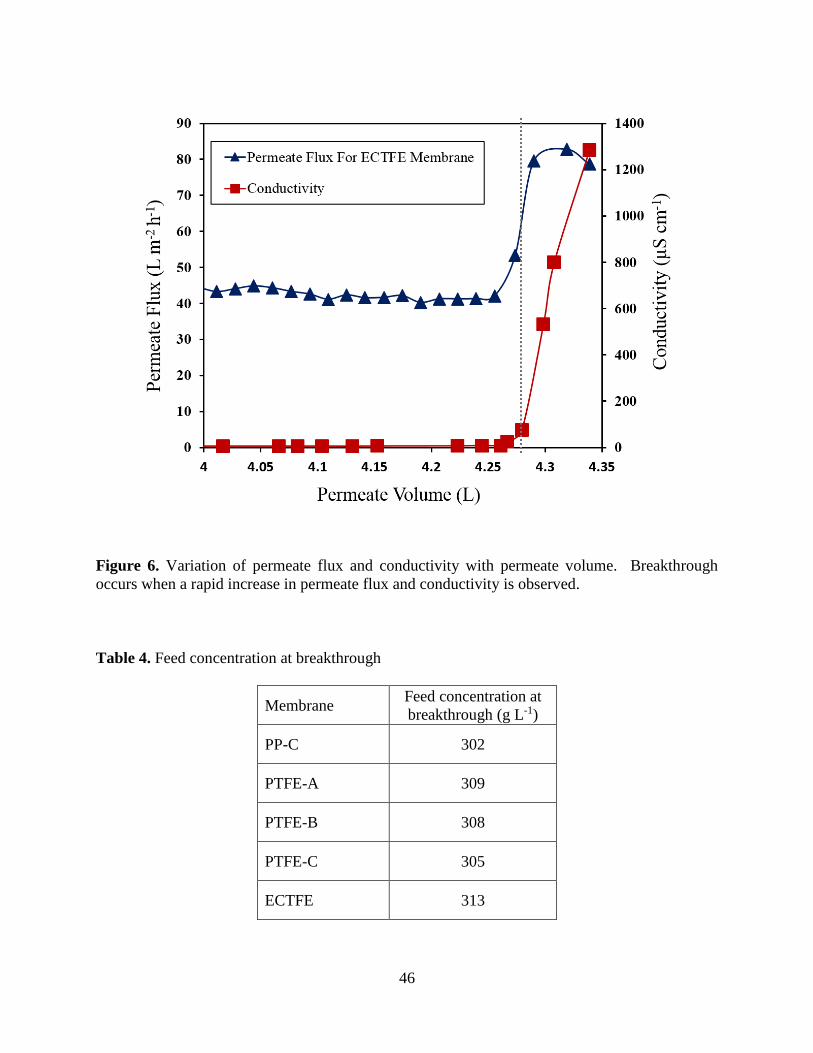
2.3. Results and Discussions ................................................................................................... 37
2.4. Conclusion ......................................................................................................................... 48
Acknowledgements .................................................................................................................. 49
References ................................................................................................................................ 49
Chapter 3. Combined Electrocoagulation and Membrane Distillation for Treating High
Salinity Produced Waters........................................................................................................... 53
Abstract .................................................................................................................................... 53
3.1. Introduction ...................................................................................................................... 53
3.2. Theory ............................................................................................................................... 57
3.2.1. Mass Transfer in MD ................................................................................................... 57
3.2.2. MD Flux Prediction ..................................................................................................... 59
3.2.3. EC ................................................................................................................................ 59
Page 10
viii
3.3. Materials and Methods .................................................................................................... 60
3.3.1. HFPW: Source and Characterization ........................................................................... 60
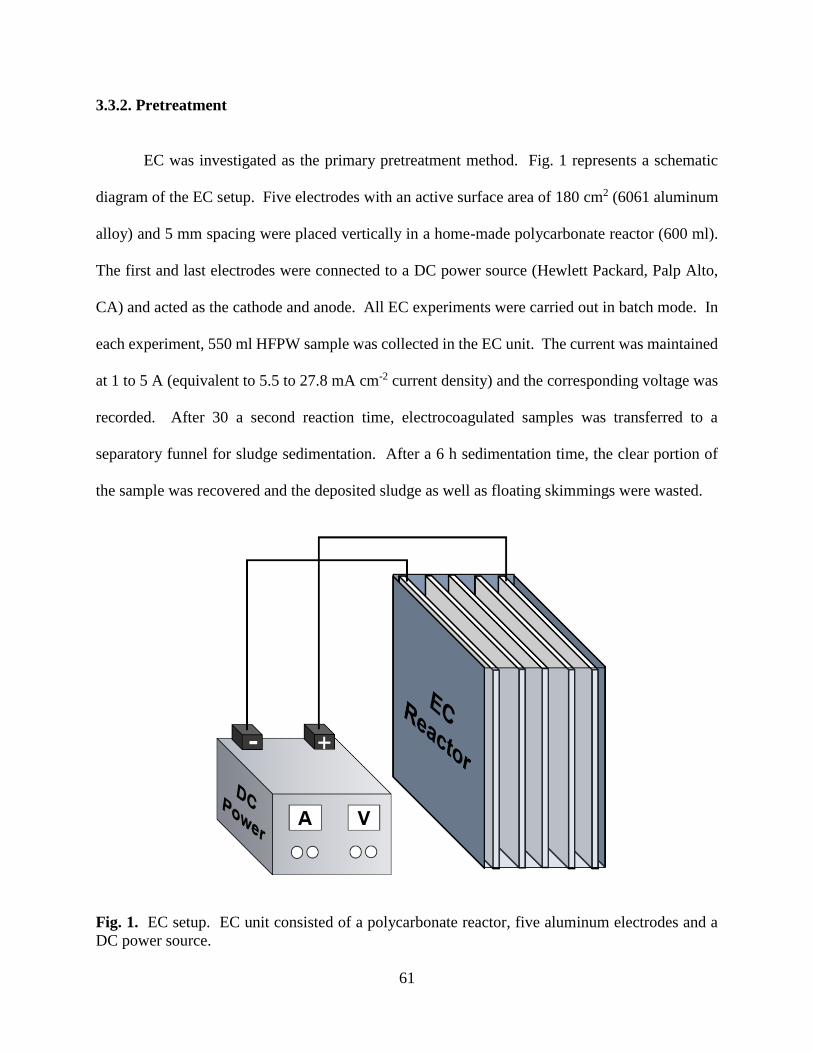
3.3.2. Pretreatment ................................................................................................................. 61
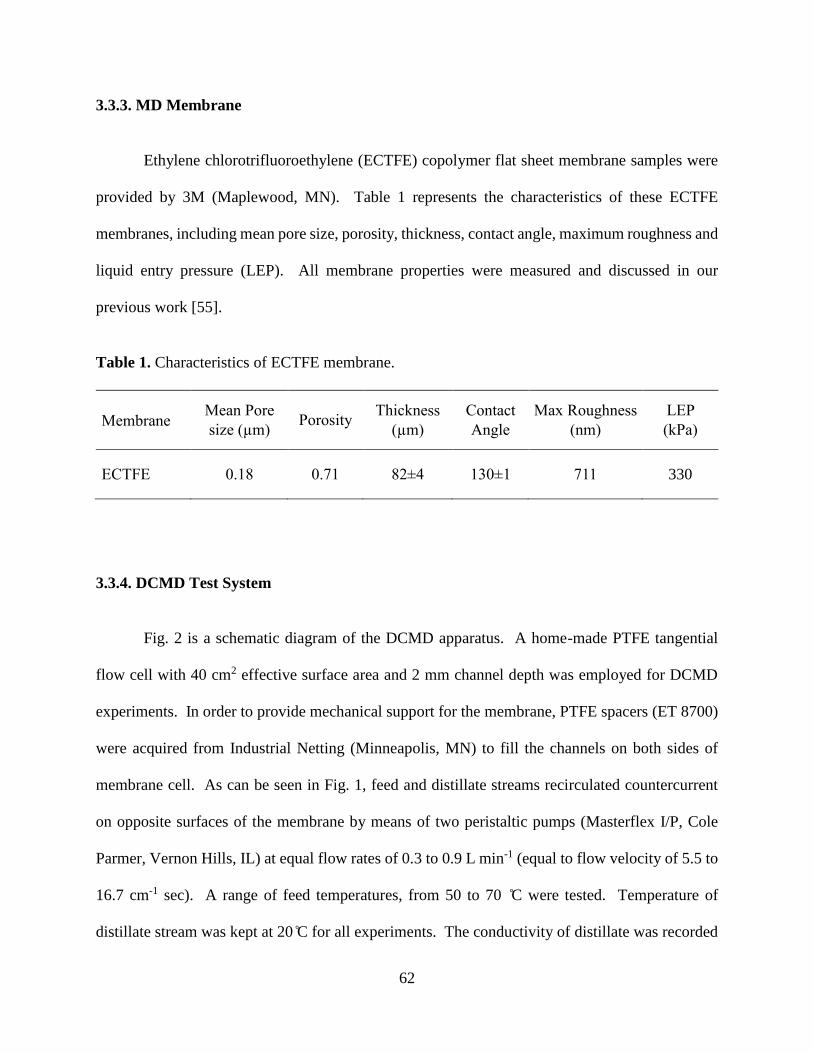
3.3.3. MD Membrane ............................................................................................................ 62
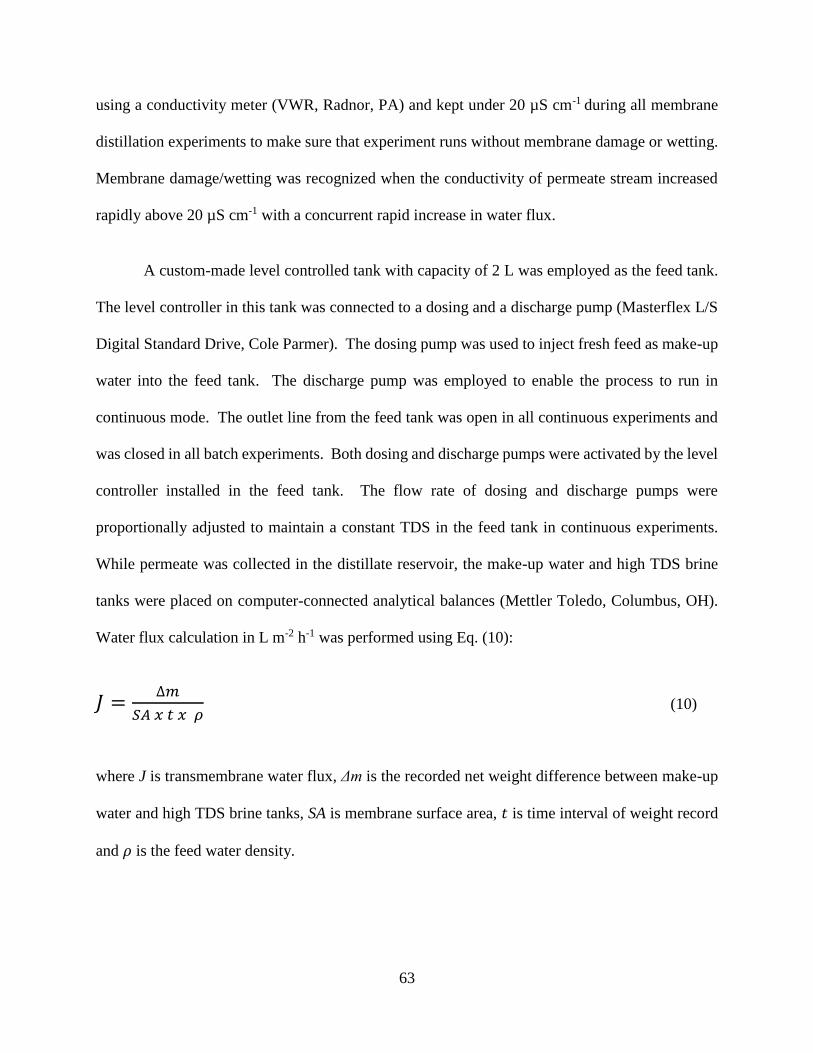
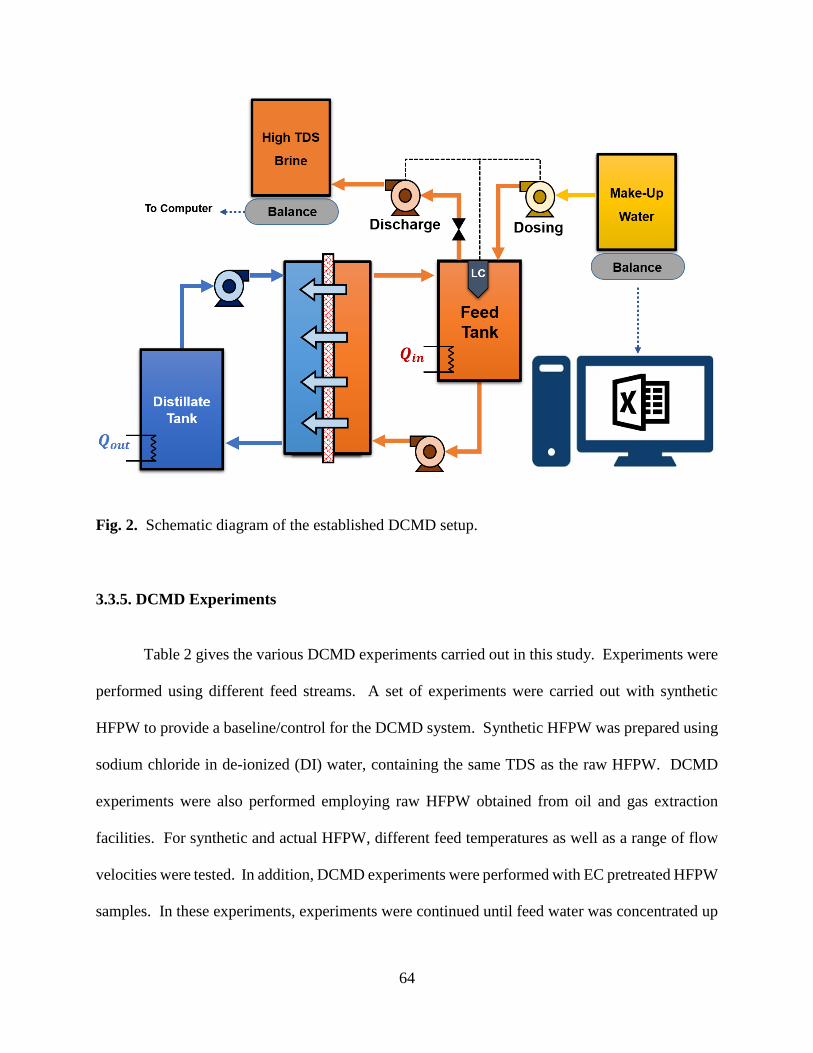
3.3.4. DCMD Test System..................................................................................................... 62
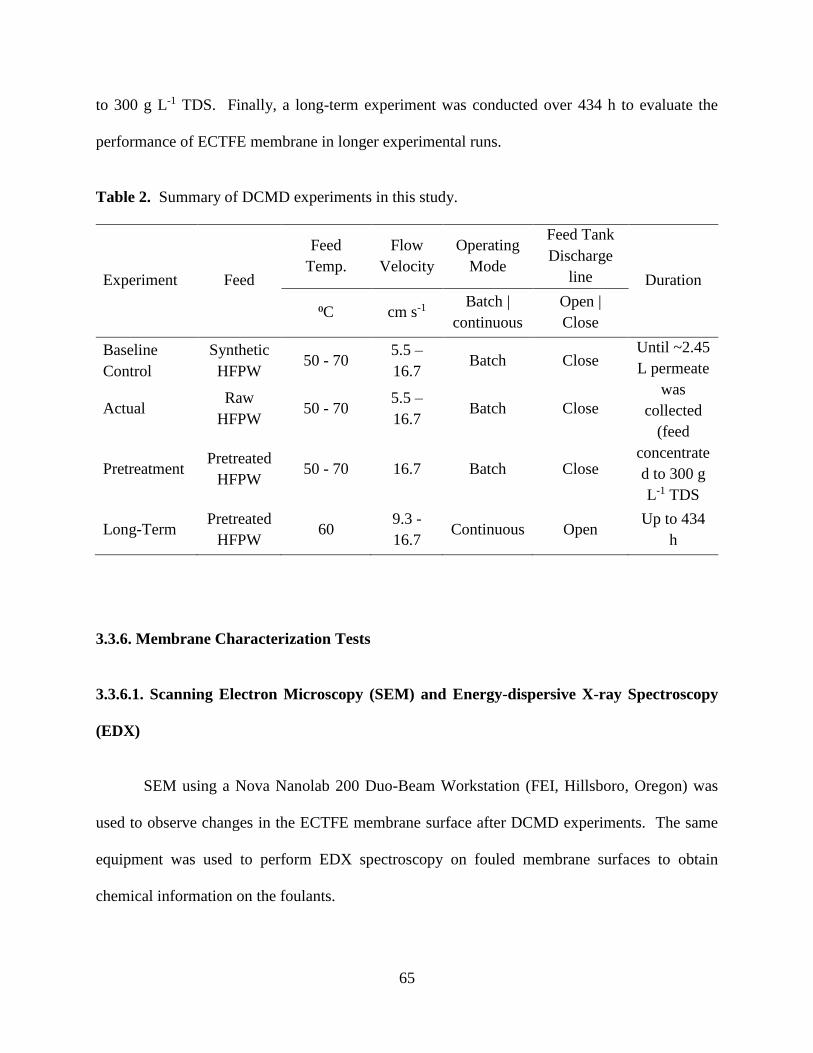
3.3.5. DCMD Experiments .................................................................................................... 64
3.3.6. Membrane Characterization Tests ............................................................................... 65
3.3.6.1. Scanning Electron Microscopy (SEM) and Energy-dispersive X-ray Spectroscopy
(EDX) ................................................................................................................................. 65
3.3.6.2. Contact Angle ....................................................................................................... 66
3.3.6.3. LEP ....................................................................................................................... 66
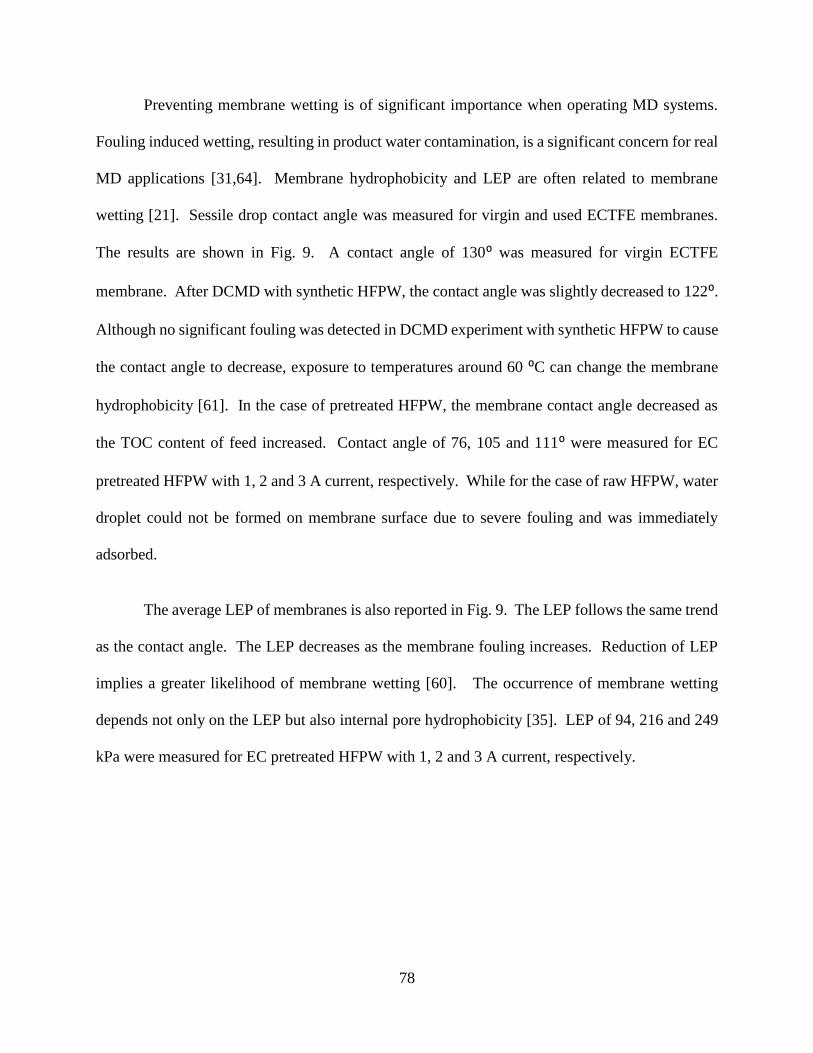
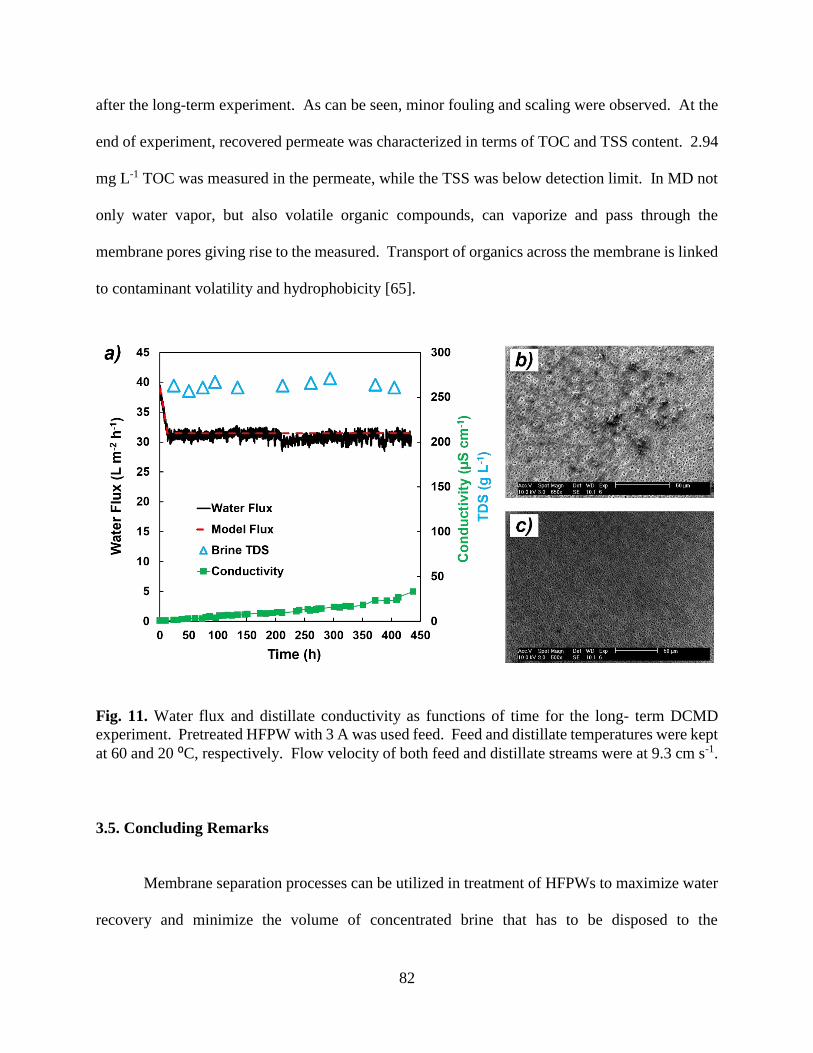
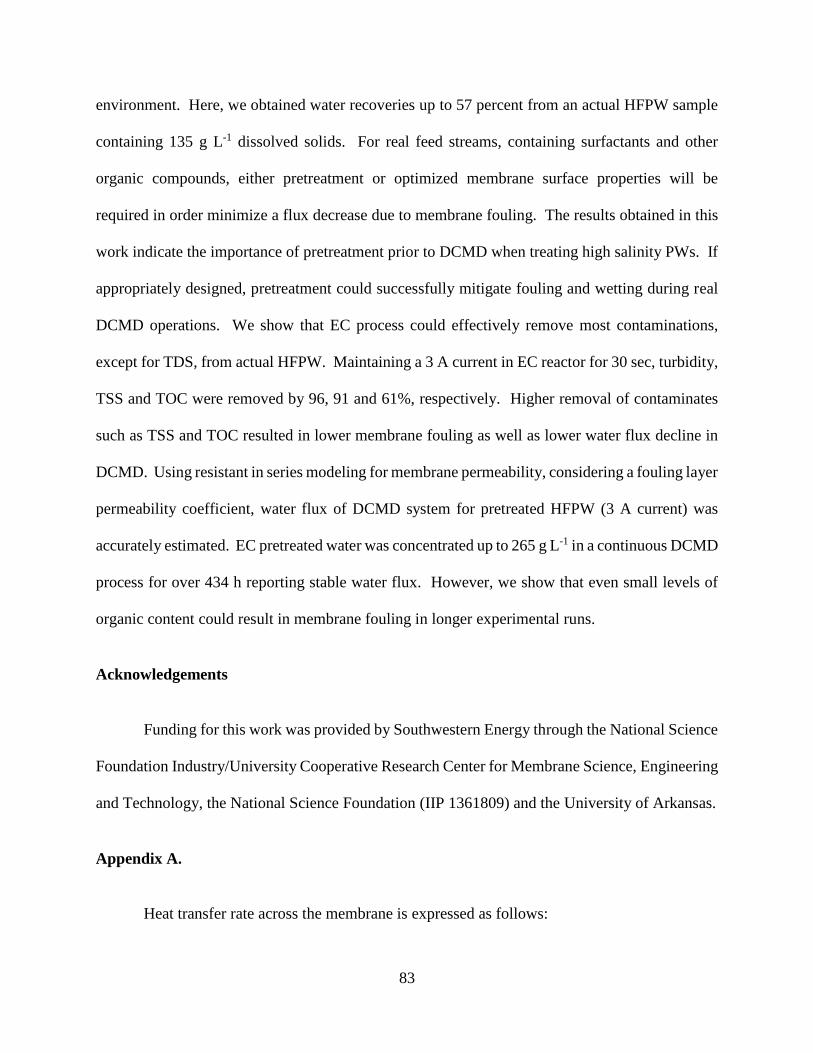
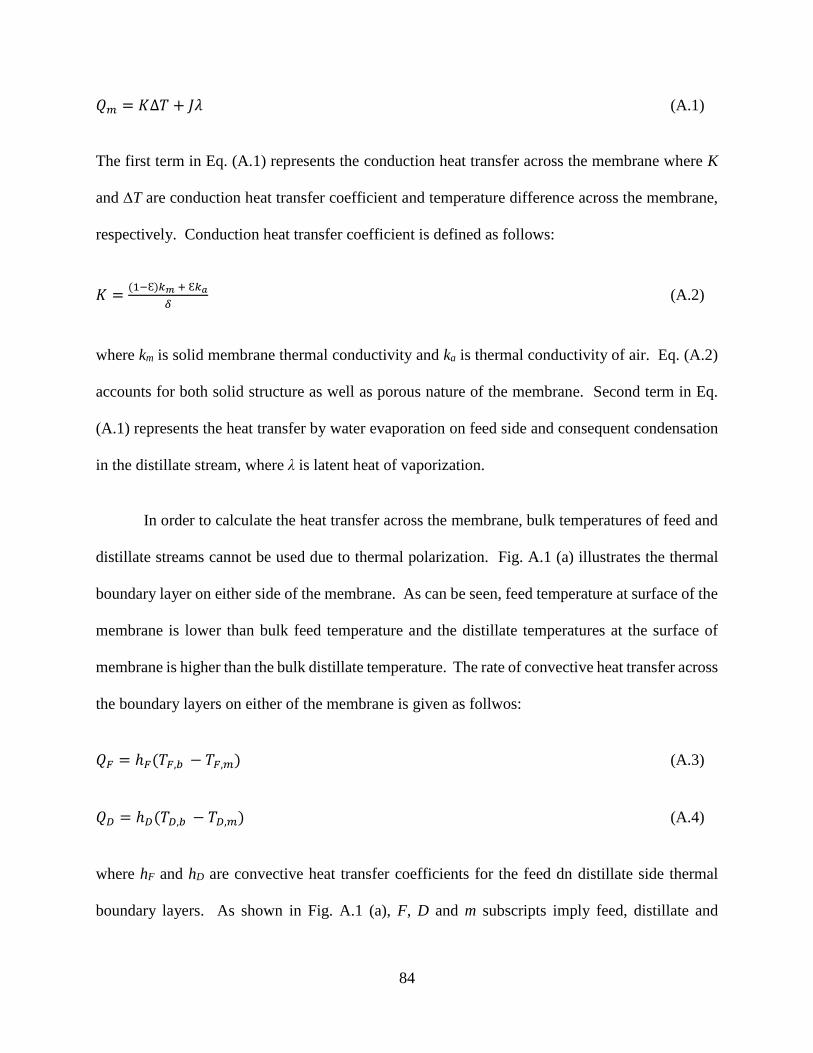
3.4. Results and Discussion ..................................................................................................... 66
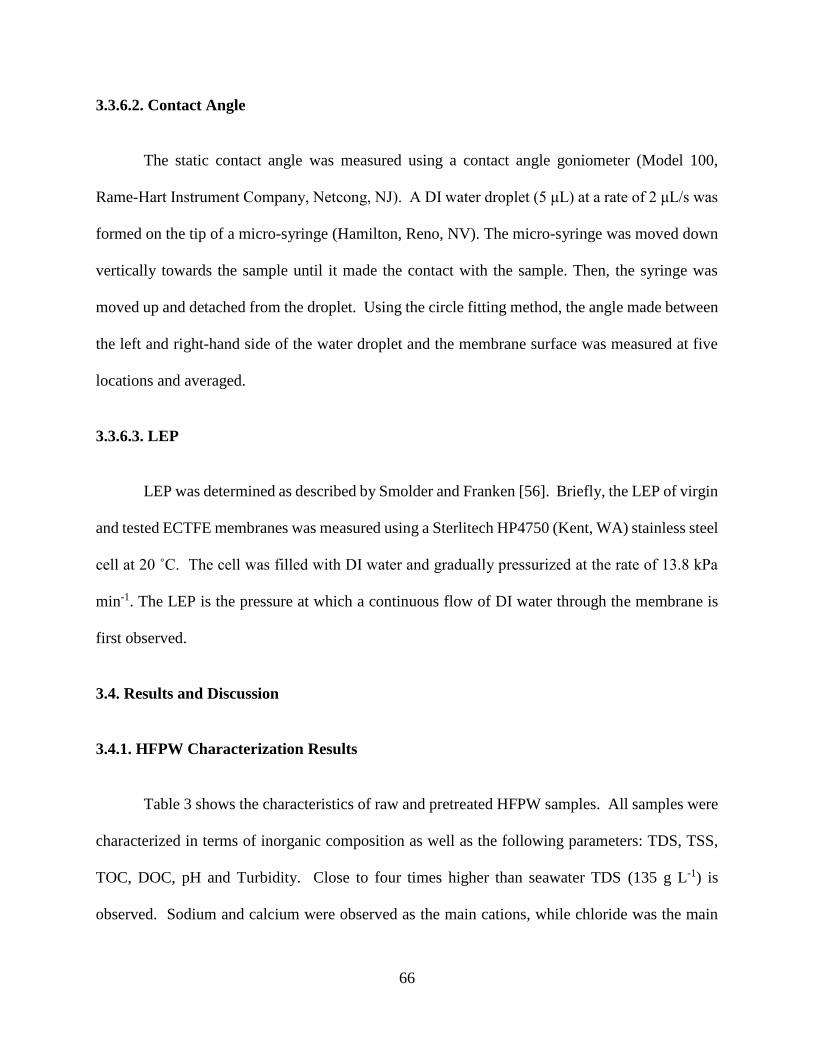
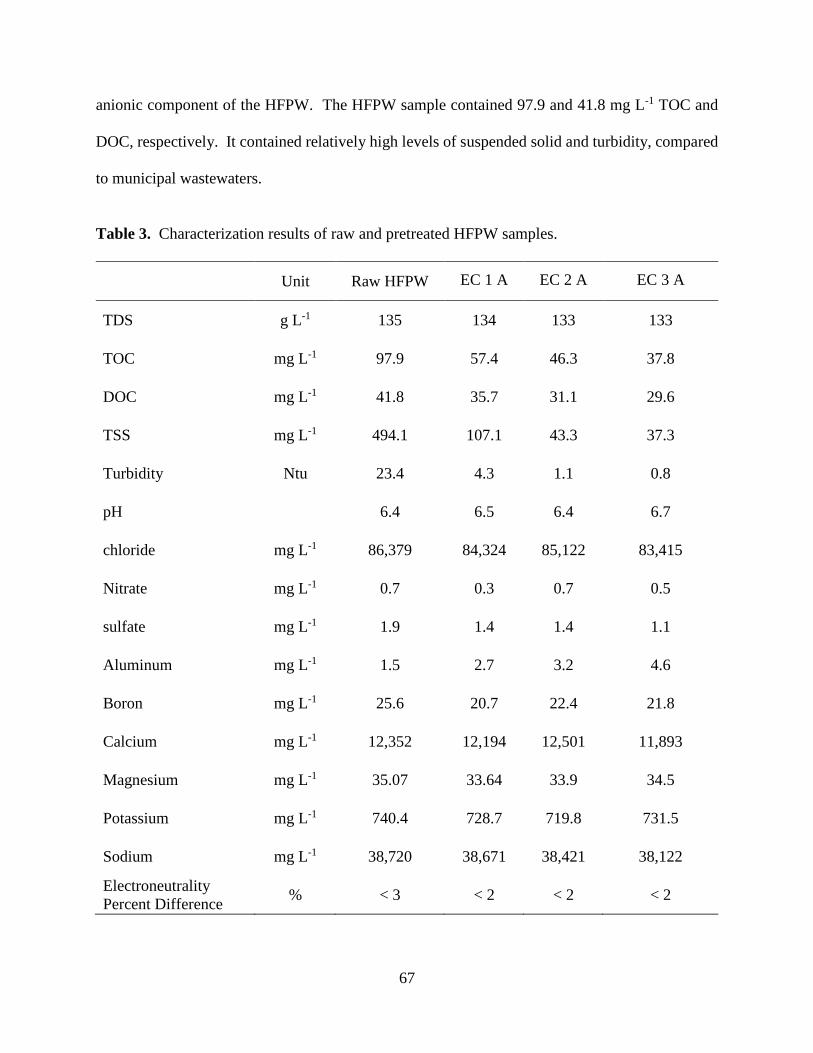
3.4.1. HFPW Characterization Results .................................................................................. 66
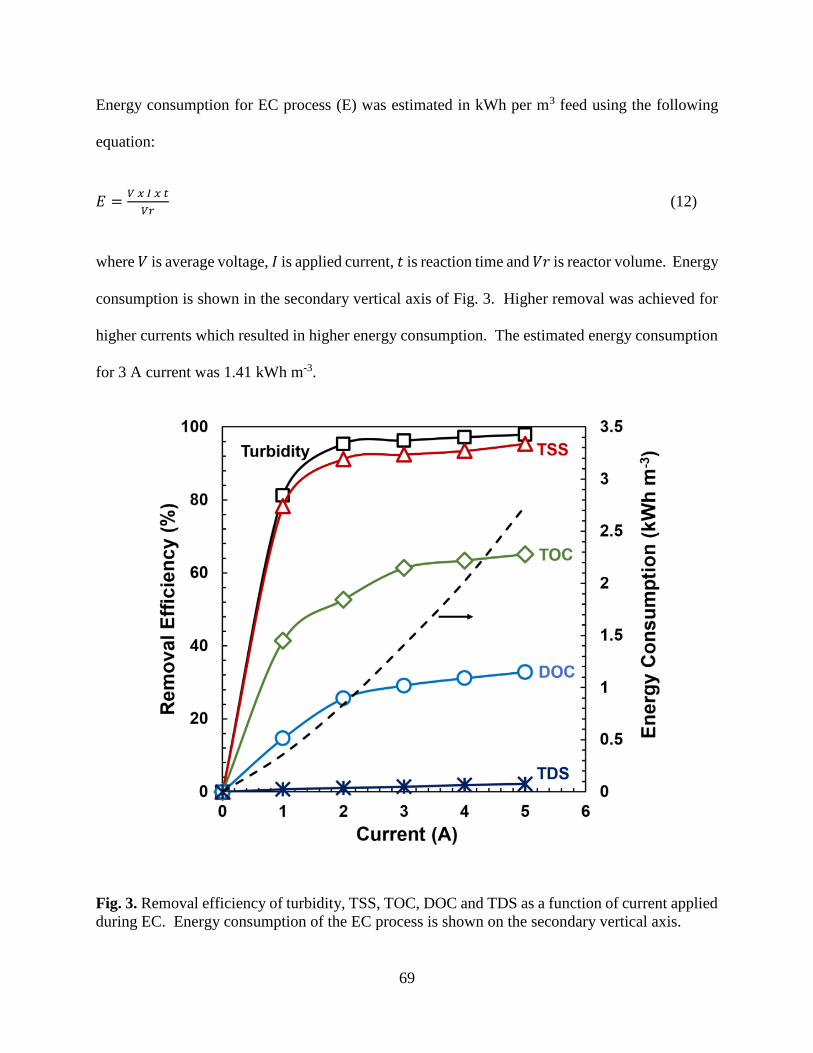
3.4.2. EC Pretreatment ........................................................................................................... 68
3.4.3. DCMD Results ............................................................................................................ 70
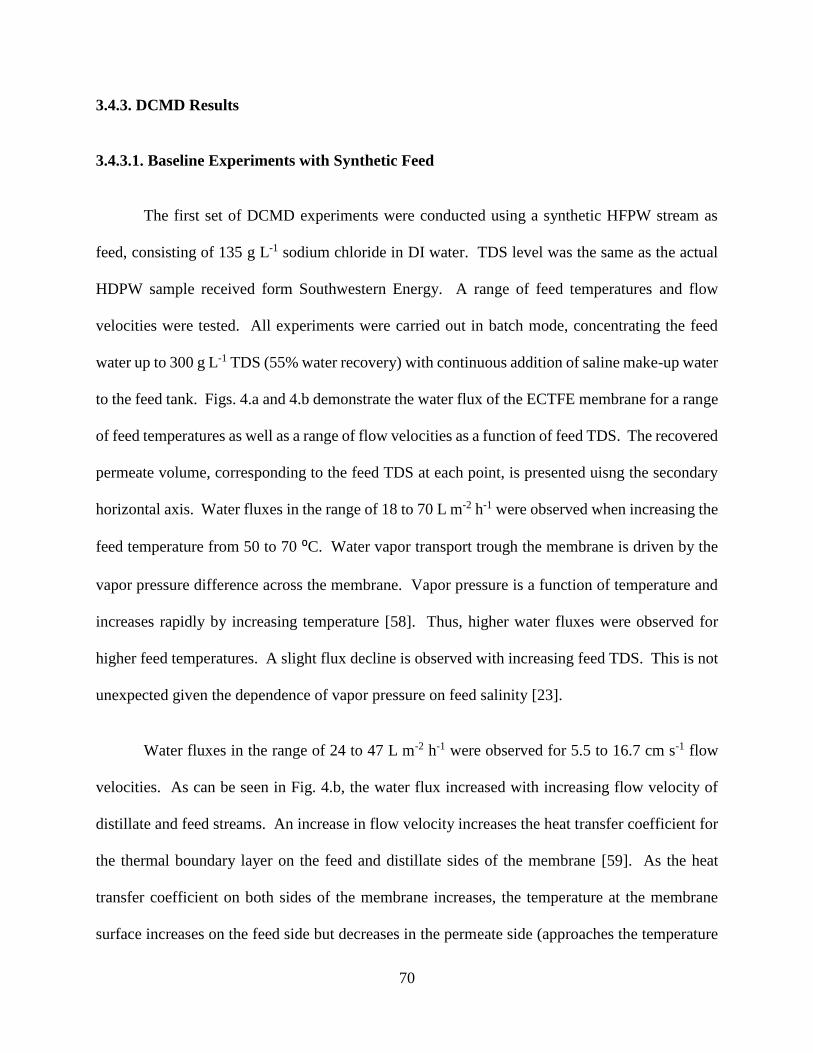
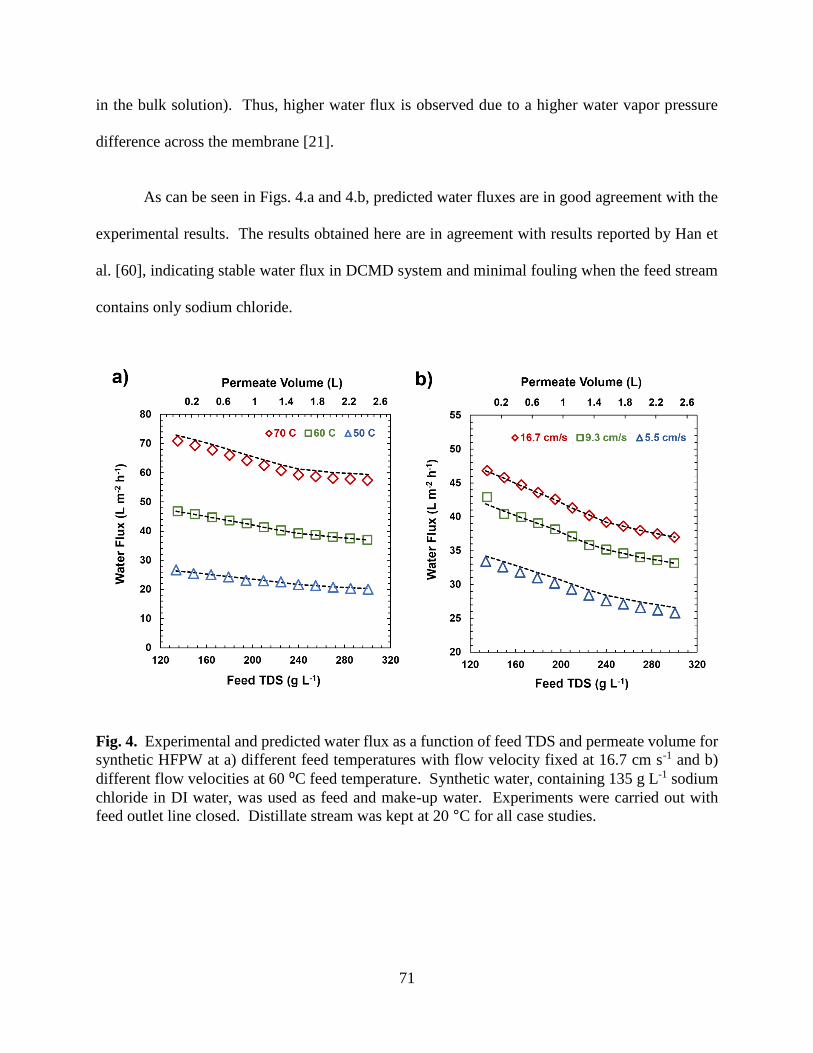
3.4.3.1. Baseline Experiments with Synthetic Feed........................................................... 70
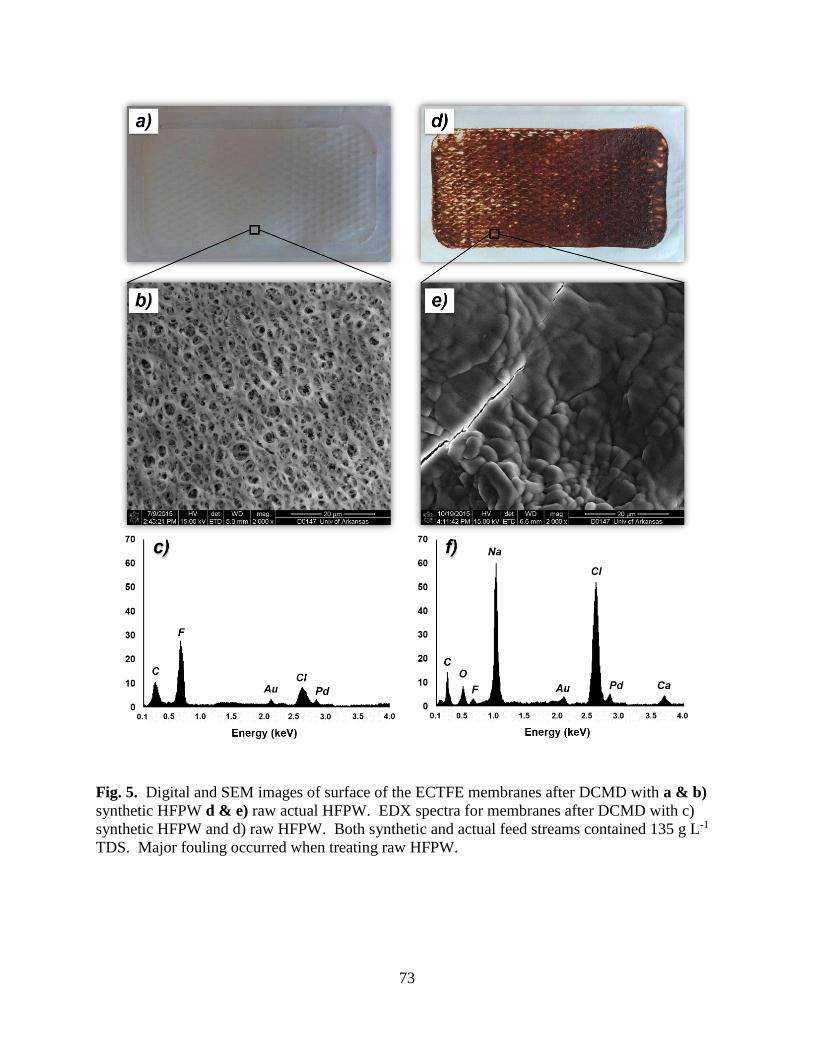
3.4.3.2. DCMD Experiments with Raw HFPW ................................................................. 74
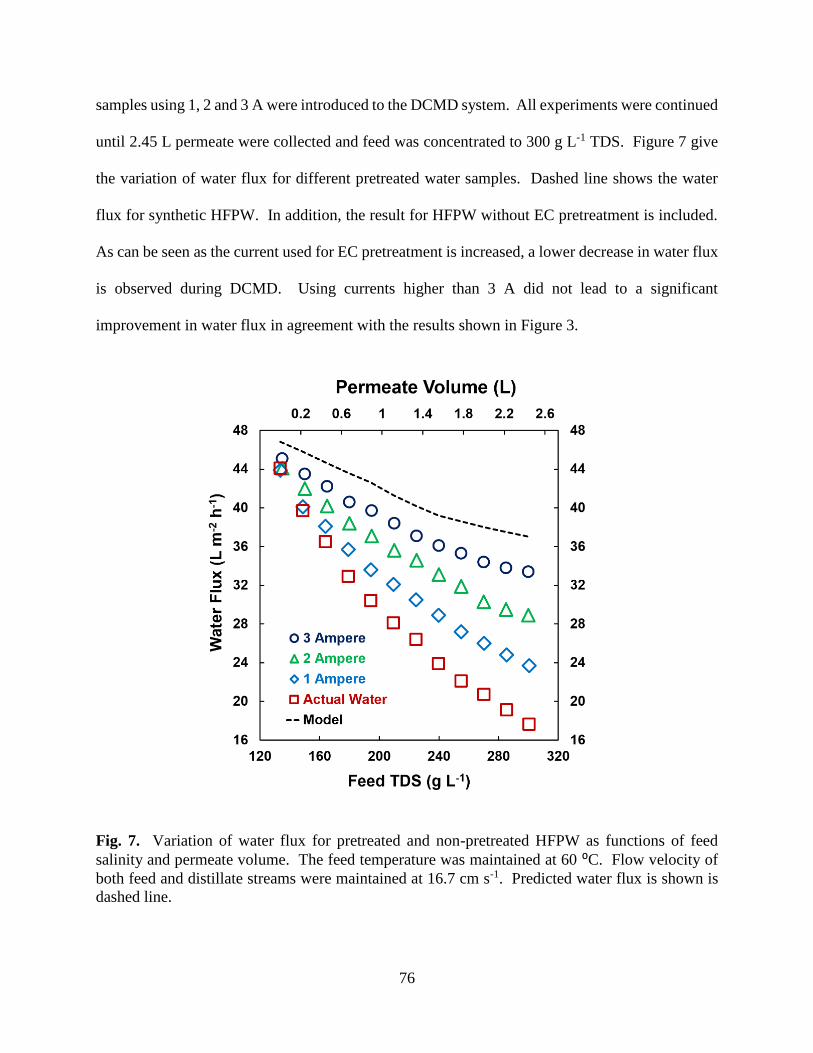
3.4.3.3. DCMD with EC Pretreated HFPW ....................................................................... 75
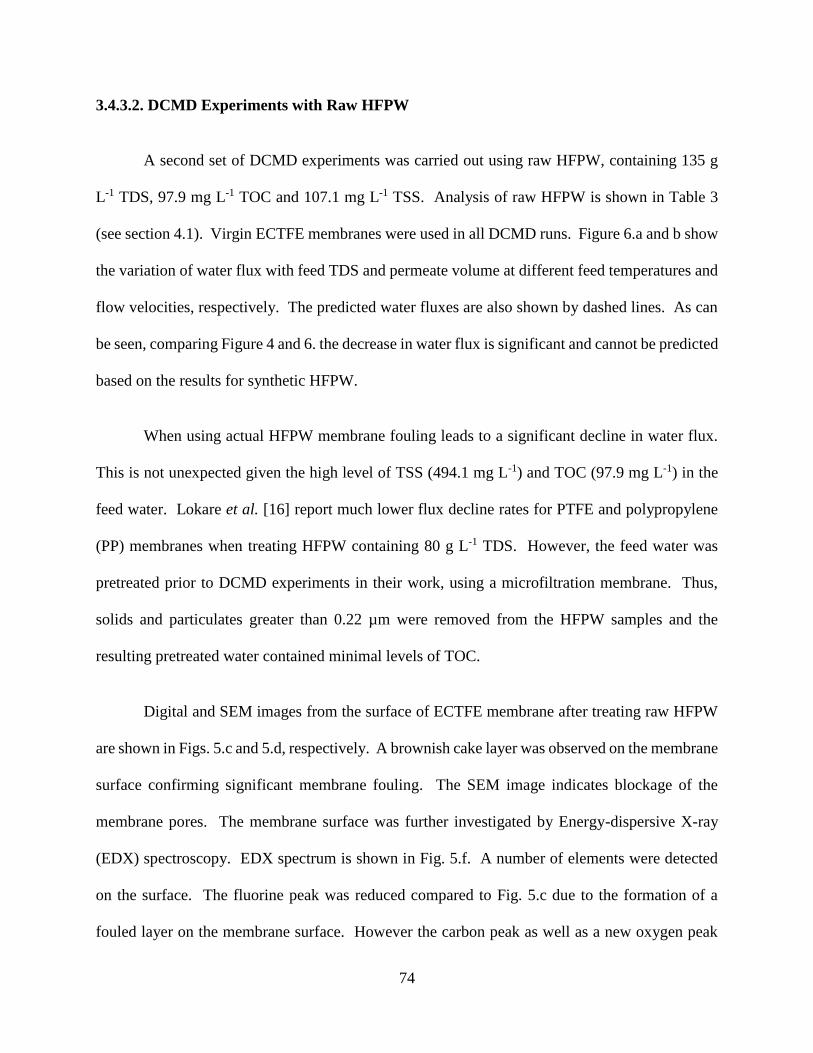
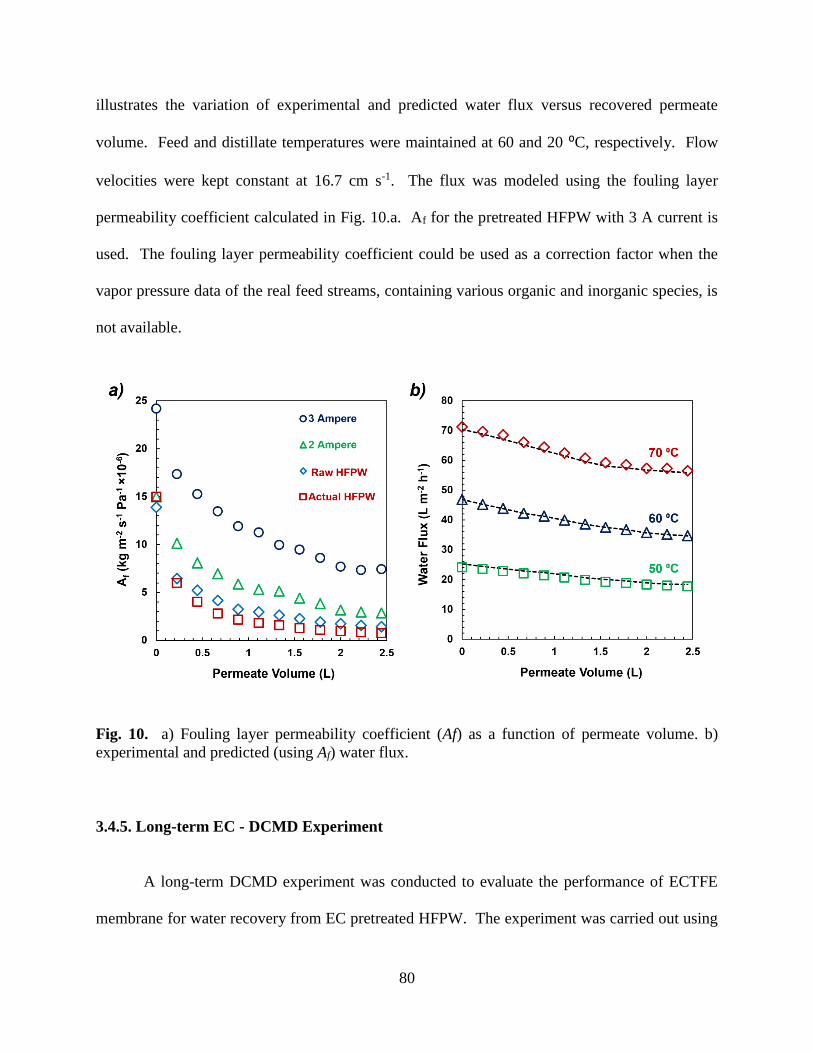
3.4.4. Modified Flux Prediction............................................................................................. 79
3.4.5. Long-term EC - DCMD Experiment ........................................................................... 80
3.5. Concluding Remarks ....................................................................................................... 82
Acknowledgements .................................................................................................................. 83
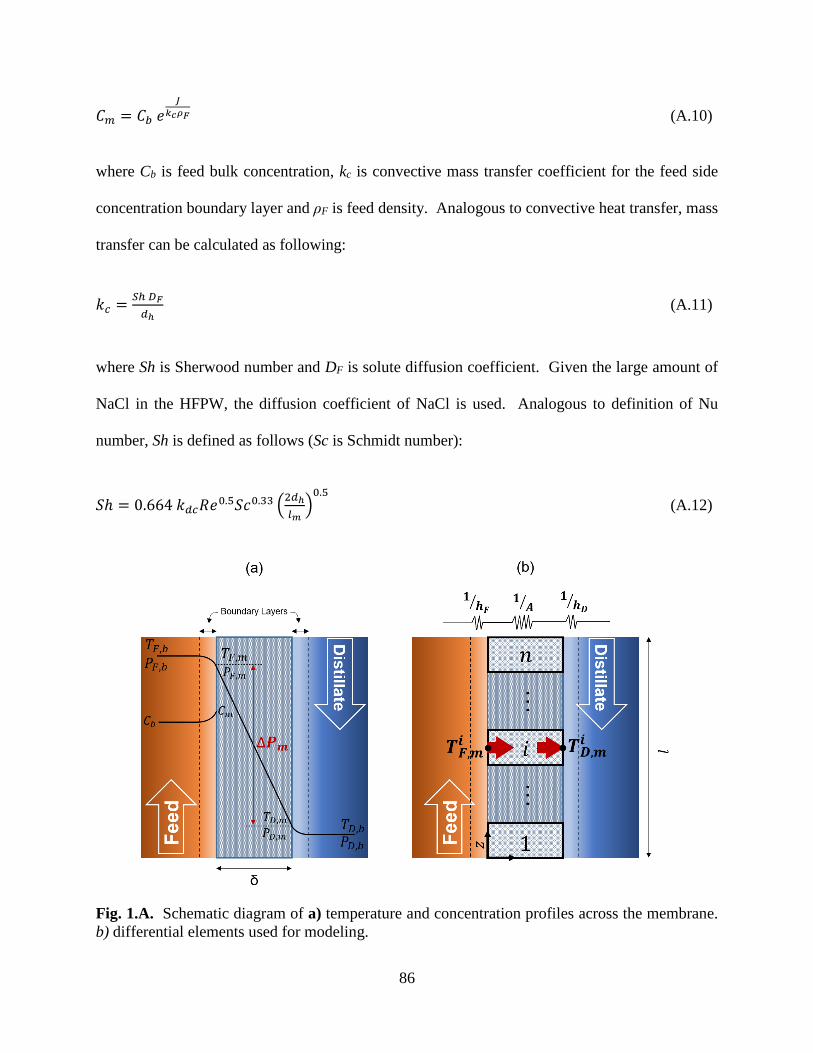
Appendix A. ............................................................................................................................. 83
Page 11
ix
References ................................................................................................................................ 90
Chapter 4. Aluminum Electrocoagulation Followed by Forward Osmosis for Treating
Hydraulic Fracturing Produced Waters ................................................................................... 96
Abstract .................................................................................................................................... 96
4.1. Introduction ...................................................................................................................... 96
4.2. Theory ............................................................................................................................. 100
4.2.1. Mass Transfer in FO System ..................................................................................... 100
4.2.2. EC .............................................................................................................................. 106
4.3. Experimental................................................................................................................... 107
4.3.1. Produced Water ......................................................................................................... 107
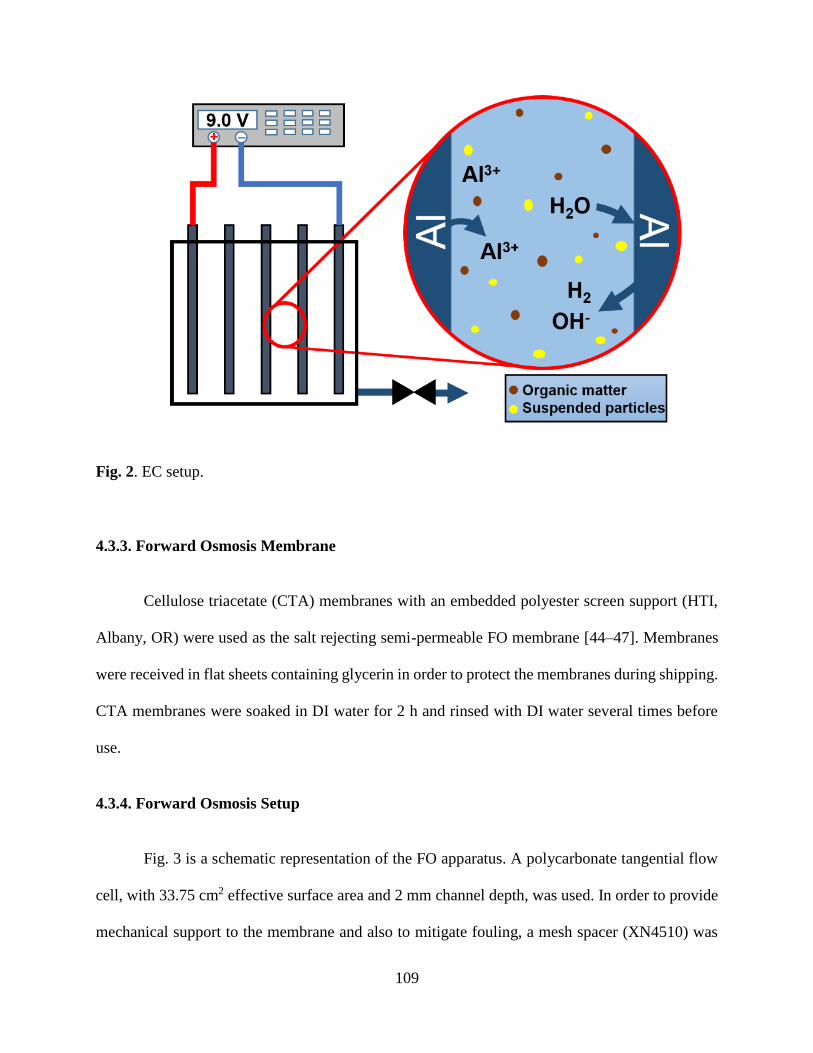
4.3.2. EC .............................................................................................................................. 108
4.3.3. Forward Osmosis Membrane ..................................................................................... 109
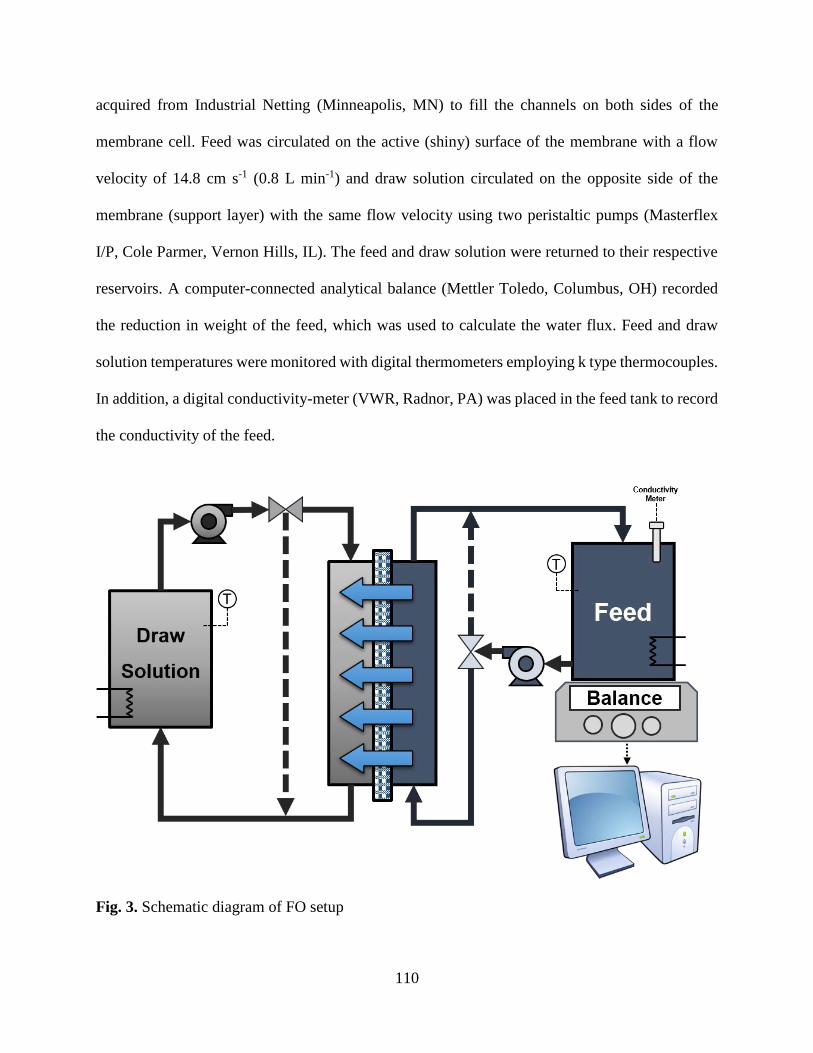
4.3.4. Forward Osmosis Setup ............................................................................................. 109
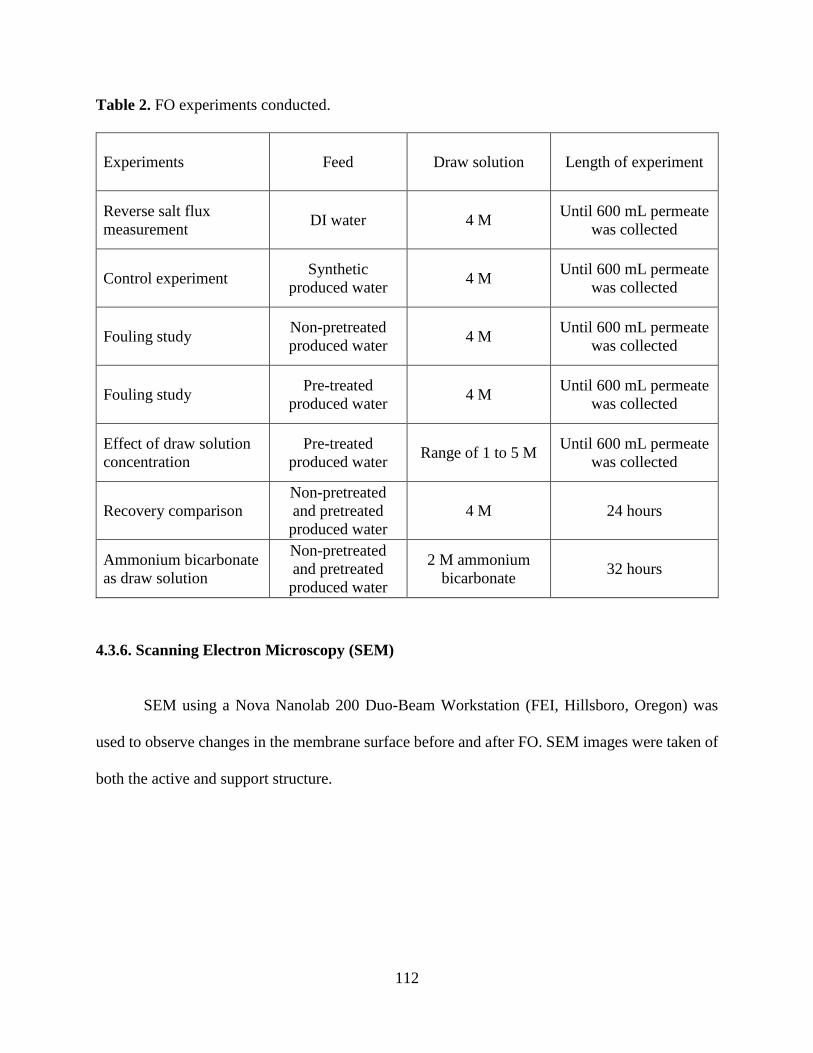
4.3.5. FO Experiments ......................................................................................................... 111
4.3.6. Scanning Electron Microscopy (SEM) ...................................................................... 112
4.4. Results and Discussion ................................................................................................... 113
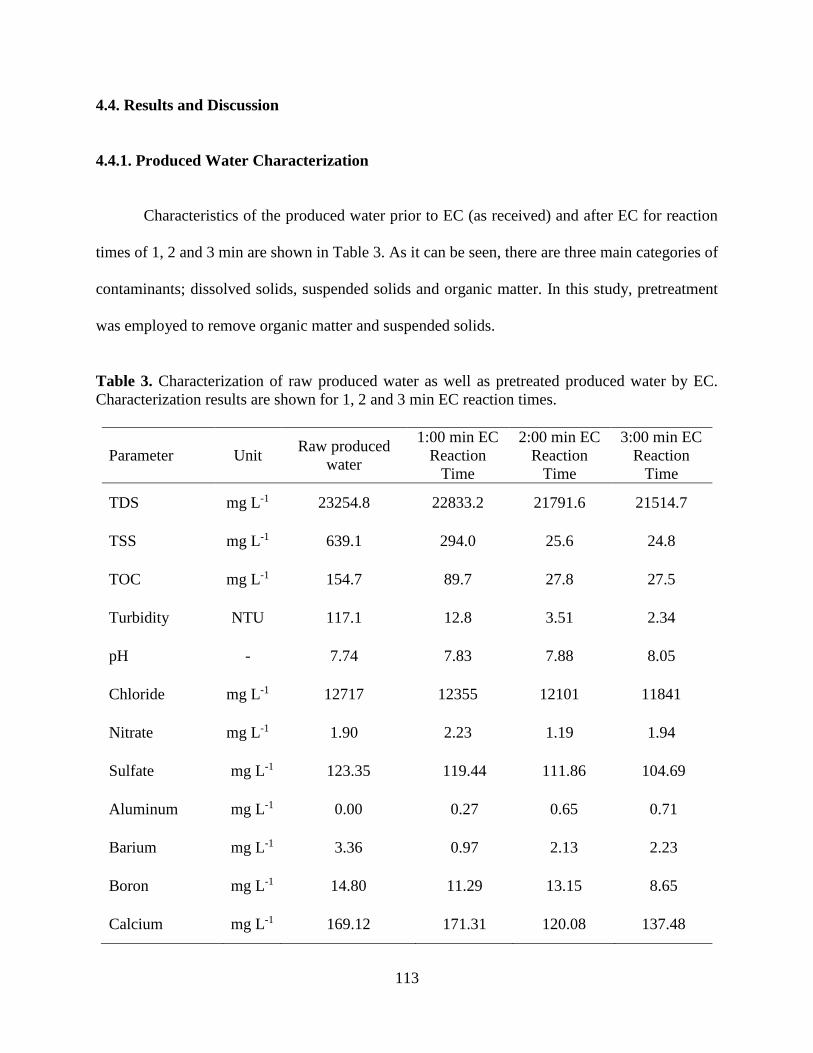
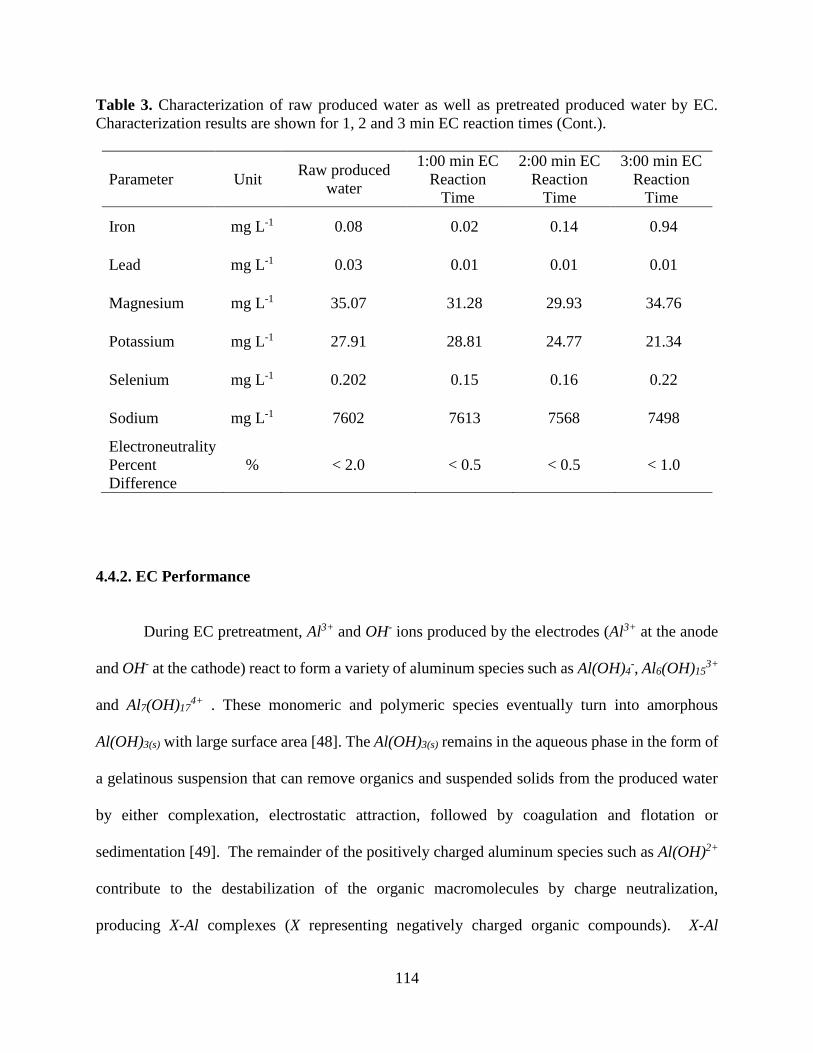
4.4.1. Produced Water Characterization .............................................................................. 113
4.4.2. EC Performance ......................................................................................................... 114
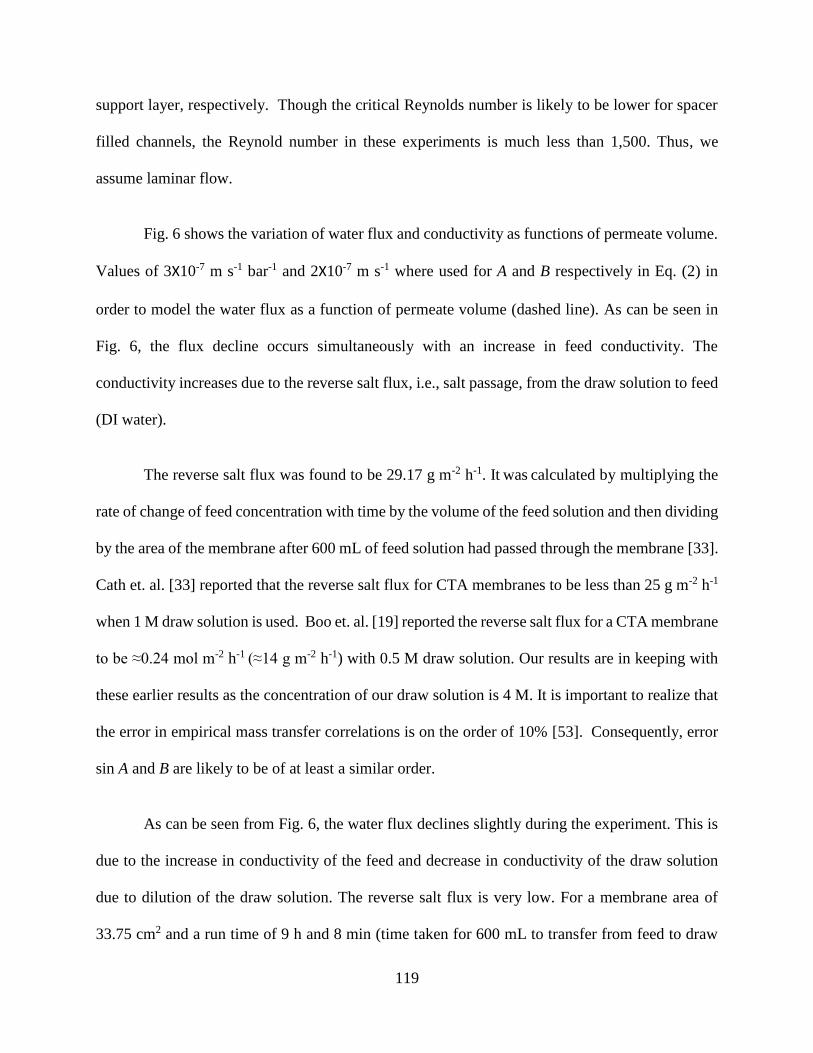
4.4.3. FO Performance ......................................................................................................... 118
4.4.3.1. DI Water Feed ..................................................................................................... 118
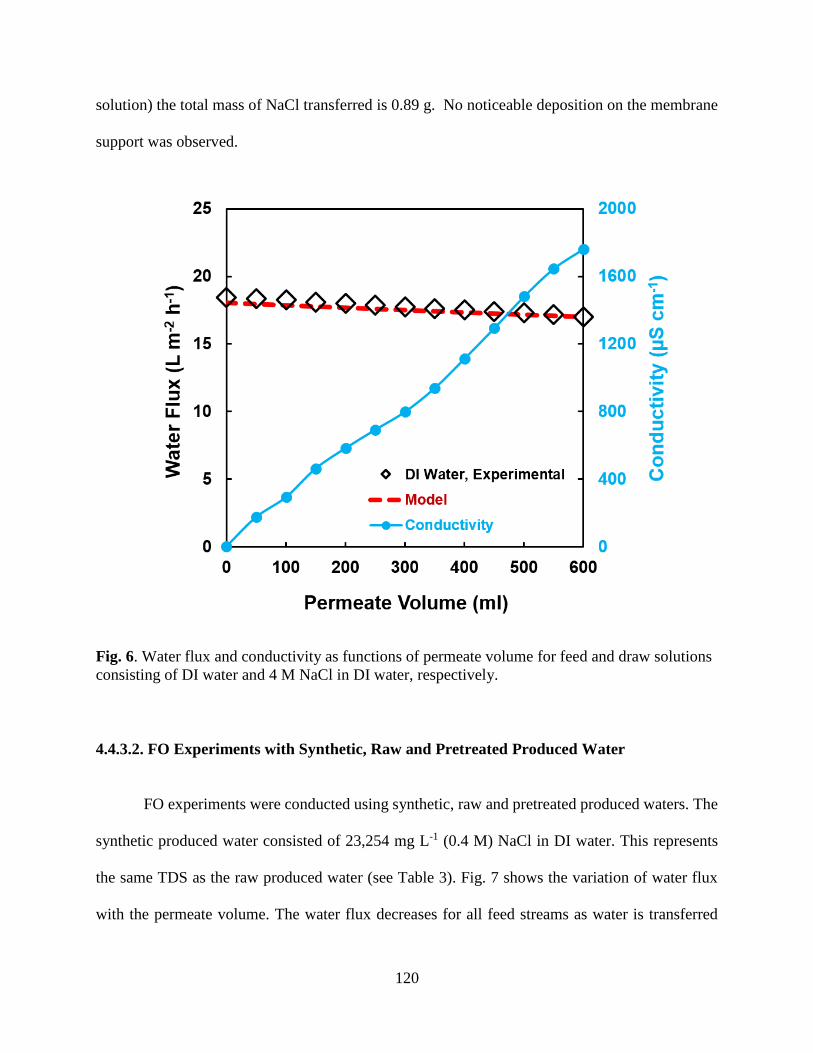
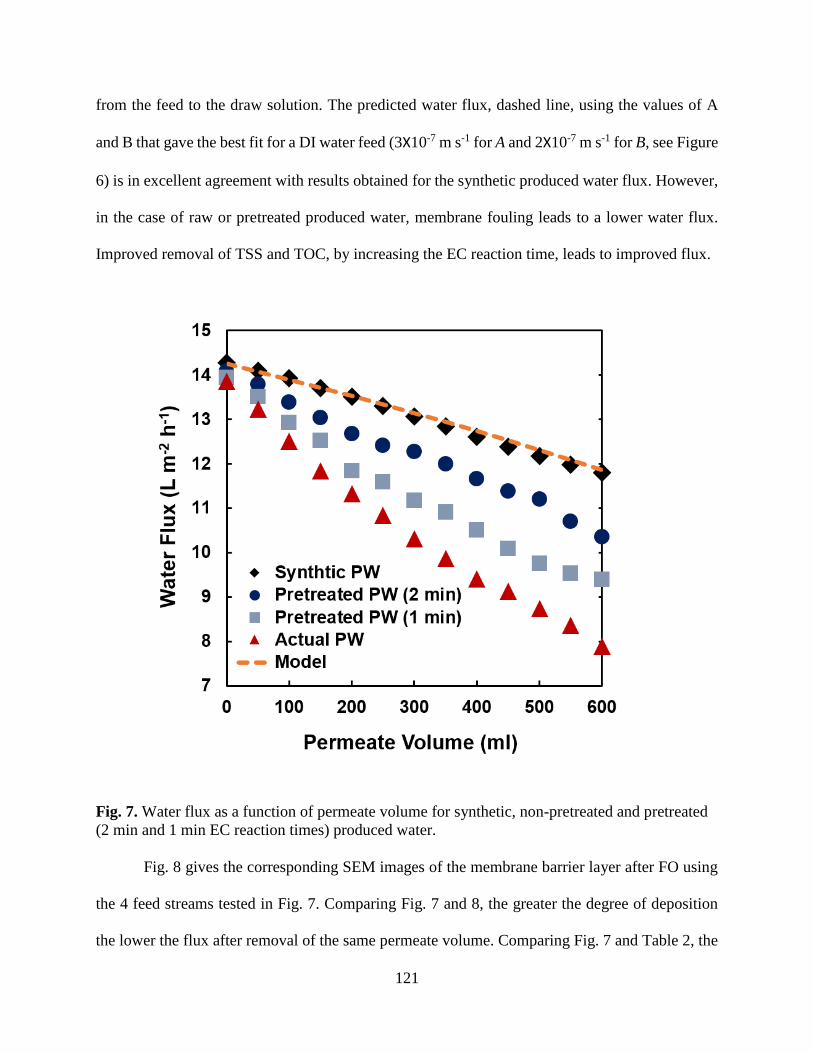
4.4.3.2. FO Experiments with Synthetic, Raw and Pretreated Produced Water .............. 120
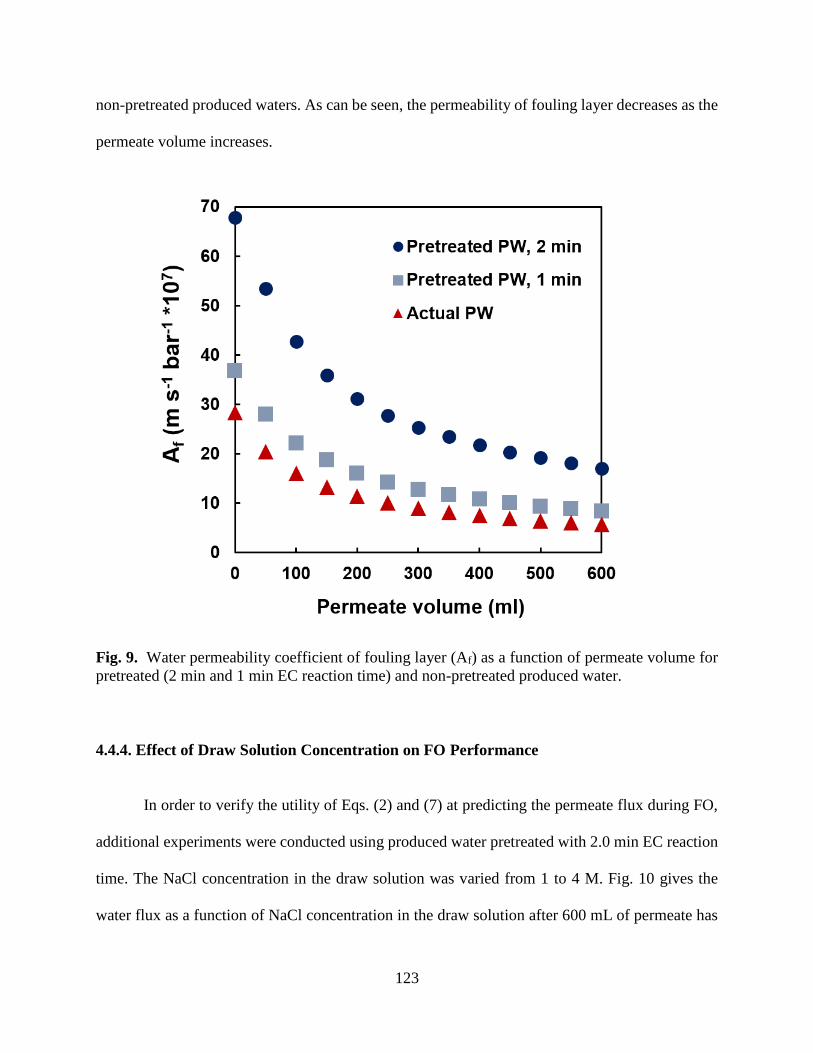
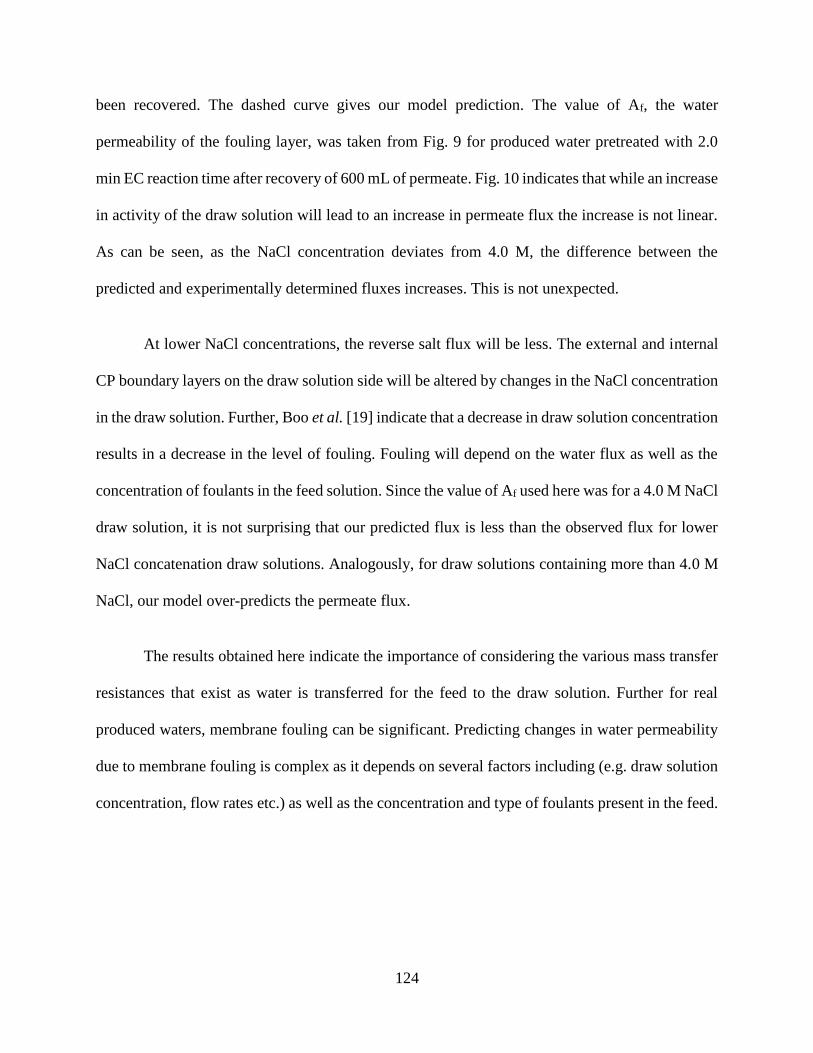
4.4.4. Effect of Draw Solution Concentration on FO Performance .................................... 123
Page 12
x
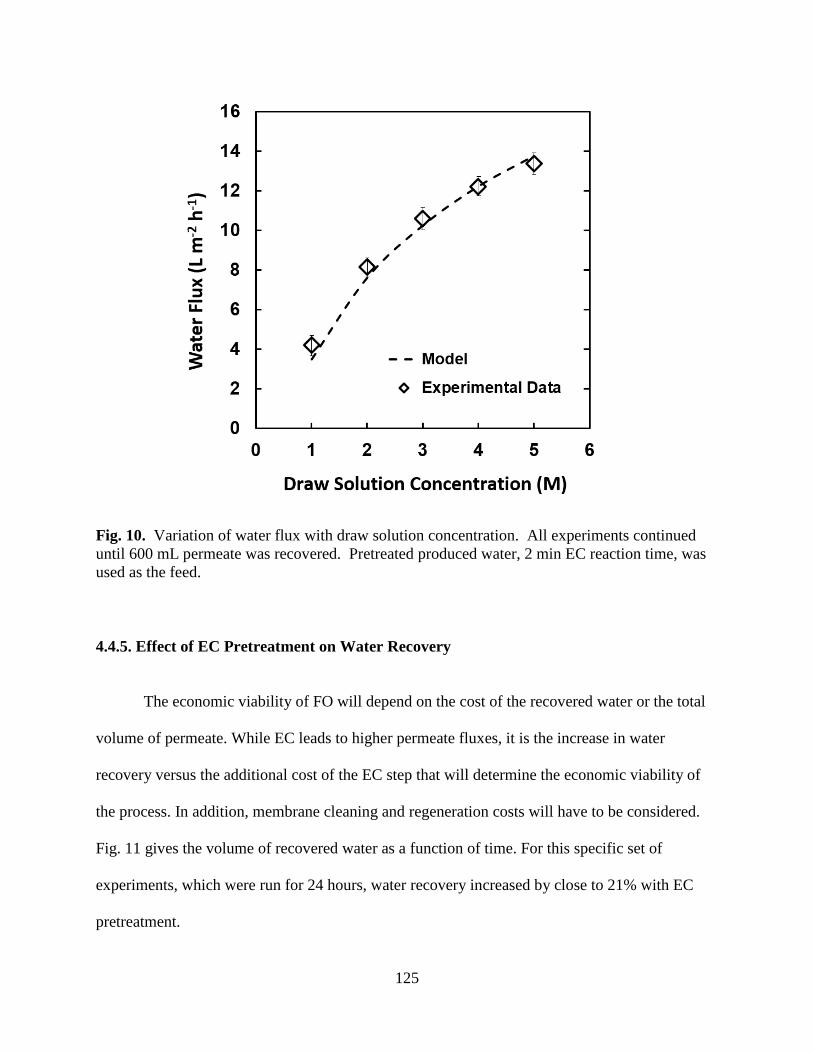
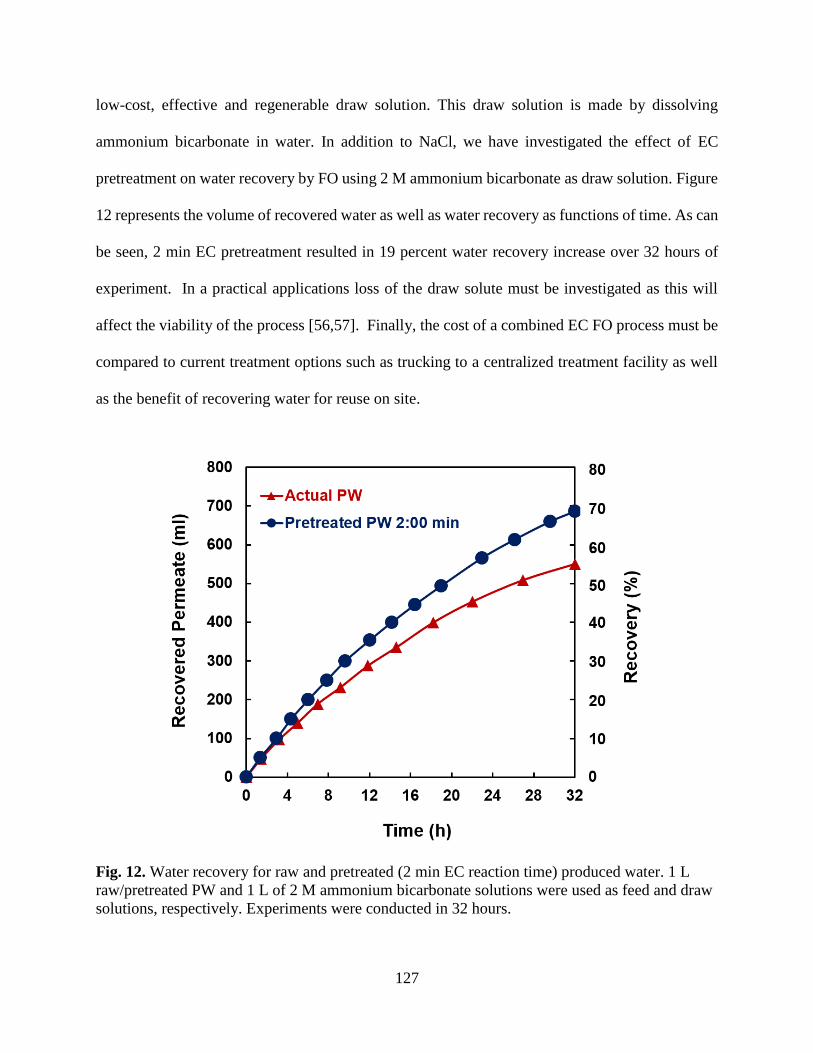
4.4.5. Effect of EC Pretreatment on Water Recovery ......................................................... 125
4.5. Conclusion ....................................................................................................................... 128
Acknowledgements ................................................................................................................ 128
References .............................................................................................................................. 129
Chapter 5. Integrated Electrocoagulation - Forward osmosis – Membrane Distillation
System for Sustainable Water Recovery from Hydraulic Fracturing Produced Water .... 134
Abstract .................................................................................................................................. 134
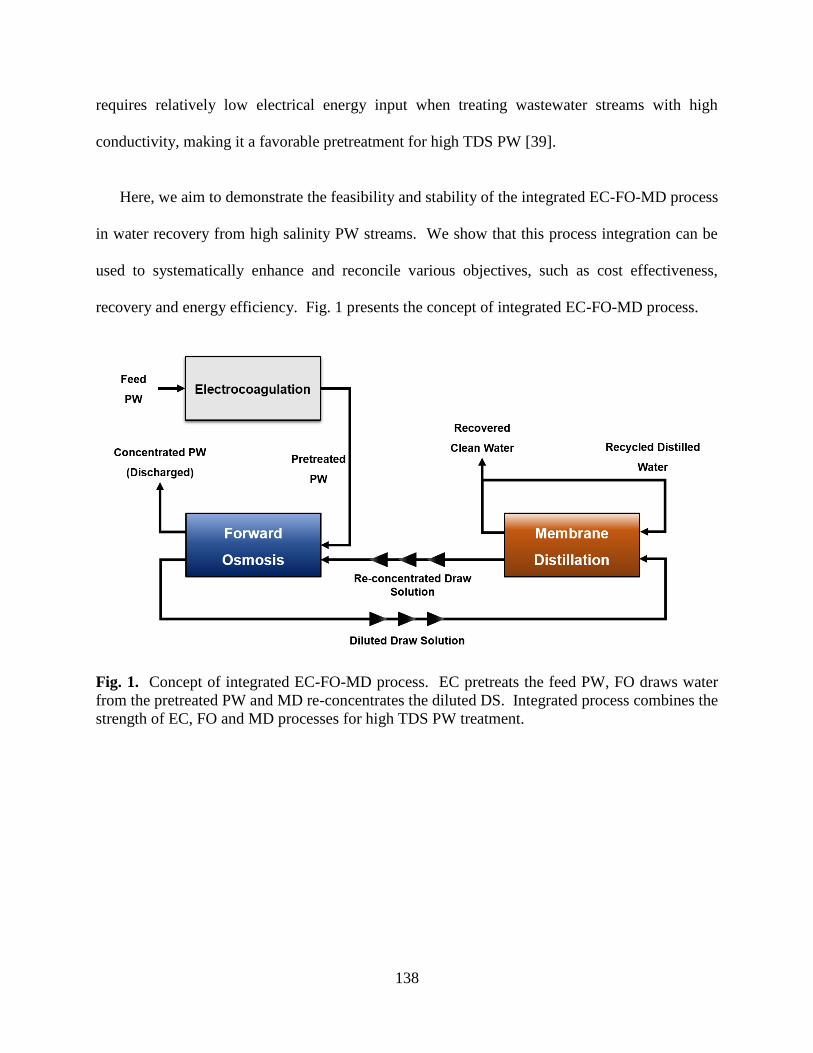
5.1. Introduction .................................................................................................................... 134
5.2. Summary of Theoretical Background .......................................................................... 139
5.2.1. Electrocoagulation ..................................................................................................... 139
5.2.2. Forward Osmosis ....................................................................................................... 140
5.2.3. Membrane Distillation ............................................................................................... 141
5.3. Experimental................................................................................................................... 142
5.3.1. Produced Water Samples ........................................................................................... 142
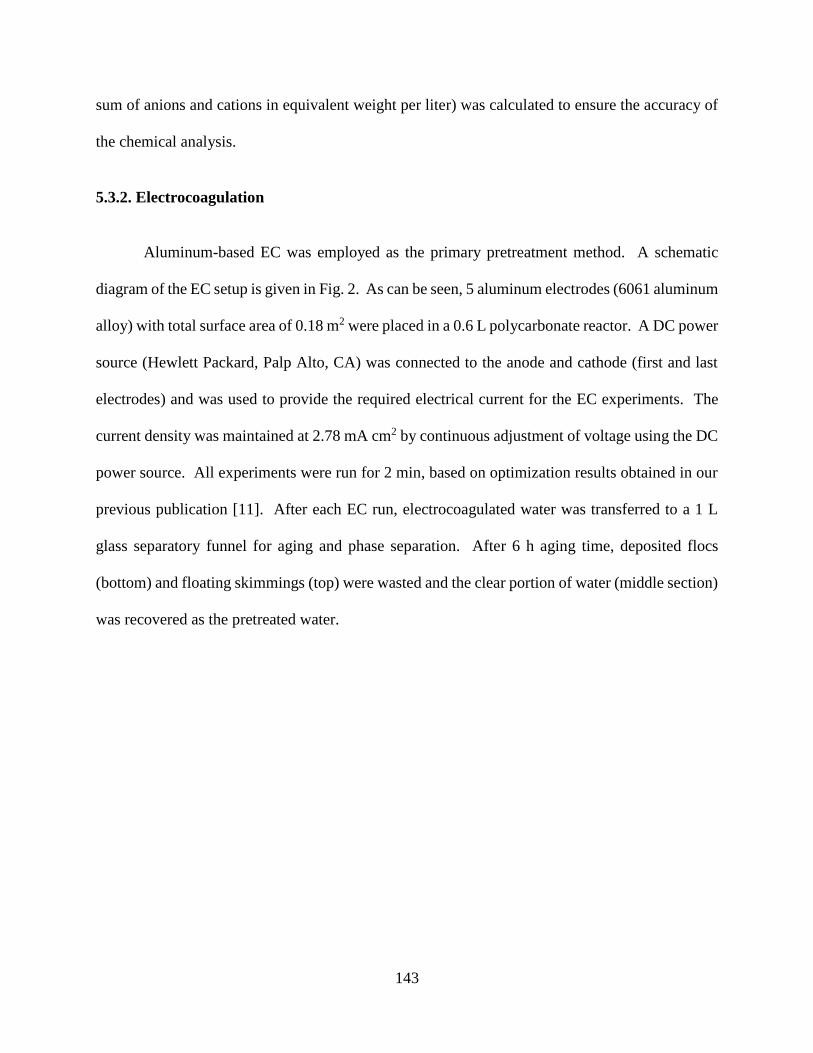
5.3.2. Electrocoagulation ..................................................................................................... 143
5.3.3. Membranes ................................................................................................................ 144
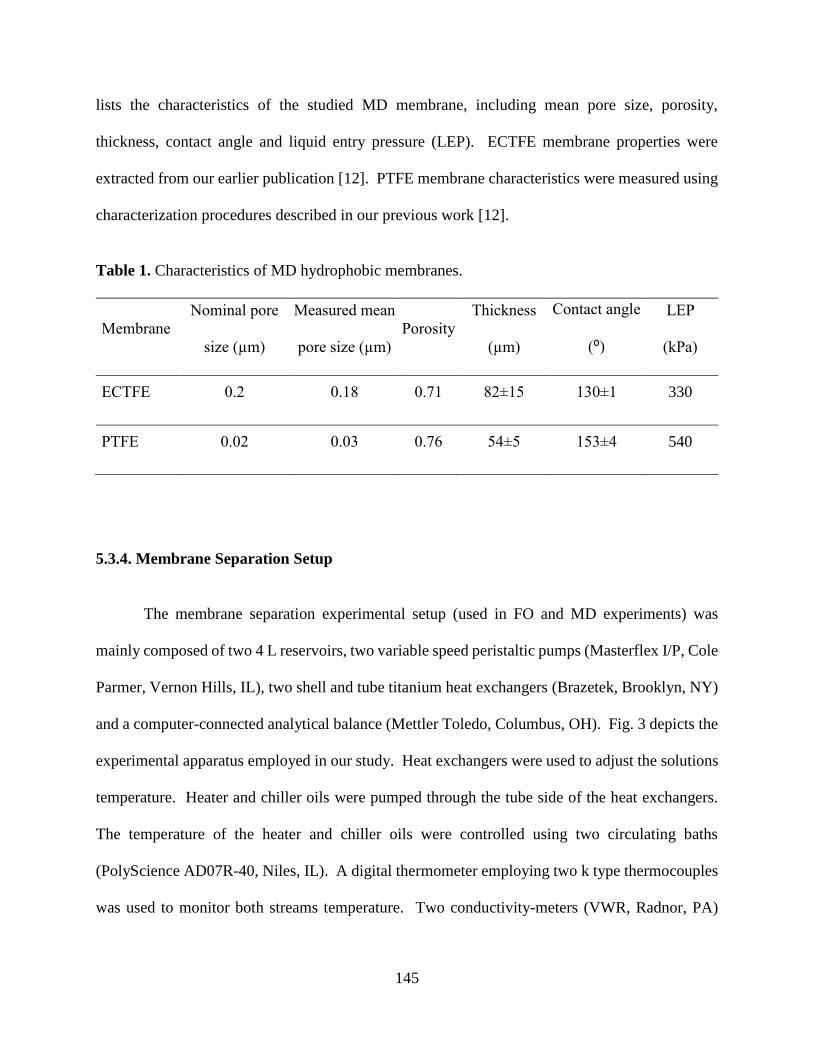
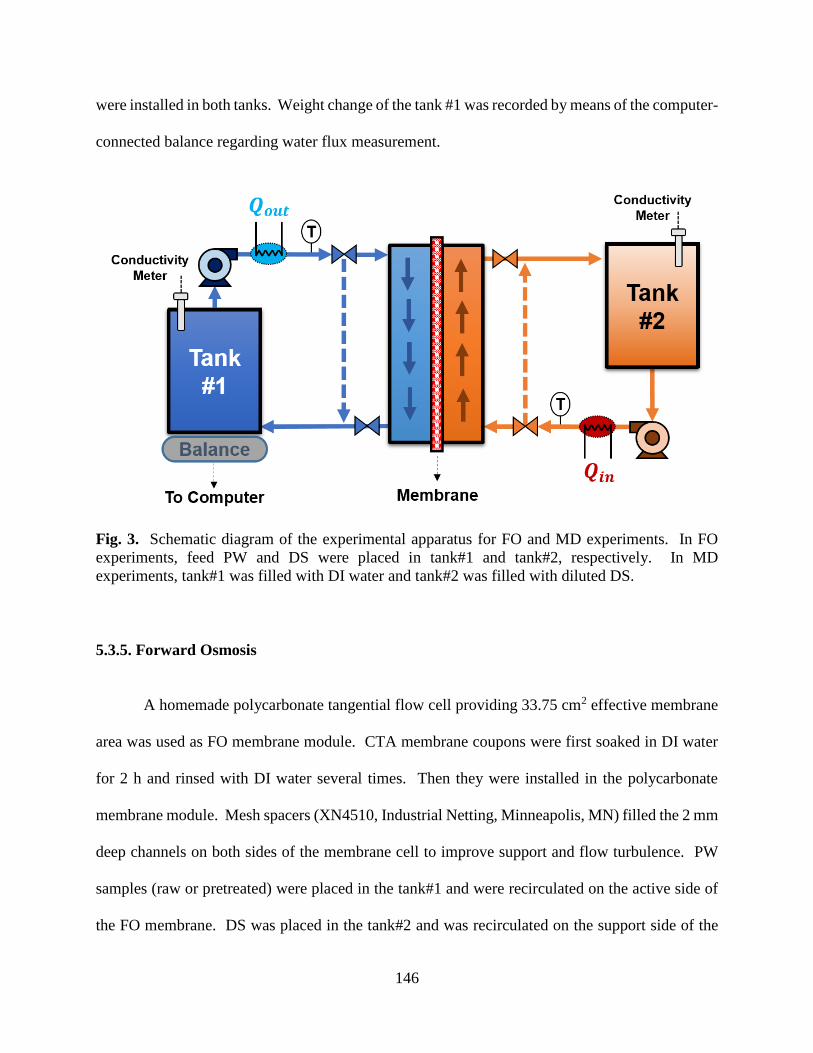
5.3.4. Membrane Separation Setup ...................................................................................... 145
5.3.5. Forward Osmosis ....................................................................................................... 146
5.3.6. Membrane Distillation ............................................................................................... 147
5.3.7. Scanning Electron Microscopy (SEM) and Energy-dispersive X-ray Spectroscopy
(EDX) .................................................................................................................................. 148
5.4. Results and Discussion ................................................................................................... 148
Page 13
xi
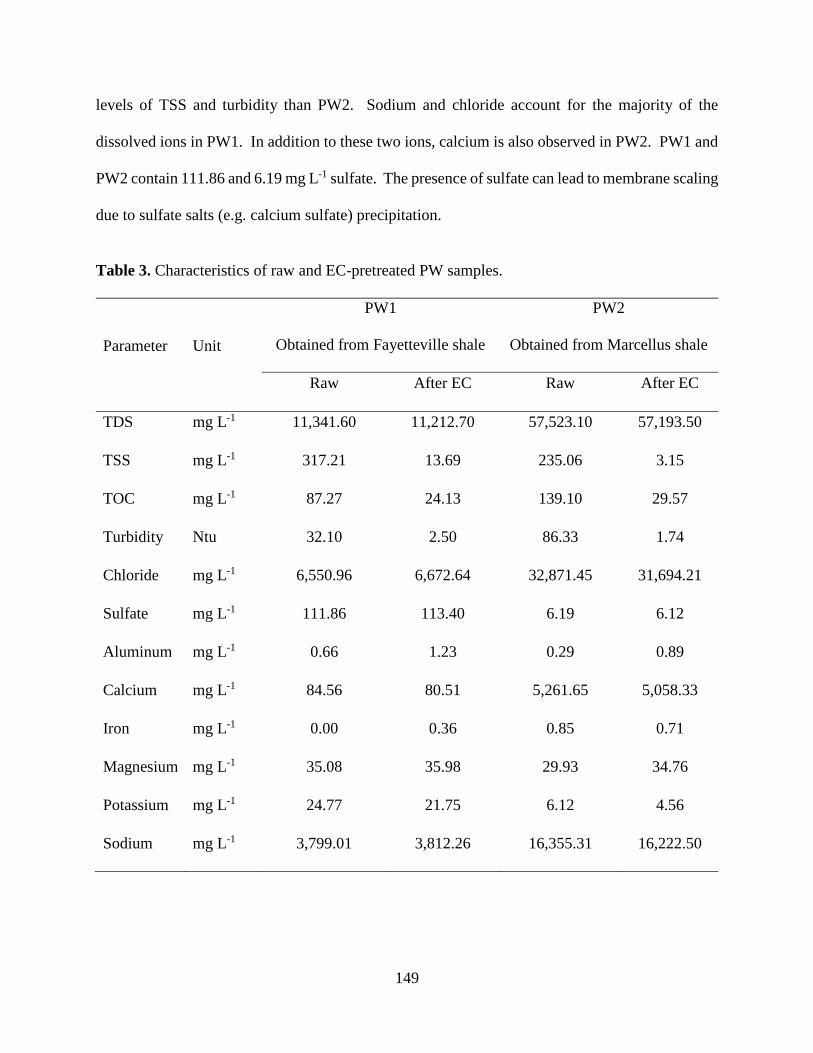
5.4.1. Wastewater Characterization ..................................................................................... 148
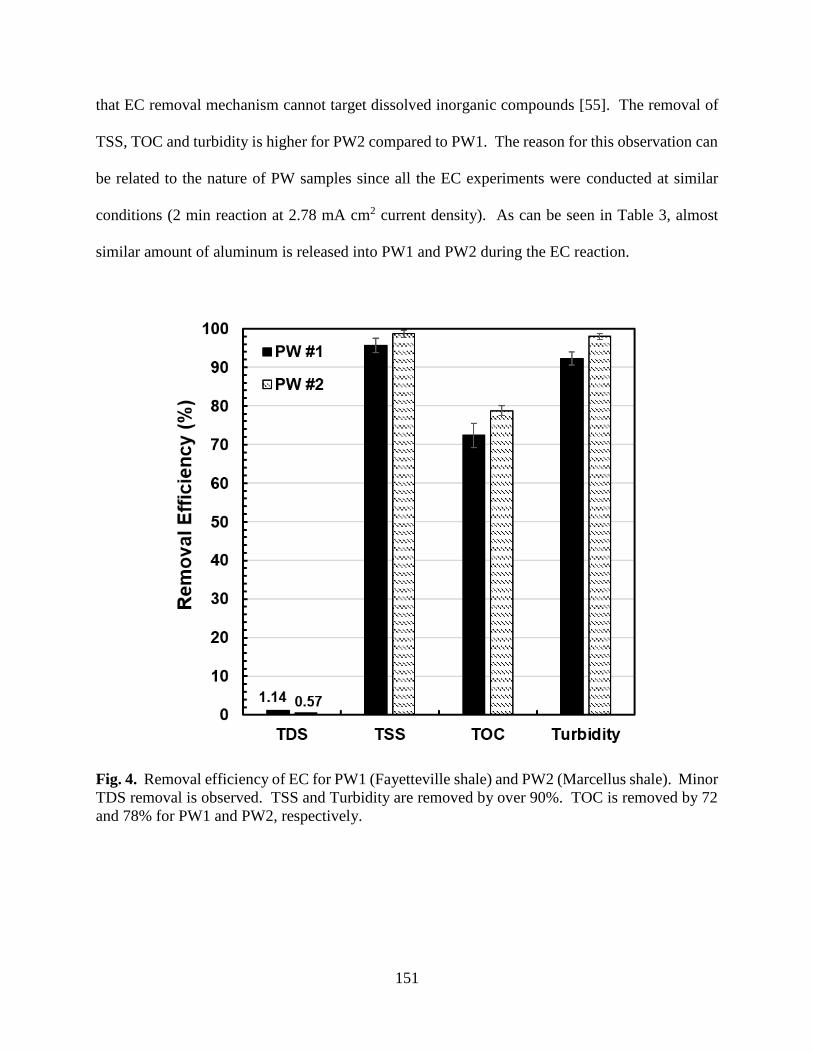
5.4.2. Electrocoagulation Performance ................................................................................ 150
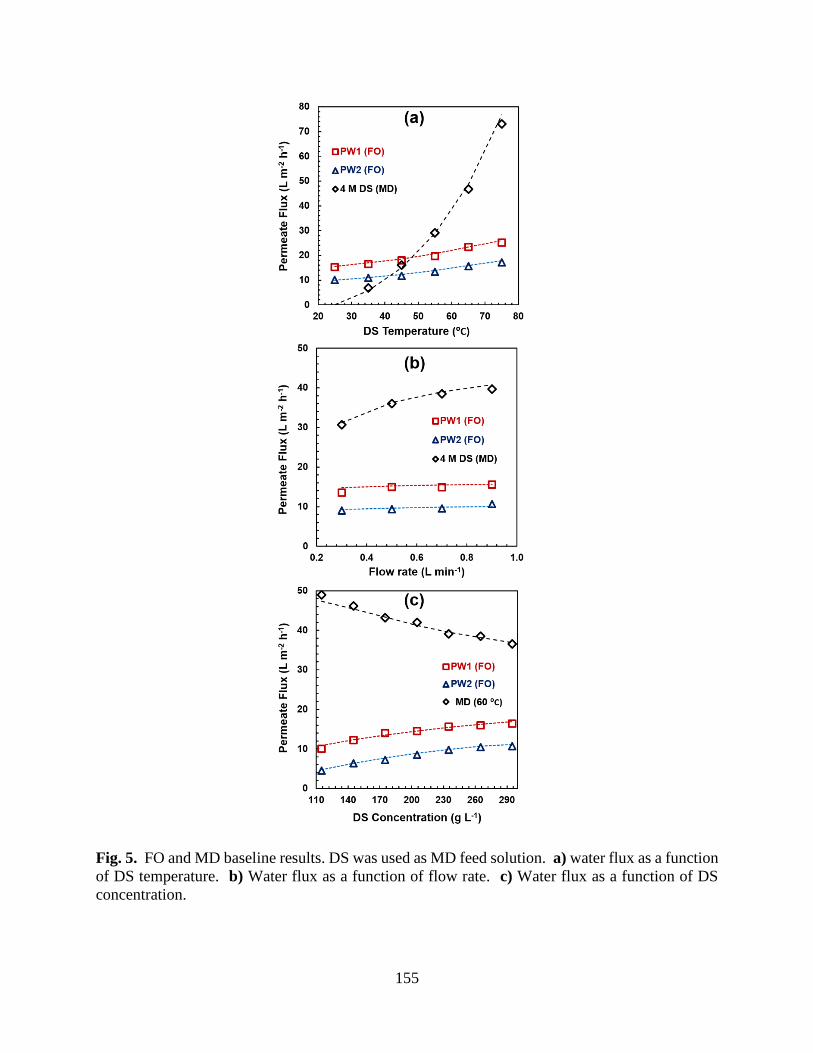
5.4.3. Bassline Experiments ................................................................................................ 152
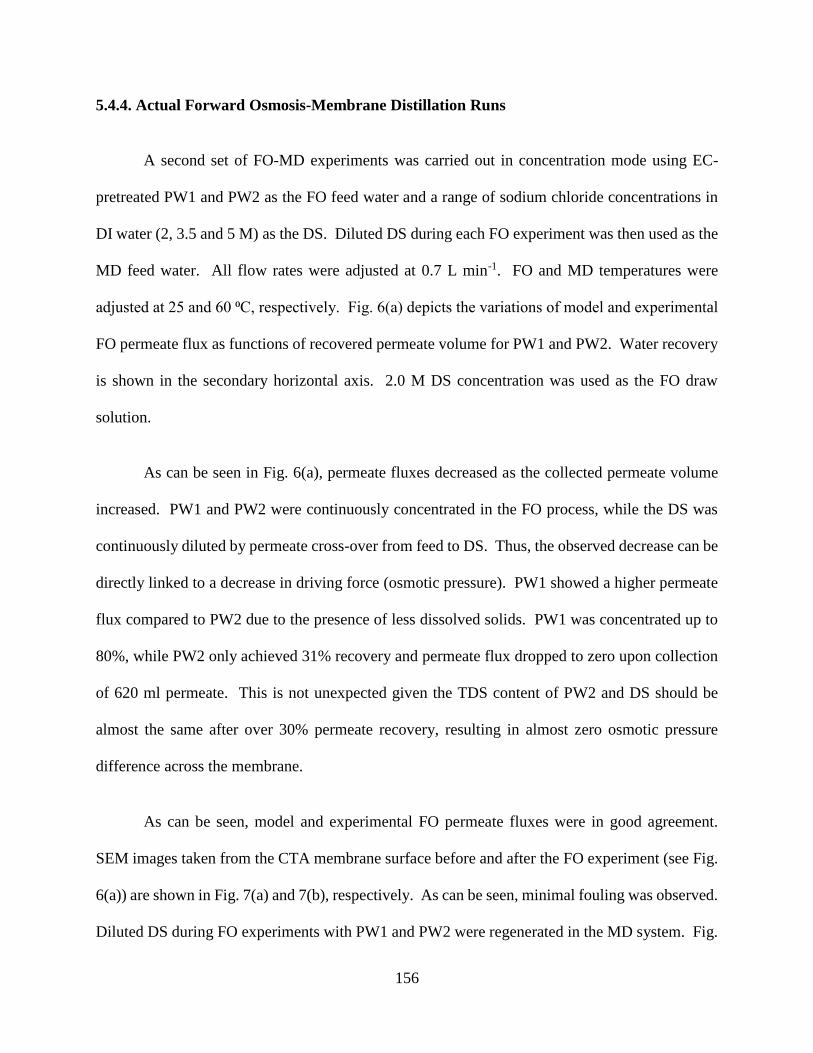
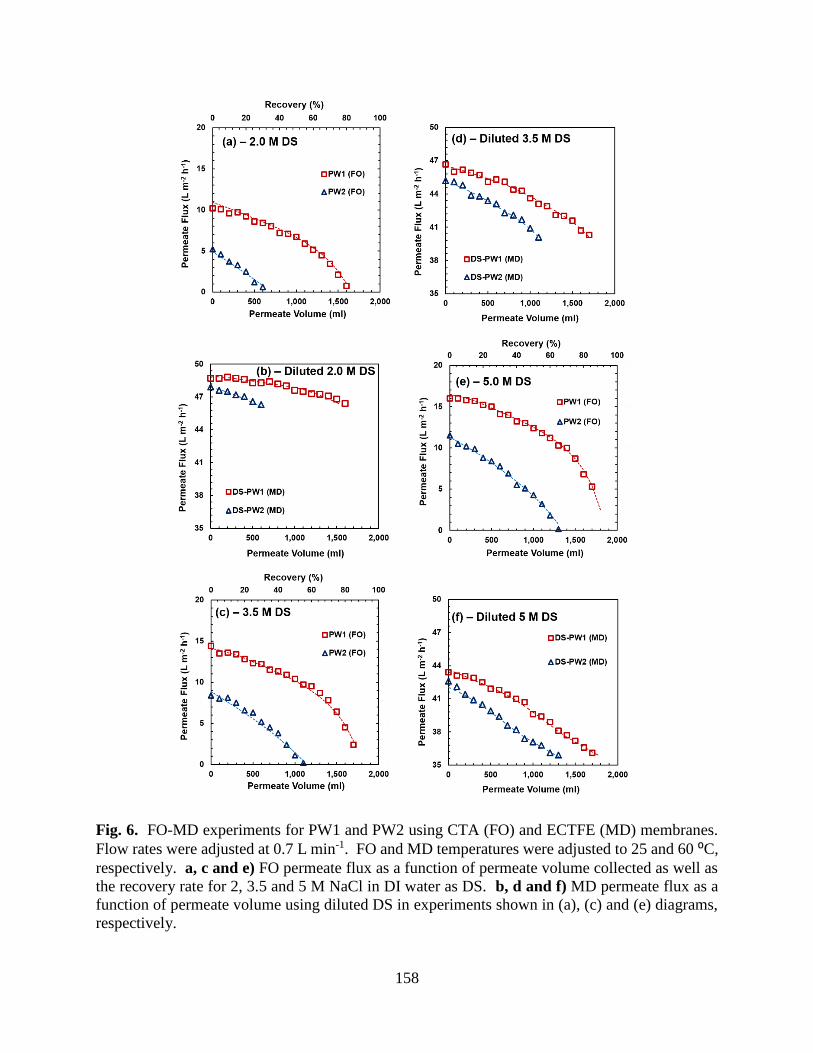
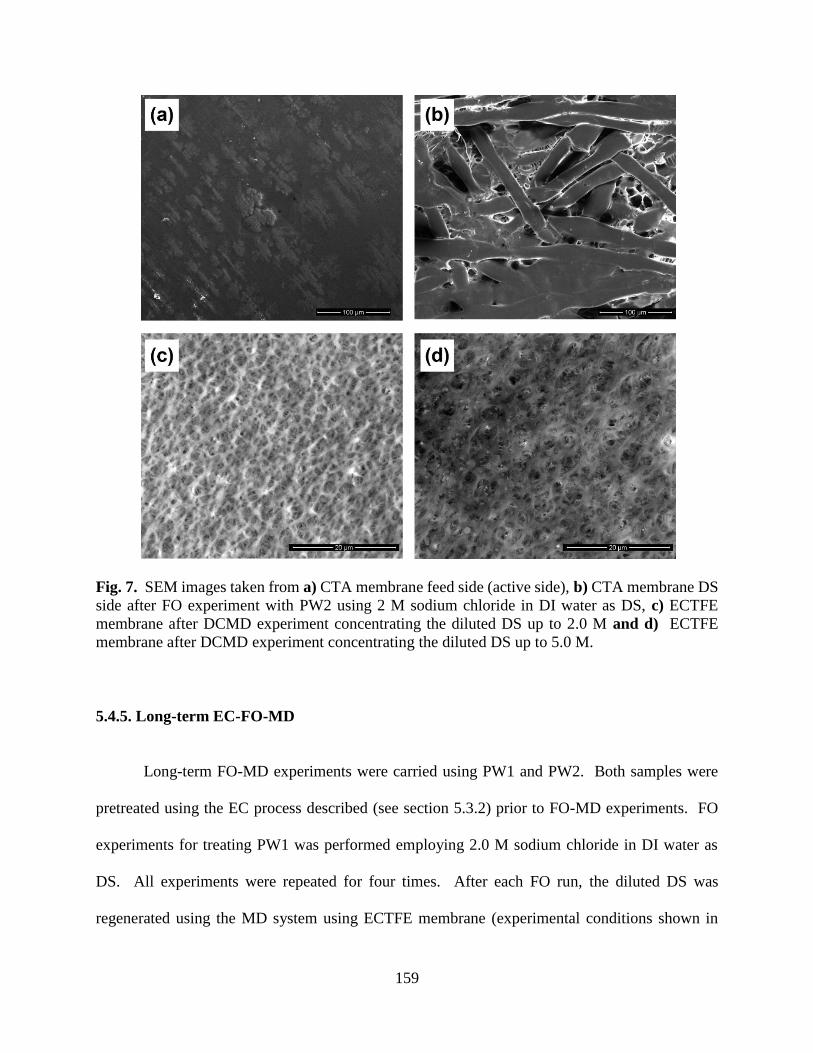
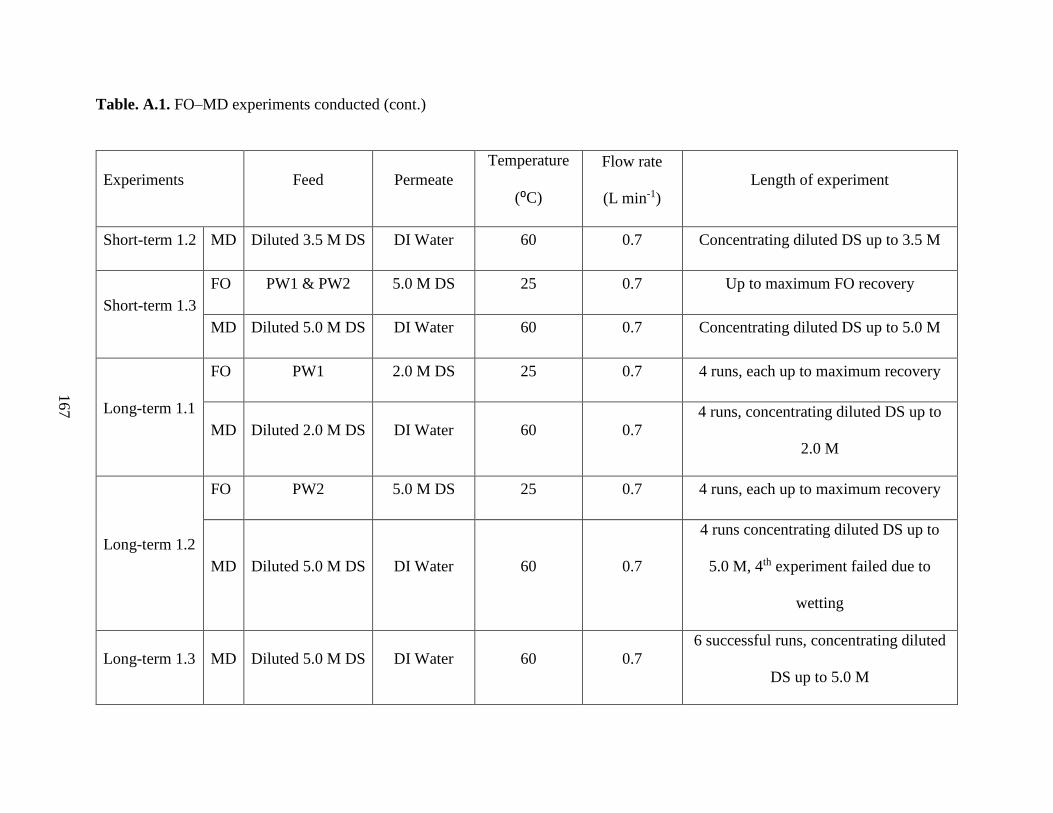
5.4.4. Actual Forward Osmosis-Membrane Distillation Runs ............................................ 156
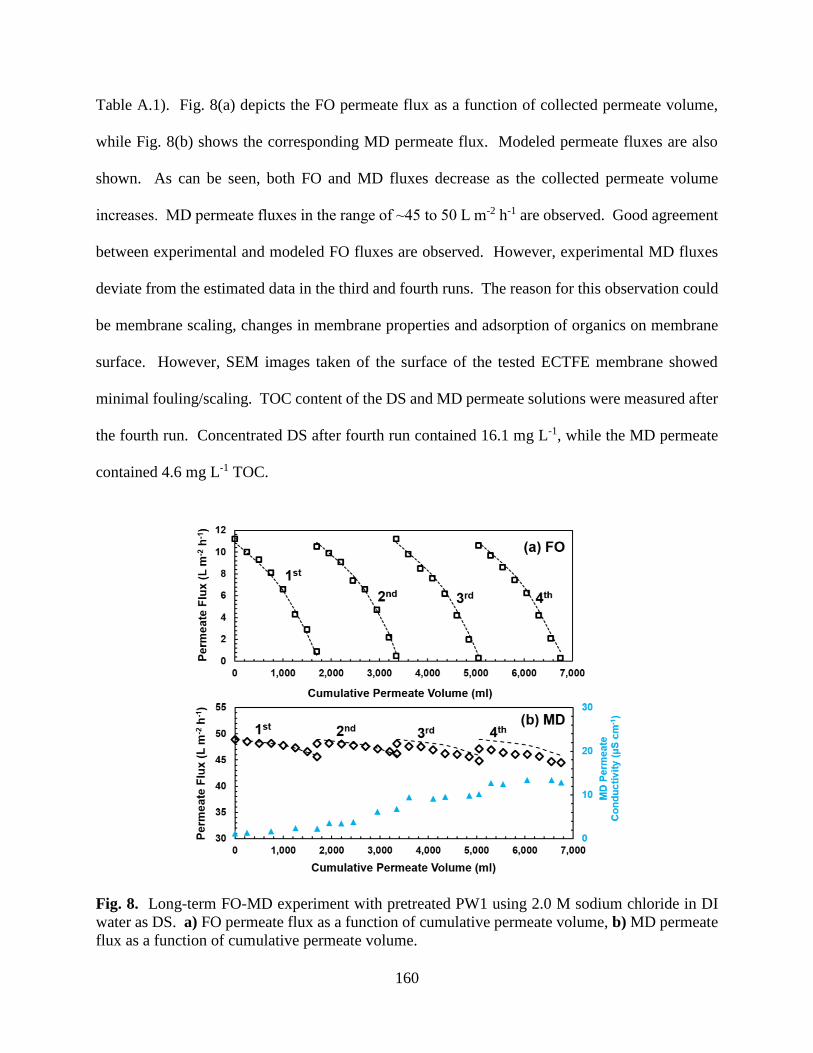
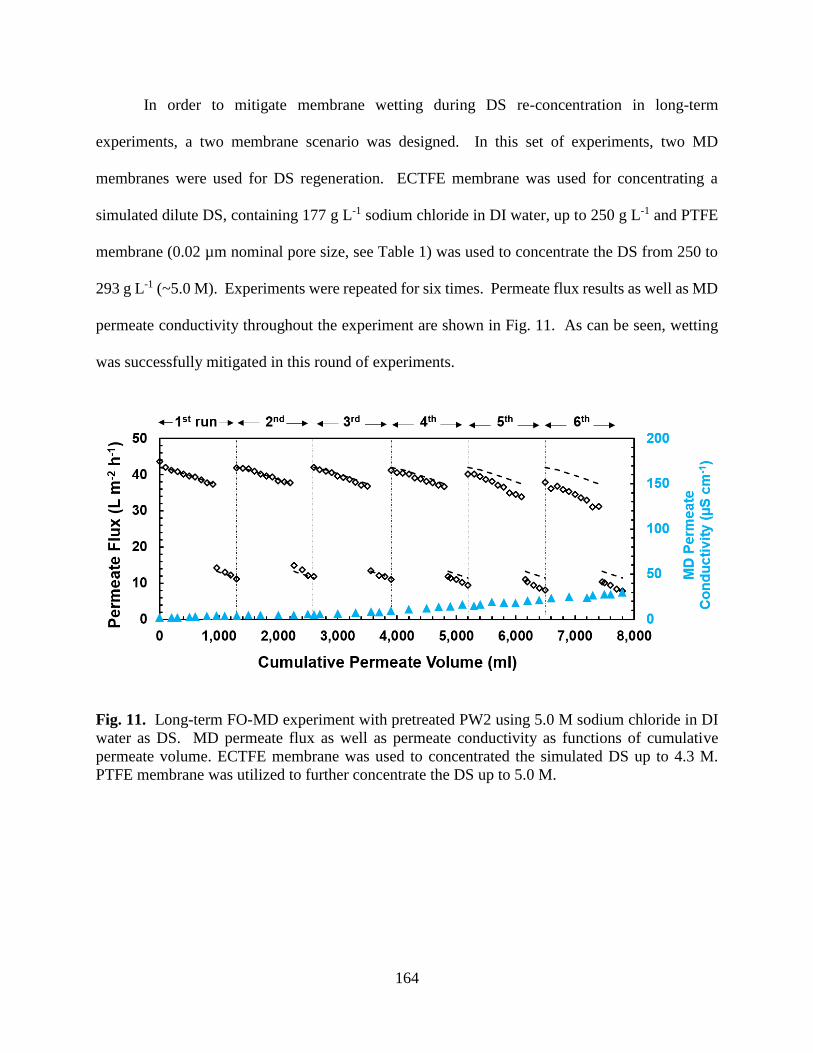
5.4.5. Long-term EC-FO-MD .............................................................................................. 159
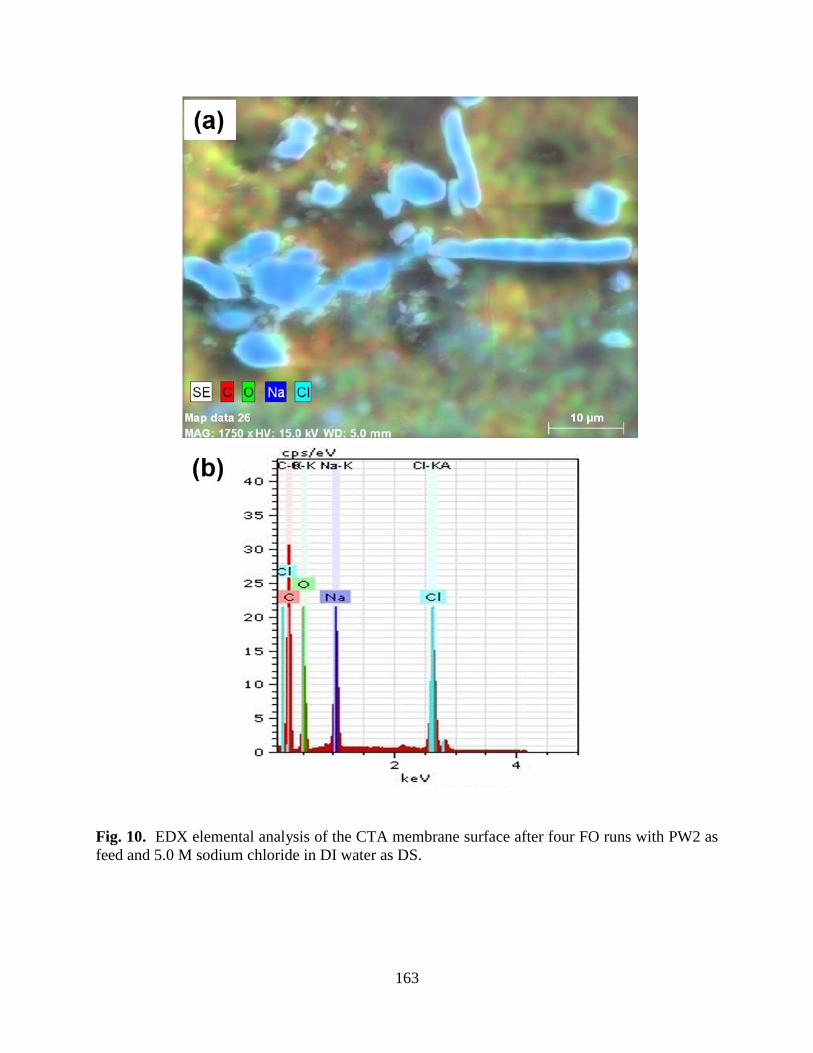
5.5. Conclusion ....................................................................................................................... 165
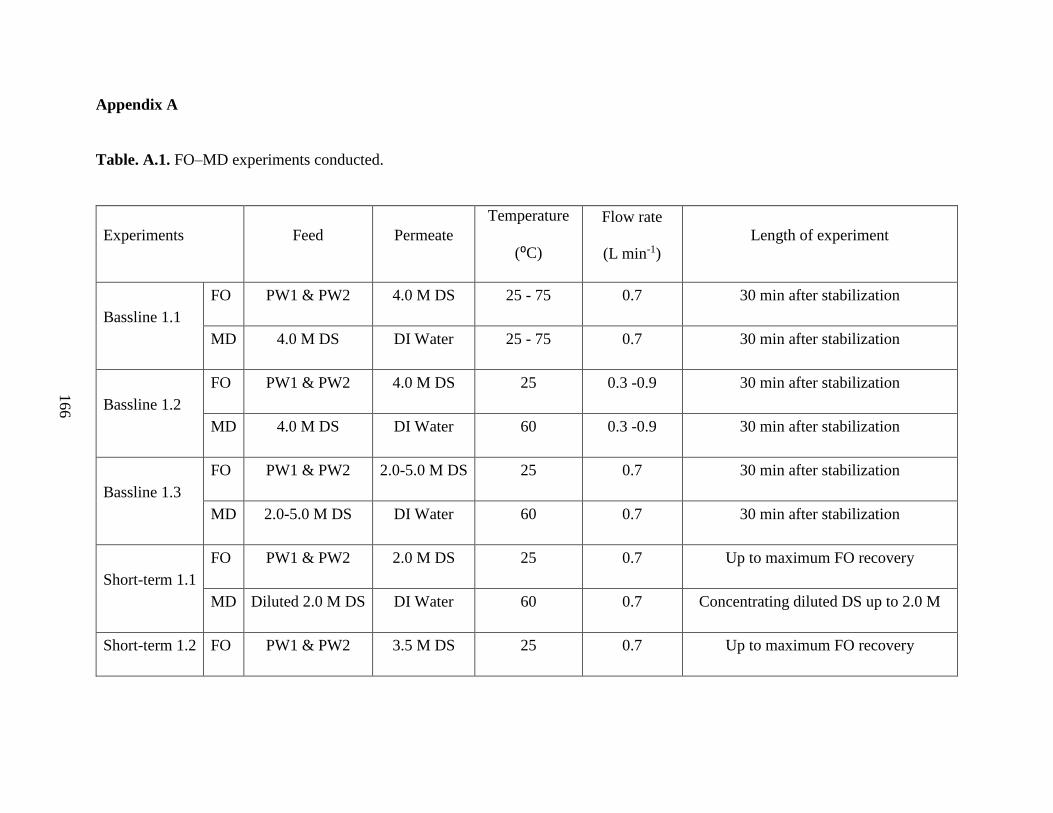
Appendix A ............................................................................................................................ 166
References .............................................................................................................................. 168
Chapter 6: Conclusions and Future Directions...................................................................... 174
6.1. Conclusions ..................................................................................................................... 174
6.2. Future Directions............................................................................................................ 177
Page 14
xii
List of Published Papers
Chapter 2 (Published): M. Malmali, P. Fyfe, D. Lincicome, K. Sardari, S.R. Wickramasinghe,
Selecting Membranes for Treating Hydraulic Fracturing Produced Waters by Membrane
Distillation, Separation Science and Technology, 52 (2017) 266–275.
Chapter 3 (Accepted): K. Sardari, P. Fyfe, D. Lincicome, S.R. Wickramasinghe, Combined
Electrocoagulation and Membrane Distillation for Treating High Salinity Produced Waters,
Journal of Membrane Science.
Chapter 4 (Published): K. Sardari, P. Fyfe, D. Lincicome, S.R. Wickramasinghe, Aluminum
Electrocoagulation Followed by Forward Osmosis for Treating Hydraulic Fracturing Produced
Waters, Desalination, 428 (2018) 172–181.
Chapter 5 (Under preparation): K. Sardari, P. Fyfe, S.R. Wickramasinghe, Integrated
Electrocoagulation, Forward Osmosis and Membrane Distillation Processes for Water Recovery
from Hydraulic Fracturing Flowback Waters, Desalination.
Page 15
1
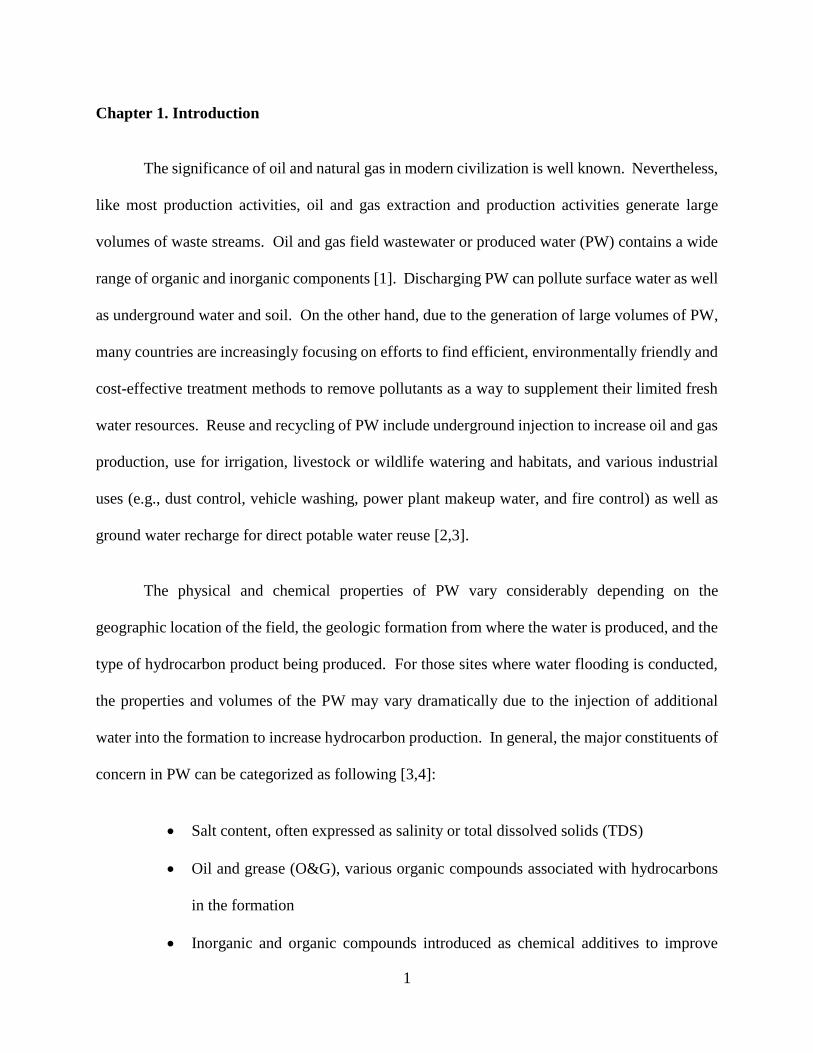
Chapter 1. Introduction
The significance of oil and natural gas in modern civilization is well known. Nevertheless,
like most production activities, oil and gas extraction and production activities generate large
volumes of waste streams. Oil and gas field wastewater or produced water (PW) contains a wide
range of organic and inorganic components [1]. Discharging PW can pollute surface water as well
as underground water and soil. On the other hand, due to the generation of large volumes of PW,
many countries are increasingly focusing on efforts to find efficient, environmentally friendly and
cost-effective treatment methods to remove pollutants as a way to supplement their limited fresh
water resources. Reuse and recycling of PW include underground injection to increase oil and gas
production, use for irrigation, livestock or wildlife watering and habitats, and various industrial
uses (e.g., dust control, vehicle washing, power plant makeup water, and fire control) as well as
ground water recharge for direct potable water reuse [2,3].
The physical and chemical properties of PW vary considerably depending on the
geographic location of the field, the geologic formation from where the water is produced, and the
type of hydrocarbon product being produced. For those sites where water flooding is conducted,
the properties and volumes of the PW may vary dramatically due to the injection of additional
water into the formation to increase hydrocarbon production. In general, the major constituents of
concern in PW can be categorized as following [3,4]:
Salt content, often expressed as salinity or total dissolved solids (TDS)
Oil and grease (O&G), various organic compounds associated with hydrocarbons
in the formation
Inorganic and organic compounds introduced as chemical additives to improve
Page 16
2
drilling and production operations
Naturally occurring radioactive material.
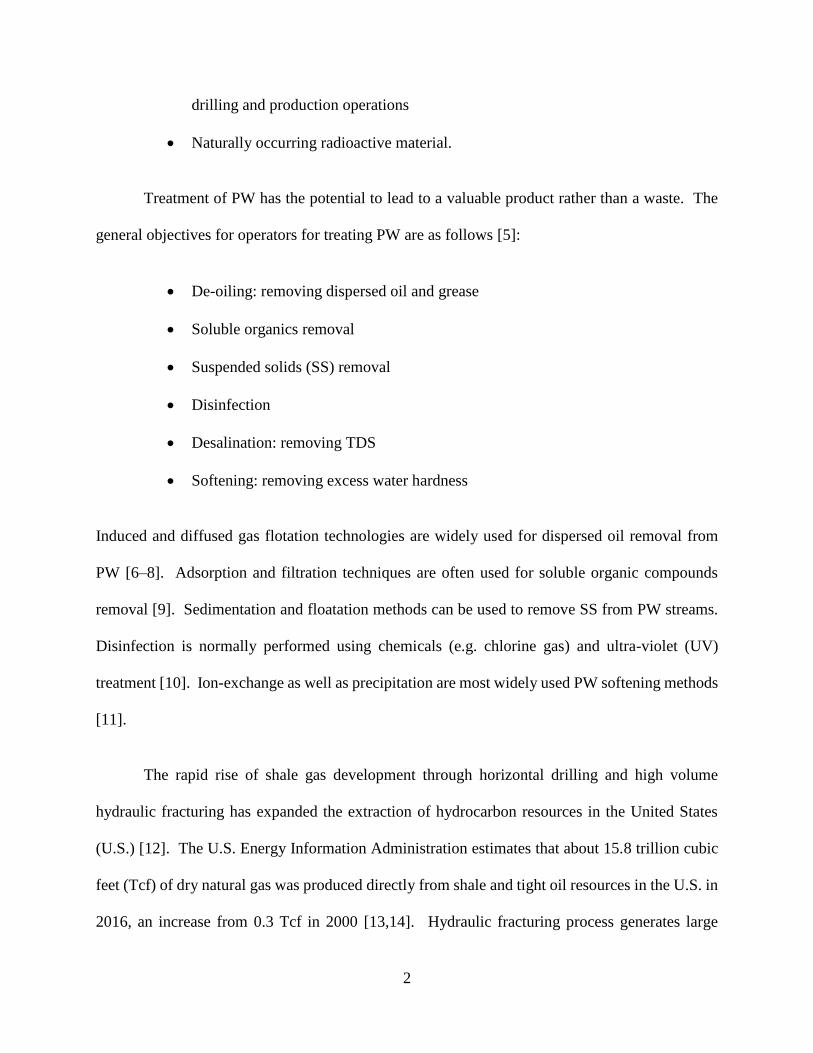
Treatment of PW has the potential to lead to a valuable product rather than a waste. The
general objectives for operators for treating PW are as follows [5]:
De-oiling: removing dispersed oil and grease
Soluble organics removal
Suspended solids (SS) removal
Disinfection
Desalination: removing TDS
Softening: removing excess water hardness
Induced and diffused gas flotation technologies are widely used for dispersed oil removal from
PW [6–8]. Adsorption and filtration techniques are often used for soluble organic compounds
removal [9]. Sedimentation and floatation methods can be used to remove SS from PW streams.
Disinfection is normally performed using chemicals (e.g. chlorine gas) and ultra-violet (UV)
treatment [10]. Ion-exchange as well as precipitation are most widely used PW softening methods
[11].
The rapid rise of shale gas development through horizontal drilling and high volume
hydraulic fracturing has expanded the extraction of hydrocarbon resources in the United States
(U.S.) [12]. The U.S. Energy Information Administration estimates that about 15.8 trillion cubic
feet (Tcf) of dry natural gas was produced directly from shale and tight oil resources in the U.S. in
2016, an increase from 0.3 Tcf in 2000 [13,14]. Hydraulic fracturing process generates large
Page 17
3
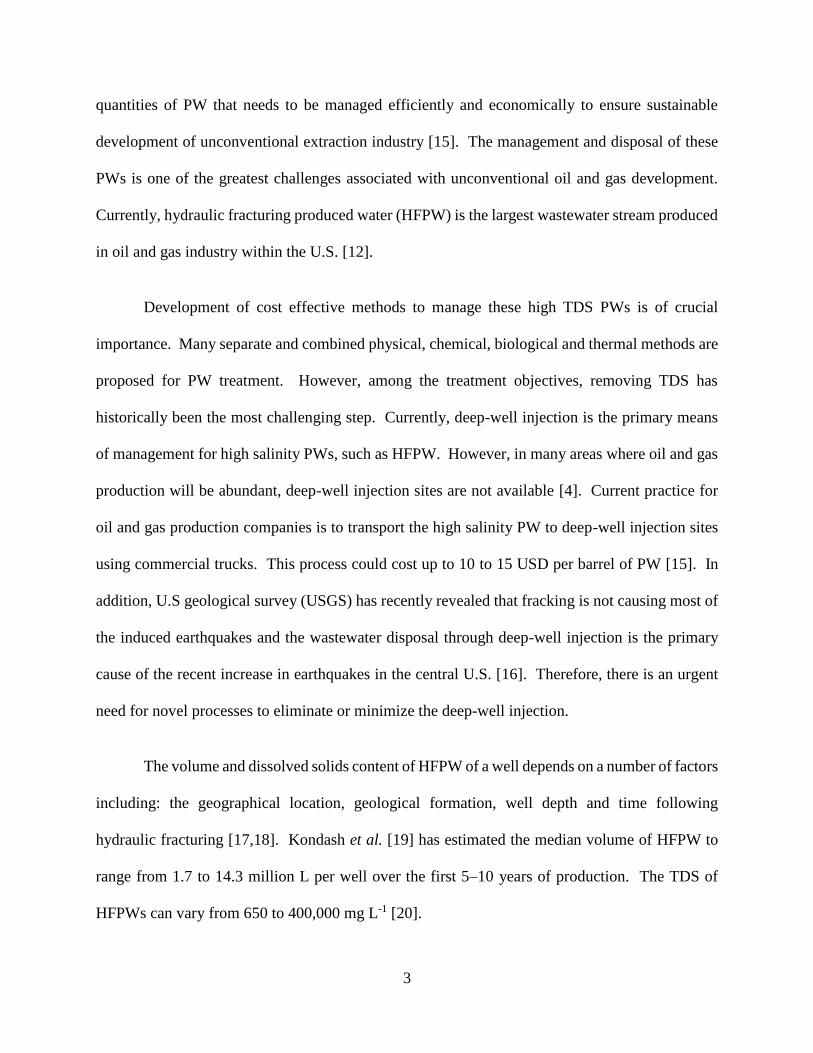
quantities of PW that needs to be managed efficiently and economically to ensure sustainable
development of unconventional extraction industry [15]. The management and disposal of these
PWs is one of the greatest challenges associated with unconventional oil and gas development.
Currently, hydraulic fracturing produced water (HFPW) is the largest wastewater stream produced
in oil and gas industry within the U.S. [12].
Development of cost effective methods to manage these high TDS PWs is of crucial
importance. Many separate and combined physical, chemical, biological and thermal methods are
proposed for PW treatment. However, among the treatment objectives, removing TDS has
historically been the most challenging step. Currently, deep-well injection is the primary means
of management for high salinity PWs, such as HFPW. However, in many areas where oil and gas
production will be abundant, deep-well injection sites are not available [4]. Current practice for
oil and gas production companies is to transport the high salinity PW to deep-well injection sites
using commercial trucks. This process could cost up to 10 to 15 USD per barrel of PW [15]. In
addition, U.S geological survey (USGS) has recently revealed that fracking is not causing most of
the induced earthquakes and the wastewater disposal through deep-well injection is the primary
cause of the recent increase in earthquakes in the central U.S. [16]. Therefore, there is an urgent
need for novel processes to eliminate or minimize the deep-well injection.
The volume and dissolved solids content of HFPW of a well depends on a number of factors
including: the geographical location, geological formation, well depth and time following
hydraulic fracturing [17,18]. Kondash et al. [19] has estimated the median volume of HFPW to
range from 1.7 to 14.3 million L per well over the first 5–10 years of production. The TDS of
HFPWs can vary from 650 to 400,000 mg L-1 [20].
Page 18
4
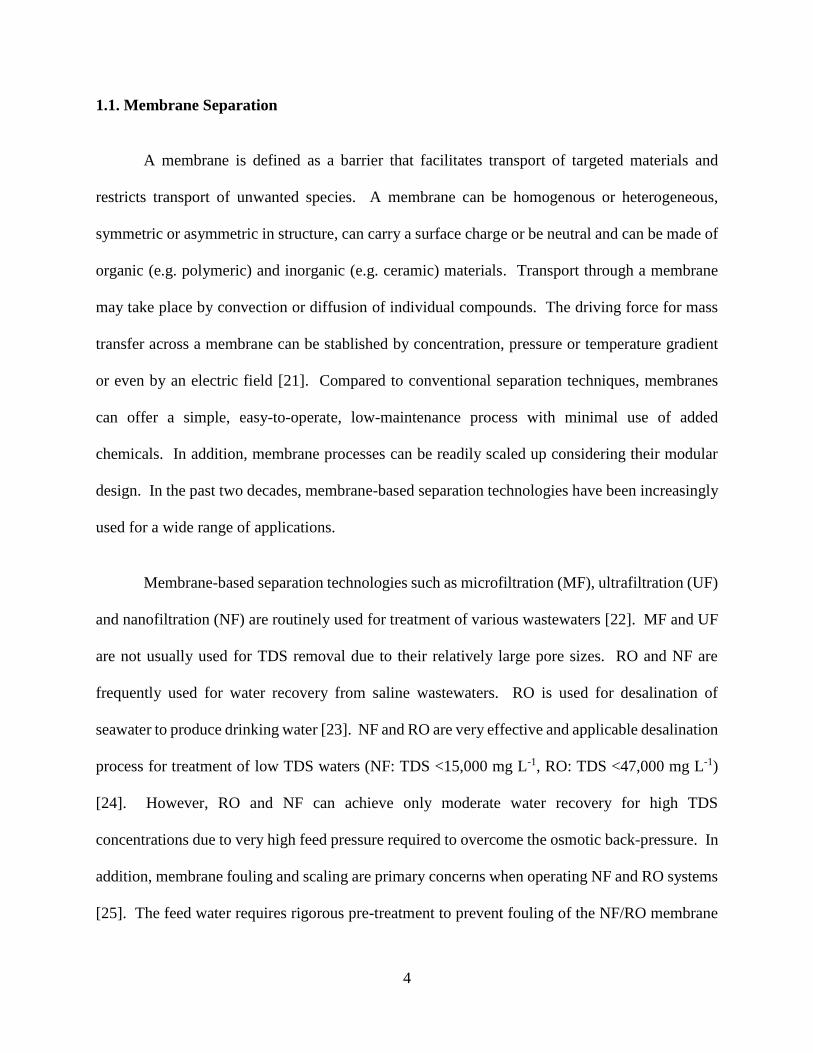
1.1. Membrane Separation
A membrane is defined as a barrier that facilitates transport of targeted materials and
restricts transport of unwanted species. A membrane can be homogenous or heterogeneous,
symmetric or asymmetric in structure, can carry a surface charge or be neutral and can be made of
organic (e.g. polymeric) and inorganic (e.g. ceramic) materials. Transport through a membrane
may take place by convection or diffusion of individual compounds. The driving force for mass
transfer across a membrane can be stablished by concentration, pressure or temperature gradient
or even by an electric field [21]. Compared to conventional separation techniques, membranes
can offer a simple, easy-to-operate, low-maintenance process with minimal use of added
chemicals. In addition, membrane processes can be readily scaled up considering their modular
design. In the past two decades, membrane-based separation technologies have been increasingly
used for a wide range of applications.
Membrane-based separation technologies such as microfiltration (MF), ultrafiltration (UF)
and nanofiltration (NF) are routinely used for treatment of various wastewaters [22]. MF and UF
are not usually used for TDS removal due to their relatively large pore sizes. RO and NF are
frequently used for water recovery from saline wastewaters. RO is used for desalination of
seawater to produce drinking water [23]. NF and RO are very effective and applicable desalination
process for treatment of low TDS waters (NF: TDS <15,000 mg L-1, RO: TDS <47,000 mg L-1)
[24]. However, RO and NF can achieve only moderate water recovery for high TDS
concentrations due to very high feed pressure required to overcome the osmotic back-pressure. In
addition, membrane fouling and scaling are primary concerns when operating NF and RO systems
[25]. The feed water requires rigorous pre-treatment to prevent fouling of the NF/RO membrane
Page 19
5
[25,26]. Many new processes involving osmotically and thermally driven membrane technologies
are being investigated for desalination of highly impaired wastewaters [23,27].
In our studies, we will investigate the potential of membrane-based separation processes
for treatment of high TDS HFPW streams. The overall goal of this work is to develop a cost-
effective membrane-based process that leads to a very high TDS concentrate and a clean effluent.
We will investigate three promising technologies:
Membrane Distillation (MD)
Forward Osmosis (FO)
Integrated FO-MD
1.2. Membrane Distillation
Treatment of very high TDS streams is possible using distillation technologies. MD is a
very promising technology for treating high TDS wastewater streams [27]. MD is a physical
separation process whereby the separation takes place by means of a vapor pressure gradient across
a microporous hydrophobic membrane. The vapor pressure difference across the membrane is the
driving force for vapor transport [28]. A number of methods have been employed to establish the
driving force across the MD membrane and each method has led to a specific MD configuration.
The permeate side of the MD membrane may consist of a condensing liquid in direct contact with
the microporous membrane (DCMD), a sweeping gas stream (SGMD), a cold condensing surface
separated by an air gap (AGMD), or a vacuum (VMD). In the most common arrangement of MD,
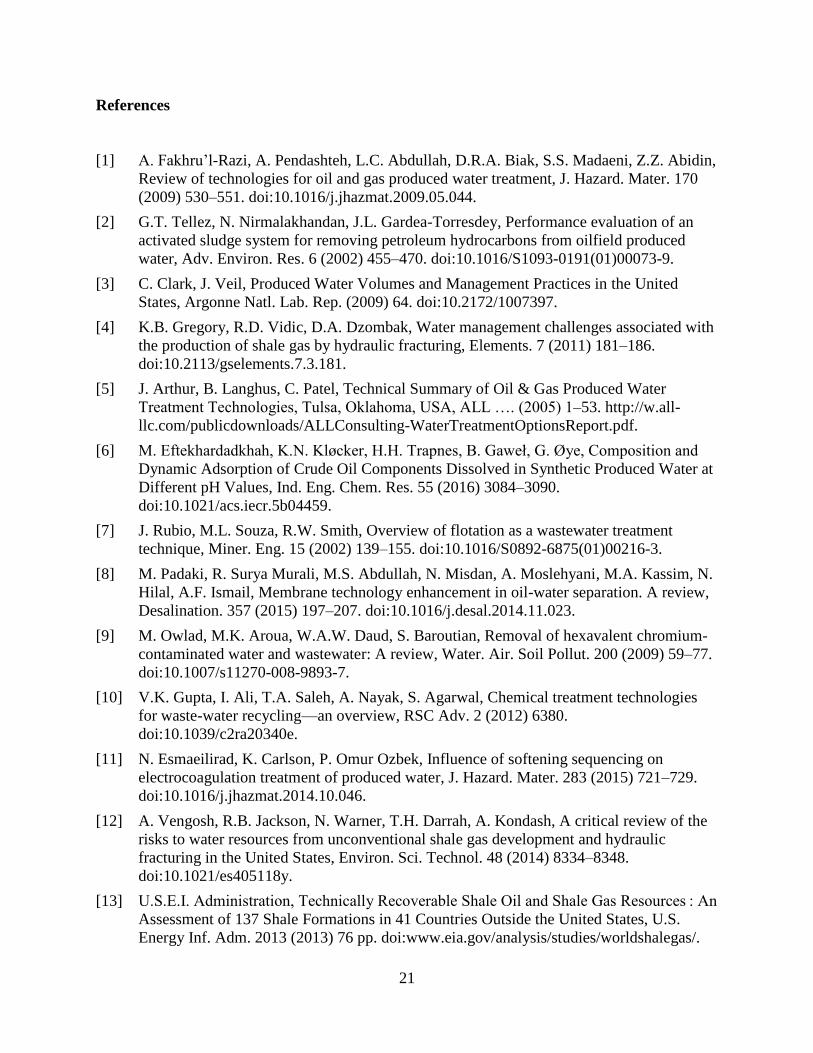
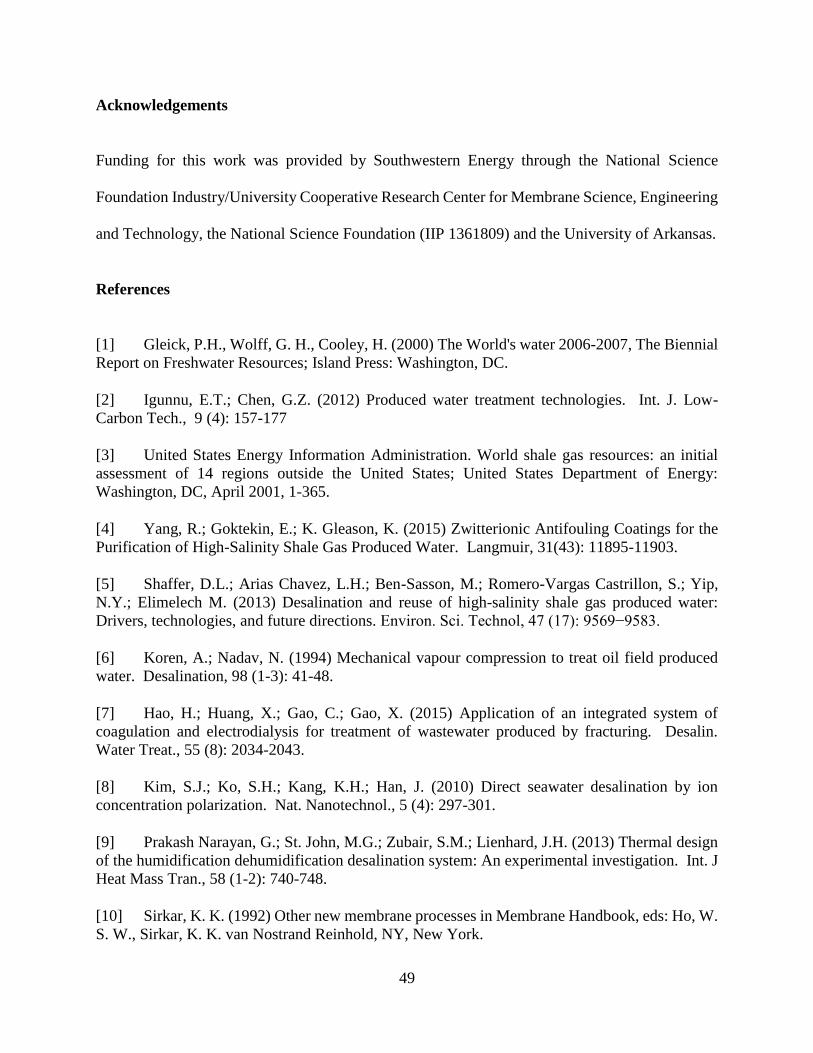
DCMD, the hot saline feed is passed on one side of a hydrophobic microporous membrane. The
membrane acts as a thermal insulator as well as a physical barrier between the hot feed and the
Page 20
6
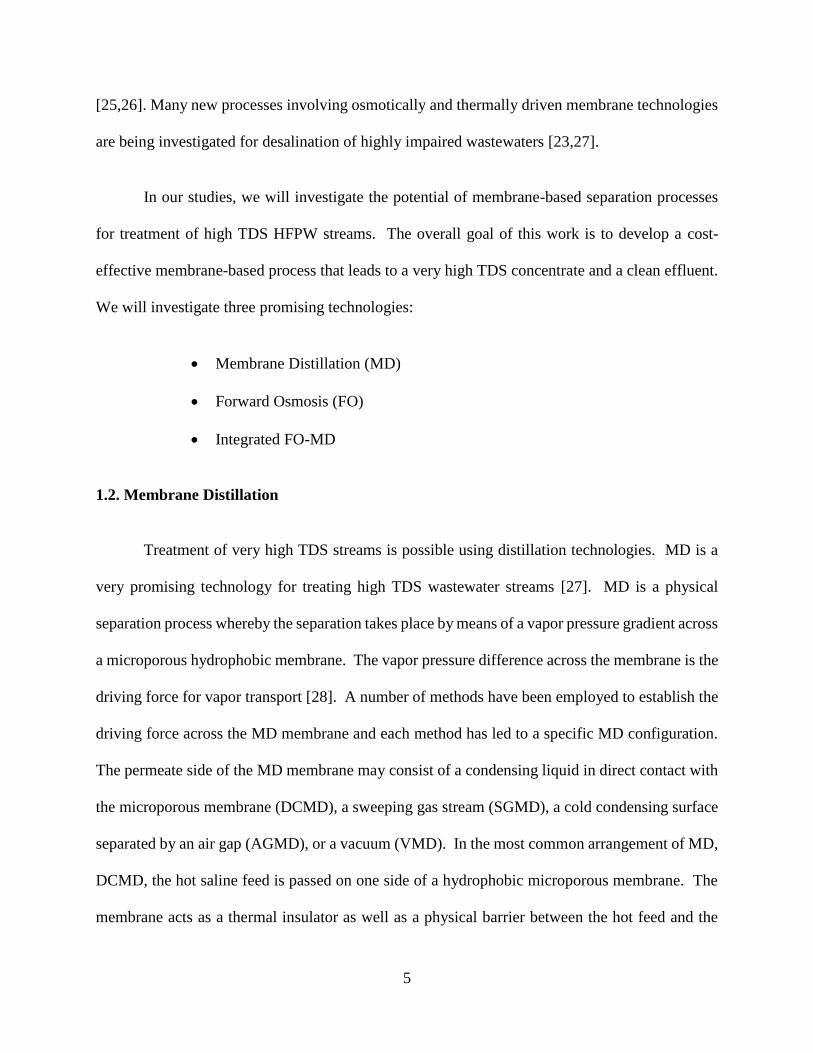
cold distillate that flow on opposite side of the membrane. Water and other volatile components
vaporize from the hot feed, pass through the membrane pores and condense on the distillate side.
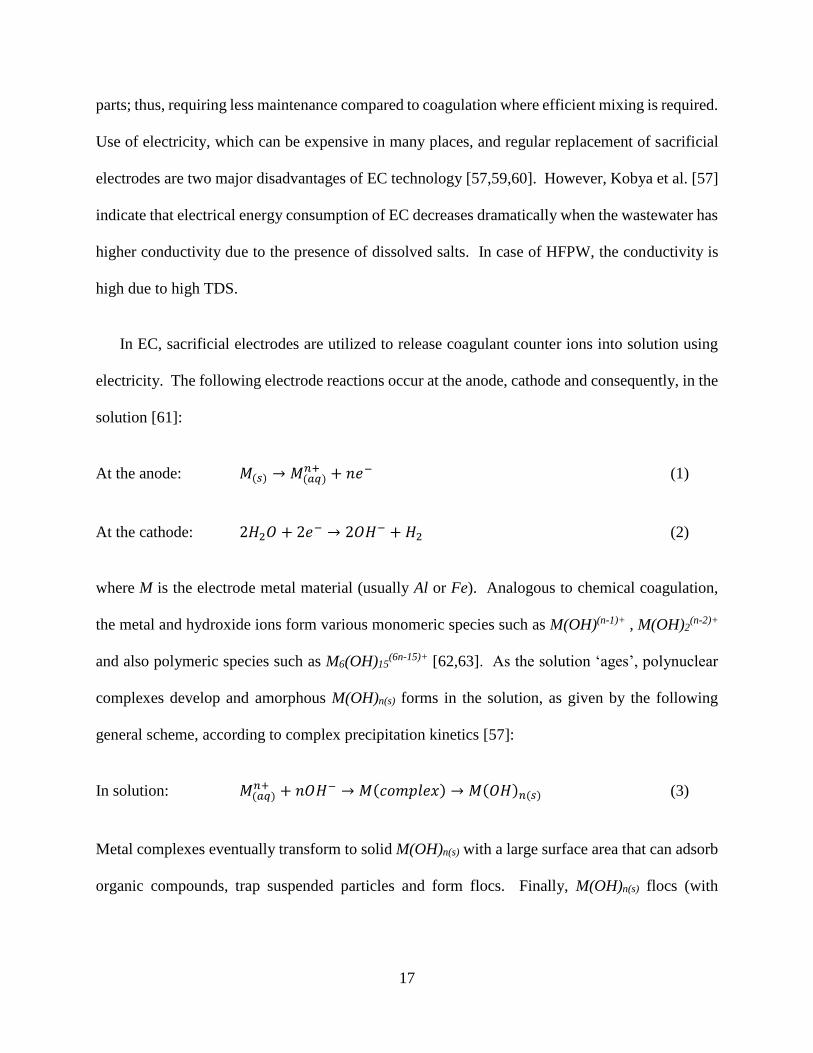
Here, we focus on DCMD configuration. Figure 1 illustrates the concept of DCMD for water
recovery from PW.
Figure 1. DCMD concept.
The nature of the driving force in MD, in synergy with the water repellent characteristic of
the hydrophobic MD membrane, allows for the complete rejection of non-volatile solutes such as
cations, anions, organic macromolecules, colloidal species, etc. Unlike RO, the efficiency of vapor
Page 21
7
transport and water recovery is not significantly affected by feed salinity. Further, lower
temperatures and pressures with respect to those usually used in conventional distillation columns
are generally sufficient to establish considerable transmembrane fluxes, with consequent reduction
of energy costs and mechanical requirements of the membrane. Typical MD feed water
temperatures vary in the range of 35 – 70 ⁰C, thus permitting the efficient recycle of low-grade or
waste heat streams, as well as the use of alternative energy sources (solar, wind, geothermal, etc.).
In addition, the possibility of using plastic equipment also reduces or avoids erosion problems
[29,30].
1.2.1. Mass Transfer in Membrane Distillation
Mass transport in MD can be described using the dusty gas model in terms of series
resistances upon transfer between the bulks of two phases contacting the membrane according to
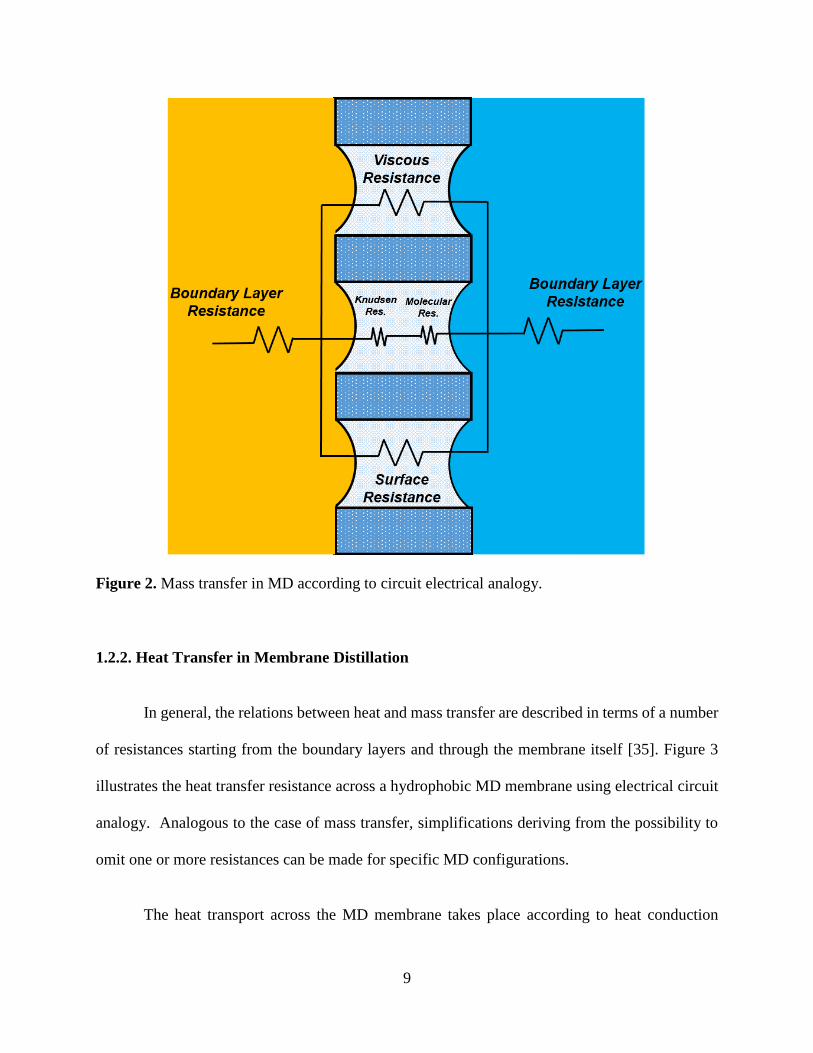
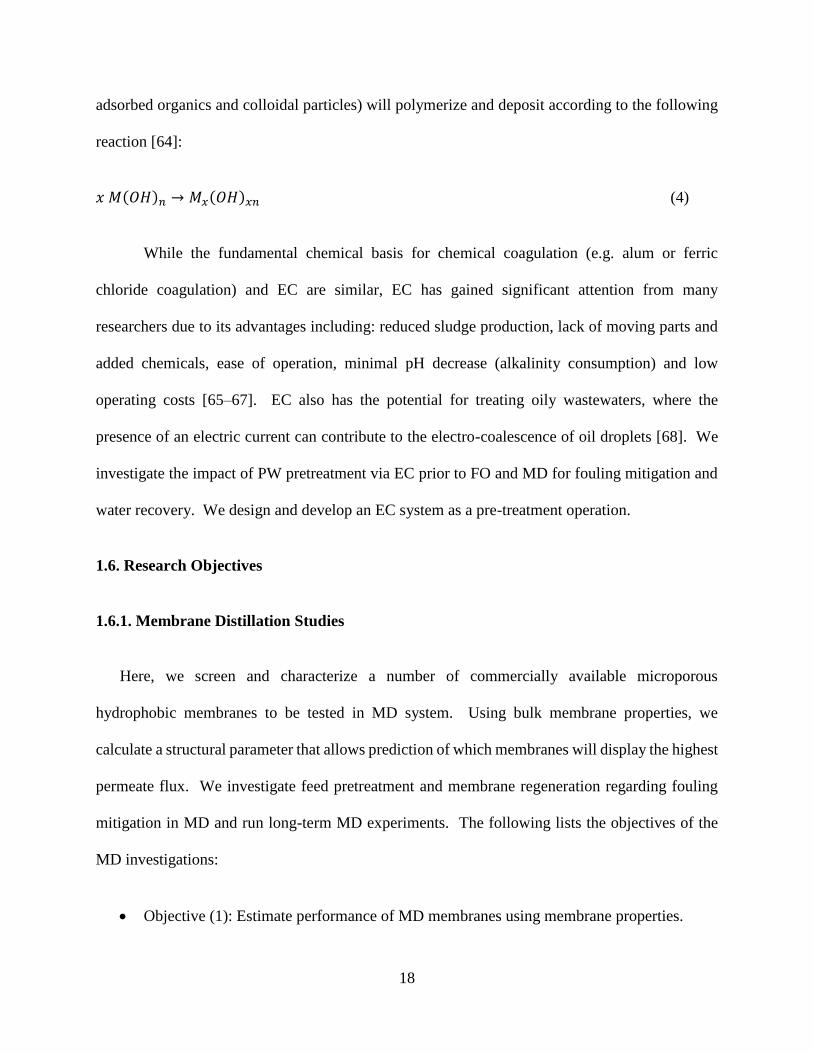
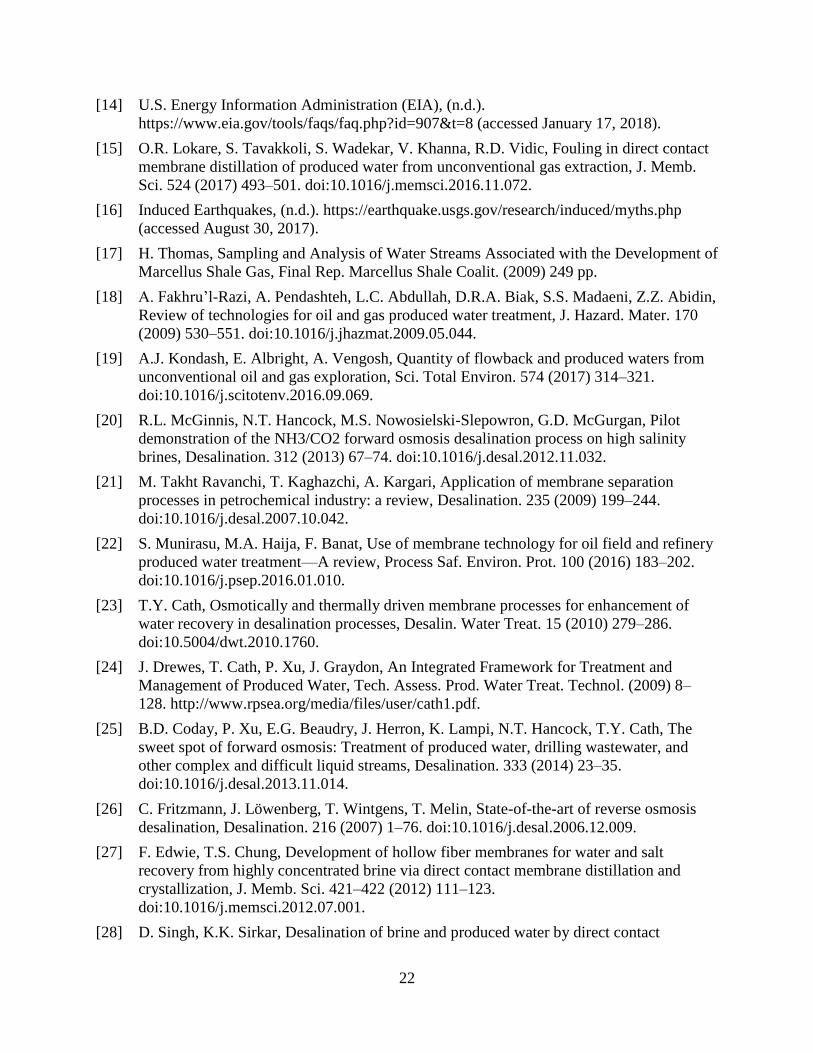
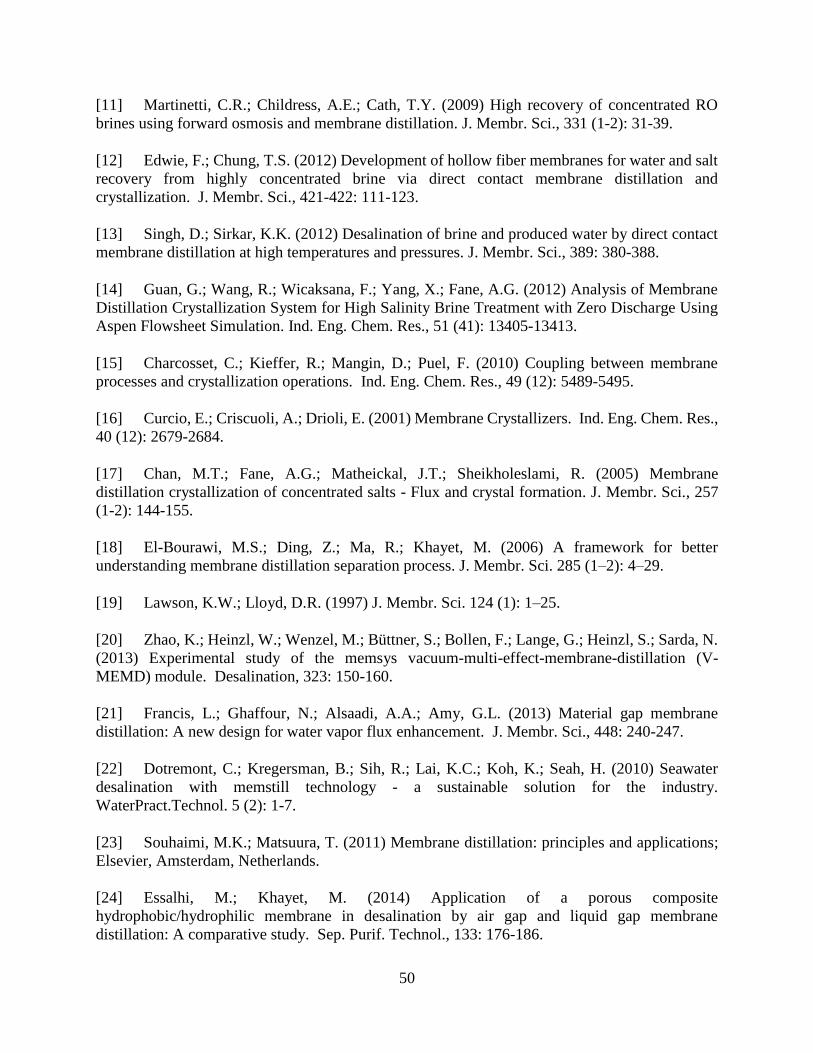
an electrical analogy [31]. Figure 2 presents the possible mass transfer resistances across a
hydrophobic membrane in MD. Mass transfer boundary layers could result in a substantial
contribution to the overall mass transfer resistance. However, molecular and Knudsen diffusion
across the membrane often represents the dominant resistance. The mass transfer resistances
within the membrane thickness are associated with molecular, Knudsen and surface diffusion
mechanisms as well as viscous transport [32].
A number of models have been developed in the literature in order to describe the MD
mass transfer [33]. The differences between these models may be linked to the arrangement of the
transport resistances in the analog circuit. In most cases, one or more of the resistances may be
eliminated. As an example, in most VMD systems the number of molecule-molecule collisions is
negligible compared to the number of molecule-pore wall collisions, as the average pore size of
Page 22
8
the membrane is often significantly smaller than the mean free path of water vapor molecules.
Thus, the molecular diffusion may be eliminated and VMD may be modeled as a Knudsen
diffusion limited process. In addition, resistance to mass transfer on the distillate side can be
omitted in VMD. This resistance is also neglected when MD operates with pure water as distillate
stream in DCMD mode.
For hydrophobic MD membranes with air-filled pores in the range of 0.1 to 0.5 µm,
molecule-pore wall collisions can happen as frequently as molecule-molecule collisions, and the
Knudsen resistance along with molecular resistance may be considered as dominating mass
transfer resistances, while for smaller pore sizes (e.g. < 0.05 µm), molecule-pore wall collisions
mostly occur and Knudsen diffusion will be dominant. As can be seen, a pathway for surface
diffusion is shown in Figure 2, but this mechanism is considered negligible in MD as the surface
diffusion area is relatively small compared to the pore area [34].
Page 23
9
Figure 2. Mass transfer in MD according to circuit electrical analogy.
1.2.2. Heat Transfer in Membrane Distillation
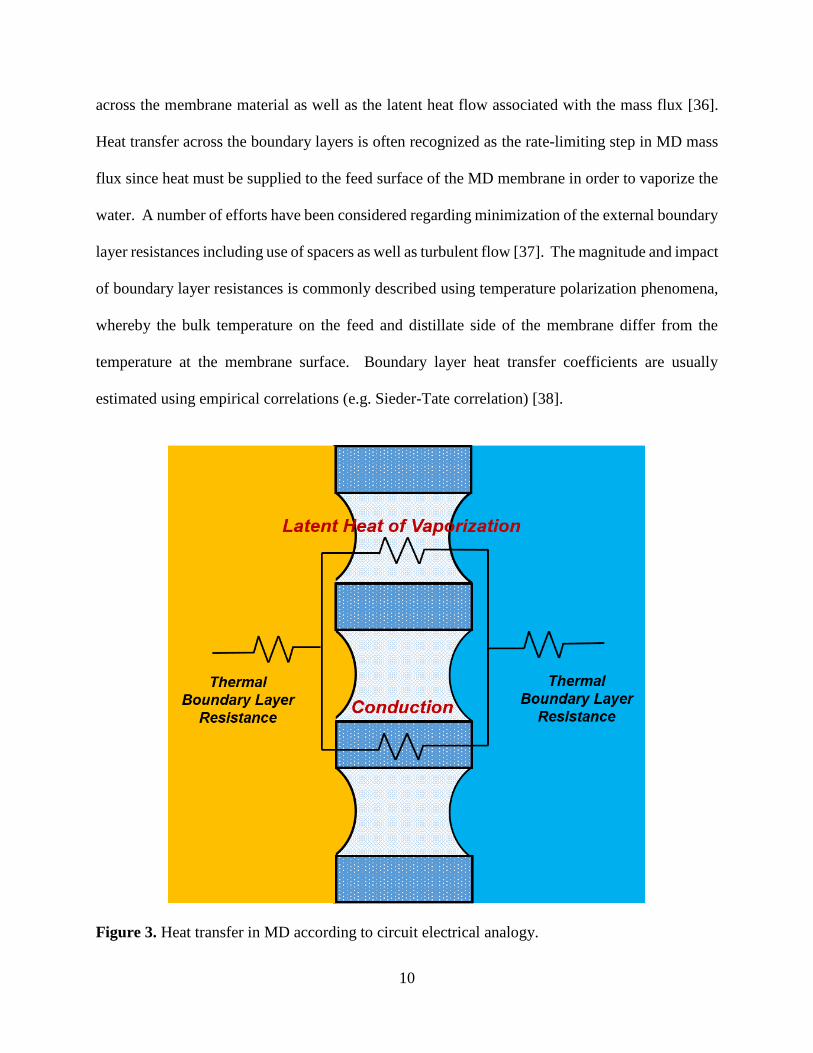
In general, the relations between heat and mass transfer are described in terms of a number
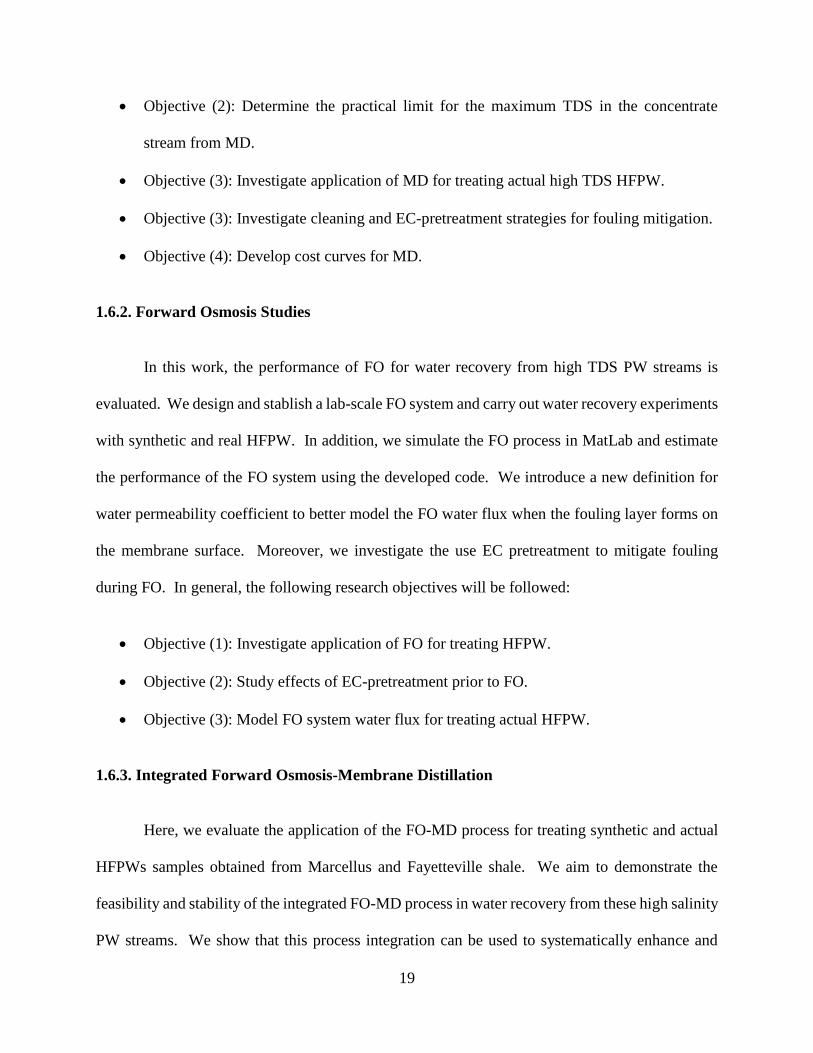
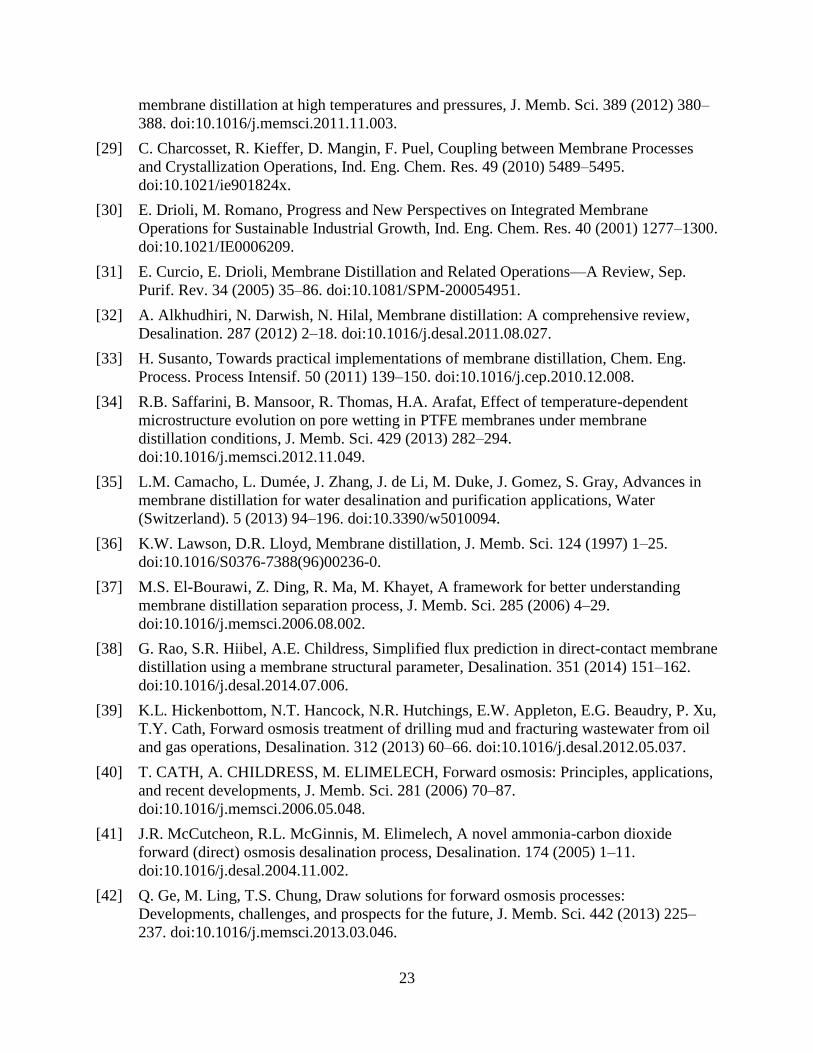
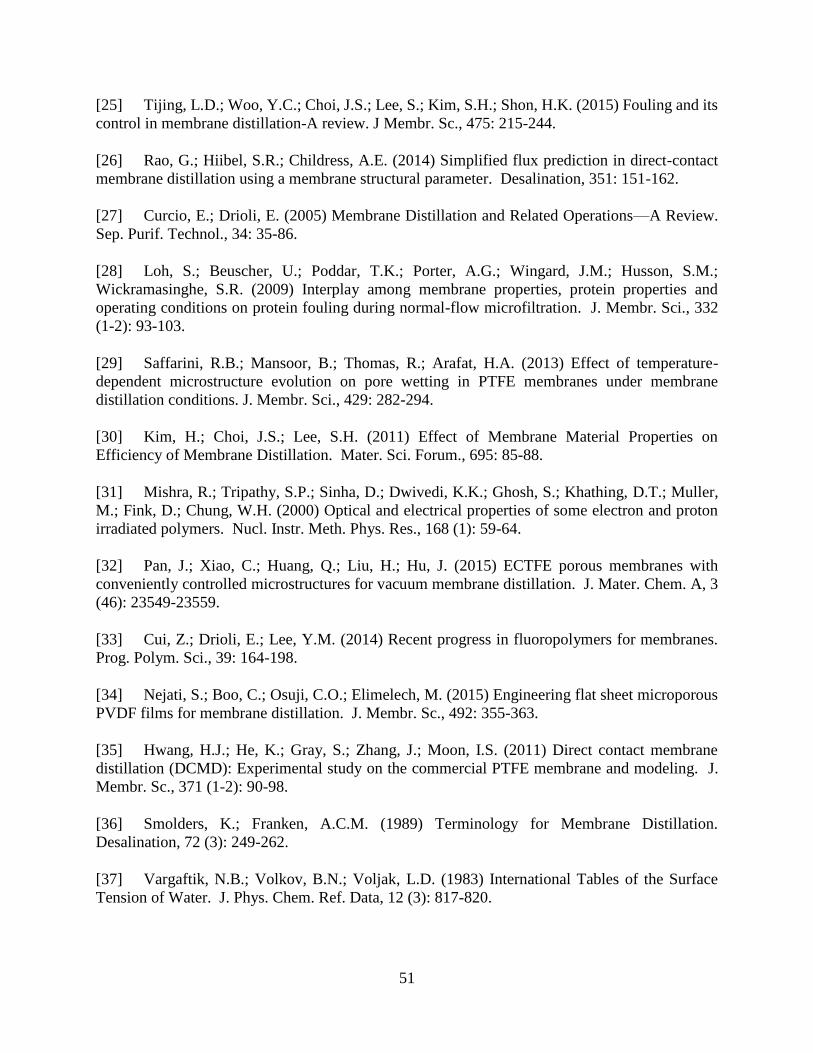
of resistances starting from the boundary layers and through the membrane itself [35]. Figure 3
illustrates the heat transfer resistance across a hydrophobic MD membrane using electrical circuit
analogy. Analogous to the case of mass transfer, simplifications deriving from the possibility to
omit one or more resistances can be made for specific MD configurations.
The heat transport across the MD membrane takes place according to heat conduction
Page 24
10
across the membrane material as well as the latent heat flow associated with the mass flux [36].
Heat transfer across the boundary layers is often recognized as the rate-limiting step in MD mass
flux since heat must be supplied to the feed surface of the MD membrane in order to vaporize the
water. A number of efforts have been considered regarding minimization of the external boundary
layer resistances including use of spacers as well as turbulent flow [37]. The magnitude and impact
of boundary layer resistances is commonly described using temperature polarization phenomena,
whereby the bulk temperature on the feed and distillate side of the membrane differ from the
temperature at the membrane surface. Boundary layer heat transfer coefficients are usually
estimated using empirical correlations (e.g. Sieder-Tate correlation) [38].
Figure 3. Heat transfer in MD according to circuit electrical analogy.
Page 25
11
1.3. Forward Osmosis
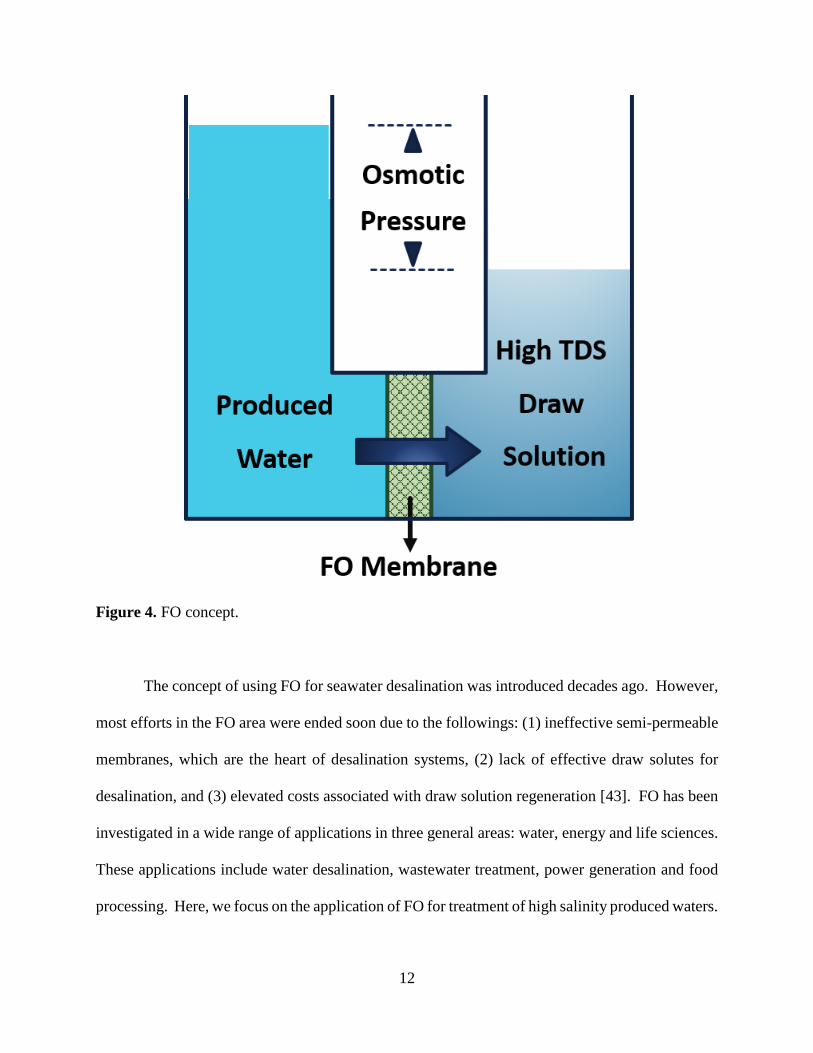
FO has also been proposed as a new membrane-based separation technology for treating
high salinity PWs [39]. Osmosis is defined as the net movement of water across a semi-permeable
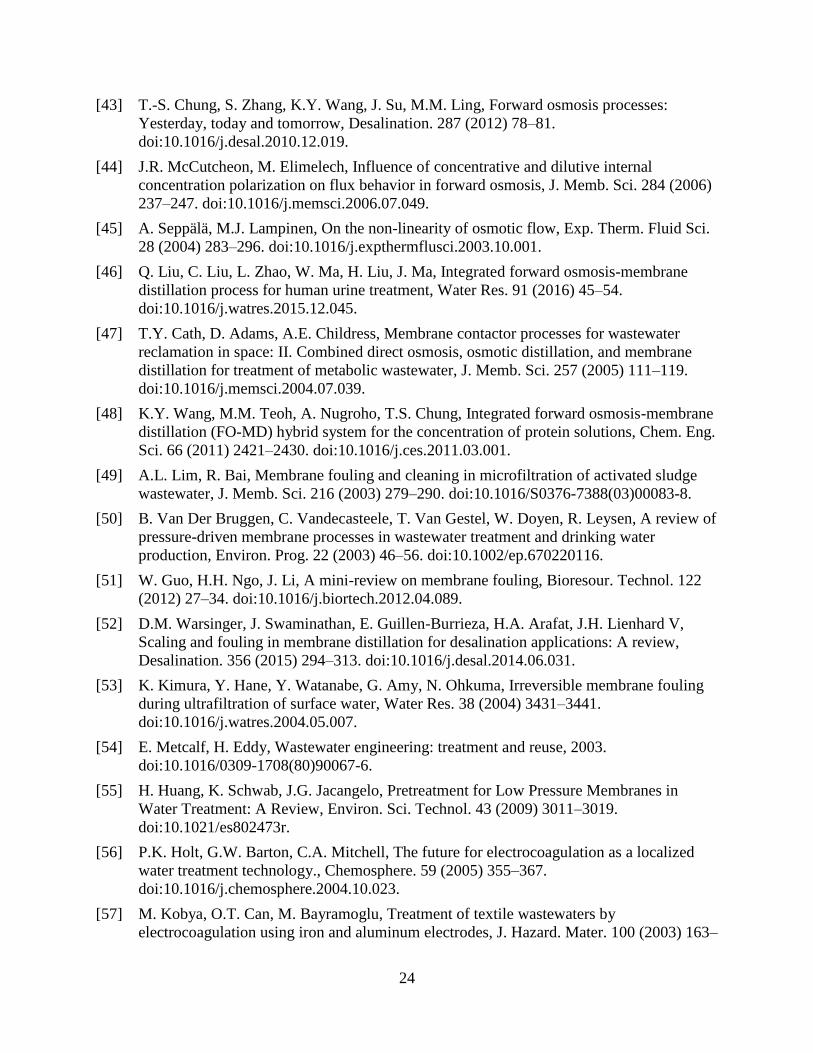
membrane driven by a difference in osmotic pressure across the membrane [40]. In FO, a draw
solution, having a significantly higher osmotic pressure than the feed, flows on the permeate side
of the membrane. Due to the osmotic pressure gradient, water flows from the feed to the draw
solution. Using dense non-porous membranes with rejection properties similar to RO membranes,
the feed solution is concentrated and the draw solution diluted [40,41]. The advantages of FO
include a high rate of water recovery, minimization of brine discharge, low fouling and low energy
consumption [42]. However, the viability of FO depends on efficient regeneration of the draw
solution. The availability of low-grade waste heat during oil and gas extraction and production
activities provides the possibility of using a thermolytic salt such as sodium bicarbonate, as a draw
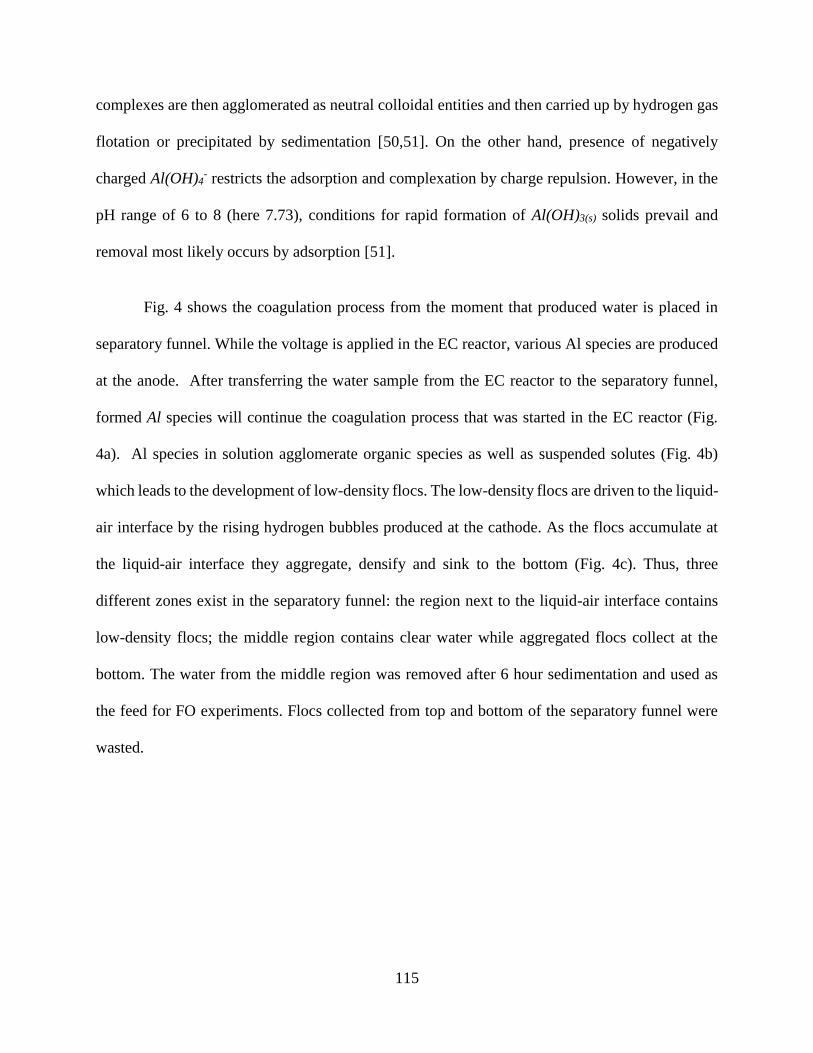
solute, which can be easily regenerated by heating. Figure 4 represents the concept of FO.
Page 26
12
Figure 4. FO concept.
The concept of using FO for seawater desalination was introduced decades ago. However,
most efforts in the FO area were ended soon due to the followings: (1) ineffective semi-permeable
membranes, which are the heart of desalination systems, (2) lack of effective draw solutes for
desalination, and (3) elevated costs associated with draw solution regeneration [43]. FO has been
investigated in a wide range of applications in three general areas: water, energy and life sciences.
These applications include water desalination, wastewater treatment, power generation and food
processing. Here, we focus on the application of FO for treatment of high salinity produced waters.
Page 27
13
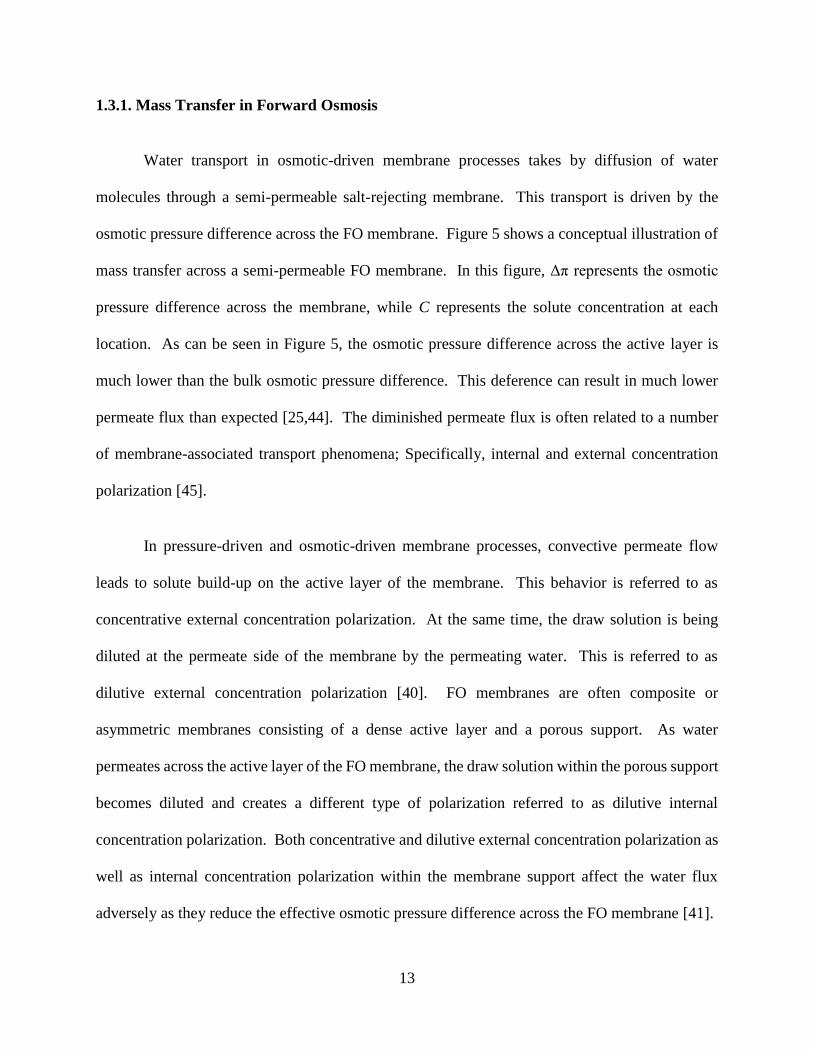
1.3.1. Mass Transfer in Forward Osmosis
Water transport in osmotic-driven membrane processes takes by diffusion of water
molecules through a semi-permeable salt-rejecting membrane. This transport is driven by the
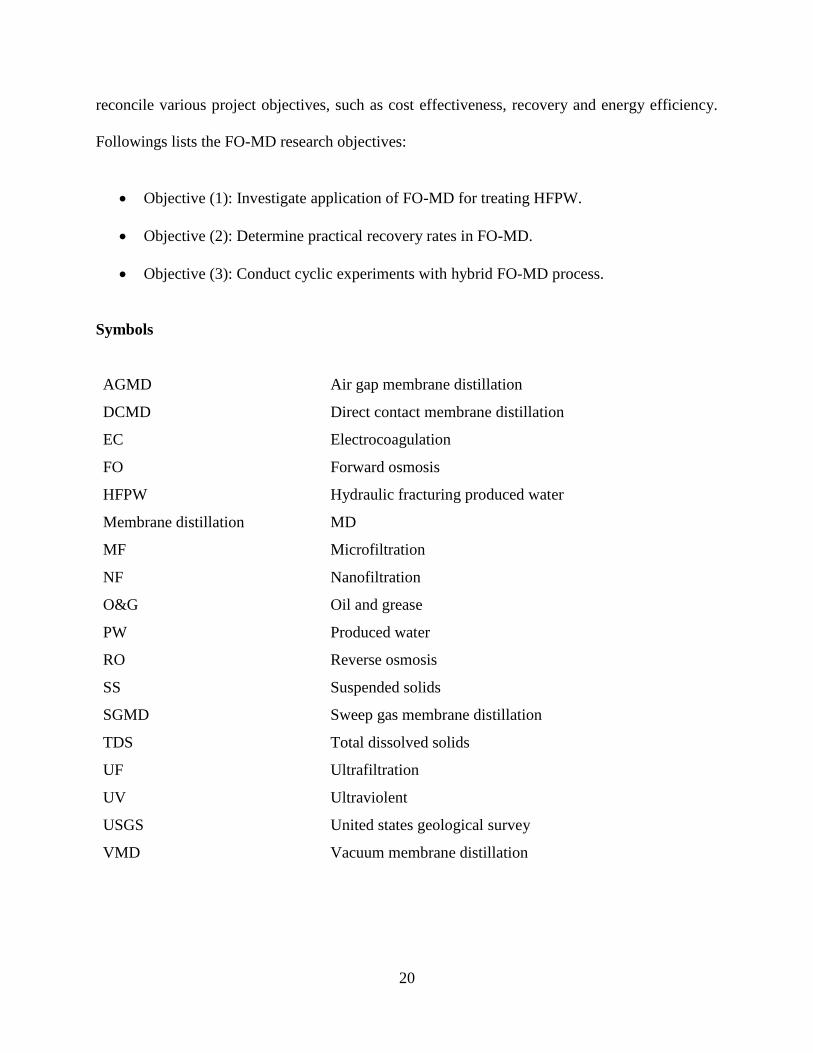
osmotic pressure difference across the FO membrane. Figure 5 shows a conceptual illustration of
mass transfer across a semi-permeable FO membrane. In this figure, Δπ represents the osmotic
pressure difference across the membrane, while C represents the solute concentration at each
location. As can be seen in Figure 5, the osmotic pressure difference across the active layer is
much lower than the bulk osmotic pressure difference. This deference can result in much lower
permeate flux than expected [25,44]. The diminished permeate flux is often related to a number
of membrane-associated transport phenomena; Specifically, internal and external concentration
polarization [45].
In pressure-driven and osmotic-driven membrane processes, convective permeate flow
leads to solute build-up on the active layer of the membrane. This behavior is referred to as
concentrative external concentration polarization. At the same time, the draw solution is being
diluted at the permeate side of the membrane by the permeating water. This is referred to as
dilutive external concentration polarization [40]. FO membranes are often composite or
asymmetric membranes consisting of a dense active layer and a porous support. As water
permeates across the active layer of the FO membrane, the draw solution within the porous support
becomes diluted and creates a different type of polarization referred to as dilutive internal
concentration polarization. Both concentrative and dilutive external concentration polarization as
well as internal concentration polarization within the membrane support affect the water flux
adversely as they reduce the effective osmotic pressure difference across the FO membrane [41].
Page 28
14
Figure 5. Mass transfer in FO.
1.4. Integrated Forward Osmosis-Membrane Distillation
The integrated FO-MD system is a membrane-based hybrid technology [46]. During the
operation of the FO process, the concentration of draw solution decreases due to dilution; thus, the
driving force decreases with the operational time. MD has great potential to be integrated with FO
as it can offer complete rejection of nonvolatile substances in the feed solution. In addition, the
efficiency of the MD process is relatively independent of salt concentration in the feed solution.
Page 29
15
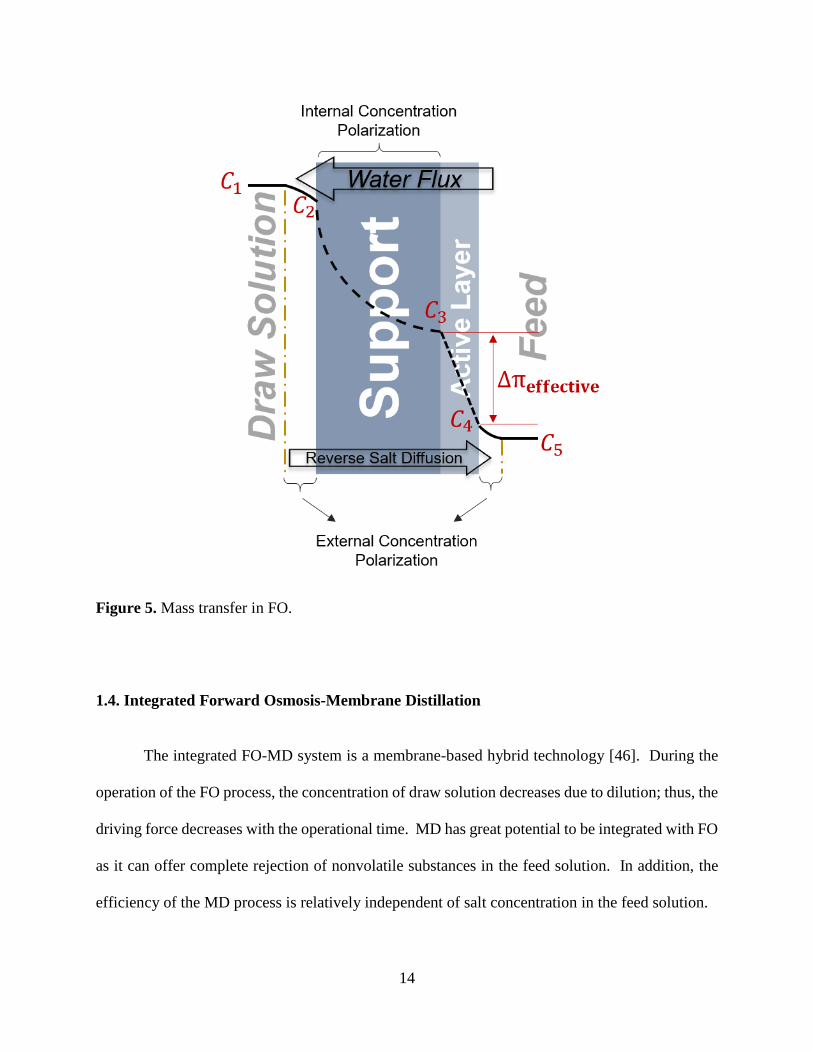
In a FO-MD hybrid system, the FO section draws water from the feed solution, while the
MD process re-concentrates the diluted draw solution and produces pure water. The integration
of FO and MD processes combines the strengths of both processes and can provide high permeate
quality (produced by MD) and low fouling tendency. So far, only a limited number of studies on
FO-MD have been reported for solution concentration and wastewater treatment [47,48]. The
current investigation aims to demonstrate the feasibility and stability of the hybrid FO-MD process
in water recovery from high salinity PW streams. Figure 6 shows the concept of integrated FO-
MD process.
Figure 6. Integrated FO-MD process concept.
1.5. Membrane Fouling and Pretreatment
All membrane processes suffer from fouling. Fouling is one of the main limitations to
faster development of membrane-based processes. Membrane fouling is characterized as a
reduction of permeate flux as a result of increased flow resistance [49]. Fouling is mainly caused
by adsorption of organic material on the membrane surface and/or pore blocking, and by inorganic
Page 30
16
scaling due to the precipitation of minerals [50]. The likelihood of each one of these fouling
mechanisms depends on a number of factors including the nature of the driving force, membrane
characteristics, membrane material, operating conditions, etc. While the immediate effect of
fouling is to cause a reduction in permeate flux, the long-term effects may lead to irreversible
fouling and the reduction of membrane lifetime [51,52]. Various techniques can be used to reduce
membrane fouling including backwashing, air sparing, chemical cleaning and feed pretreatment
[53].
Numerous pretreatment processes have been considered prior to membrane filtration [51].
Biological pretreatment is impractical for treating HFPWs due to long retention times and the low
biodegradability of most of the contaminants [54]. Coagulation, adsorption, preoxidation and
prefiltration are among the most popular pretreatment methods prior to membrane filtration [55].
Chemical pretreatment such as coagulation is frequently used to remove colloidal and organic
matter [55]. Here we focus on electrocoagulation (EC) for removal of colloidal and dissolved
organic compounds that could foul the MD or FO membrane.
1.5.1. Electrocoagulation
EC is an electrochemical method for treating polluted water whereby sacrificial anodes
(here we use aluminum) corrode to release active coagulant precursors into solution [56].
Compared to chemical coagulation e.g. using alum, EC provides a number of advantages including
simple equipment, easy operation, less maintenance, colorless and odorless effluent, low sludge
production and efficient removal of colloidal particles. Flocs formed by EC are similar to chemical
flocs, except that EC flocs tends to be much larger, contain less bound water, are acid-resistant and
more stable, and therefore, can be separated faster [57,58]. Further, in EC, there are no moving
Page 31
17
parts; thus, requiring less maintenance compared to coagulation where efficient mixing is required.
Use of electricity, which can be expensive in many places, and regular replacement of sacrificial
electrodes are two major disadvantages of EC technology [57,59,60]. However, Kobya et al. [57]
indicate that electrical energy consumption of EC decreases dramatically when the wastewater has
higher conductivity due to the presence of dissolved salts. In case of HFPW, the conductivity is
high due to high TDS.
In EC, sacrificial electrodes are utilized to release coagulant counter ions into solution using
electricity. The following electrode reactions occur at the anode, cathode and consequently, in the
solution [61]:
At the anode: 𝑀(𝑠) → 𝑀(𝑎𝑞)𝑛+ + 𝑛𝑒− (1)
At the cathode: 2𝐻2𝑂 + 2𝑒− → 2𝑂𝐻− + 𝐻2 (2)
where M is the electrode metal material (usually Al or Fe). Analogous to chemical coagulation,
the metal and hydroxide ions form various monomeric species such as M(OH)(n-1)+ , M(OH)2(n-2)+
and also polymeric species such as M6(OH)15(6n-15)+ [62,63]. As the solution ‘ages’, polynuclear
complexes develop and amorphous M(OH)n(s) forms in the solution, as given by the following
general scheme, according to complex precipitation kinetics [57]:
In solution: 𝑀(𝑎𝑞)𝑛+ + 𝑛𝑂𝐻− → 𝑀(𝑐𝑜𝑚𝑝𝑙𝑒𝑥) → 𝑀(𝑂𝐻)𝑛(𝑠) (3)
Metal complexes eventually transform to solid M(OH)n(s) with a large surface area that can adsorb
organic compounds, trap suspended particles and form flocs. Finally, M(OH)n(s) flocs (with
Page 32
18
adsorbed organics and colloidal particles) will polymerize and deposit according to the following
reaction [64]:
𝑥 𝑀(𝑂𝐻)𝑛 → 𝑀𝑥(𝑂𝐻)𝑥𝑛 (4)
While the fundamental chemical basis for chemical coagulation (e.g. alum or ferric
chloride coagulation) and EC are similar, EC has gained significant attention from many
researchers due to its advantages including: reduced sludge production, lack of moving parts and
added chemicals, ease of operation, minimal pH decrease (alkalinity consumption) and low
operating costs [65–67]. EC also has the potential for treating oily wastewaters, where the
presence of an electric current can contribute to the electro-coalescence of oil droplets [68]. We
investigate the impact of PW pretreatment via EC prior to FO and MD for fouling mitigation and
water recovery. We design and develop an EC system as a pre-treatment operation.
1.6. Research Objectives
1.6.1. Membrane Distillation Studies
Here, we screen and characterize a number of commercially available microporous
hydrophobic membranes to be tested in MD system. Using bulk membrane properties, we
calculate a structural parameter that allows prediction of which membranes will display the highest
permeate flux. We investigate feed pretreatment and membrane regeneration regarding fouling
mitigation in MD and run long-term MD experiments. The following lists the objectives of the
MD investigations:
Objective (1): Estimate performance of MD membranes using membrane properties.
Page 33
19
Objective (2): Determine the practical limit for the maximum TDS in the concentrate
stream from MD.
Objective (3): Investigate application of MD for treating actual high TDS HFPW.
Objective (3): Investigate cleaning and EC-pretreatment strategies for fouling mitigation.
Objective (4): Develop cost curves for MD.
1.6.2. Forward Osmosis Studies
In this work, the performance of FO for water recovery from high TDS PW streams is
evaluated. We design and stablish a lab-scale FO system and carry out water recovery experiments
with synthetic and real HFPW. In addition, we simulate the FO process in MatLab and estimate
the performance of the FO system using the developed code. We introduce a new definition for
water permeability coefficient to better model the FO water flux when the fouling layer forms on
the membrane surface. Moreover, we investigate the use EC pretreatment to mitigate fouling
during FO. In general, the following research objectives will be followed:
Objective (1): Investigate application of FO for treating HFPW.
Objective (2): Study effects of EC-pretreatment prior to FO.
Objective (3): Model FO system water flux for treating actual HFPW.
1.6.3. Integrated Forward Osmosis-Membrane Distillation
Here, we evaluate the application of the FO-MD process for treating synthetic and actual
HFPWs samples obtained from Marcellus and Fayetteville shale. We aim to demonstrate the
feasibility and stability of the integrated FO-MD process in water recovery from these high salinity
PW streams. We show that this process integration can be used to systematically enhance and
Page 34
20
reconcile various project objectives, such as cost effectiveness, recovery and energy efficiency.
Followings lists the FO-MD research objectives:
Objective (1): Investigate application of FO-MD for treating HFPW.
Objective (2): Determine practical recovery rates in FO-MD.
Objective (3): Conduct cyclic experiments with hybrid FO-MD process.
Symbols
AGMD Air gap membrane distillation
DCMD Direct contact membrane distillation
EC Electrocoagulation
FO Forward osmosis
HFPW Hydraulic fracturing produced water
Membrane distillation MD
MF Microfiltration
NF Nanofiltration
O&G Oil and grease
PW Produced water
RO Reverse osmosis
SS Suspended solids
SGMD Sweep gas membrane distillation
TDS Total dissolved solids
UF Ultrafiltration
UV Ultraviolent
USGS United states geological survey
VMD Vacuum membrane distillation
Page 35
21
References
[1] A. Fakhru’l-Razi, A. Pendashteh, L.C. Abdullah, D.R.A. Biak, S.S. Madaeni, Z.Z. Abidin,
Review of technologies for oil and gas produced water treatment, J. Hazard. Mater. 170
(2009) 530–551. doi:10.1016/j.jhazmat.2009.05.044.
[2] G.T. Tellez, N. Nirmalakhandan, J.L. Gardea-Torresdey, Performance evaluation of an
activated sludge system for removing petroleum hydrocarbons from oilfield produced
water, Adv. Environ. Res. 6 (2002) 455–470. doi:10.1016/S1093-0191(01)00073-9.
[3] C. Clark, J. Veil, Produced Water Volumes and Management Practices in the United
States, Argonne Natl. Lab. Rep. (2009) 64. doi:10.2172/1007397.
[4] K.B. Gregory, R.D. Vidic, D.A. Dzombak, Water management challenges associated with
the production of shale gas by hydraulic fracturing, Elements. 7 (2011) 181–186.
doi:10.2113/gselements.7.3.181.
[5] J. Arthur, B. Langhus, C. Patel, Technical Summary of Oil & Gas Produced Water
Treatment Technologies, Tulsa, Oklahoma, USA, ALL …. (2005) 1–53. http://w.all-
llc.com/publicdownloads/ALLConsulting-WaterTreatmentOptionsReport.pdf.
[6] M. Eftekhardadkhah, K.N. Kløcker, H.H. Trapnes, B. Gaweł, G. Øye, Composition and
Dynamic Adsorption of Crude Oil Components Dissolved in Synthetic Produced Water at
Different pH Values, Ind. Eng. Chem. Res. 55 (2016) 3084–3090.
doi:10.1021/acs.iecr.5b04459.
[7] J. Rubio, M.L. Souza, R.W. Smith, Overview of flotation as a wastewater treatment
technique, Miner. Eng. 15 (2002) 139–155. doi:10.1016/S0892-6875(01)00216-3.
[8] M. Padaki, R. Surya Murali, M.S. Abdullah, N. Misdan, A. Moslehyani, M.A. Kassim, N.
Hilal, A.F. Ismail, Membrane technology enhancement in oil-water separation. A review,
Desalination. 357 (2015) 197–207. doi:10.1016/j.desal.2014.11.023.
[9] M. Owlad, M.K. Aroua, W.A.W. Daud, S. Baroutian, Removal of hexavalent chromium-
contaminated water and wastewater: A review, Water. Air. Soil Pollut. 200 (2009) 59–77.
doi:10.1007/s11270-008-9893-7.
[10] V.K. Gupta, I. Ali, T.A. Saleh, A. Nayak, S. Agarwal, Chemical treatment technologies
for waste-water recycling—an overview, RSC Adv. 2 (2012) 6380.
doi:10.1039/c2ra20340e.
[11] N. Esmaeilirad, K. Carlson, P. Omur Ozbek, Influence of softening sequencing on
electrocoagulation treatment of produced water, J. Hazard. Mater. 283 (2015) 721–729.
doi:10.1016/j.jhazmat.2014.10.046.
[12] A. Vengosh, R.B. Jackson, N. Warner, T.H. Darrah, A. Kondash, A critical review of the
risks to water resources from unconventional shale gas development and hydraulic
fracturing in the United States, Environ. Sci. Technol. 48 (2014) 8334–8348.
doi:10.1021/es405118y.
[13] U.S.E.I. Administration, Technically Recoverable Shale Oil and Shale Gas Resources : An
Assessment of 137 Shale Formations in 41 Countries Outside the United States, U.S.
Energy Inf. Adm. 2013 (2013) 76 pp. doi:www.eia.gov/analysis/studies/worldshalegas/.
Page 36
22
[14] U.S. Energy Information Administration (EIA), (n.d.).
https://www.eia.gov/tools/faqs/faq.php?id=907&t=8 (accessed January 17, 2018).
[15] O.R. Lokare, S. Tavakkoli, S. Wadekar, V. Khanna, R.D. Vidic, Fouling in direct contact
membrane distillation of produced water from unconventional gas extraction, J. Memb.
Sci. 524 (2017) 493–501. doi:10.1016/j.memsci.2016.11.072.
[16] Induced Earthquakes, (n.d.). https://earthquake.usgs.gov/research/induced/myths.php
(accessed August 30, 2017).
[17] H. Thomas, Sampling and Analysis of Water Streams Associated with the Development of
Marcellus Shale Gas, Final Rep. Marcellus Shale Coalit. (2009) 249 pp.
[18] A. Fakhru’l-Razi, A. Pendashteh, L.C. Abdullah, D.R.A. Biak, S.S. Madaeni, Z.Z. Abidin,
Review of technologies for oil and gas produced water treatment, J. Hazard. Mater. 170
(2009) 530–551. doi:10.1016/j.jhazmat.2009.05.044.
[19] A.J. Kondash, E. Albright, A. Vengosh, Quantity of flowback and produced waters from
unconventional oil and gas exploration, Sci. Total Environ. 574 (2017) 314–321.
doi:10.1016/j.scitotenv.2016.09.069.
[20] R.L. McGinnis, N.T. Hancock, M.S. Nowosielski-Slepowron, G.D. McGurgan, Pilot
demonstration of the NH3/CO2 forward osmosis desalination process on high salinity
brines, Desalination. 312 (2013) 67–74. doi:10.1016/j.desal.2012.11.032.
[21] M. Takht Ravanchi, T. Kaghazchi, A. Kargari, Application of membrane separation
processes in petrochemical industry: a review, Desalination. 235 (2009) 199–244.
doi:10.1016/j.desal.2007.10.042.
[22] S. Munirasu, M.A. Haija, F. Banat, Use of membrane technology for oil field and refinery
produced water treatment—A review, Process Saf. Environ. Prot. 100 (2016) 183–202.
doi:10.1016/j.psep.2016.01.010.
[23] T.Y. Cath, Osmotically and thermally driven membrane processes for enhancement of
water recovery in desalination processes, Desalin. Water Treat. 15 (2010) 279–286.
doi:10.5004/dwt.2010.1760.
[24] J. Drewes, T. Cath, P. Xu, J. Graydon, An Integrated Framework for Treatment and
Management of Produced Water, Tech. Assess. Prod. Water Treat. Technol. (2009) 8–
128. http://www.rpsea.org/media/files/user/cath1.pdf.
[25] B.D. Coday, P. Xu, E.G. Beaudry, J. Herron, K. Lampi, N.T. Hancock, T.Y. Cath, The
sweet spot of forward osmosis: Treatment of produced water, drilling wastewater, and
other complex and difficult liquid streams, Desalination. 333 (2014) 23–35.
doi:10.1016/j.desal.2013.11.014.
[26] C. Fritzmann, J. Löwenberg, T. Wintgens, T. Melin, State-of-the-art of reverse osmosis
desalination, Desalination. 216 (2007) 1–76. doi:10.1016/j.desal.2006.12.009.
[27] F. Edwie, T.S. Chung, Development of hollow fiber membranes for water and salt
recovery from highly concentrated brine via direct contact membrane distillation and
crystallization, J. Memb. Sci. 421–422 (2012) 111–123.
doi:10.1016/j.memsci.2012.07.001.
[28] D. Singh, K.K. Sirkar, Desalination of brine and produced water by direct contact
Page 37
23
membrane distillation at high temperatures and pressures, J. Memb. Sci. 389 (2012) 380–
388. doi:10.1016/j.memsci.2011.11.003.
[29] C. Charcosset, R. Kieffer, D. Mangin, F. Puel, Coupling between Membrane Processes
and Crystallization Operations, Ind. Eng. Chem. Res. 49 (2010) 5489–5495.
doi:10.1021/ie901824x.
[30] E. Drioli, M. Romano, Progress and New Perspectives on Integrated Membrane
Operations for Sustainable Industrial Growth, Ind. Eng. Chem. Res. 40 (2001) 1277–1300.
doi:10.1021/IE0006209.
[31] E. Curcio, E. Drioli, Membrane Distillation and Related Operations—A Review, Sep.
Purif. Rev. 34 (2005) 35–86. doi:10.1081/SPM-200054951.
[32] A. Alkhudhiri, N. Darwish, N. Hilal, Membrane distillation: A comprehensive review,
Desalination. 287 (2012) 2–18. doi:10.1016/j.desal.2011.08.027.
[33] H. Susanto, Towards practical implementations of membrane distillation, Chem. Eng.
Process. Process Intensif. 50 (2011) 139–150. doi:10.1016/j.cep.2010.12.008.
[34] R.B. Saffarini, B. Mansoor, R. Thomas, H.A. Arafat, Effect of temperature-dependent
microstructure evolution on pore wetting in PTFE membranes under membrane
distillation conditions, J. Memb. Sci. 429 (2013) 282–294.
doi:10.1016/j.memsci.2012.11.049.
[35] L.M. Camacho, L. Dumée, J. Zhang, J. de Li, M. Duke, J. Gomez, S. Gray, Advances in
membrane distillation for water desalination and purification applications, Water
(Switzerland). 5 (2013) 94–196. doi:10.3390/w5010094.
[36] K.W. Lawson, D.R. Lloyd, Membrane distillation, J. Memb. Sci. 124 (1997) 1–25.
doi:10.1016/S0376-7388(96)00236-0.
[37] M.S. El-Bourawi, Z. Ding, R. Ma, M. Khayet, A framework for better understanding
membrane distillation separation process, J. Memb. Sci. 285 (2006) 4–29.
doi:10.1016/j.memsci.2006.08.002.
[38] G. Rao, S.R. Hiibel, A.E. Childress, Simplified flux prediction in direct-contact membrane
distillation using a membrane structural parameter, Desalination. 351 (2014) 151–162.
doi:10.1016/j.desal.2014.07.006.
[39] K.L. Hickenbottom, N.T. Hancock, N.R. Hutchings, E.W. Appleton, E.G. Beaudry, P. Xu,
T.Y. Cath, Forward osmosis treatment of drilling mud and fracturing wastewater from oil
and gas operations, Desalination. 312 (2013) 60–66. doi:10.1016/j.desal.2012.05.037.
[40] T. CATH, A. CHILDRESS, M. ELIMELECH, Forward osmosis: Principles, applications,
and recent developments, J. Memb. Sci. 281 (2006) 70–87.
doi:10.1016/j.memsci.2006.05.048.
[41] J.R. McCutcheon, R.L. McGinnis, M. Elimelech, A novel ammonia-carbon dioxide
forward (direct) osmosis desalination process, Desalination. 174 (2005) 1–11.
doi:10.1016/j.desal.2004.11.002.
[42] Q. Ge, M. Ling, T.S. Chung, Draw solutions for forward osmosis processes:
Developments, challenges, and prospects for the future, J. Memb. Sci. 442 (2013) 225–
237. doi:10.1016/j.memsci.2013.03.046.
Page 38
24
[43] T.-S. Chung, S. Zhang, K.Y. Wang, J. Su, M.M. Ling, Forward osmosis processes:
Yesterday, today and tomorrow, Desalination. 287 (2012) 78–81.
doi:10.1016/j.desal.2010.12.019.
[44] J.R. McCutcheon, M. Elimelech, Influence of concentrative and dilutive internal
concentration polarization on flux behavior in forward osmosis, J. Memb. Sci. 284 (2006)
237–247. doi:10.1016/j.memsci.2006.07.049.
[45] A. Seppälä, M.J. Lampinen, On the non-linearity of osmotic flow, Exp. Therm. Fluid Sci.
28 (2004) 283–296. doi:10.1016/j.expthermflusci.2003.10.001.
[46] Q. Liu, C. Liu, L. Zhao, W. Ma, H. Liu, J. Ma, Integrated forward osmosis-membrane
distillation process for human urine treatment, Water Res. 91 (2016) 45–54.
doi:10.1016/j.watres.2015.12.045.
[47] T.Y. Cath, D. Adams, A.E. Childress, Membrane contactor processes for wastewater
reclamation in space: II. Combined direct osmosis, osmotic distillation, and membrane
distillation for treatment of metabolic wastewater, J. Memb. Sci. 257 (2005) 111–119.
doi:10.1016/j.memsci.2004.07.039.
[48] K.Y. Wang, M.M. Teoh, A. Nugroho, T.S. Chung, Integrated forward osmosis-membrane
distillation (FO-MD) hybrid system for the concentration of protein solutions, Chem. Eng.
Sci. 66 (2011) 2421–2430. doi:10.1016/j.ces.2011.03.001.
[49] A.L. Lim, R. Bai, Membrane fouling and cleaning in microfiltration of activated sludge
wastewater, J. Memb. Sci. 216 (2003) 279–290. doi:10.1016/S0376-7388(03)00083-8.
[50] B. Van Der Bruggen, C. Vandecasteele, T. Van Gestel, W. Doyen, R. Leysen, A review of
pressure-driven membrane processes in wastewater treatment and drinking water
production, Environ. Prog. 22 (2003) 46–56. doi:10.1002/ep.670220116.
[51] W. Guo, H.H. Ngo, J. Li, A mini-review on membrane fouling, Bioresour. Technol. 122
(2012) 27–34. doi:10.1016/j.biortech.2012.04.089.
[52] D.M. Warsinger, J. Swaminathan, E. Guillen-Burrieza, H.A. Arafat, J.H. Lienhard V,
Scaling and fouling in membrane distillation for desalination applications: A review,
Desalination. 356 (2015) 294–313. doi:10.1016/j.desal.2014.06.031.
[53] K. Kimura, Y. Hane, Y. Watanabe, G. Amy, N. Ohkuma, Irreversible membrane fouling
during ultrafiltration of surface water, Water Res. 38 (2004) 3431–3441.
doi:10.1016/j.watres.2004.05.007.
[54] E. Metcalf, H. Eddy, Wastewater engineering: treatment and reuse, 2003.
doi:10.1016/0309-1708(80)90067-6.
[55] H. Huang, K. Schwab, J.G. Jacangelo, Pretreatment for Low Pressure Membranes in
Water Treatment: A Review, Environ. Sci. Technol. 43 (2009) 3011–3019.
doi:10.1021/es802473r.
[56] P.K. Holt, G.W. Barton, C.A. Mitchell, The future for electrocoagulation as a localized
water treatment technology., Chemosphere. 59 (2005) 355–367.
doi:10.1016/j.chemosphere.2004.10.023.
[57] M. Kobya, O.T. Can, M. Bayramoglu, Treatment of textile wastewaters by
electrocoagulation using iron and aluminum electrodes, J. Hazard. Mater. 100 (2003) 163–
Page 39
25
178. doi:10.1016/S0304-3894(03)00102-X.
[58] E. Butler, Y.-T. Hung, R.Y.-L. Yeh, M. Suleiman Al Ahmad, Electrocoagulation in
Wastewater Treatment, Water. 3 (2011) 495–525. doi:10.3390/w3020495.
[59] M.Y. Mollah, R. Schennach, J.R. Parga, D.L. Cocke, Electrocoagulation (EC)--science
and applications., J. Hazard. Mater. 84 (2001) 29–41. doi:10.1016/S0304-3894(01)00176-
5.
[60] O. Sahu, B. Mazumdar, P.K. Chaudhari, Treatment of wastewater by electrocoagulation:
A review, Environ. Sci. Pollut. Res. 21 (2014) 2397–2413. doi:10.1007/s11356-013-2208-
6.
[61] T. Picard, G. Cathalifaud-Feuillade, M. Mazet, C. Vandensteendam, Cathodic dissolution
in the electrocoagulation process using aluminium electrodes., J. Environ. Monit. 2 (2000)
77–80. doi:10.1039/a908248d.
[62] K. Sardari, P. Fyfe, D. Lincicome, S.R. Wickramasinghe, Aluminum electrocoagulation
followed by forward osmosis for treating hydraulic fracturing produced waters,
Desalination. 428 (2018) 172–181. doi:10.1016/j.desal.2017.11.030.
[63] Electrocoagulation treatment of raw landfill leachate using iron-based electrodes: Effects
of process parameters and optimization, J. Environ. Manage. 204 (2017) 75–81.
doi:10.1016/J.JENVMAN.2017.08.028.
[64] M. Rebhun, M. Lurie, Control of organic matter by coagulation and floc separation, in:
Water Sci. Technol., 1993: pp. 1–20.
[65] Electrocoagulation for the treatment of textile industry effluent – A review, J. Environ.
Manage. 128 (2013) 949–963. doi:10.1016/J.JENVMAN.2013.06.043.
[66] B. Zhu, D.A. Clifford, S. Chellam, Comparison of electrocoagulation and chemical
coagulation pretreatment for enhanced virus removal using microfiltration membranes,
Water Res. 39 (2005) 3098–3108. doi:10.1016/j.watres.2005.05.020.
[67] Electrocoagulation treatment of raw landfill leachate using iron-based electrodes: Effects
of process parameters and optimization, J. Environ. Manage. 204 (2017) 75–81.
doi:10.1016/J.JENVMAN.2017.08.028.
[68] A comprehensive review of electrocoagulation for water treatment: Potentials and
challenges, J. Environ. Manage. 186 (2017) 24–41.
doi:10.1016/J.JENVMAN.2016.10.032.
Page 40
26
Chapter 2. Selecting Membranes for Treating Hydraulic Fracturing Produced Waters by
Membrane Distillation
Abstract
Membrane distillation is an emerging technology for treating highly impaired wastewaters.
Here a number of commercial membranes have been tested. Bulk membrane and surface
properties have been determined. Permeate flux has been determined using model 20,000 ppm
NaCl feed streams. A bulk membrane structural parameter has been defined. The structural
parameter is used to identify membranes that display the highest permeate fluxes. These
membranes were tested with 100,000 ppm NaCl solutions. The maximum feed concentration was
determined. For model low-fouling feed streams, membrane surface properties such as
hydrophobicity and roughness have less effect on permeate flux than bulk membrane properties.
2.1. Introduction
Water is a tremendously valuable natural resource. Thus harnessing new water resources
is of tremendous societal importance [1]. Produced water, water that is co-produced during oil
and gas extraction, is a major source of oily water [2] Production of oil and gas from non-traditional
sources such as tar sands, oil shale and coal bed methane has expanded greatly in recent years.
Development of new horizontal drilling and hydraulic fracturing techniques has led to significant
new energy resources [3]. Hydraulic fracturing produced waters are subset of produced waters
which often have very high salinity. The concentration of total dissolved solids (TDS) can be as
high as 360,000 mg L-1, more than an order of magnitude higher than sea water [4]. Treatment of
Page 41
27
these highly impaired wastewaters is a major challenge due to the presence of high TDS and
organic contaminants [5].
Pressure driven membrane processes such as reverse osmosis are impractical for treating
very high salinity wastewaters due to the high osmotic back pressure that must be overcome.
Desalination technologies that are being investigated include: mechanical vapour compression[6],
electrodialysis [7], ion-concentration-polarization desalination [8], forward osmosis [5],
humidification-dehumidification [9] and membrane distillation [10,11]. Many emerging
technologies such as electrodialysis, forward osmosis and membrane distillation make use of
membranes. Here we focus on membrane distillation.
Treatment of very high TDS feed streams is possible using distillation technologies.
Membrane distillation is a very promising technology for treating high TDS produced water [12].
The hot produced water flows on one side of a hydrophobic microporous membrane. The
membrane acts as a thermal insulator as well as a physical barrier between the hot feed and the
cold distillate that flow on opposite sides of the membrane. Water vaporizes from the hot feed
passes through the membrane pores and condenses on the distillate side [13]. The vapor pressure
difference across the membrane is the driving force for vapor transport [14]. Unlike reverse
osmosis, the efficiency of vapor transport is not significantly affected by the feed TDS. Further
low-grade heat, often a by-product of oil and gas production, can be used to heat the feed stream.
Unlike conventional distillation it is not necessary to boil the entire feed. As long as a vapour
pressure gradient exists between the feed and permeate sides, water vapour will pass from the feed
to the permeate through the gas filled membrane pores.
Page 42
28
Several investigators have considered the use of membrane distillation to treat highly
concentrated feed streams [15-17]. Because dissolved salts are nonvolatile very high TDS feed
streams could be concentrated (in theory) to the solubility limit. In practice, like all membrane
based separation processes, fouling of the membrane by precipitation of dissolved salts as well as
adsorption of organic species present in the wastewater will compromise membrane performance.
Numerous membrane distillation configurations have been described [18-24]. Here we focus on
direct contact membrane distillation where the microporous membrane is in direct contact with
both feed and permeate streams.
One of the major impediments for commercialization of membrane distillation is the lack
of optimized membranes. Maximizing permeate flux and minimizing fouling are essential when
selecting a membrane. In general, membranes should display high hydrophobicity, high porosity,
a uniform pore size with a narrow distribution, low tortuosity and thickness in order to maximize
permeate flux and minimize fouling [25]. Rao et al. [26] indicate that ideal membrane properties
will depend on the particular application. Here we focus on concentration of high TDS feed
streams where fouling by dissolved organics as well precipitation of dissolved salts on the
membrane surface are concerns. The presence of surfactants can lead to a reduced surface tension
of the feed. These effects can lead to wetting of the membrane pores followed by direct passage
of the feed through the membrane pores compromising performance [5, 19, 27]. Similar to
pressure driven filtration processes, membrane performance depends on the interplay between feed
properties, membrane properties and operating conditions [28]. Consequently, selection of an
appropriate membrane for a membrane distillation process is complicated.
Page 43
29
If the same feed and operating conditions are used to screen a variety of membranes,
performance should depend only on the membrane properties. Previous investigators have
attempted to develop a bulk membrane structural parameter that can be used to predict membrane
performance [18, 29, 30]. Rao et al. [26] have investigated the feasibility of developing a
membrane structural parameter in order to predict the permeate flux during direct contact
membrane distillation. The structural parameter they proposed depends only on bulk membrane
properties. Thus, membrane surface properties such as hydrophobicity and roughness are assumed
to be less significant. However when treating high TDS feed streams, as is the case here,
suppression of precipitation by salts and fouling by dissolved organics is likely to be dependent on
membrane surface properties
Here we have screened a number of commercially available microporous hydrophobic
membranes. We have characterized membrane surface as well as bulk properties. Using bulk
membrane properties we calculate a structural parameter that predicts which membranes will
display the highest permeate flux. Permeate fluxes were determined for all membranes using a
model feed stream containing a 20,000 ppm (0.34 M) NaCl. We have compared the observed
permeate fluxes with values obtained for the structural parameter. Importantly, we have
experimentally validated the applicability of the structural parameter over a large range of
membrane properties. Next membranes that displayed the highest permeate fluxes were
challenged with feed streams containing 100,000 ppm (1.7 M) NaCl. The feed stream was
concentrated until the permeate flux rose quickly with a concurrent rapid increase in conductivity
of the permeate above 50 µS cm-1 indicating the passage of the feed through the membrane pores.
Our results suggest a semi-quantitative method based on membrane bulk and surface properties,
for selecting appropriate membranes for treating high TDS produced water streams.
Page 44
30
2.2. Material and Methods
2.2.1. Bulk Membrane Properties
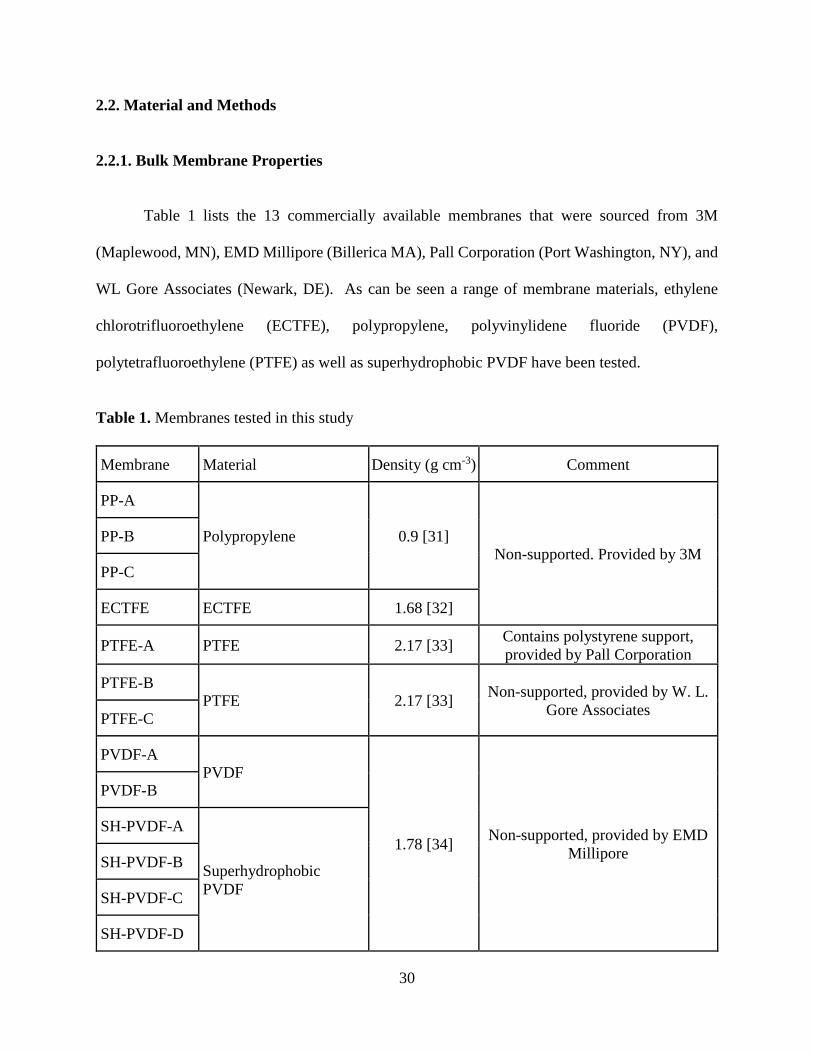
Table 1 lists the 13 commercially available membranes that were sourced from 3M
(Maplewood, MN), EMD Millipore (Billerica MA), Pall Corporation (Port Washington, NY), and
WL Gore Associates (Newark, DE). As can be seen a range of membrane materials, ethylene
chlorotrifluoroethylene (ECTFE), polypropylene, polyvinylidene fluoride (PVDF),
polytetrafluoroethylene (PTFE) as well as superhydrophobic PVDF have been tested.
Table 1. Membranes tested in this study
Membrane Material Density (g cm-3) Comment
PP-A
Polypropylene 0.9 [31] Non-supported. Provided by 3M
PP-B
PP-C
ECTFE ECTFE 1.68 [32]
PTFE-A PTFE 2.17 [33] Contains polystyrene support,
provided by Pall Corporation
PTFE-B PTFE 2.17 [33]
Non-supported, provided by W. L.
Gore Associates PTFE-C
PVDF-A PVDF
1.78 [34] Non-supported, provided by EMD
Millipore
PVDF-B
SH-PVDF-A
Superhydrophobic
PVDF
SH-PVDF-B
SH-PVDF-C
SH-PVDF-D
Page 45
31
2.2.1.1. Porosity
The porosity of the barrier layer was determined using the method described by Nejati et
al. [34]. Briefly, for the supported PTFE membrane (Table 1) the support was initially removed.
An approximately 50 cm2 sample of each membrane was submerged in a 50 mL beaker filled with
isopropanol. The beaker was sonicated for 2 hours. The membrane surface was dried to remove
the excess isopropanol. The membrane was placed on a balance and the change in weight was
recorded as a function of time. The point at which rate of evaporation changed was assumed to be
the point where all the isopropanol on the membrane surface had evaporated and evaporation of
isopropanol from the membrane pores commenced. It was assumed that once the mass of the
membrane did not change over a 30 min period, all the isopropanol in the membrane pores had
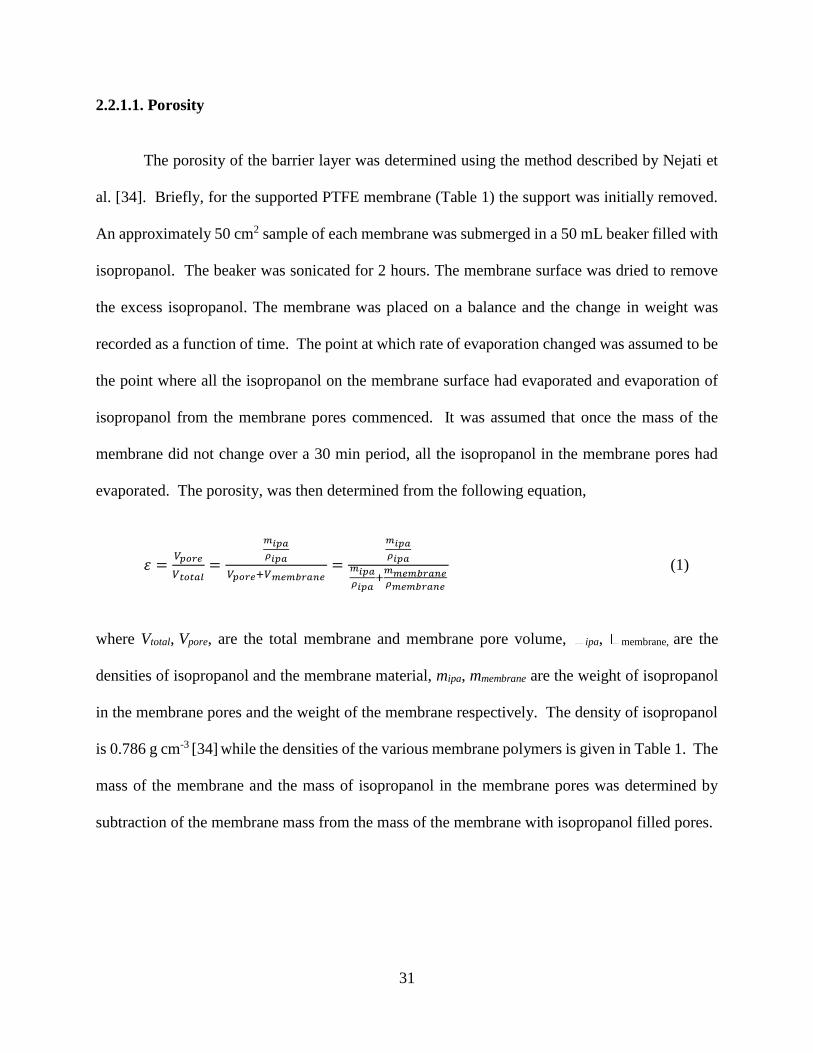
evaporated. The porosity, was then determined from the following equation,
휀 =𝑉𝑝𝑜𝑟𝑒
𝑉𝑡𝑜𝑡𝑎𝑙=
𝑚𝑖𝑝𝑎
𝜌𝑖𝑝𝑎
𝑉𝑝𝑜𝑟𝑒+𝑉𝑚𝑒𝑚𝑏𝑟𝑎𝑛𝑒=
𝑚𝑖𝑝𝑎
𝜌𝑖𝑝𝑎𝑚𝑖𝑝𝑎
𝜌𝑖𝑝𝑎+
𝑚𝑚𝑒𝑚𝑏𝑟𝑎𝑛𝑒𝜌𝑚𝑒𝑚𝑏𝑟𝑎𝑛𝑒
(1)
where Vtotal, Vpore, are the total membrane and membrane pore volume, ipa, membrane, are the
densities of isopropanol and the membrane material, mipa, mmembrane are the weight of isopropanol
in the membrane pores and the weight of the membrane respectively. The density of isopropanol
is 0.786 g cm-3 [34] while the densities of the various membrane polymers is given in Table 1. The
mass of the membrane and the mass of isopropanol in the membrane pores was determined by
subtraction of the membrane mass from the mass of the membrane with isopropanol filled pores.
Page 46
32
2.2.1.2. Thickness
Scanning Electron Microscopy (SEM) using a Nova Nanolab 200 Duo-Beam Workstation
(FEI, Hillsboro, Oregon) was used to obtain cross sectional images of the membranes. Membranes
were fractured using liquid nitrogen. These images were used to determine the membrane
thickness.
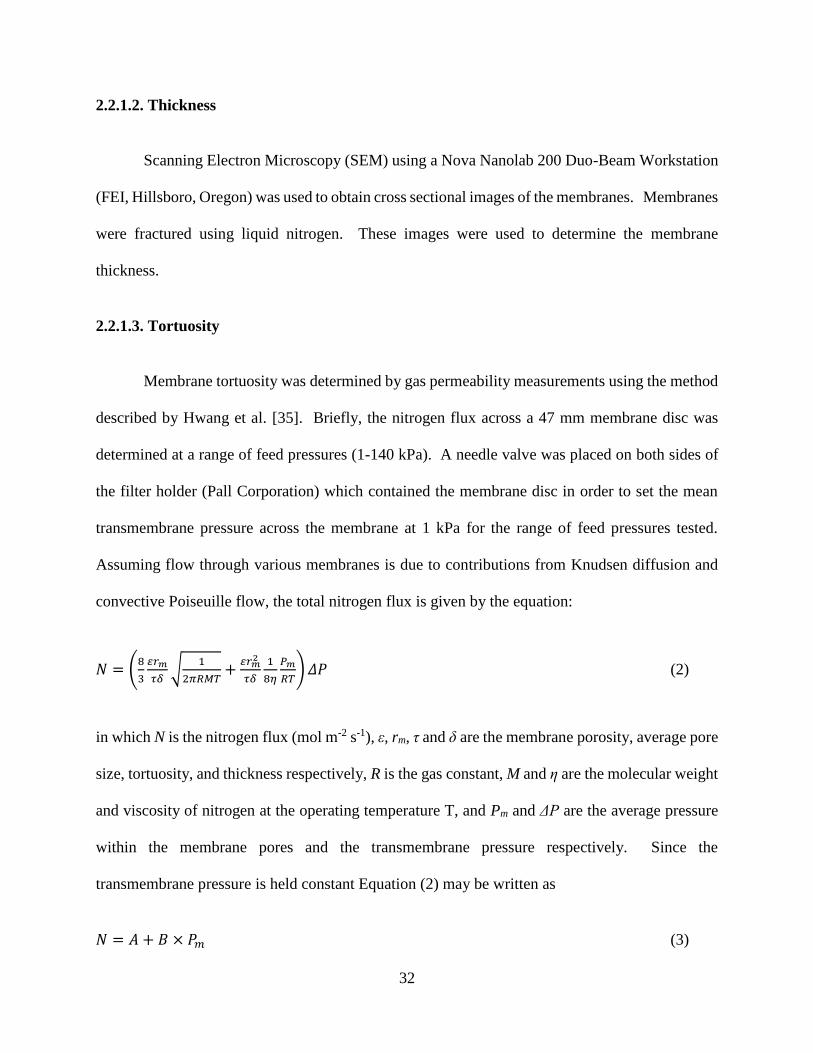
2.2.1.3. Tortuosity
Membrane tortuosity was determined by gas permeability measurements using the method
described by Hwang et al. [35]. Briefly, the nitrogen flux across a 47 mm membrane disc was
determined at a range of feed pressures (1-140 kPa). A needle valve was placed on both sides of
the filter holder (Pall Corporation) which contained the membrane disc in order to set the mean
transmembrane pressure across the membrane at 1 kPa for the range of feed pressures tested.
Assuming flow through various membranes is due to contributions from Knudsen diffusion and
convective Poiseuille flow, the total nitrogen flux is given by the equation:
𝑁 = (8
3
𝑟𝑚
𝜏𝛿√
1
2𝜋𝑅𝑀𝑇+
𝑟𝑚2
𝜏𝛿
1
8𝜂
𝑃𝑚
𝑅𝑇) 𝛥𝑃 (2)
in which N is the nitrogen flux (mol m-2 s-1), ε, rm, τ and δ are the membrane porosity, average pore
size, tortuosity, and thickness respectively, R is the gas constant, M and η are the molecular weight
and viscosity of nitrogen at the operating temperature T, and Pm and ΔP are the average pressure
within the membrane pores and the transmembrane pressure respectively. Since the
transmembrane pressure is held constant Equation (2) may be written as
𝑁 = 𝐴 + 𝐵 × 𝑃𝑚 (3)
Page 47
33
where A and B are constants given by
𝐴 =8
3
𝑟𝑚
𝜏𝛿∆𝑃√
1
2𝜋𝑅𝑀𝑇 (4)
𝐵 =𝑟𝑚
2
𝜏𝛿
1
8𝜂
∆𝑃
𝑅𝑇 (5)
Plotting nitrogen flux versus the average pressure within the pores should result in a straight line.
If the thickness and porosity are known, then the average membrane pore size and tortuosity can
be calculated.
2.2.1.4. Liquid Entry Pressure (LEP)
Liquid entry pressure was determined as described by Smolder and Franken[36]. Briefly
the LEP of the 13 membranes tested here was measured using a Sterlitech HP4750 (Kent, WA)
stainless steel cell at 20 ˚C. The cell was filled with deionized water and pressurized to 13.8 kPa.
The feed side pressure was gradually increased at 13.8 kPa min-1. The LEP is the pressure at which
a continuous flow of DI water through the membrane is first observed. Since water will begin to
flow through the largest pores first, the Laplace Equation may be used to determine the maximum
pore size:
𝑑𝑚𝑎𝑥 = 4𝛾 cos 𝜃
∆𝑃 (6)
where 𝑑𝑚𝑎𝑥 is the maximum pore diameter, γ is the surface tension of water (72.75 dyne cm-1 at
20 °C [37]) and θ is the contact angle. Since the permeate side is at atmospheric pressure, the
transmembrane pressure P, is the LEP.
Page 48
34
2.2.2. Membrane Surface Properties
2.2.2.1. Contact Angle
Static contact angles were measured using a sessile drop contact angle goniometer (Model
100, Rame-Hart Instrument Company, Netcong, NJ). A deionized water droplet (5 μL) at a rate
of 1 μL/s was formed on the tip of a microsyringe (Hamilton, Reno, NV). The microsyringe was
moved down vertically towards the sample until it made the contact with the sample. Then, the
syringe was moved up and detached from the droplet. Using the circle fitting method, the angle
made between the left and right hand side of the water droplet and the membrane surface was
measured every 0.1 seconds. For each membrane, data were collected for 5 seconds at five
locations and averaged.
2.2.2.2. Atomic Force Microscopy (AFM)
Surface roughness was characterized by AFM using a Dimension Icon (Bruker
Corporation, MA) in ScanAsyst mode, was used to probe the roughness. Bruker's ScanAsyst-
AIR probes (0.4 N/m, 2 nm radius) were used. The scan rate was set for 1 Hz with a resolution of
256 samples per line. After scanning, the image was first processed with a third order flatten with
Bruker’s nanoscope analysis program (v 1.5 R3). Roughness was then calculated by the nanoscope
analysis program.
2.2.3. Direct Contact Membrane Distillation
All 13 membranes listed in Table 1 were tested using artificial feeds stream consisting of
20,000 ppm NaCl in DI water, conductivity < 10 µS cm-1 and resistance > 18.5 MΩ obtained from
Page 49
35
a Labconco (Kansas City, MO) water purification system. Figure 1(a) gives the experimental set
up while Figure 2(b) shows the custom-built DCMD module. The module was made of 0.054 m
thick PTFE slab. Two channels with length and width of 0.1 and 0.05 m and depth of 2 mm were
carved in each side of the cell. PTFE shims and spacers (ET 8700, Industrial Netting, Minneapolis,
MN) were used to ensure the brine and distillate streams mixed in the module and membrane does
not deform when exposed to high flow rates. Two silicone O-rings where located on the edge of
the channels, and the cell was sandwiched between two plates in a membrane holder, as shown in
Figure 1(b). The active membrane surface area was 40 cm2.
The feed and permeate streams were circulated in countercurrent mode on opposite sides
of the membrane by means of two peristaltic pumps (Masterflex I/P, Cole Parmer, Vernon Hills,
IL). Three feed flow rates; 0.25, 0.5 and 0.9 L min-1 were investigated. The temperature of the
feed and permeate streams was kept at 60 and 20 ̊C, respectively. A custom-made level controlled
tank with capacity of 1.5 liters was employed as the feed tank. The level controller in this tank
was connected to a third peristaltic pump (Masterflex L/S Digital Standard Drive, Cole Parmer).
As permeate was collected in the permeate reservoir, the NaCl concentration in the feed tank
increased. In order to ensure a constant NaCl concentration in the feed, the third pump added DI
water to the feed tank. The permeate flux was calculated based on the rate of DI water addition to
the feed tank. The conductivity of the permeate was recorded using a conductivity meter (VWR,
Radnor, PA). Each test continued for approximately 12 hours and average water fluxes are
reported.
The membranes that displayed the highest fluxes for 20,000 ppm NaCl feed streams, were
challenged with artificial 100,000 ppm NaCl stream. The membranes were tested in concentration
Page 50
36
mode where the make-up water added by the third pump also consisted of 100,000 ppm NaCl in
DI water. Each experiment was run until the conductivity of the permeate increased rapidly above
50 S cm-1 with a concurrent rapid increase in permeate flux.
Figure 1. (a) Schematic diagram of DCMD Apparatus; (b) DCMD cell; the cell is sandwiched
between the stainless steel membrane holder.
Page 51
37
2.3. Results and Discussions
Tables 2 and 3 summarize the results from the various membrane characterization studies
that have been conducted. The membranes are listed in groups that correspond to the membrane
polymer. Within each group membranes are listed in order of increasing porosity. All the
membranes are highly porous with porosity values ranging from 0.69 to 0.81 (see table 2, column
2). In the porosity calculations it was assumed that the density of super-hydrophobic PVDF is the
same as PVDF. Since super-hydrophobicity involves modifying the membrane surface it is likely
that these modifications have little influence on the bulk membrane polymer density.
The second column in Table 2 gives the measured membrane thicknesses from cross-
sectional SEM analysis (see supporting documents for SEM images). As can be seen the thickness
of the membrane varies considerably from 13 to 145 µm. The thickness reported for the supported
PTFE membrane (PTFE-A) is the thickness of the PTFE barrier layer only and not the polystyrene
support structure. While the thickness of the PVDF membranes are similar, the thickness of the
polypropylene and PTFE membranes show considerable variability.
Table 2. Bulk membrane properties.
Membrane Porosity
(ε)
Thickness
(δ)
(µm)
dmean
Gas
Permeation
(µm)
dmax
LEP
(µm)
Structural
factor ε
τδ⁄
Tortuosity
(τ)
LEP
(kPa)
PP-A 0.70 73 0.11 2.18 3370 2.84 540
PP - B 0.76 135 0.16 6.13 4330 1.45 260
PP - C 0.79 110 0.35 5.02 5970 1.29 280
ECTFE 0.71 82 0.18 3.49 7400 3.29 330
PTFE-A 0.77 36 0.20 3.33 13300 1.61 540
Page 52
38
Table 2. Bulk membrane properties (Cont.)
Membrane Porosity
(ε)
Thickness
(δ)
(µm)
dmean
Gas
Permeation
(µm)
dmax
LEP
(µm)
Structural
factor ε
τδ⁄
Tortuosity
(τ)
LEP
(kPa)
PTFE-B 0.78 13 0.10 4.22 16300 3.67 365
PTFE-C 0.81 73 0.25 5.84 7150 1.55 290
PVDF-A 0.69 97 0.24 5.51 2880 2.47 225
PVDF-B 0.71 119 0.63 12.89 2700 2.21 100
SH-PVDF-A 0.69 91 0.14 2.61 2500 3.02 580
SH-PVDF-B 0.69 110 0.22 4.39 3120 2.01 400
SH-PVDF-C 0.7 105 0.64 6.50 2520 2.64 240
SH-PVDF-D 0.72 112 1.30 12.62 2760 2.31 120
Table 3. Membrane surface properties.
Membrane Contact Angle (°) Rmax (nm)
PP-A 127 274
PP-B 135 404
PP-C 142 546
ECTFE 130 711
PTFE-A 154 296
PTFE-B 140 182
PTFE-C 147 357
PVDF-A 128 578
PVDF-B 130 605
SH-PVDF-A 139 774
SH-PVDF-B 151 524
SH-PVDF-C 140 504
SH-PVDF-D 139 187
Page 53
39
Mean membrane pore sizes, determined by gas permeation measurements as well as the
maximum pore diameter measured by LEP measurements are given in columns 4 and 5 in Table
2. As can be seen, the maximum pore size is significantly greater than the average pore size
indicating the existence of a pore size distribution. The PVDF and superhydrophobic PVDF
membranes (all membranes supplied by EMD Millipore) display an increasing average and
maximum pore size with increasing porosity. However, the same is not true for the polypropylene
and PTFE membranes which also display considerable variability in thickness. The observed
differences are probably due to different manufacturing procedures used for the various
polypropylene and PTFE membranes [38].
Columns 6 and 7 give the value of the bulk membrane structural parameter and the
tortuosity. The parameter is often used as a structural parameter to describe bulk membrane
properties. As can be seen, there is significant variability in the structural parameter. From Table
2 the largest values of the membrane structural parameter are as follows: PTFE-B, 16,340; PTFE-
A 13,300; ECTFE, 7,400; PTFE-C, 7,150 and PP-C, 5970. The very large values of the membrane
structural parameters for PTFE-B and PTFE-A are due to their very low thickness. All the
membranes display tortuosity factors between 1.29 and 3.67. The variability is greatest for the
polypropylene and PTFE membranes again suggesting different manufacturing procedures for the
various polypropylene and PTFE membranes.
Rao et al. [26] have summarized the many bulk membrane structural parameters that have
been proposed for prediction of membrane fluxes. Many of these bulk membrane structural
parameters have been proposed by developing empirical correlations of membrane flux with bulk
membrane properties such as thickness, tortuosity, porosity and average pore size. However, three
Page 54
40
commonly used bulk membrane structural parameters can be related to different mass transport
mechanism through the membrane.
If convective flow dominates, the Hagen Poiseuille equation for laminar flow is often
assumed. The bulk membrane structural parameter that results from this equation is 𝑟2𝜖
𝜏𝛿 where r
is the average pore radius. If Brownian or Knudsen diffusion dominate the bulk membrane
structural parameters that arise are 𝜖
𝜏𝛿 and
𝑟𝜖
𝜏𝛿 respectively. In the case of water vapor transport
through microporous membranes, Brownian diffusion is expected to dominate [39]. Thus we have
chosen to use the bulk membrane structural parameter 𝜖
𝜏𝛿 given in the 6th column of Table 1. As
can be seen the value of this parameter varies greatly from 2,500 to over 16,000. The greater the
porosity and the lower the thickness and tortuosity of the membrane, the greater the value of this
structural parameter, and the greater the expected permeate flux, as a result. It can be noted that
the pore size of the membrane does not appear in the structural parameter as it is assumed that
Brownian diffusion dominates. Rao et al. [26] show that the structural parameter 𝜖
𝜏𝛿 gives one of
the best correlations to experimental flux data. However the correlation coefficient is only 0.71.
This highlights the fact that use of a bulk membrane structural parameter has a number of implicit
assumptions e.g. membrane surface properties are less important, the membrane pore size
distribution is such that transport is dominated by Brownian diffusion etc.
Tortuosity values show variations from about 1.29 to 3.67 (see table 2, column 7). Cussler
[40] indicates that typical tortuosity values range for 2 to 6. Our results are in general agreement
with this observation. Tortuosity values for the PVDF and superhydrophobic PVDF membranes
are similar while they vary considerably for the polypropylene and PTFE membranes. This is not
unexpected given the observed variation in thickness of these membranes.
Page 55
41
The final column in Table 2 gives the LEP. As expected, from Equation (2) lower liquid
entry pressures correspond to larger maximum pore sizes. While the membrane pore size does not
appear in the bulk structural parameter, it will affect the onset of leakage of water through the
pores as a result of fouling due to adsorption organics and dissolved salts.
Table 3 gives data on membrane surface properties. Membrane contact angles (column 2)
vary from 127 to 154 indicating all the membranes are hydrophobic. The superhydrophobic
membranes display contact angles similar to the PTFE membranes. Column 3 presents membrane
roughness from analysis of the AFM images. As can be seen a significant variation in roughness
exists. Changes in roughness for membranes made from the same polymer are most likely due to
different manufacturing conditions.
The permeate flux during membrane distillation using an artificial feed stream consisting
of 20,000 ppm NaCl in DI water is given in Figures 2 to 4. Figure 2 gives the variation of permeate
flux with feed flow rate for the polypropylene and PVDF membranes, Figure 3 gives analogous
results for the ECTFE and PTFE membrane while Figure 4 gives analogous results for the PVDF
membranes. Comparing Table 2 with Figures 2-4 indicates that in general the permeate flux
increases with increasing values of the membrane structural parameter. The lowest fluxes are
observed for the PVDF and superhydrophobic PVDF membranes. In general the bulk membrane
structural parameter is lowest for these membranes. Higher fluxes are observed for the PTFE and
ECTFE membranes which also display a larger value of the structural parameter. The
polypropylene membranes are less consistent. The structural parameter is larger than for the PVDF
and superhydrophobic PVDF membranes but less than the PTFE and ECTFE membranes.
However with the exception of PP-B, the observed fluxes are similar to the PTFE and ECTFE
Page 56
42
membranes. PP-B however displays a much lower flux than PP-A and PP-C. Nevertheless the
membranes with the largest value of the structural parameter: PTFE-B; PTFE-A; ECTFE, PTFE-
C, PP-C, also displayed the highest permeate fluxes. Our results indicate that the structural
parameter provides a semi-quantitative method for screening expected permeate fluxes.
Figure 2. Variation of permeate flux with feed flow rate for polypropylene and PVDF membranes.
The feed stream consisted of 20,000 ppm NaCl in DI water.
Page 57
43
Figure 3. Variation of permeate flux with feed flow rate for ECTFE and PTFE and PVDF
membranes. The feed stream consisted of 20,000 ppm NaCl in DI water.
Figure 4. Variation of permeate flux with feed flow rate for superhydrophobic PVDF membranes.
The feed stream consisted of 20,000 ppm NaCl in DI water.
Page 58
44
Figures 2-4 indicate the permeate flux increases with increasing feed flow rate. The width
of the feed channel is 0.05 m. The density and viscosity for 20,000 ppm NaCl solution are 1.0108
kg L-1 and 9.1828 x 10⁻⁴ Pas respectively [41]. Thus the feed Reynolds numbers are 100, 200 and
370 for feed flow rates of 0.25, 0.5 and 0.9 L min-1 respectively. It is expected therefore that the
flow is laminar. Given the low salt concentration in the feed, significant concentration polarization
boundary layer effects are not expected on the feed side. However temperature polarization due
to the development of a thermal boundary layer is frequently observed in many membrane
distillation configurations [18, 27]. Increasing the feed velocity will lead to an increase in the feed
side heat transfer coefficient which in turn will lead to higher rates of water evaporation and hence
higher observed permeate fluxes.
The membranes that displayed the highest permeate fluxes: PTFE-B; PTFE-A; ECTFE,
PP-C, PTFE-C, were challenged with 100,000 ppm NaCl solutions. Figure 5 shows the variation
of permeate flux with time for theses five membranes. The membranes were tested until
breakthrough. Breakthrough was assumed to occur when both the conductivity and permeate flux
increase rapidly. Figure 6 indicates the breakthrough point for the ECTFE membrane. As can be
seen at breakthrough the permeate conductivity rises rapidly. Table 4 gives the feed concentration
at which breakthrough occurred for the 5 membranes tested with 100,000 ppm NaCl solution.
Page 59
45
Figure 5. Variation of permeate flux with permeate volume. The initial feed concentration was
100,000 ppm NaCl. Experiments were run till breakthrough.
Page 60
46
Figure 6. Variation of permeate flux and conductivity with permeate volume. Breakthrough
occurs when a rapid increase in permeate flux and conductivity is observed.
Table 4. Feed concentration at breakthrough
Membrane Feed concentration at
breakthrough (g L-1)
PP-C 302
PTFE-A 309
PTFE-B 308
PTFE-C 305
ECTFE 313
Page 61
47
As can be seen in Figure 5, the permeate flux decreases with increasing NaCl concentration
in the feed. As a model feed solution consisting of NaCl in DI water is used here, little membrane
fouling is expected. Figure 5 also shows the decrease in water vapor pressure with NaCl
concentration. While the thermal and concentration polarization boundary layers will be affected
by the increasing NaCl concentration in the feed, Figure 5 suggests that the decrease in water vapor
pressure with increasing NaCl concentration will contribute to the observed decree in permeate
flux.
The results obtained here indicate that breakthrough occurs at approximately the same
NaCl concentration for all 5 membranes. Table 3 indicates that all 5 membranes display similar
water contact angles but the surface roughness varies from 289 to 711 nm. These results suggest
that for the model feed streams tested here membrane surface properties are likely to be of
secondary importance. Using a lower flux membrane could lead to breakthrough of the feed at a
higher concentration. However real hydraulic fracturing produced waters have the potential for
greater fouling. Besides very high TDS, small volatile organic compound and dissolved gases
could pass through the membrane pores degrading the permeate quality. Further the presence of
alcohols and surfactants can cause wetting of the membrane due to a lowering of the liquid surface
tension [18, 19, 23]. Consequently in applications using real hydraulic fracturing produced waters,
it is likely that the permeate flux will decrease more rapidly than observed in Figure 5 and
breakthrough of the feed will occur at a lower TDS.
The results presented here provide a quick method to determine membranes that are likely
to give the highest permeate fluxes based on the bulk membrane structural parameter. These
membranes could be used to concentrate the feed rapidly. The actual TDS at which breakthrough
Page 62
48
occurs will depend on the feed components (dissolved organics etc.) as well as the membrane
surface properties such as hydrophobicity and roughness. A lower flux (smaller pore size)
membrane could be used to concentrate the feed beyond the breakthrough point for higher flux
membranes. Our results suggest that a multistage process using membranes of different
permeabilities could be used to maximize the concertation of the reject brine solution enabling
maximum water recovery.
2.4. Conclusion
The results obtained here indicate the utility of defining an appropriate bulk membrane
structural parameter. If appropriately chosen, the structural parameter will provide insights into
expected membrane performance when tested with low fouling model feed streams. Under these
conditions bulk membrane properties such as pore size, pore size distribution, tortuosity and
thickness will have a greater effect on membranes performance compared to surface properties
such as hydrophobicity and roughness. Treatment of hydraulic fracturing produced waters often
involves maximizing water recovery in order to minimize the volume of concentrated brine that
has to be transported to a centralized treatment or disposal facility. Membrane distillation could
be used to concentrate the wastewater to close to the solubility limit of the dissolved salts in the
water. However it is likely that an optimized process will be a multistep process. As the TDS of
the feed increases lower flux membranes with smaller pore sizes will be required in order to
prevent breakthrough the of the feed solution. For real feed streams containing surfactant and
other dissolved organic compounds either pre-treatment or optimized membrane surface properties
will be required in order minimize a flux decrease due to membrane fouling as well as early
breakthrough of the feed due do adsorption of surfactant molecule onto the membrane surface.
Page 63
49
Acknowledgements
Funding for this work was provided by Southwestern Energy through the National Science
Foundation Industry/University Cooperative Research Center for Membrane Science, Engineering
and Technology, the National Science Foundation (IIP 1361809) and the University of Arkansas.
References
[1] Gleick, P.H., Wolff, G. H., Cooley, H. (2000) The World's water 2006-2007, The Biennial
Report on Freshwater Resources; Island Press: Washington, DC.
[2] Igunnu, E.T.; Chen, G.Z. (2012) Produced water treatment technologies. Int. J. Low-
Carbon Tech., 9 (4): 157-177
[3] United States Energy Information Administration. World shale gas resources: an initial
assessment of 14 regions outside the United States; United States Department of Energy:
Washington, DC, April 2001, 1-365.
[4] Yang, R.; Goktekin, E.; K. Gleason, K. (2015) Zwitterionic Antifouling Coatings for the
Purification of High-Salinity Shale Gas Produced Water. Langmuir, 31(43): 11895-11903.
[5] Shaffer, D.L.; Arias Chavez, L.H.; Ben-Sasson, M.; Romero-Vargas Castrillon, S.; Yip,
N.Y.; Elimelech M. (2013) Desalination and reuse of high-salinity shale gas produced water:
Drivers, technologies, and future directions. Environ. Sci. Technol, 47 (17): 9569−9583.
[6] Koren, A.; Nadav, N. (1994) Mechanical vapour compression to treat oil field produced
water. Desalination, 98 (1-3): 41-48.
[7] Hao, H.; Huang, X.; Gao, C.; Gao, X. (2015) Application of an integrated system of
coagulation and electrodialysis for treatment of wastewater produced by fracturing. Desalin.
Water Treat., 55 (8): 2034-2043.
[8] Kim, S.J.; Ko, S.H.; Kang, K.H.; Han, J. (2010) Direct seawater desalination by ion
concentration polarization. Nat. Nanotechnol., 5 (4): 297-301.
[9] Prakash Narayan, G.; St. John, M.G.; Zubair, S.M.; Lienhard, J.H. (2013) Thermal design
of the humidification dehumidification desalination system: An experimental investigation. Int. J
Heat Mass Tran., 58 (1-2): 740-748.
[10] Sirkar, K. K. (1992) Other new membrane processes in Membrane Handbook, eds: Ho, W.
S. W., Sirkar, K. K. van Nostrand Reinhold, NY, New York.
Page 64
50
[11] Martinetti, C.R.; Childress, A.E.; Cath, T.Y. (2009) High recovery of concentrated RO
brines using forward osmosis and membrane distillation. J. Membr. Sci., 331 (1-2): 31-39.
[12] Edwie, F.; Chung, T.S. (2012) Development of hollow fiber membranes for water and salt
recovery from highly concentrated brine via direct contact membrane distillation and
crystallization. J. Membr. Sci., 421-422: 111-123.
[13] Singh, D.; Sirkar, K.K. (2012) Desalination of brine and produced water by direct contact
membrane distillation at high temperatures and pressures. J. Membr. Sci., 389: 380-388.
[14] Guan, G.; Wang, R.; Wicaksana, F.; Yang, X.; Fane, A.G. (2012) Analysis of Membrane
Distillation Crystallization System for High Salinity Brine Treatment with Zero Discharge Using
Aspen Flowsheet Simulation. Ind. Eng. Chem. Res., 51 (41): 13405-13413.
[15] Charcosset, C.; Kieffer, R.; Mangin, D.; Puel, F. (2010) Coupling between membrane
processes and crystallization operations. Ind. Eng. Chem. Res., 49 (12): 5489-5495.
[16] Curcio, E.; Criscuoli, A.; Drioli, E. (2001) Membrane Crystallizers. Ind. Eng. Chem. Res.,
40 (12): 2679-2684.
[17] Chan, M.T.; Fane, A.G.; Matheickal, J.T.; Sheikholeslami, R. (2005) Membrane
distillation crystallization of concentrated salts - Flux and crystal formation. J. Membr. Sci., 257
(1-2): 144-155.
[18] El-Bourawi, M.S.; Ding, Z.; Ma, R.; Khayet, M. (2006) A framework for better
understanding membrane distillation separation process. J. Membr. Sci. 285 (1–2): 4–29.
[19] Lawson, K.W.; Lloyd, D.R. (1997) J. Membr. Sci. 124 (1): 1–25.
[20] Zhao, K.; Heinzl, W.; Wenzel, M.; Büttner, S.; Bollen, F.; Lange, G.; Heinzl, S.; Sarda, N.
(2013) Experimental study of the memsys vacuum-multi-effect-membrane-distillation (V-
MEMD) module. Desalination, 323: 150-160.
[21] Francis, L.; Ghaffour, N.; Alsaadi, A.A.; Amy, G.L. (2013) Material gap membrane
distillation: A new design for water vapor flux enhancement. J. Membr. Sci., 448: 240-247.
[22] Dotremont, C.; Kregersman, B.; Sih, R.; Lai, K.C.; Koh, K.; Seah, H. (2010) Seawater
desalination with memstill technology - a sustainable solution for the industry.
WaterPract.Technol. 5 (2): 1-7.
[23] Souhaimi, M.K.; Matsuura, T. (2011) Membrane distillation: principles and applications;
Elsevier, Amsterdam, Netherlands.
[24] Essalhi, M.; Khayet, M. (2014) Application of a porous composite
hydrophobic/hydrophilic membrane in desalination by air gap and liquid gap membrane
distillation: A comparative study. Sep. Purif. Technol., 133: 176-186.
Page 65
51
[25] Tijing, L.D.; Woo, Y.C.; Choi, J.S.; Lee, S.; Kim, S.H.; Shon, H.K. (2015) Fouling and its
control in membrane distillation-A review. J Membr. Sc., 475: 215-244.
[26] Rao, G.; Hiibel, S.R.; Childress, A.E. (2014) Simplified flux prediction in direct-contact
membrane distillation using a membrane structural parameter. Desalination, 351: 151-162.
[27] Curcio, E.; Drioli, E. (2005) Membrane Distillation and Related Operations—A Review.
Sep. Purif. Technol., 34: 35-86.
[28] Loh, S.; Beuscher, U.; Poddar, T.K.; Porter, A.G.; Wingard, J.M.; Husson, S.M.;
Wickramasinghe, S.R. (2009) Interplay among membrane properties, protein properties and
operating conditions on protein fouling during normal-flow microfiltration. J. Membr. Sci., 332
(1-2): 93-103.
[29] Saffarini, R.B.; Mansoor, B.; Thomas, R.; Arafat, H.A. (2013) Effect of temperature-
dependent microstructure evolution on pore wetting in PTFE membranes under membrane
distillation conditions. J. Membr. Sci., 429: 282-294.
[30] Kim, H.; Choi, J.S.; Lee, S.H. (2011) Effect of Membrane Material Properties on
Efficiency of Membrane Distillation. Mater. Sci. Forum., 695: 85-88.
[31] Mishra, R.; Tripathy, S.P.; Sinha, D.; Dwivedi, K.K.; Ghosh, S.; Khathing, D.T.; Muller,
M.; Fink, D.; Chung, W.H. (2000) Optical and electrical properties of some electron and proton
irradiated polymers. Nucl. Instr. Meth. Phys. Res., 168 (1): 59-64.
[32] Pan, J.; Xiao, C.; Huang, Q.; Liu, H.; Hu, J. (2015) ECTFE porous membranes with
conveniently controlled microstructures for vacuum membrane distillation. J. Mater. Chem. A, 3
(46): 23549-23559.
[33] Cui, Z.; Drioli, E.; Lee, Y.M. (2014) Recent progress in fluoropolymers for membranes.
Prog. Polym. Sci., 39: 164-198.
[34] Nejati, S.; Boo, C.; Osuji, C.O.; Elimelech, M. (2015) Engineering flat sheet microporous
PVDF films for membrane distillation. J. Membr. Sc., 492: 355-363.
[35] Hwang, H.J.; He, K.; Gray, S.; Zhang, J.; Moon, I.S. (2011) Direct contact membrane
distillation (DCMD): Experimental study on the commercial PTFE membrane and modeling. J.
Membr. Sc., 371 (1-2): 90-98.
[36] Smolders, K.; Franken, A.C.M. (1989) Terminology for Membrane Distillation.
Desalination, 72 (3): 249-262.
[37] Vargaftik, N.B.; Volkov, B.N.; Voljak, L.D. (1983) International Tables of the Surface
Tension of Water. J. Phys. Chem. Ref. Data, 12 (3): 817-820.
Page 66
52
[38] Grzenia, D.L.; Carlson, J.O.; Czermak, P.; Han, B.; Specht, R.K.; Wickramasinghe, S.R.
(2006) Purification of densonucleosis virus by tangential flow ultrafiltration. Biotechnol. Prog.,
22 (5): 1346-1353.
[39] Kenfield, C.F.; Qin, R.; Semmens, M.J.; Cussler, E.L. (1988) Cyanide recovery across
hollow fiber gas membranes. Environ. Sci. Technol., 22 (10): 1151-1155.
[40] Cussler, E. (1997) Diffusion, 2nd Ed.; Cambridge Univ Pr, Cambridge, UK.
[41] Hai-Lang, Z.; and Han, S.J. (1996) Viscosity and Density of Water + Sodium Chloride +
Potassium Chloride Solutions at 298.15 K. J. Chem. Eng. Data, 41 (3): 516-520.
Page 67
53
Chapter 3. Combined Electrocoagulation and Membrane Distillation for Treating High
Salinity Produced Waters
Abstract
Membrane distillation has been investigated for treating high TDS hydraulic fracturing
produced water (HFPW). When treating real HFPW feed streams which contain not only high
TDS, but also dissolved organics, surfactants and low surface tension contaminants pretreatment
of the feed is essential to suppress the onset of membrane fouling. The objective of this study was
to investigate the feasibility of electrocoagulation (EC) followed by direct contact membrane
distillation (DCMD). EC was shown to be effective in reducing suspended solids and the organic
content of raw HFPW samples.
Raw and EC pretreated HFPW samples were treated with DCMD system under variety of
operational conditions. Higher contaminate removal during EC resulted in lower membrane
fouling and consequently, lower flux decline during DCMD. The membrane permeability was
modeled by summing the membrane and feed side fouling layer resistances. Long-term EC-DCMD
experiments were conducted, concentrating the feed water, containing 135 g L-1 TDS, up to 265 g
L-1. Stable water flux with minimal fouling are reported over 434 h experimental run.
3.1. Introduction
Unconventional natural gas resources offer an opportunity to access a relatively clean fossil
fuel that could potentially lead to energy independence for some countries. Unconventional shale
gas and tight sand production account for more than 60 percent of the total natural gas production
in the US. Horizontal drilling and hydraulic fracturing make the extraction of tightly bound natural
Page 68
54
gas from shale formations economically feasible [1,2]. Following hydraulic fracturing, varying
percentages (8–70%) of the injected water will return back to the surface during the lifetime of the
well, containing very high concentrations of total dissolved solids (TDS) [3]. The volume and
TDS content of hydraulic fracturing produced water (HFPW) of a well depends on a number of
factors including: the geographical location, geological formation, well depth and time following
hydraulic fracturing [4,5]. Kondash et al. [6] has estimated the median volume of HFPW to range
from 1.7 to 14.3 million L per well over the first 5–10 years of production. TDS concentration of
HFPW ranges from 650 to 400,000 mg L-1 [4,7].
Over the last decade, the most common disposal practice in the U.S. has involved injection
of HFPW into brine disposal wells [8–10]. However, in many areas where oil and gas production
is abundant, brine disposal sites are not available and the HFPW has to be transported to the
disposal facilities [11]. This transportation can be very costly (up to $4.00 per bbl) [12]. In
addition several environmental concerns have emerged surrounding HFPW discharge, notably
induction of micro-scale earthquakes and the potential to contaminate the groundwater [6,13].
Thus, treatment of HFPW streams is critical for developing economically viable hydraulic
fracturing operations [14].
Primary consideration when treating high salinity produced waters is TDS reduction to a
quality suitable for discharge or for external reuse [10]. Reverse osmosis (RO) is the most
practiced desalination technique in recent years and accounts for over 60% of the world’s capacity
for water desalination [15]. However, RO is inefficient for treating produced waters containing
elevated TDS concentrations due to very high hydraulic pressure requirements [16]. Mechanical
vapor compression [17], membrane distillation (MD) [18] and forward osmosis (FO) [19] are three
Page 69
55
examples of desalination technologies for high TDS brines that are appropriate for the produced
water streams in shale gas plays where conditions promote external reuse [10]. In this study, we
focus on MD.
MD is a thermally driven separation process, in which only vapor molecules are able to
pass through a porous hydrophobic membrane. This separation process is driven by a vapor
pressure gradient across a porous hydrophobic membrane [20]. Direct contact membrane
distillation (DCMD) is the most commonly used configuration of MD [21]. In DCMD, hot feed
water and cold distilled water flow on opposite sides of a hydrophobic membrane. The membrane
acts as a thermal insulator as well as a physical barrier between the hot feed and the cold distillate.
Water vaporizes from the hot feed, passes through the membrane pores and condenses on the
distillate side [22,23]. In this study, we investigate the application of DCMD for treating high
TDS HFPW.
MD can provide variety of advantages when treating high salinity produced waters,
including: near complete rejection of dissolved and suspended species, lower operating pressures
than pressure-driven separation processes (such as RO), lower operating temperatures compared
to thermal distillation and the possibility of using waste-heat as the energy source for the process
[18,24]. Since it is mostly the water vapor that crosses the membrane, dissolved solids remain in
the concentrated retentate and high quality permeate is recovered.
Like all membrane technologies, fouling is a major obstacle when operating MD for
treating brines [25–30]. Fouling results in a decrease of the membrane permeability due to
deposition of suspended or dissolved substances on the membrane surface and/or within its pores.
Several studies have indicated the negative effect of membrane fouling on MD [28]. Moreover,
Page 70
56
the role of particulate matter in real feed streams on membrane fouling is often neglected. The
MD feed stream is usually filtered (e.g. 0.25 and 0.45 µm filters) prior to introduction to the MD
module [16]. In addition to fouling, MD also suffers from membrane wetting. The MD
membranes have to remain hydrophobic through the process, thus allowing only vapor and not
liquid water to pass through. Wetting refers to the process whereby the membrane starts allowing
liquid water to flow into the membrane pores and leads to deterioration of permeate quality [31–
33]. Preventing pore wetting is particularly challenging in desalinating HFPW or other feed waters
with high levels of surfactants or low surface tension contaminants [34]. In addition scaling due
to precipitation of salts is a concern that can lead to membrane wetting [35].
Pretreatment of real feed streams will be essential when developing practical MD
processes. Here we focus on pretreatment to suppress fouling by dissolved organic species,
surfactants and other low surface tension foulants. Pretreatment of the feed is standard practice
in most desalination systems, and pretreatment needs vary significantly by technology and feed
water quality [21,36]. Common pretreatment methods include oxidation, filtration, antiscalants,
flocculation, and chlorination [27,31,37]. In this study, we investigate electrocoagulation (EC) as
the pretreatment prior to MD. EC has been successfully practiced prior to microfiltration [38,39],
RO [40] and forward osmosis [14]. EC is an electrochemical method whereby sacrificial anodes
(often Al or Fe) corrode to release active precursors into the solution. The released metal ions are
further transformed into hydroxides that neutralize charges or act as sweep flocs with large surface
areas and hence, they promote aggregation or precipitatation as a sludge, adsorbing the dissolved
organic compounds and trapping suspended particles [41]. While the basic chemistry is similar,
EC can provide a number of advantages compared to chemical coagulation including reduction of
the direct handling of corrosive chemicals, lower amount of sludge production, being readily
Page 71
57
employable in portable wastewater treatment systems and less maintenance due to requiring no
moving parts [14,42–46]. Another advantage of EC over other conventional methods is the
potential for treating oily wastewater, where the presence of electric current can contribute to the
electrocoalescence of oil droplets [47].
In this study, we investigate the impacts of EC pretreatment prior to DCMD for treating
high TDS HFPW using a commercial membrane. We conduct DCMD experiments with synthetic,
non-pretreated and pretreated HFPW under different operational conditions and investigate the
water recovery from DCMD for different water qualities. In addition, we conduct long-term EC-
DCMD experiments with pretreated HFPW samples and study the impact of pretreatment on
longer experimental runs.
3.2. Theory
3.2.1. Mass Transfer in MD
Water Flux across a hydrophobic MD membrane can be expressed as:
𝐽 = 𝐴 ∆𝑃 (1)
where J is water flux, A is membrane permeanility coefficient and ∆P is water partial pressure
difference across the membrane [24]. For a membranes with pore sizes around 0.2 µm, the reduced
Knudsen-molecular diffusion transition form of the dusty gas model has been used to predict the
water flux through teh membrane [48,49]. This expression is as following:
𝐴 = −𝑀𝑤
𝛿𝑅𝑇𝑎𝑣𝑔(
𝐷𝑚 𝐷𝑘
𝐷𝑚+𝑝𝑎𝐷𝑘) (2)
Page 72
58
where Mw is molecular weight of water, δ is membrane thickness, R is universal gas constant, Tavg
is average temperature across the membrane and pa is partial pressure of air. Dm is molecular
diffusion coefficient and is defined as follows:
𝐷𝑚 = 4.46 ∗ 10−6 (Ɛ
𝜏) 𝑇𝑎𝑣𝑔
2.334 (3)
where Ɛ and τ are membrane porosity and tortuosity, respectively. In Eq. (2), Dk is Knudsen
diffusion coefficient and is defined as follows:
𝐷𝑘 =2Ɛ𝑟
3𝜏 (
8𝑅𝑇𝑎𝑣𝑔
𝛱𝑀𝑤)
0.5
(4)
where r represents the nominal pore radius of membrane.
Resistance in series modeling can address changes in membrane permeability due to
fouling [50]. The overall MD permeability coefficient (A) depends on both membrane
permeability (Am) as well as fouling layer permeability coefficient (Af), as follows:
1
𝐴=
1
𝐴𝑚+
1
𝐴𝑓 (5)
In equation (5) it is assumed that there is no mass transfer resistance on the permeate side as the
permeate is solute free water. We will use Eq. (5) to model our experimental results, assuming
fouling does not affect the feed side concentration polarization boundary layer as well as feed
and distillate side temperature boundary layer.
Page 73
59
3.2.2. MD Flux Prediction
A mathematical code was developed in Matlab 2016a in order to predict MD water flux.
Physio-chemical properties of water and different concentrations of sodium chloride in water as
well as all other required parameters such as membrane module geometries, membrane physical
properties and operational conditions were introduced into the code. Then, a flat sheet membrane
was subdivided into n differential elements. Transmembrane ∆P at each element was estimated
using the method described by Yun et al. [48] and consequently, the water flux at each element
was estimated using Eq. (1). The modeling algorithm is given in appendix A.
3.2.3. EC
The following reactions occur in the EC reactor when applying an electric current:
At the anode: 𝑀(𝑠) → 𝑀(𝑎𝑞)𝑛+ + 𝑛𝑒− (6)
At the cathode: 2𝐻2𝑂 + 2𝑒− → 2𝑂𝐻− + 𝐻2 (7)
where M is the electrode metal material (often Al or Fe) [51]. According to complex precipitation
kinetics, the released metal and hydroxide ions react to from various metal complexes such as
M(OH)(n-1)+, M(OH)2(n-2)+ and M6(OH)15
(6n-15)+ that can neutralize negatively charged species and
eventually, transform to amorphous M(OH)n(s) particles, as given by the following general scheme
[14,52]:
In solution: 𝑥 𝑀(𝑎𝑞)𝑛+ + 𝑦 𝑂𝐻− → 𝑀𝑥(𝑂𝐻)𝑦
(𝑥𝑛−𝑦)→ 𝑥 𝑀(𝑂𝐻)𝑛(𝑠) (8)
Page 74
60
M(OH)n(s) particles, with their large surface area, can adsorb organic compounds, trap suspended
particles and finally, polymerize and deposit as sweep floc (with the adsorbed organics and
colloidal particles) according to the following reaction, [53]:
𝑥 𝑀(𝑂𝐻)𝑛 → 𝑀𝑥(𝑂𝐻)𝑥𝑛 (9)
3.3. Materials and Methods
3.3.1. HFPW: Source and Characterization
HFPW samples were collected from Marcellus shale gas production facilities in
Pennsylvania and provided by Southwestern Energy (Houston, TX). The water samples were
disinfected on-site using a Balckwater unit (MOIX, Albuquerque, NM) and received in 20 L
containers. Raw and pretreated water samples were characterized for the levels of TDS, total
suspended solids (TSS), total organic carbon (TOC), dissolved organic carbon (DOC) and turbidity
as well as inorganic composition at Arkansas Water Resources Center, University of Arkansas
(Fayetteville, AR). TDS and TSS were measured using EPA standard methods 160.1 and 160.2
[54], respectively. TOC was measured using a Skalar Formacs TOC analyzer (Breda,
Netherlands), DOC was measured using EPA method 415.1 [54] and turbidity was measured using
a Turb 550 (WTW, Weilheim, Germany) turbidity-meter. Cations and anions present were
measured using Spectro Genesis ICP OES (Kleve, Germany) and Dionex DX-120 ion
chromatograph (Sunnyvale, CA), respectively. The percent difference between the sum of anions
and cations in equivalent weight per liter (electroneutrality) was calculated to assure the accuracy
of measurements.
Page 75
61
3.3.2. Pretreatment
EC was investigated as the primary pretreatment method. Fig. 1 represents a schematic
diagram of the EC setup. Five electrodes with an active surface area of 180 cm2 (6061 aluminum
alloy) and 5 mm spacing were placed vertically in a home-made polycarbonate reactor (600 ml).
The first and last electrodes were connected to a DC power source (Hewlett Packard, Palp Alto,
CA) and acted as the cathode and anode. All EC experiments were carried out in batch mode. In
each experiment, 550 ml HFPW sample was collected in the EC unit. The current was maintained
at 1 to 5 A (equivalent to 5.5 to 27.8 mA cm-2 current density) and the corresponding voltage was
recorded. After 30 a second reaction time, electrocoagulated samples was transferred to a
separatory funnel for sludge sedimentation. After a 6 h sedimentation time, the clear portion of
the sample was recovered and the deposited sludge as well as floating skimmings were wasted.
Fig. 1. EC setup. EC unit consisted of a polycarbonate reactor, five aluminum electrodes and a
DC power source.
Page 76
62
3.3.3. MD Membrane
Ethylene chlorotrifluoroethylene (ECTFE) copolymer flat sheet membrane samples were
provided by 3M (Maplewood, MN). Table 1 represents the characteristics of these ECTFE
membranes, including mean pore size, porosity, thickness, contact angle, maximum roughness and
liquid entry pressure (LEP). All membrane properties were measured and discussed in our
previous work [55].
Table 1. Characteristics of ECTFE membrane.
Membrane Mean Pore
size (µm) Porosity
Thickness
(µm)
Contact
Angle
Max Roughness
(nm)
LEP
(kPa)
ECTFE 0.18 0.71 82±4 130±1 711 330
3.3.4. DCMD Test System
Fig. 2 is a schematic diagram of the DCMD apparatus. A home-made PTFE tangential
flow cell with 40 cm2 effective surface area and 2 mm channel depth was employed for DCMD
experiments. In order to provide mechanical support for the membrane, PTFE spacers (ET 8700)
were acquired from Industrial Netting (Minneapolis, MN) to fill the channels on both sides of
membrane cell. As can be seen in Fig. 1, feed and distillate streams recirculated countercurrent
on opposite surfaces of the membrane by means of two peristaltic pumps (Masterflex I/P, Cole
Parmer, Vernon Hills, IL) at equal flow rates of 0.3 to 0.9 L min-1 (equal to flow velocity of 5.5 to
16.7 cm-1 sec). A range of feed temperatures, from 50 to 70 ̊C were tested. Temperature of
distillate stream was kept at 20 ̊C for all experiments. The conductivity of distillate was recorded
Page 77
63
using a conductivity meter (VWR, Radnor, PA) and kept under 20 µS cm-1 during all membrane
distillation experiments to make sure that experiment runs without membrane damage or wetting.
Membrane damage/wetting was recognized when the conductivity of permeate stream increased
rapidly above 20 µS cm-1 with a concurrent rapid increase in water flux.
A custom-made level controlled tank with capacity of 2 L was employed as the feed tank.
The level controller in this tank was connected to a dosing and a discharge pump (Masterflex L/S
Digital Standard Drive, Cole Parmer). The dosing pump was used to inject fresh feed as make-up
water into the feed tank. The discharge pump was employed to enable the process to run in
continuous mode. The outlet line from the feed tank was open in all continuous experiments and
was closed in all batch experiments. Both dosing and discharge pumps were activated by the level
controller installed in the feed tank. The flow rate of dosing and discharge pumps were
proportionally adjusted to maintain a constant TDS in the feed tank in continuous experiments.
While permeate was collected in the distillate reservoir, the make-up water and high TDS brine
tanks were placed on computer-connected analytical balances (Mettler Toledo, Columbus, OH).
Water flux calculation in L m-2 h-1 was performed using Eq. (10):
𝐽 =∆𝑚
𝑆𝐴 𝑥 𝑡 𝑥 𝜌 (10)
where J is transmembrane water flux, Δm is the recorded net weight difference between make-up
water and high TDS brine tanks, SA is membrane surface area, 𝑡 is time interval of weight record
and 𝜌 is the feed water density.
Page 78
64
Fig. 2. Schematic diagram of the established DCMD setup.
3.3.5. DCMD Experiments
Table 2 gives the various DCMD experiments carried out in this study. Experiments were
performed using different feed streams. A set of experiments were carried out with synthetic
HFPW to provide a baseline/control for the DCMD system. Synthetic HFPW was prepared using
sodium chloride in de-ionized (DI) water, containing the same TDS as the raw HFPW. DCMD
experiments were also performed employing raw HFPW obtained from oil and gas extraction
facilities. For synthetic and actual HFPW, different feed temperatures as well as a range of flow
velocities were tested. In addition, DCMD experiments were performed with EC pretreated HFPW
samples. In these experiments, experiments were continued until feed water was concentrated up
Page 79
65
to 300 g L-1 TDS. Finally, a long-term experiment was conducted over 434 h to evaluate the
performance of ECTFE membrane in longer experimental runs.
Table 2. Summary of DCMD experiments in this study.
Experiment Feed
Feed
Temp.
Flow
Velocity
Operating
Mode
Feed Tank
Discharge
line Duration
⁰C cm s-1 Batch |
continuous
Open |
Close
Baseline
Control
Synthetic
HFPW 50 - 70
5.5 –
16.7 Batch Close
Until ~2.45
L permeate
was
collected
(feed
concentrate
d to 300 g
L-1 TDS
Actual Raw
HFPW 50 - 70
5.5 –
16.7 Batch Close
Pretreatment Pretreated
HFPW 50 - 70 16.7 Batch Close
Long-Term Pretreated
HFPW 60
9.3 -
16.7 Continuous Open
Up to 434
h
3.3.6. Membrane Characterization Tests
3.3.6.1. Scanning Electron Microscopy (SEM) and Energy-dispersive X-ray Spectroscopy
(EDX)
SEM using a Nova Nanolab 200 Duo-Beam Workstation (FEI, Hillsboro, Oregon) was
used to observe changes in the ECTFE membrane surface after DCMD experiments. The same
equipment was used to perform EDX spectroscopy on fouled membrane surfaces to obtain
chemical information on the foulants.
Page 80
66
3.3.6.2. Contact Angle
The static contact angle was measured using a contact angle goniometer (Model 100,
Rame-Hart Instrument Company, Netcong, NJ). A DI water droplet (5 μL) at a rate of 2 μL/s was
formed on the tip of a micro-syringe (Hamilton, Reno, NV). The micro-syringe was moved down
vertically towards the sample until it made the contact with the sample. Then, the syringe was
moved up and detached from the droplet. Using the circle fitting method, the angle made between
the left and right-hand side of the water droplet and the membrane surface was measured at five
locations and averaged.
3.3.6.3. LEP
LEP was determined as described by Smolder and Franken [56]. Briefly, the LEP of virgin
and tested ECTFE membranes was measured using a Sterlitech HP4750 (Kent, WA) stainless steel
cell at 20 ˚C. The cell was filled with DI water and gradually pressurized at the rate of 13.8 kPa
min-1. The LEP is the pressure at which a continuous flow of DI water through the membrane is
first observed.
3.4. Results and Discussion
3.4.1. HFPW Characterization Results
Table 3 shows the characteristics of raw and pretreated HFPW samples. All samples were
characterized in terms of inorganic composition as well as the following parameters: TDS, TSS,
TOC, DOC, pH and Turbidity. Close to four times higher than seawater TDS (135 g L-1) is
observed. Sodium and calcium were observed as the main cations, while chloride was the main
Page 81
67
anionic component of the HFPW. The HFPW sample contained 97.9 and 41.8 mg L-1 TOC and
DOC, respectively. It contained relatively high levels of suspended solid and turbidity, compared
to municipal wastewaters.
Table 3. Characterization results of raw and pretreated HFPW samples.
Unit Raw HFPW EC 1 A EC 2 A EC 3 A
TDS g L-1 135 134 133 133
TOC mg L-1 97.9 57.4 46.3 37.8
DOC mg L-1 41.8 35.7 31.1 29.6
TSS mg L-1 494.1 107.1 43.3 37.3
Turbidity Ntu 23.4 4.3 1.1 0.8
pH 6.4 6.5 6.4 6.7
chloride mg L-1 86,379 84,324 85,122 83,415
Nitrate mg L-1 0.7 0.3 0.7 0.5
sulfate mg L-1 1.9 1.4 1.4 1.1
Aluminum mg L-1 1.5 2.7 3.2 4.6
Boron mg L-1 25.6 20.7 22.4 21.8
Calcium mg L-1 12,352 12,194 12,501 11,893
Magnesium mg L-1 35.07 33.64 33.9 34.5
Potassium mg L-1 740.4 728.7 719.8 731.5
Sodium mg L-1 38,720 38,671 38,421 38,122
Electroneutrality
Percent Difference % < 3 < 2 < 2 < 2
Page 82
68
3.4.2. EC Pretreatment
Here, aluminum electrodes were used as EC electrodes. Following EC reactions, Al3+ and
OH- ions were released into the solution and formed a variety of aluminum hydroxide complexes
(see section 2.3). Positively charged complexes such as Al(OH)2+ contributed to charge
neutralization of negatively charged organic species and suspended solids. As the solution aged,
aluminum hydroxide complexes transformed to Al(OH)3(s), producing white-grey flocs [57]. These
flocs adsorbed organic molecules, trapped suspended particles and were separated from solution
following a 6 h sedimentation time.
Different parameters including voltage, current, reaction time, pH and electrode material
can affect EC performance. A range of electric currents, from 1 to 5 A were investigated. The EC
reaction time was kept constant at 30 sec for all runs. The impact of EC pretreatment on removal
of different parameters is calculated as removal efficiency using Eq. (11):
𝑅𝑒𝑚𝑜𝑣𝑎𝑙 𝐸𝑓𝑓𝑖𝑐𝑖𝑒𝑛𝑐𝑦 (%) =𝐶𝑓−𝐶𝑝
𝐶𝑓 𝑋 100 (11)
where Cf and Cp are feed and EC pretreated water concentrations, respectively. Results are
presented in Fig. 3. As can be seen, all removal efficiencies increased as the applied current
increased. When current rose from the zero to 2 A, all contaminants were rapidly removed.
However, the removal efficiency reaches an approximately constant value once the current reached
3 A. For 3 A current, turbidity, TSS and TOC were removed by 96, 91 and 61%, respectively.
The removal of DOC was 29%. Only limited removal of TDS is observed.
The voltage was recorded at 15 sec intervals in all EC experiment. Due to the generation
of ionic species, the voltage was decreased to ensure a constant current during each EC run.
Page 83
69
Energy consumption for EC process (E) was estimated in kWh per m3 feed using the following
equation:
𝐸 =𝑉 𝑥 𝐼 𝑥 𝑡
𝑉𝑟 (12)
where 𝑉 is average voltage, 𝐼 is applied current, 𝑡 is reaction time and 𝑉𝑟 is reactor volume. Energy
consumption is shown in the secondary vertical axis of Fig. 3. Higher removal was achieved for
higher currents which resulted in higher energy consumption. The estimated energy consumption
for 3 A current was 1.41 kWh m-3.
Fig. 3. Removal efficiency of turbidity, TSS, TOC, DOC and TDS as a function of current applied
during EC. Energy consumption of the EC process is shown on the secondary vertical axis.
Page 84
70
3.4.3. DCMD Results
3.4.3.1. Baseline Experiments with Synthetic Feed
The first set of DCMD experiments were conducted using a synthetic HFPW stream as
feed, consisting of 135 g L-1 sodium chloride in DI water. TDS level was the same as the actual
HDPW sample received form Southwestern Energy. A range of feed temperatures and flow
velocities were tested. All experiments were carried out in batch mode, concentrating the feed
water up to 300 g L-1 TDS (55% water recovery) with continuous addition of saline make-up water
to the feed tank. Figs. 4.a and 4.b demonstrate the water flux of the ECTFE membrane for a range
of feed temperatures as well as a range of flow velocities as a function of feed TDS. The recovered
permeate volume, corresponding to the feed TDS at each point, is presented uisng the secondary
horizontal axis. Water fluxes in the range of 18 to 70 L m-2 h-1 were observed when increasing the
feed temperature from 50 to 70 ⁰C. Water vapor transport trough the membrane is driven by the
vapor pressure difference across the membrane. Vapor pressure is a function of temperature and
increases rapidly by increasing temperature [58]. Thus, higher water fluxes were observed for
higher feed temperatures. A slight flux decline is observed with increasing feed TDS. This is not
unexpected given the dependence of vapor pressure on feed salinity [23].
Water fluxes in the range of 24 to 47 L m-2 h-1 were observed for 5.5 to 16.7 cm s-1 flow
velocities. As can be seen in Fig. 4.b, the water flux increased with increasing flow velocity of
distillate and feed streams. An increase in flow velocity increases the heat transfer coefficient for
the thermal boundary layer on the feed and distillate sides of the membrane [59]. As the heat
transfer coefficient on both sides of the membrane increases, the temperature at the membrane
surface increases on the feed side but decreases in the permeate side (approaches the temperature
Page 85
71
in the bulk solution). Thus, higher water flux is observed due to a higher water vapor pressure
difference across the membrane [21].
As can be seen in Figs. 4.a and 4.b, predicted water fluxes are in good agreement with the
experimental results. The results obtained here are in agreement with results reported by Han et
al. [60], indicating stable water flux in DCMD system and minimal fouling when the feed stream
contains only sodium chloride.
Fig. 4. Experimental and predicted water flux as a function of feed TDS and permeate volume for
synthetic HFPW at a) different feed temperatures with flow velocity fixed at 16.7 cm s-1 and b)
different flow velocities at 60 ⁰C feed temperature. Synthetic water, containing 135 g L-1 sodium
chloride in DI water, was used as feed and make-up water. Experiments were carried out with
feed outlet line closed. Distillate stream was kept at 20 °C for all case studies.
Page 86
72
Digital and SEM images taken of the surface of the ECTFE membranes after treating
synthetic HFPW are shown in Fig. 5.a and Fig. 5.b, respectively. As can be seen, minimal fouling
is observed. SEM images from different locations on the membrane surface did not show
significant signs of fouling. For the membrane shown in Fig. 5 a and b, DCMD experiments were
conducted at 60 ⁰C feed temperature, 20 ⁰C distillate temperature and 9.3 cm s-1 flow velocity.
McGaughey et al. [61] report a similar observation for a synthetic saline feed using
polytetrafluoroethylene (PTFE) membranes. The membrane surface was further analyzed using
EDX spectroscopy after treating synthetic HFPW. The EDX spectrum is given in Fig. 5.c. Carbon,
fluorine and chlorine peaks are due to the base ECTFE polymer (hydrogen cannot be detected
using EDX spectroscopy) [62]. Gold and palladium peaks are also observed due to membrane
preparation prior to SEM imaging. A sodium peak was not detected, supporting the idea that solid
scales were not formed on the membrane surface during operation.
Page 87
73
Fig. 5. Digital and SEM images of surface of the ECTFE membranes after DCMD with a & b)
synthetic HFPW d & e) raw actual HFPW. EDX spectra for membranes after DCMD with c)
synthetic HFPW and d) raw HFPW. Both synthetic and actual feed streams contained 135 g L-1
TDS. Major fouling occurred when treating raw HFPW.
Page 88
74
3.4.3.2. DCMD Experiments with Raw HFPW
A second set of DCMD experiments was carried out using raw HFPW, containing 135 g
L-1 TDS, 97.9 mg L-1 TOC and 107.1 mg L-1 TSS. Analysis of raw HFPW is shown in Table 3
(see section 4.1). Virgin ECTFE membranes were used in all DCMD runs. Figure 6.a and b show
the variation of water flux with feed TDS and permeate volume at different feed temperatures and
flow velocities, respectively. The predicted water fluxes are also shown by dashed lines. As can
be seen, comparing Figure 4 and 6. the decrease in water flux is significant and cannot be predicted
based on the results for synthetic HFPW.
When using actual HFPW membrane fouling leads to a significant decline in water flux.
This is not unexpected given the high level of TSS (494.1 mg L-1) and TOC (97.9 mg L-1) in the
feed water. Lokare et al. [16] report much lower flux decline rates for PTFE and polypropylene
(PP) membranes when treating HFPW containing 80 g L-1 TDS. However, the feed water was
pretreated prior to DCMD experiments in their work, using a microfiltration membrane. Thus,
solids and particulates greater than 0.22 µm were removed from the HFPW samples and the
resulting pretreated water contained minimal levels of TOC.
Digital and SEM images from the surface of ECTFE membrane after treating raw HFPW
are shown in Figs. 5.c and 5.d, respectively. A brownish cake layer was observed on the membrane
surface confirming significant membrane fouling. The SEM image indicates blockage of the
membrane pores. The membrane surface was further investigated by Energy-dispersive X-ray
(EDX) spectroscopy. EDX spectrum is shown in Fig. 5.f. A number of elements were detected
on the surface. The fluorine peak was reduced compared to Fig. 5.c due to the formation of a
fouled layer on the membrane surface. However the carbon peak as well as a new oxygen peak
Page 89
75
are detected, indicating deposition of organic compounds [63]. A significantly stronger chlorine
peak as well as a new sodium peak are observed for the membrane used to treat real HFPW. This
indicates the formation of sodium chloride scale on the membrane surface. The presence of a
calcium peak suggests that calcium based scale also forms. Similar to the EDX spectrum for the
membrane challenged with synthetic HFPW, gold and palladium were detected on the surface.
Fig. 6. Variation of experimental water fluxes with feed TDS and permeate volume for real HFPW
at a) different feed temperatures with constant flow velocity of 16.7 cm s-1 and b) different flow
velocities at 60 °C feed temperature. Experiments were run with feed outlet line closed. Distillate
stream was kept at 20 °C. Dashed lines represent the predicted water fluxes based on synthetic
HFPW.
3.4.3.3. DCMD with EC Pretreated HFPW
Pretreatment of the real HFPW is essential in order to suppress rapid membrane fouling
when develop a practical MD process. Further, the pretreatment process must be economically
viable and practical to implement in the field. Here we have investigated EC. EC pretreated
Page 90
76
samples using 1, 2 and 3 A were introduced to the DCMD system. All experiments were continued
until 2.45 L permeate were collected and feed was concentrated to 300 g L-1 TDS. Figure 7 give
the variation of water flux for different pretreated water samples. Dashed line shows the water
flux for synthetic HFPW. In addition, the result for HFPW without EC pretreatment is included.
As can be seen as the current used for EC pretreatment is increased, a lower decrease in water flux
is observed during DCMD. Using currents higher than 3 A did not lead to a significant
improvement in water flux in agreement with the results shown in Figure 3.
Fig. 7. Variation of water flux for pretreated and non-pretreated HFPW as functions of feed
salinity and permeate volume. The feed temperature was maintained at 60 ⁰C. Flow velocity of
both feed and distillate streams were maintained at 16.7 cm s-1. Predicted water flux is shown is
dashed line.
Page 91
77
Fig. 8 give SEM images of the surface of the ECTFE membranes after experiments with
pretreated feeds. As can be seen by comparing Figure 8.a,b and c, the degree of fouling decreasd
as the current used during EC increases. Comparing Figures 5 and 8, fouling is greatly suppressed
by EC pretreatment. These results are in agreement with the results shown in Figure 3 for the
removal efficiency of TOC, TSS and turbidity.
Fig. 8. SEM images of surface of ECTFE membrane after DCMD experiment with EC pretreated
HFPW samples. a) 1 A current, b) 2 A current and c) 3 A current.
Page 92
78
Preventing membrane wetting is of significant importance when operating MD systems.
Fouling induced wetting, resulting in product water contamination, is a significant concern for real
MD applications [31,64]. Membrane hydrophobicity and LEP are often related to membrane
wetting [21]. Sessile drop contact angle was measured for virgin and used ECTFE membranes.
The results are shown in Fig. 9. A contact angle of 130⁰ was measured for virgin ECTFE
membrane. After DCMD with synthetic HFPW, the contact angle was slightly decreased to 122⁰.
Although no significant fouling was detected in DCMD experiment with synthetic HFPW to cause
the contact angle to decrease, exposure to temperatures around 60 ⁰C can change the membrane
hydrophobicity [61]. In the case of pretreated HFPW, the membrane contact angle decreased as
the TOC content of feed increased. Contact angle of 76, 105 and 111⁰ were measured for EC
pretreated HFPW with 1, 2 and 3 A current, respectively. While for the case of raw HFPW, water
droplet could not be formed on membrane surface due to severe fouling and was immediately
adsorbed.
The average LEP of membranes is also reported in Fig. 9. The LEP follows the same trend
as the contact angle. The LEP decreases as the membrane fouling increases. Reduction of LEP
implies a greater likelihood of membrane wetting [60]. The occurrence of membrane wetting
depends not only on the LEP but also internal pore hydrophobicity [35]. LEP of 94, 216 and 249
kPa were measured for EC pretreated HFPW with 1, 2 and 3 A current, respectively.
Page 93
79
Fig. 9. Contact angle and LEP of fresh and tested ECTFE membranes. Both contact angle and
LEP decrease with an increase in organic content of DCMD feed water.
3.4.4. Modified Flux Prediction
Reduction of water flux due to membrane fouling can be related to changes in the overall
MD permeability coefficient according to Eq. (5). Here, we have modeled the decrease in flux in
terms of a change in the water permeability coefficient (A). Fig. 10.a gives the calculated water
permeability coefficient of the fouling layer (Af) for raw and pretreated HFPW as a function of
permeate volume. As can be seen, the permeability of fouling layer decreases as the permeate
volume increases. As expected, an increase in EC current resulted in higher fouling layer
permeability coefficients. Using Eq. (5) along with our flux prediction tool, water flux of EC
pretreated HFPW (3 A current) was estimated for different operating conditions. Fig. 10.b
Page 94
80
illustrates the variation of experimental and predicted water flux versus recovered permeate
volume. Feed and distillate temperatures were maintained at 60 and 20 ⁰C, respectively. Flow
velocities were kept constant at 16.7 cm s-1. The flux was modeled using the fouling layer
permeability coefficient calculated in Fig. 10.a. Af for the pretreated HFPW with 3 A current is
used. The fouling layer permeability coefficient could be used as a correction factor when the
vapor pressure data of the real feed streams, containing various organic and inorganic species, is
not available.
Fig. 10. a) Fouling layer permeability coefficient (Af) as a function of permeate volume. b)
experimental and predicted (using Af) water flux.
3.4.5. Long-term EC - DCMD Experiment
A long-term DCMD experiment was conducted to evaluate the performance of ECTFE
membrane for water recovery from EC pretreated HFPW. The experiment was carried out using
Page 95
81
pretreated HFPW with 3 A current as feed stream. Characteristics of this pretreated sample can
be found in Table 3. Feed and distillate temperatures were maintained at 60 and 20 ⁰C,
respectively. Flow velocity of both feed and distillate streams were kept constant at 9.3 cm s-1.
Experiment was first run in batch mode with the feed discharge outlet line closed. Feed water was
concentrated to 265 g L-1 (~50% recovery). This step was performed in 13:40 h. Then, the outlet
line was opened and TDS of feed was maintained constant at 265 g L-1 using proportional dosing
and discharge flow rates. Experiment ran for ~420 h in continuous mode. Clean permeate was
recovered in distillate tank, fresh pretreated feed was continuously added to feed tank and
concentrated brine was withdrawn from the feed tank and collected in the high TDS brine tank
(see Fig. 2). Conductivity of distillate was monitored throughout the experiment and maintained
below 50 µS cm-1 to ensure no wetting.
Fig. 11.a gives the variation of water flux and distillate conductivity as a function of run
time. Water flux decline was observed in the batch mode (first ≈14 h), as the feed was concentrated
the feed up to 265 g L-1 TDS. This flux decline was mainly due to the decrease in transmembrane
vapor pressure difference caused by increasing in feed salinity. As can be seen, almost a steady
water flux was observed for 420 h when the feed TDS was kept constant at 265 g L-1. time. Lokare
et al. [16] report a similar trend over 70 h experimental time for HFPW pretreated with 0.22 µm
microfiltration membrane and reducing the TOC content of the feed water to ~6 mg L-1 (here 37.8
mg L-1).
The TDS of the brine tank was measured during continuous operation to ensure it remained
constant at 265 g L-1. The TDS of the brine tank is lasso given in Figure 11 using the secondary
vertical axis. Figs. 11.b and 11.c show SEM images of two locations on the membrane surface
Page 96
82
after the long-term experiment. As can be seen, minor fouling and scaling were observed. At the
end of experiment, recovered permeate was characterized in terms of TOC and TSS content. 2.94
mg L-1 TOC was measured in the permeate, while the TSS was below detection limit. In MD not
only water vapor, but also volatile organic compounds, can vaporize and pass through the
membrane pores giving rise to the measured. Transport of organics across the membrane is linked
to contaminant volatility and hydrophobicity [65].
Fig. 11. Water flux and distillate conductivity as functions of time for the long- term DCMD
experiment. Pretreated HFPW with 3 A was used feed. Feed and distillate temperatures were kept
at 60 and 20 ⁰C, respectively. Flow velocity of both feed and distillate streams were at 9.3 cm s-1.
3.5. Concluding Remarks
Membrane separation processes can be utilized in treatment of HFPWs to maximize water
recovery and minimize the volume of concentrated brine that has to be disposed to the
Page 97
83
environment. Here, we obtained water recoveries up to 57 percent from an actual HFPW sample
containing 135 g L-1 dissolved solids. For real feed streams, containing surfactants and other
organic compounds, either pretreatment or optimized membrane surface properties will be
required in order minimize a flux decrease due to membrane fouling. The results obtained in this
work indicate the importance of pretreatment prior to DCMD when treating high salinity PWs. If
appropriately designed, pretreatment could successfully mitigate fouling and wetting during real
DCMD operations. We show that EC process could effectively remove most contaminations,
except for TDS, from actual HFPW. Maintaining a 3 A current in EC reactor for 30 sec, turbidity,
TSS and TOC were removed by 96, 91 and 61%, respectively. Higher removal of contaminates
such as TSS and TOC resulted in lower membrane fouling as well as lower water flux decline in
DCMD. Using resistant in series modeling for membrane permeability, considering a fouling layer
permeability coefficient, water flux of DCMD system for pretreated HFPW (3 A current) was
accurately estimated. EC pretreated water was concentrated up to 265 g L-1 in a continuous DCMD
process for over 434 h reporting stable water flux. However, we show that even small levels of
organic content could result in membrane fouling in longer experimental runs.
Acknowledgements
Funding for this work was provided by Southwestern Energy through the National Science
Foundation Industry/University Cooperative Research Center for Membrane Science, Engineering
and Technology, the National Science Foundation (IIP 1361809) and the University of Arkansas.
Appendix A.
Heat transfer rate across the membrane is expressed as follows:
Page 98
84
𝑄𝑚 = 𝐾∆𝑇 + 𝐽𝜆 (A.1)
The first term in Eq. (A.1) represents the conduction heat transfer across the membrane where K
and ∆T are conduction heat transfer coefficient and temperature difference across the membrane,
respectively. Conduction heat transfer coefficient is defined as follows:
𝐾 =(1−Ɛ)𝑘𝑚 + Ɛ𝑘𝑎
𝛿 (A.2)
where km is solid membrane thermal conductivity and ka is thermal conductivity of air. Eq. (A.2)
accounts for both solid structure as well as porous nature of the membrane. Second term in Eq.
(A.1) represents the heat transfer by water evaporation on feed side and consequent condensation
in the distillate stream, where λ is latent heat of vaporization.
In order to calculate the heat transfer across the membrane, bulk temperatures of feed and
distillate streams cannot be used due to thermal polarization. Fig. A.1 (a) illustrates the thermal
boundary layer on either side of the membrane. As can be seen, feed temperature at surface of the
membrane is lower than bulk feed temperature and the distillate temperatures at the surface of
membrane is higher than the bulk distillate temperature. The rate of convective heat transfer across
the boundary layers on either of the membrane is given as follwos:
𝑄𝐹 = ℎ𝐹(𝑇𝐹,𝑏 − 𝑇𝐹,𝑚) (A.3)
𝑄𝐷 = ℎ𝐷(𝑇𝐷,𝑏 − 𝑇𝐷,𝑚) (A.4)
where hF and hD are convective heat transfer coefficients for the feed dn distillate side thermal
boundary layers. As shown in Fig. A.1 (a), F, D and m subscripts imply feed, distillate and
Page 99
85
membrane surface, respectively. The heat transfer coefficients within the boundary layers may be
estimated from convective heat transfer correlations in rectangular ducts [66]:
ℎ =𝑁𝑢 𝐶𝑝
𝑑ℎ (A.5)
where Nu, Cp and dh are Nusselt number, specific heat capacity and channel hydraulic diameter,
respectively. For spacer-filled channels, the Nusselt number and hydraulic diameter can be
calculated as follows [67]:
𝑁𝑢 = 0.664 𝑘𝑑𝑐𝑅𝑒0.5𝑃𝑟0.33 (2𝑑ℎ
𝑙𝑚)
0.5
(A.6)
𝑑ℎ =2Ɛ𝑠𝑝
2
𝛿𝑠𝑝 +(1−Ɛ𝑠𝑝)(
2
𝑑𝑓)
(A.7)
where Re and Pr are Reynolds and Prandtl number and 𝑙𝑚, Ɛ𝑠𝑝, 𝛿𝑠𝑝 and 𝑑𝑓 are spacer filament
length, spacer voidage, spacer thickness and spacer filament diameter, respectively. Spacer
voidage is calculated as Eq. (A.8):
Ɛ𝑠𝑝 = 1 −𝛱 𝑑𝑓
2
2𝑙𝑚𝛿𝑠𝑝 sin(𝜃) (A.8)
In this equation, θ is the spacer inside angle. In equation (A.6), Kdc is a characteristic representative
of spacer and is defined as follows:
𝑘𝑑𝑐 = 1.654 Ɛ𝑠𝑝0.75 (
𝑑𝑓
𝛿𝑠𝑝)
0.039
(sin (𝜃
2))
0.086
(A.9)
The feed concentration at the membrane surface can be calculated using following equation [49]:
Page 100
86
𝐶𝑚 = 𝐶𝑏 𝑒𝐽
𝑘𝑐𝜌𝐹 (A.10)
where Cb is feed bulk concentration, kc is convective mass transfer coefficient for the feed side
concentration boundary layer and ρF is feed density. Analogous to convective heat transfer, mass
transfer can be calculated as following:
𝑘𝑐 =𝑆ℎ 𝐷𝐹
𝑑ℎ (A.11)
where Sh is Sherwood number and DF is solute diffusion coefficient. Given the large amount of
NaCl in the HFPW, the diffusion coefficient of NaCl is used. Analogous to definition of Nu
number, Sh is defined as follows (Sc is Schmidt number):
𝑆ℎ = 0.664 𝑘𝑑𝑐𝑅𝑒0.5𝑆𝑐0.33 (2𝑑ℎ
𝑙𝑚)
0.5
(A.12)
Fig. 1.A. Schematic diagram of a) temperature and concentration profiles across the membrane.
b) differential elements used for modeling.
Page 101
87
Modeling Procedure
A mathematical code was developed in MatLab 2016a. Properties of water and different
concentrations of sodium chloride in water as well as all other required parameters such as
membrane module geometries, membrane physical properties and operational conditions were
introduced into the code. Next a flat sheet membrane was subdivided into n differential elements.
See Fig. A.1 (b). Mass and heat transfer equations were solved simultaneously for each element
separately using following boundary conditions (Note: 𝐶𝑏𝑖𝑛, 𝑇𝐹,𝑏
𝑖𝑛 and 𝑇𝐷,𝑏𝑖𝑛 are known):
𝑎𝑡 𝑧 = 0 , 𝑇𝐹,𝑏 = 𝑇𝐹,𝑏𝑖𝑛 (A.13)
𝑎𝑡 𝑧 = 𝑙 , 𝑇𝐷,𝑏 = 𝑇𝐷,𝑏𝑖𝑛 (A.14)
𝑎𝑡 𝑧 = 0 , 𝐶𝑏 = 𝐶𝑏𝑖𝑛 (A.15)
Fig. A.2 gives the modeling strategy. The distillate outlet temperature (at z=0) was
assumed as the initial guess equal to feed inlet temperature as following:
𝑎𝑡 𝑧 = 0 , 𝑇𝐷,𝑏𝑜𝑢𝑡 = 𝑇𝐹,𝑏
𝑖𝑛
For each ith element, the feed temperature and concentration at the membrane surface as well as
the distillate temperature at membrane surface were assumed equal to the bulk concentration and
temperatures. For the ith element, the water flux (J) was calculated using the reduced Knudsen-
molecular diffusion model, convective heat transfer coefficients on feed and distillate sides (hf and
hD) were calculated using Eq. (A.5) and consequently, feed and distillate temperatures at
membrane surface (TF,m and TD,m) were calculated using overall heat balance as follows:
Page 102
88
𝑄𝐹 = 𝑄𝑚 = 𝑄𝐷 (A.16)
𝑇𝐹,𝑚 =ℎ𝐹𝑇𝐹,𝑏+(
𝑘𝑚𝛿
)(ℎ𝐹𝑇𝐹,𝑏
ℎ𝐷+𝑇𝐷,𝑏)−𝐽𝜆
𝑘𝑚𝛿
+ℎ𝐹+(𝑘𝑚ℎ𝐹
𝛿ℎ𝐷)
(A.17)
𝑇𝐷,𝑚 =ℎ𝐷𝑇𝐷,𝑏+(
𝑘𝑚𝛿
)(ℎ𝐷𝑇𝐷,𝑏
ℎ𝐹+𝑇𝐹,𝑏)+𝐽𝜆
𝑘𝑚𝛿
+ℎ𝐷+(𝑘𝑚ℎ𝐷
𝛿ℎ𝐹)
(A.18)
TF,m and TD,m were initially assumed and then calculated using equations (A.17) and (A.18). The
difference between the calculated values and assumed guesses was calculated as the error. If the
error was more than one percent, new values were substituted as new guesses and the procedure
repeated. Then the calculation was marched forward up to nth element. In the case of a difference
between boundary condition Eq. (A.14) and calculated TDin, the initially guessed TD
out was
decreased by 0.001 ⁰C. This method was continued until the difference between calculated TDin
and boundary condition (A.14) was less than one percent of calculated TDin.
Page 103
89
Fig. A.2. Algorithm of the MD flux prediction model.
Page 104
90
References
[1] R.D. Vidic, S.L. Brantley, J.M. Vandenbossche, D. Yoxtheimer, J.D. Abad, Impact of
shale gas development on regional water quality., Science. 340 (2013) 1235009.
doi:10.1126/science.1235009.
[2] A. Vengosh, R.B. Jackson, N. Warner, T.H. Darrah, A. Kondash, A critical review of the
risks to water resources from unconventional shale gas development and hydraulic
fracturing in the United States, Environ. Sci. Technol. 48 (2014) 8334–8348.
doi:10.1021/es405118y.
[3] J.M. Estrada, R. Bhamidimarri, A review of the issues and treatment options for
wastewater from shale gas extraction by hydraulic fracturing, Fuel. 182 (2016) 292–303.
doi:10.1016/j.fuel.2016.05.051.
[4] H. Thomas, Sampling and Analysis of Water Streams Associated with the Development of
Marcellus Shale Gas, Final Rep. Marcellus Shale Coalit. (2009) 249 pp.
[5] A. Fakhru’l-Razi, A. Pendashteh, L.C. Abdullah, D.R.A. Biak, S.S. Madaeni, Z.Z. Abidin,
Review of technologies for oil and gas produced water treatment, J. Hazard. Mater. 170
(2009) 530–551. doi:10.1016/j.jhazmat.2009.05.044.
[6] A.J. Kondash, E. Albright, A. Vengosh, Quantity of flowback and produced waters from
unconventional oil and gas exploration, Sci. Total Environ. 574 (2017) 314–321.
doi:10.1016/j.scitotenv.2016.09.069.
[7] R. Yang, E. Goktekin, K. K. Gleason, Zwitterionic Antifouling Coatings for the
Purification of High-Salinity Shale Gas Produced Water, Langmuir. 31 (2015) 11895–
11903. doi:10.1021/acs.langmuir.5b02795.
[8] D.M. Akob, A.C. Mumford, W. Orem, M.A. Engle, J.G. Klinges, D.B. Kent, I.M.
Cozzarelli, Wastewater Disposal from Unconventional Oil and Gas Development
Degrades Stream Quality at a West Virginia Injection Facility, Environ. Sci. Technol. 50
(2016) 5517–5525. doi:10.1021/acs.est.6b00428.
[9] K.B. Gregory, R.D. Vidic, D. a. Dzombak, Water Management Challenges Associated
with the Production of Shale Gas by Hydraulic Fracturing, Elements. 7 (2011) 181–186.
doi:10.2113/gselements.7.3.181.
[10] D.L. Shaffer, L.H. Arias Chavez, M. Ben-Sasson, S. Romero-Vargas Castrill??n, N.Y.
Yip, M. Elimelech, Desalination and reuse of high-salinity shale gas produced water:
Drivers, technologies, and future directions, Environ. Sci. Technol. 47 (2013) 9569–9583.
doi:10.1021/es401966e.
[11] K.B. Gregory, R.D. Vidic, D.A. Dzombak, Water management challenges associated with
Page 105
91
the production of shale gas by hydraulic fracturing, Elements. 7 (2011) 181–186.
doi:10.2113/gselements.7.3.181.
[12] D.J. Miller, X. Huang, H. Li, S. Kasemset, A. Lee, D. Agnihotri, T. Hayes, D.R. Paul,
B.D. Freeman, Fouling-resistant membranes for the treatment of flowback water from
hydraulic shale fracturing: A pilot study, J. Memb. Sci. 437 (2013) 265–275.
doi:10.1016/j.memsci.2013.03.019.
[13] B.D. Lutz, A.N. Lewis, M.W. Doyle, Generation, transport, and disposal of wastewater
associated with Marcellus Shale gas development, Water Resour. Res. 49 (2013) 647–656.
doi:10.1002/wrcr.20096.
[14] K. Sardari, P. Fyfe, D. Lincicome, S.R. Wickramasinghe, Aluminum electrocoagulation
followed by forward osmosis for treating hydraulic fracturing produced waters,
Desalination. 428 (2018) 172–181. doi:10.1016/j.desal.2017.11.030.
[15] Y. Zhang, K. Ghyselbrecht, R. Vanherpe, B. Meesschaert, L. Pinoy, B. Van der Bruggen,
RO concentrate minimization by electrodialysis: Techno-economic analysis and
environmental concerns, J. Environ. Manage. 107 (2012) 28–36.
doi:10.1016/j.jenvman.2012.04.020.
[16] O.R. Lokare, S. Tavakkoli, S. Wadekar, V. Khanna, R.D. Vidic, Fouling in direct contact
membrane distillation of produced water from unconventional gas extraction, J. Memb.
Sci. 524 (2017) 493–501. doi:10.1016/j.memsci.2016.11.072.
[17] N.H. Aly, A.K. El-Fiqi, Mechanical vapor compression desalination systems - A case
study, Desalination. 158 (2003) 143–150. doi:10.1016/S0011-9164(03)00444-2.
[18] L.M. Camacho, L. Dumée, J. Zhang, J. de Li, M. Duke, J. Gomez, S. Gray, Advances in
membrane distillation for water desalination and purification applications, Water
(Switzerland). 5 (2013) 94–196. doi:10.3390/w5010094.
[19] B.D. Coday, P. Xu, E.G. Beaudry, J. Herron, K. Lampi, N.T. Hancock, T.Y. Cath, The
sweet spot of forward osmosis: Treatment of produced water, drilling wastewater, and
other complex and difficult liquid streams, Desalination. 333 (2014) 23–35.
doi:10.1016/j.desal.2013.11.014.
[20] A. Alkhudhiri, N. Darwish, N. Hilal, Produced water treatment: Application of Air Gap
Membrane Distillation, Desalination. 309 (2013) 46–51. doi:10.1016/j.desal.2012.09.017.
[21] M.S. El-Bourawi, Z. Ding, R. Ma, M. Khayet, A framework for better understanding
membrane distillation separation process, J. Memb. Sci. 285 (2006) 4–29.
doi:10.1016/j.memsci.2006.08.002.
[22] E. Curcio, E. Drioli, Membrane Distillation and Related Operations—A Review, Sep.
Purif. Rev. 34 (2005) 35–86. doi:10.1081/SPM-200054951.
Page 106
92
[23] D. Singh, K.K. Sirkar, Desalination of brine and produced water by direct contact
membrane distillation at high temperatures and pressures, J. Memb. Sci. 389 (2012) 380–
388. doi:10.1016/j.memsci.2011.11.003.
[24] K.W. Lawson, D.R. Lloyd, Membrane distillation, J. Memb. Sci. 124 (1997) 1–25.
doi:10.1016/S0376-7388(96)00236-0.
[25] F. He, J. Gilron, H. Lee, L. Song, K.K. Sirkar, Potential for scaling by sparingly soluble
salts in crossflow DCMD, J. Memb. Sci. 311 (2008) 68–80.
doi:10.1016/j.memsci.2007.11.056.
[26] S. Srisurichan, R. Jiraratananon, A.G.G. Fane, Humic acid fouling in the membrane
distillation process, Desalination. 174 (2005) 63–72. doi:10.1016/j.desal.2004.09.003.
[27] L.D. Tijing, Y.C. Woo, J.-S. Choi, S. Lee, S.-H. Kim, H.K. Shon, Fouling and its control
in membrane distillation ─ A review, J. Memb. Sci. 475 (2014) 215–244.
doi:10.1016/j.memsci.2014.09.042.
[28] M. Gryta, Fouling in direct contact membrane distillation process, J. Memb. Sci. 325
(2008) 383–394. doi:10.1016/j.memsci.2008.08.001.
[29] M. Malmali, J. Askegaard, K. Sardari, S. Eswaranandam, A. Sengupta, S.R.
Wickramasinghe, Evaluation of ultrafiltration membranes for treating poultry processing
wastewater, J. Water Process Eng. 22 (2018). doi:10.1016/j.jwpe.2018.02.010.
[30] S. Karimi, K. Sardari, A.A. Khodadadi, M. Esmaili, Y. Mortazavi, Urea-functionalized
silica on top of graded structured gamma-alumina membranes, in: Sep. Div. 2015 - Core
Program. Area 2015 AIChE Annu. Meet., 2015.
[31] D.M. Warsinger, J. Swaminathan, E. Guillen-Burrieza, H.A. Arafat, J.H. Lienhard V,
Scaling and fouling in membrane distillation for desalination applications: A review,
Desalination. 356 (2015) 294–313. doi:10.1016/j.desal.2014.06.031.
[32] A.C.M. Franken, J.A.M. Nolten, M.H. V Mulder, D. Bargeman, C.A. Smolders, Wetting
criteria for the applicability of membrane distillation, J. Memb. Sci. 33 (1987) 315–328.
doi:10.1016/S0376-7388(00)80288-4.
[33] R.B. Saffarini, B. Mansoor, R. Thomas, H.A. Arafat, Effect of temperature-dependent
microstructure evolution on pore wetting in PTFE membranes under membrane
distillation conditions, J. Memb. Sci. 429 (2013) 282–294.
doi:10.1016/j.memsci.2012.11.049.
[34] S. Lin, S. Nejati, C. Boo, Y. Hu, C.O. Osuji, M. Elimelech, Omniphobic Membrane for
Robust Membrane Distillation, Environ. Sci. Technol. Lett. 1 (2014) 443–447.
doi:10.1021/ez500267p.
Page 107
93
[35] A. Deshmukh, C. Boo, V. Karanikola, S. Lin, A.P. Straub, T. Tong, D.M. Warsinger, M.
Elimelech, Membrane distillation at the water-energy nexus: limits, opportunities, and
challenges, Energy Environ. Sci. (2018). doi:10.1039/C8EE00291F.
[36] A.. Fallis, Membrane Handbook, 2013. doi:10.1017/CBO9781107415324.004.
[37] I. Sutzkover-Gutman, D. Hasson, Feed water pretreatment for desalination plants,
Desalination. 264 (2010) 289–296. doi:10.1016/j.desal.2010.07.014.
[38] C.T. Tanneru, S. Chellam, Mechanisms of virus control during iron electrocoagulation -
Microfiltration of surface water, Water Res. 46 (2012) 2111–2120.
doi:10.1016/j.watres.2012.01.032.
[39] S. Chellam, M.A. Sari, Aluminum electrocoagulation as pretreatment during
microfiltration of surface water containing NOM: A review of fouling, NOM, DBP, and
virus control, J. Hazard. Mater. 304 (2016) 490–501. doi:10.1016/j.jhazmat.2015.10.054.
[40] S. Zhao, G. Huang, G. Cheng, Y. Wang, H. Fu, Hardness, COD and turbidity removals
from produced water by electrocoagulation pretreatment prior to reverse osmosis
membranes, Desalination. 344 (2014) 454–462. doi:10.1016/j.desal.2014.04.014.
[41] E. Anfruns-Estrada, C. Bruguera-Casamada, H. Salvadó, E. Brillas, I. Sirés, R.M. Araujo,
Inactivation of microbiota from urban wastewater by single and sequential
electrocoagulation and electro-Fenton treatments, Water Res. 126 (2017) 450–459.
doi:10.1016/j.watres.2017.09.056.
[42] P.K. Holt, G.W. Barton, C.A. Mitchell, The future for electrocoagulation as a localized
water treatment technology., Chemosphere. 59 (2005) 355–367.
doi:10.1016/j.chemosphere.2004.10.023.
[43] D. Ghernaout, A.I. Al-Ghonamy, N. Ait Messaoudene, M. Aichouni, M.W. Naceur, F.Z.
Benchelighem, A. Boucherit, Electrocoagulation of Direct Brown 2 (DB) and BF Cibacete
Blue (CB) Using Aluminum Electrodes, Sep. Sci. Technol. 50 (2015) 1413–1420.
doi:10.1080/01496395.2014.982763.
[44] N.P. Gamage, S. Chellam, Aluminum electrocoagulation pretreatment reduces fouling
during surface water microfiltration, J. Memb. Sci. 379 (2011) 97–105.
doi:10.1016/j.memsci.2011.05.051.
[45] A. Bagga, S. Chellam, D.A. Clifford, Evaluation of iron chemical coagulation and
electrocoagulation pretreatment for surface water microfiltration, J. Memb. Sci. 309
(2008) 82–93. doi:10.1016/j.memsci.2007.10.009.
[46] M.Y. Mollah, R. Schennach, J.R. Parga, D.L. Cocke, Electrocoagulation (EC)--science
and applications., J. Hazard. Mater. 84 (2001) 29–41. doi:10.1016/S0304-3894(01)00176-
5.
Page 108
94
[47] A comprehensive review of electrocoagulation for water treatment: Potentials and
challenges, J. Environ. Manage. 186 (2017) 24–41.
doi:10.1016/J.JENVMAN.2016.10.032.
[48] Y. Yun, R. Ma, W. Zhang, A.G. Fane, J. Li, Direct contact membrane distillation
mechanism for high concentration NaCl solutions, Desalination. 188 (2006) 251–262.
doi:10.1016/j.desal.2005.04.123.
[49] S. Al-Obaidani, E. Curcio, F. Macedonio, G. Di Profio, H. Al-Hinai, E. Drioli, Potential of
membrane distillation in seawater desalination: Thermal efficiency, sensitivity study and
cost estimation, J. Memb. Sci. 323 (2008) 85–98. doi:10.1016/j.memsci.2008.06.006.
[50] W.C.L. Lay, J. Zhang, C. Tang, R. Wang, Y. Liu, A.G. Fane, Factors affecting flux
performance of forward osmosis systems, J. Memb. Sci. 394–395 (2012) 151–168.
doi:10.1016/j.memsci.2011.12.035.
[51] T. Picard, G. Cathalifaud-Feuillade, M. Mazet, C. Vandensteendam, Cathodic dissolution
in the electrocoagulation process using aluminium electrodes., J. Environ. Monit. 2 (2000)
77–80. doi:10.1039/a908248d.
[52] Electrocoagulation treatment of raw landfill leachate using iron-based electrodes: Effects
of process parameters and optimization, J. Environ. Manage. 204 (2017) 75–81.
doi:10.1016/J.JENVMAN.2017.08.028.
[53] M. Rebhun, M. Lurie, Control of organic matter by coagulation and floc separation, in:
Water Sci. Technol., 1993: pp. 1–20.
[54] E. Metcalf, H. Eddy, Wastewater engineering: treatment and reuse, 2003.
doi:10.1016/0309-1708(80)90067-6.
[55] M. Malmali, P. Fyfe, D. Lincicome, K. Sardari, S.R. Wickramasinghe, Selecting
membranes for treating hydraulic fracturing produced waters by membrane distillation,
Sep. Sci. Technol. 52 (2017) 266–275. doi:10.1080/01496395.2016.1244550.
[56] K. Smolders, A.C.M. Franken, Terminology for Membrane Distillation, Desalination. 72
(1989) 249–262. doi:10.1016/0011-9164(89)80010-4.
[57] D. Ghernaout, B. Ghernaout, A. Boucherit, M.W. Naceur, A. Khelifa, A. Kellil, Study on
mechanism of electrocoagulation with iron electrodes in idealised conditions and
electrocoagulation of humic acids solution in batch using aluminium electrodes, Desalin.
Water Treat. 8 (2009) 91–99. doi:10.5004/dwt.2009.668.
[58] B.E. Poling, G.H. Thomson, D.G. Friend, R.L. Rowley, W.V. Wilding, Perry’s Chemical
Engineers’ Handbook, 2007. doi:10.1036/0071511253.
[59] S. Karimi, D. Korelskiy, Y. Mortazavi, A.A. Khodadadi, K. Sardari, M. Esmaeili, O.N.
Page 109
95
Antzutkin, F.U. Shah, J. Hedlund, High flux acetate functionalized silica membranes
based on in-situ co-condensation for CO2/N2 separation, J. Memb. Sci. 520 (2016) 574–
582. doi:10.1016/j.memsci.2016.08.017.
[60] L. Han, Y.Z. Tan, T. Netke, A.G. Fane, J.W. Chew, Understanding oily wastewater
treatment via membrane distillation, J. Memb. Sci. 539 (2017) 284–294.
doi:10.1016/j.memsci.2017.06.012.
[61] A.L. McGaughey, R.D. Gustafson, A.E. Childress, Effect of long-term operation on
membrane surface characteristics and performance in membrane distillation, J. Memb.
Sci. 543 (2017) 143–150. doi:10.1016/j.memsci.2017.08.040.
[62] E. Drioli, S. Santoro, S. Simone, G. Barbieri, A. Brunetti, F. Macedonio, A. Figoli,
ECTFE membrane preparation for recovery of humidified gas streams using membrane
condenser, React. Funct. Polym. 79 (2014) 1–7.
doi:10.1016/j.reactfunctpolym.2014.03.003.
[63] M. Sillanpää, S. Metsämuuronen, M. Mänttäri, Natural Organic Matter in Water, 2015.
doi:10.1016/B978-0-12-801503-2.00005-7.
[64] H. Susanto, Towards practical implementations of membrane distillation, Chem. Eng.
Process. Process Intensif. 50 (2011) 139–150. doi:10.1016/j.cep.2010.12.008.
[65] K.A. Salls, D. Won, E.P. Kolodziej, A.E. Childress, S.R. Hiibel, Evaluation of semi-
volatile contaminant transport in a novel, gas-tight direct contact membrane distillation
system, Desalination. 427 (2018) 35–41. doi:10.1016/j.desal.2017.11.001.
[66] J. Phattaranawik, R. Jiraratananon, A.G. Fane, Heat transport and membrane distillation
coefficients in direct contact membrane distillation, J. Memb. Sci. 212 (2003) 177–193.
doi:10.1016/S0376-7388(02)00498-2.
[67] A.R. Da Costa, A.G. Fane, D.E. Wiley, Spacer characterization and pressure drop
modelling in spacer-filled channels for ultrafiltration, J. Memb. Sci. 87 (1994) 79–98.
doi:10.1016/0376-7388(93)E0076-P.
Page 110
96
Chapter 4. Aluminum Electrocoagulation Followed by Forward Osmosis for Treating
Hydraulic Fracturing Produced Waters
Abstract
Forward osmosis is an emerging membrane based separation technology that could find niche
applications in the treatment of oil and gas produced water. Here, the feasibility of treating
hydraulic fracturing produced waters using a combined electrocoagulation (EC) and forward
osmosis (FO) process has been investigated. EC is shown to be effective in removing suspended
solids and organic compounds which foul the membrane during FO. The amount of suspended
solids and organic compounds that are removed depends on the EC reaction time. By accounting
for internal and external concentration polarization as well as fouling due to deposition on the feed
side barrier surface of the FO membrane, the expected flux may be determined. The effectiveness
of removal of suspended solids and organic compounds may be modeled as changes in the
permeability of the foulant layer that develops on the feed side of the membrane. The results
obtained for real produced waters from Southwestern Energy operations in the Fayetteville Shale
indicate that combined EC and FO could be an effective method for water recovery from hydraulic
fracturing produced waters.
4.1. Introduction
Freshwater is a fundamental resource and integral to all ecological and societal activities.
Improper wastewater discharge can adversely affect nearby communities and ecosystems [1].
Produced water is a by-product from oil and gas recovery operations. Often produced waters are
highly impaired containing organic and inorganic contaminants. Development of cost-effective
Page 111
97
treatment processes for produced waters is of tremendous societal importance due to significant
possibility of surface and underground water and soil pollution. [2]. This is especially important
for development of unconventional gas reservoirs, including coalbed methane, tight gas and shale
gas [3]. Here we focus on hydraulic fracturing operations.
Economically viable gas production from shale reserves is achieved by horizontal drilling
followed by hydraulic fracturing [4]. Hydraulic fracturing is a stimulation technique used to
increase oil and gas production from shale and underground rock formations [5]. Hydraulic
fracturing flowback water, a subset of produced water, is defined as the stream returning to the
surface after the hydraulic fracturing process. This stream is often highly impaired containing
hazardous organic and inorganic constituents. The concentration of total dissolved solids (TDS) in
these streams can vary between about 13,000 to 400,000 mg/L [6,7]. Thus, treatment of these
produced waters is critical for developing economically viable hydraulic fracturing operations.
Treatment of highly impaired produced waters is challenging given the very high TDS as
well as the presence of dissolved organic contaminants. Membrane based separation technologies
such as microfiltration, ultrafiltration and nanofiltration are routinely used for treatment of
wastewater [8]. In addition, reverse osmosis (RO) is used for desalination of seawater to produce
drinking water [9]. RO is a very effective and applicable desalination process for treatment of low
TDS waters (TDS <47,000 mg L-1) [10]. However, membrane fouling and scaling is a primary
concern when operating RO systems [10,11]. The feed water requires rigorous pre-treatment to
prevent fouling of the reverse osmosis membrane [11,12]. Many new processes involving
osmotically and thermally driven membrane technologies are being investigated for desalination
of highly impaired wastewaters [9-13]. Here we consider forward osmosis.
Page 112
98
Osmosis is defined as the net movement of water across a selectively permeable membrane
driven by a difference in osmotic pressure across the membrane [14]. In FO, a draw solution
having a significantly higher osmotic pressure than the produced water flows on the permeate side
of the membrane. Due to the osmotic pressure gradient water flows from the feed to the draw
solution [15]. Using dense non-porous membranes with rejection properties similar to reverse
osmosis membranes, the feed solution is concentrated and the draw solution diluted [14,15]. The
advantages of FO include a high rate of water recovery, minimization of brine discharge, low
fouling and low energy consumption [16]. However, the viability of FO depends on efficient
regeneration of the draw solution. The availability of low-grade waste heat during oil and gas
production provides the possibility of using a thermolytic salt such as NH4HCO3, as a draw solute,
which can be easily regenerated by heating. Alternatively, nanofiltration or RO may be used to
concentrate the draw solution. Ge et al. [16] highlighted the importance of optimizing the draw
solute.
FO can be a very promising process for treating produced water streams especially as low-
grade waste heat is often present to aid in regenerating the FO draw solution. Unlike RO, FO does
not require the use of large hydraulic pressures [17]. FO can operate in harsh conditions (on-site)
with minimal access to electric power and supplies [11]. Mazlan et al. [18] indicated that there is
effectively no difference in specific energy consumption between FO combined with nanofiltration
for draw solution recovery and RO treatment of produced waters.
Although there is no pressure driven convection of rejected species towards the membrane
in FO, internal concentration polarization (CP) leads to reduced rates of water recovery. Internal
CP combined with the presence of small, highly fouling organic species can lead to significant
Page 113
99
flux decline due to fouling when treating produced waters [19]. Maltos et al. [20] reported major
fouling of FO membranes while treating raw produced water. Thus, pretreatment of the produced
water prior to FO is essential.
Numerous pretreatment processes have been considered prior to membrane filtration [21].
Biological pretreatment is impractical for treating hydraulic fracturing produced waters due to long
retention times and the low biodegradability of most of the contaminants [22]. Coagulation,
adsorption, preoxidation and prefiltration are among the most popular pretreatment methods prior
to membrane filtration [23]. Chemical pretreatment such as coagulation is frequently used to
remove colloidal and organic matter [23]. Here we focus on Electrocoagulation (EC) for removal
of colloidal and dissolved organic compounds that could foul the FO membrane.
EC is an electrochemical method for treating polluted water whereby sacrificial anodes
corrode to release active coagulant precursors into solution [24]. Compared to chemical
coagulation (e.g., using alum), EC provides a number of advantages including simple equipment,
easy operation, less maintenance, colorless and odorless effluent, low sludge production and
efficient removal of colloidal particles. Flocs formed by EC are similar to chemical flocs, except
that EC flocs tend to be much larger, contain less bound water, are acid-resistant and more stable,
and therefore, can be separated faster [25,26]. Further, in EC there are no moving parts, thus
requiring less maintenance compared to coagulation where efficient mixing is required. Use of
electricity, which can be expensive in many places, and regular replacement of sacrificial
electrodes are two major disadvantages of EC technology [25,27,28]. However, Kobya et al. [25]
indicated that electrical energy consumption decreases dramatically when the wastewater has
Page 114
100
higher conductivity due to the presence of dissolved salts. In case of hydraulic fracturing produced
waters, the conductivity is high due to high TDS.
In this study, and for the first time, we investigate the impact of produced water
pretreatment via EC prior to FO for fouling mitigation and water recovery. We design and develop
an EC system as a pre-treatment operation prior to FO.
4.2. Theory
4.2.1. Mass Transfer in FO System
The FO water flux may be represented by [29]:
𝐽𝑤 = 𝐴 (𝛱𝐷𝑏 − 𝛱𝐹𝑏) (1)
where Jw is water flux across the membrane, A is the pure water permeability coefficient, ΠDb and
ΠFb are the osmotic pressures of the bulk draw and feed solution respectively. The pure water
permeability coefficient will depend on the resistance to water flow through the membrane. In
reality, CP compromises performance. Fig. 1 shows the effect of CP on the osmotic pressure across
the membrane.
Page 115
101
Fig. 1. Effects of internal and external CP. a) De-ionized (DI) water as feed, b) synthetic
produced water as feed, c) raw produced water as feed.
In FO, the high ionic strength draw solution is pumped parallel to the membrane support
structure. External CP, leading to boundary layer formation adjacent to the support structure, will
dilute the draw solute relative to the bulk solution. Consequently, the value of 𝛱𝐷𝑏 will be higher
than the osmotic pressure at the external surface of the support structure. Further, internal CP will
occur within the support structure which will lead to a further dilution of the draw solute. This will
lead to a further decrease in the osmotic pressure of the draw solute at the internal surface of the
membrane barrier layer relative to 𝛱𝐷𝑏. On the feed side of the membrane, an external CP
boundary layer will form leading to an increase in the solute concentration of the feed at the
membrane surface relative to the bulk feed. This will lead to an increase in the osmotic pressure
of the feed relative to 𝛱𝐹𝑏 [30].
Fig. 1 (a) shows the variation of osmotic pressure across the membrane for a de-ionized
(DI) water feed stream and a high concentration NaCl draw solution. A reverse salt flux from the
draw to the feed side is included [30]. However, it is assumed that the reverse salt flux is low;
Page 116
102
therefore, there is no external CP boundary layer on the feed side. Fig. 1 (b) shows the variation
of osmotic pressure across the membrane when the feed consists of NaCl in DI water. This feed
stream is referred to as synthetic produced water. Due to the presence of NaCl in the feed solution,
an external CP boundary layer develops on the feed side of the membrane. As can be seen, the
presence of internal and external CP will lead to a decrease in the osmotic pressure difference
across the membrane which in turn will lead to a reduced flux.
In the case of real feed streams, fouling of the membrane by deposition of suspended
solutes and dissolved organic compounds, will further compromise the permeate flux [31]. Fig. 1
(c) shows the variation of osmotic pressure for a raw produced water feed stream and a draw
solution consisting of NaCl in DI water. The fouling of the feed side of the membrane due to
deposition of suspend solids and dissolved organic compounds is shown.
Bui et al. [30] have derived the following expression for the water flux during FO:
𝐽𝑤 = 𝐴. [𝛱𝐷𝑏 . 𝑒
(−𝐽𝑤{1
𝑘𝐷+
𝑆𝐷𝐷
} )−𝛱𝐹𝑏 . 𝑒
(𝐽𝑤𝑘𝐹
)
1 + 𝐵
𝐽𝑤 {𝑒
(𝐽𝑤𝑘𝐹
) − 𝑒
(−𝐽𝑤 {1
𝑘𝐷+
𝑆𝐷𝐷
} ) }
] (2)
This expression assumes that in the concentration boundary layer the osmotic pressure varies
linearly with salt concentration. In Eq. (2) kF and kD are mass transfer coefficients describing the
transport of water through the external CP boundary on the feed and draw solution side of the
membrane. For laminar flow (as is the case here), these mass transfer coefficients may be estimated
from the Sieder-Tate correlation for heat transfer in laminar flow [32]:
𝑆ℎ = 1.86 (𝑑ℎ
2 𝑣
𝐷𝐿)
0.33
(3)
Page 117
103
where Sh is the Sherwood number defined by
𝑆ℎ =𝑘𝑑ℎ
𝐷 (4).
In Eqs. (3) and (4), dh is the hydraulic diameter defined as 4(cross sectional area)/wetted perimeter,
v is the average velocity parallel to the membrane, D is the diffusion coefficient of the species
transferring through the membrane and L is the length of the channel. For a rectangular channel:
𝑑ℎ =4𝐿𝑊
2(𝐿+𝑊) (5)
where W is the width of the channel. Finally, k is either the feed or draw side mass transfer
coefficient, kf or kd, respectively.
S is the membrane structural parameter, defined as [30]:
𝑆 = 𝑡𝑠 𝜏 𝜖⁄ (6)
where ts and are the thickness, porosity and tortuosity of the support layer. DD is the diffusion
coefficient of the draw solute while A and B are the water and solute (in this case NaCl)
permeabilities, respectively. Lay et al. [31] have developed a resistance in series model to account
for changes in membrane permeability due to fouling. Here, we assume that fouling only occurs
on the barrier surface of the membrane that faces the feed solution. We further assume that no
fouling occurs on the membrane support structure. It is assumed that fouling does not affect the
feed side external CP boundary layer. Finally, we assume that as the reverse salt flux is low, fouling
has a minimal effect on the salt permeability coefficient. Analogous to Lay et al. [31], we define:
Page 118
104
1
𝐴=
1
𝐴𝑚+
1
𝐴𝑓 (7)
where the overall water permeability depends on the membrane permeability (Am) as well as the
permeability of a fouling layer (Af) on the feed side of the membrane (Fig. 1 (c)). We will use these
equations to model our experimental results. Table 1 lists the values of the various parameters used
here.
Table 1. Values of parameters and their source.
Parameter Definition Unit Value/Range Comments
A Pure water permeability
coefficient m s-1 bar-1 ≈1.8 – 3.0 (ꓫ 10-7)
Calculated in
this study
Am Membrane permeability
coefficient m s-1 bar-1 ≈1.75 – 3.0 (ꓫ 10-7) From [30,33]
Af Fouling layer
permeability coefficient m s-1 bar-1
≈0.5 – 7.0 (ꓫ 10-6) Calculated in
this study
B Solute permeability
coefficient m s-1 ≈2.0 – 3.0 (ꓫ 10-7) From [30,33]
C Concentration mol L-1 0.0 – 5.0
Used in this
study
D Solute (NaCl) diffusion
coefficient m2 s-1 1.3 – 4.14 From [34]
dh Hydraulic diameter m 0.0038 Calculated in
this study
I Current A (Ampere) 0.5 Used in this
study
Jw Water flux m s-1 ≈1.12 – 5.28 (ꓫ 10-6) Calculated in
this study
k Convective mass
transfer coefficient m s-1
≈2.5 – 3.15 (ꓫ 10-5) Calculated in
this study
Page 119
105
Table 1. Values of parameters and their source (Cont.)
Parameter Definition Unit Value/Range Comments
L Membrane module
length m 0.045
Used in this
study
Q Flow rate L min-1 0.8 Used in this
study
Re Reynolds number ≈479 - 646 Calculated in
this study
S Structural parameter m ≈450 - 650 From [33]
Sh Sherwood number ≈52 - 58 Calculated in
this study
ts Membrane thickness m ≈30 – 52 (ꓫ 10-6) From [35]
v Velocity m s-1 0.148 Used in this
study
V Voltage V (volt) ≈7.5 – 18.2 Observed in
this study
Vr EC reactor volume L (liter) 0.6 Used in this
study
W Membrane channel
width m 0.002
Used in this
study
Ɛ Porosity N/A
Indirectly
used in S
τ Tortuosity N/A
Indirectly
used in S
Π Osmotic pressure bar 0.0 – 123.8 Calculated in
this study
Page 120
106
4.2.2. EC
Chemical coagulation by adding aluminum sulfate salts (such as alum, Al2(SO4)3.18H2O)
is frequently practiced [36–38]. Coagulation is a complicated process that is highly pH sensitive,
and depends on the presence of other dissolved and suspended species. When alum is added, the
following overall reaction describes what happens immediately after dissolution of the salt:
𝐴𝑙2(𝑆𝑂4)3. 18𝐻2𝑂 → 2𝐴𝑙3+ + 3𝑆𝑂42− + 18𝐻2𝑂 (8)
2𝐴𝑙3+ + 3𝑆𝑂42− + 18𝐻2𝑂 → 2𝐴𝑙(𝑂𝐻)3 + 6𝐻+ + 3𝑆𝑂4
2− + 12𝐻2𝑂 (9)
Besides Al(OH)3, several other mononuclear complexes such as AlOH2+, Al(OH)2+, Al(OH)-
4, etc.
also form depending on the pH and other dissolved species present. As indicated by Eqs. (8) and
(9), hydrolysis of the coagulant leads to a decrease in pH. As the concentration of aluminum in
solution increases and the solution ‘ages’, polynuclear aluminum complexes form and aluminum
hydroxide precipitates as given by the following general scheme according to complex
precipitation kinetics [25];
𝐴𝑙3+ + 𝑛 𝑂𝐻− → 𝐴𝑙(𝑂𝐻)𝑛3−𝑛 → 𝐴𝑙2(𝑂𝐻)2
4+ → 𝐴𝑙𝑛(𝑐𝑜𝑚𝑝𝑙𝑒𝑥) → 𝐴𝑙(𝑂𝐻)3(𝑠) (10)
Formation of the various polymeric species is important in the coagulation process.
Precipitation and adsorption of the aluminum species with colloidal matter have been proposed as
the two main mechanisms of coagulation, both of which are highly pH dependent. In the case of
EC, the following electrode reactions occur [39]:
Anode: 𝐴𝑙 → 𝐴𝑙3+ + 3𝑒− (11)
Page 121
107
Cathode: 3𝐻2𝑂 + 3𝑒− →3
2𝐻2 + 3𝑂𝐻− (12)
Other reactions are also possible depending on the other dissolved ions in solution [25,26].
Analogous to coagulation by alum addition, the Al3+ and OH- ions from various monomeric species
such as Al(OH)2+ , Al(OH)2- and also polymeric species such as Al6(OH)15
3+ and Al7(OH)174+, again
eventually transforming to Al(OH)3 with a large surface area that can adsorb organic compounds
and also trap suspended particles [25]. Finally, Al(OH)3 flocs (with adsorbed organics and
colloidal particles) will polymerize and deposit according to the following reaction [40]:
𝑛 𝐴𝑙(𝑂𝐻)3 → 𝐴𝑙𝑛(𝑂𝐻)3𝑛 (13)
While the fundamental chemical reactions for alum based coagulation and EC are similar,
there are a number of advantages to EC [41]. In EC, the coagulant is produced in situ as the anode
is consumed; thus, no addition of liquid coagulant is needed. Hydrolysis of the coagulant does not
lead to a decrease in pH (consumption of alkalinity). EC requires less coagulant and produces less
sludge [42]. Addition of sulfate ions (or other counter ions) is not required.
4.3. Experimental
4.3.1. Produced Water
Produced water samples were collected from Southwestern Energy (Houston, TX) shale
gas production facilities in Fayetteville, Arkansas and were characterized at the Arkansas Water
Resources Center, University of Arkansas. In addition to the inorganic composition of the
wastewater samples, TDS, total suspended solids (TSS), total organic carbon (TOC) and turbidity
were measured. Cations and anions present were measured using Spectro Genesis ICP OES
Page 122
108
(Kleve, Germany) and Dionex DX-120 ion chromatograph (Sunnyvale, CA), respectively. TDS
and TSS were measured using EPA standard methods 160.1 and 160.2 [43], respectively. TOC
was measured using a Skalar Formacs TOC analyzer (Breda, Netherlands) and turbidity was
measured using a Turb 550 (WTW, Weilheim, Germany) turbidity-meter. Accuracy of the
chemical analysis was checked by the principle of electroneutrality, using the percent difference
between sum of anions and cations in equivalent weight per liter.
4.3.2. EC
The EC setup consisted of a polycarbonate vessel (600 mL), five electrodes with an active
surface area of 180 cm2 (6061 aluminum alloy, Sapa, Rosemont, IL) and a DC power source
(Hewlett Packard, Palp Alto, CA). As shown in Fig. 2, the electrodes were placed vertically in the
reactor with an 8 mm spacing between them. The first and last electrodes were connected to the
DC power source and acted as the cathode and anode, while the other three were bipolar and not
connected to the DC power source. All EC experiments were carried out in batch mode. The
current was maintained at 0.5 A (equivalent to current density of 2.78 mA cm-2) during each
experiment. The voltage was recorded every 20 seconds. Different reaction times were
investigated. After EC, wastewater samples were transferred to a separatory funnel for
sedimentation. After 6 h of sedimentation, the deposited sludge was removed from separatory
funnel and the pre-treated water was recovered.
Page 123
109
Fig. 2. EC setup.
4.3.3. Forward Osmosis Membrane
Cellulose triacetate (CTA) membranes with an embedded polyester screen support (HTI,
Albany, OR) were used as the salt rejecting semi-permeable FO membrane [44–47]. Membranes
were received in flat sheets containing glycerin in order to protect the membranes during shipping.
CTA membranes were soaked in DI water for 2 h and rinsed with DI water several times before
use.
4.3.4. Forward Osmosis Setup
Fig. 3 is a schematic representation of the FO apparatus. A polycarbonate tangential flow
cell, with 33.75 cm2 effective surface area and 2 mm channel depth, was used. In order to provide
mechanical support to the membrane and also to mitigate fouling, a mesh spacer (XN4510) was
Page 124
110
acquired from Industrial Netting (Minneapolis, MN) to fill the channels on both sides of the
membrane cell. Feed was circulated on the active (shiny) surface of the membrane with a flow
velocity of 14.8 cm s-1 (0.8 L min-1) and draw solution circulated on the opposite side of the
membrane (support layer) with the same flow velocity using two peristaltic pumps (Masterflex
I/P, Cole Parmer, Vernon Hills, IL). The feed and draw solution were returned to their respective
reservoirs. A computer-connected analytical balance (Mettler Toledo, Columbus, OH) recorded
the reduction in weight of the feed, which was used to calculate the water flux. Feed and draw
solution temperatures were monitored with digital thermometers employing k type thermocouples.
In addition, a digital conductivity-meter (VWR, Radnor, PA) was placed in the feed tank to record
the conductivity of the feed.
Fig. 3. Schematic diagram of FO setup
Page 125
111
4.3.5. FO Experiments
For each FO experiment, a CTA membrane coupon was first placed inside the membrane
cell. Feed and draw solution tanks were filled with 2 L of feed and 4 L of 4 M NaCl in DI water,
respectively. The peristaltic pumps were started and both feed and draw solutions were recirculated
back to their respective tanks while bypassing the membrane module (see Fig. 3), until the
temperature was stabilized at 23±1 °C for both streams. Then feed and draw solution streams were
allowed to flow on opposite surfaces of the CTA membrane inside the module at the same flow
rate of 14.8 cm s-1 (0.8 L min-1). Counter current flow continued until 600 mL of permeate was
recovered.
Table 2 lists the feed streams tested. Using DI water as the feed stream the reverse salt flux
was measured. Testing with a model produced water, containing the same TDS as raw produced
water by addition of NaCl to DI water, was conducted in order to determine membrane
performance in the absence of colloidal and dissolved organic species. Produced water as received
as well as after EC was tested. Some experiments were run for 24 hours in order to determine
membrane performance over longer periods. In addition, the effect of changing the NaCl
concentration in the draw solution was investigated. Finally, a high recovery FO experiment was
run with 1 L of pretreated produced water using 1 L of 2 M ammonium bicarbonate as draw
solution.
Page 126
112
Table 2. FO experiments conducted.
Experiments Feed Draw solution Length of experiment
Reverse salt flux
measurement DI water 4 M
Until 600 mL permeate
was collected
Control experiment Synthetic
produced water 4 M
Until 600 mL permeate
was collected
Fouling study Non-pretreated
produced water 4 M
Until 600 mL permeate
was collected
Fouling study Pre-treated
produced water 4 M
Until 600 mL permeate
was collected
Effect of draw solution
concentration
Pre-treated
produced water Range of 1 to 5 M
Until 600 mL permeate
was collected
Recovery comparison
Non-pretreated
and pretreated
produced water
4 M 24 hours
Ammonium bicarbonate
as draw solution
Non-pretreated
and pretreated
produced water
2 M ammonium
bicarbonate 32 hours
4.3.6. Scanning Electron Microscopy (SEM)
SEM using a Nova Nanolab 200 Duo-Beam Workstation (FEI, Hillsboro, Oregon) was
used to observe changes in the membrane surface before and after FO. SEM images were taken of
both the active and support structure.
Page 127
113
4.4. Results and Discussion
4.4.1. Produced Water Characterization
Characteristics of the produced water prior to EC (as received) and after EC for reaction
times of 1, 2 and 3 min are shown in Table 3. As it can be seen, there are three main categories of
contaminants; dissolved solids, suspended solids and organic matter. In this study, pretreatment
was employed to remove organic matter and suspended solids.
Table 3. Characterization of raw produced water as well as pretreated produced water by EC.
Characterization results are shown for 1, 2 and 3 min EC reaction times.
Parameter Unit Raw produced
water
1:00 min EC
Reaction
Time
2:00 min EC
Reaction
Time
3:00 min EC
Reaction
Time
TDS mg L-1 23254.8 22833.2 21791.6 21514.7
TSS mg L-1 639.1 294.0 25.6 24.8
TOC mg L-1 154.7 89.7 27.8 27.5
Turbidity NTU 117.1 12.8 3.51 2.34
pH - 7.74 7.83 7.88 8.05
Chloride mg L-1 12717 12355 12101 11841
Nitrate mg L-1 1.90 2.23 1.19 1.94
Sulfate mg L-1 123.35 119.44 111.86 104.69
Aluminum mg L-1 0.00 0.27 0.65 0.71
Barium mg L-1 3.36 0.97 2.13 2.23
Boron mg L-1 14.80 11.29 13.15 8.65
Calcium mg L-1 169.12 171.31 120.08 137.48
Page 128
114
Table 3. Characterization of raw produced water as well as pretreated produced water by EC.
Characterization results are shown for 1, 2 and 3 min EC reaction times (Cont.).
Parameter Unit Raw produced
water
1:00 min EC
Reaction
Time
2:00 min EC
Reaction
Time
3:00 min EC
Reaction
Time
Iron mg L-1 0.08 0.02 0.14 0.94
Lead mg L-1 0.03 0.01 0.01 0.01
Magnesium mg L-1 35.07 31.28 29.93 34.76
Potassium mg L-1 27.91 28.81 24.77 21.34
Selenium mg L-1 0.202 0.15 0.16 0.22
Sodium mg L-1 7602 7613 7568 7498
Electroneutrality
Percent
Difference
% < 2.0 < 0.5 < 0.5 < 1.0
4.4.2. EC Performance
During EC pretreatment, Al3+ and OH- ions produced by the electrodes (Al3+ at the anode
and OH- at the cathode) react to form a variety of aluminum species such as Al(OH)4-, Al6(OH)15
3+
and Al7(OH)174+ . These monomeric and polymeric species eventually turn into amorphous
Al(OH)3(s) with large surface area [48]. The Al(OH)3(s) remains in the aqueous phase in the form of
a gelatinous suspension that can remove organics and suspended solids from the produced water
by either complexation, electrostatic attraction, followed by coagulation and flotation or
sedimentation [49]. The remainder of the positively charged aluminum species such as Al(OH)2+
contribute to the destabilization of the organic macromolecules by charge neutralization,
producing X-Al complexes (X representing negatively charged organic compounds). X-Al
Page 129
115
complexes are then agglomerated as neutral colloidal entities and then carried up by hydrogen gas
flotation or precipitated by sedimentation [50,51]. On the other hand, presence of negatively
charged Al(OH)4- restricts the adsorption and complexation by charge repulsion. However, in the
pH range of 6 to 8 (here 7.73), conditions for rapid formation of Al(OH)3(s) solids prevail and
removal most likely occurs by adsorption [51].
Fig. 4 shows the coagulation process from the moment that produced water is placed in
separatory funnel. While the voltage is applied in the EC reactor, various Al species are produced
at the anode. After transferring the water sample from the EC reactor to the separatory funnel,
formed Al species will continue the coagulation process that was started in the EC reactor (Fig.
4a). Al species in solution agglomerate organic species as well as suspended solutes (Fig. 4b)
which leads to the development of low-density flocs. The low-density flocs are driven to the liquid-
air interface by the rising hydrogen bubbles produced at the cathode. As the flocs accumulate at
the liquid-air interface they aggregate, densify and sink to the bottom (Fig. 4c). Thus, three
different zones exist in the separatory funnel: the region next to the liquid-air interface contains
low-density flocs; the middle region contains clear water while aggregated flocs collect at the
bottom. The water from the middle region was removed after 6 hour sedimentation and used as
the feed for FO experiments. Flocs collected from top and bottom of the separatory funnel were
wasted.
Page 130
116
Fig. 4. Pretreated wastewater inside separatory funnel at: a) beginning of the coagulation process,
b) transition stage and c) after sedimentation for 6 hours.
Page 131
117
Different parameters can affect EC performance including current, voltage, reaction time,
electrode material, etc. Here, we try to optimize the electrochemical reaction time by applying a
fixed current 0.5 A for all experiments. Reaction times in the range of 1 to 3 min were tested.
Water recovered after EC was characterized in terms of TSS, TOC and turbidity. Fig. 5 gives the
removal of each of these parameters as a function of reaction time. The removal and energy
consumption are both functions of reaction time. As expected, longer reaction times resulted in
higher TSS, TOC and turbidity removal. Table 3 gives the characteristics of pretreated produced
water for reaction times of 1, 2 and 3 min. As can be seen, the TDS did not change much after EC.
Results in Fig. 5 show that the removal of TSS and TOC tend to plateau after a reaction time of 2
min.
The voltage was recorded every 20 seconds. Due to the generation of ionic species during
EC, the voltage was decreased to ensure a constant current of 0.5 A. The electrical energy
consumption per volume during EC was calculated using Eq. (14) [25]:
𝐸 =𝑉 ꓫ 𝐼 ꓫ 𝑡
𝑉𝑟 (14)
where V is average voltage, I is applied current, 𝑡 is reaction time and Vr is volume of feed water.
Increasing the EC reaction time from 1 to 3 min resulted in over 75 percent increase in turbidity
and TOC removal as well as over 10 percent increase in TSS removal. Higher removal was
achieved for longer reaction times which resulted in higher energy consumption. However,
increase in reaction time over 2 min did not greatly increase the removal.
Page 132
118
Fig. 5. Removal efficiency of turbidity, TSS and TOC as a function of EC reaction time. Energy
consumption of EC process as a function of reaction time is shown on the secondary vertical axis.
4.4.3. FO Performance
4.4.3.1. DI Water Feed
FO experiments were carried out using DI water as the feed in order to determine the
reverse salt flux. The results were also used to fit Eq. (1) and determine values for A and B. As it
can be seen, the average Reynolds number is 561 (see Table 1). For flow in channels (rectangular
duct), the critical Reynolds is 1500 [52] indicating laminar flow. The draw solution consisted of 4
M NaCl. The feed and draw solution were pumped countercurrent to the barrier and membrane
Page 133
119
support layer, respectively. Though the critical Reynolds number is likely to be lower for spacer
filled channels, the Reynold number in these experiments is much less than 1,500. Thus, we
assume laminar flow.
Fig. 6 shows the variation of water flux and conductivity as functions of permeate volume.
Values of 3ꓫ10-7 m s-1 bar-1 and 2ꓫ10-7 m s-1 where used for A and B respectively in Eq. (2) in
order to model the water flux as a function of permeate volume (dashed line). As can be seen in
Fig. 6, the flux decline occurs simultaneously with an increase in feed conductivity. The
conductivity increases due to the reverse salt flux, i.e., salt passage, from the draw solution to feed
(DI water).
The reverse salt flux was found to be 29.17 g m-2 h-1. It was calculated by multiplying the
rate of change of feed concentration with time by the volume of the feed solution and then dividing
by the area of the membrane after 600 mL of feed solution had passed through the membrane [33].
Cath et. al. [33] reported that the reverse salt flux for CTA membranes to be less than 25 g m-2 h-1
when 1 M draw solution is used. Boo et. al. [19] reported the reverse salt flux for a CTA membrane
to be ≈0.24 mol m-2 h-1 (≈14 g m-2 h-1) with 0.5 M draw solution. Our results are in keeping with
these earlier results as the concentration of our draw solution is 4 M. It is important to realize that
the error in empirical mass transfer correlations is on the order of 10% [53]. Consequently, error
sin A and B are likely to be of at least a similar order.
As can be seen from Fig. 6, the water flux declines slightly during the experiment. This is
due to the increase in conductivity of the feed and decrease in conductivity of the draw solution
due to dilution of the draw solution. The reverse salt flux is very low. For a membrane area of
33.75 cm2 and a run time of 9 h and 8 min (time taken for 600 mL to transfer from feed to draw
Page 134
120
solution) the total mass of NaCl transferred is 0.89 g. No noticeable deposition on the membrane
support was observed.
Fig. 6. Water flux and conductivity as functions of permeate volume for feed and draw solutions
consisting of DI water and 4 M NaCl in DI water, respectively.
4.4.3.2. FO Experiments with Synthetic, Raw and Pretreated Produced Water
FO experiments were conducted using synthetic, raw and pretreated produced waters. The
synthetic produced water consisted of 23,254 mg L-1 (0.4 M) NaCl in DI water. This represents
the same TDS as the raw produced water (see Table 3). Fig. 7 shows the variation of water flux
with the permeate volume. The water flux decreases for all feed streams as water is transferred
Page 135
121
from the feed to the draw solution. The predicted water flux, dashed line, using the values of A
and B that gave the best fit for a DI water feed (3ꓫ10-7 m s-1 for A and 2ꓫ10-7 m s-1 for B, see Figure
6) is in excellent agreement with results obtained for the synthetic produced water flux. However,
in the case of raw or pretreated produced water, membrane fouling leads to a lower water flux.
Improved removal of TSS and TOC, by increasing the EC reaction time, leads to improved flux.
Fig. 7. Water flux as a function of permeate volume for synthetic, non-pretreated and pretreated
(2 min and 1 min EC reaction times) produced water.
Fig. 8 gives the corresponding SEM images of the membrane barrier layer after FO using
the 4 feed streams tested in Fig. 7. Comparing Fig. 7 and 8, the greater the degree of deposition
the lower the flux after removal of the same permeate volume. Comparing Fig. 7 and Table 2, the
Page 136
122
more effective the removal of TSS and TOC during pretreatment, the less deposition on the
membrane surface and the greater the permeate flux.
Fig. 8. SEM images of the membrane barrier layer after FO. (a) synthetic produced water, (b)
produced water pretreated with 2.0 min EC reaction time; (c) produced water pretreated with 1.0
min EC reaction time, d) non-pretreated produced water
Figs. 7 and 8 indicate that the observed decrease in flux for real produced waters compared
to synthetic produced water is due mainly to adsorption of rejected species, suspended solids and
dissolved organic compounds, on the membrane active surface. Using Eq. (7), we have modeled
this decrease in flux in terms of a change in the water permeability coefficient of the membrane.
Fig. 9 gives the calculated water permeability coefficient of the fouling layer Af for pretreated and
Page 137
123
non-pretreated produced waters. As can be seen, the permeability of fouling layer decreases as the
permeate volume increases.
Fig. 9. Water permeability coefficient of fouling layer (Af) as a function of permeate volume for
pretreated (2 min and 1 min EC reaction time) and non-pretreated produced water.
4.4.4. Effect of Draw Solution Concentration on FO Performance
In order to verify the utility of Eqs. (2) and (7) at predicting the permeate flux during FO,
additional experiments were conducted using produced water pretreated with 2.0 min EC reaction
time. The NaCl concentration in the draw solution was varied from 1 to 4 M. Fig. 10 gives the
water flux as a function of NaCl concentration in the draw solution after 600 mL of permeate has
Page 138
124
been recovered. The dashed curve gives our model prediction. The value of Af, the water
permeability of the fouling layer, was taken from Fig. 9 for produced water pretreated with 2.0
min EC reaction time after recovery of 600 mL of permeate. Fig. 10 indicates that while an increase
in activity of the draw solution will lead to an increase in permeate flux the increase is not linear.
As can be seen, as the NaCl concentration deviates from 4.0 M, the difference between the
predicted and experimentally determined fluxes increases. This is not unexpected.
At lower NaCl concentrations, the reverse salt flux will be less. The external and internal
CP boundary layers on the draw solution side will be altered by changes in the NaCl concentration
in the draw solution. Further, Boo et al. [19] indicate that a decrease in draw solution concentration
results in a decrease in the level of fouling. Fouling will depend on the water flux as well as the
concentration of foulants in the feed solution. Since the value of Af used here was for a 4.0 M NaCl
draw solution, it is not surprising that our predicted flux is less than the observed flux for lower
NaCl concatenation draw solutions. Analogously, for draw solutions containing more than 4.0 M
NaCl, our model over-predicts the permeate flux.
The results obtained here indicate the importance of considering the various mass transfer
resistances that exist as water is transferred for the feed to the draw solution. Further for real
produced waters, membrane fouling can be significant. Predicting changes in water permeability
due to membrane fouling is complex as it depends on several factors including (e.g. draw solution
concentration, flow rates etc.) as well as the concentration and type of foulants present in the feed.
Page 139
125
Fig. 10. Variation of water flux with draw solution concentration. All experiments continued
until 600 mL permeate was recovered. Pretreated produced water, 2 min EC reaction time, was
used as the feed.
4.4.5. Effect of EC Pretreatment on Water Recovery
The economic viability of FO will depend on the cost of the recovered water or the total
volume of permeate. While EC leads to higher permeate fluxes, it is the increase in water
recovery versus the additional cost of the EC step that will determine the economic viability of
the process. In addition, membrane cleaning and regeneration costs will have to be considered.
Fig. 11 gives the volume of recovered water as a function of time. For this specific set of
experiments, which were run for 24 hours, water recovery increased by close to 21% with EC
pretreatment.
Page 140
126
Fig. 11. Water recovery for raw and pretreated (2 min EC reaction time) produced water.
Experiments were conducted in 24 hours.
Besides maximizing water recovery while minimizing cost, the feasibility of developing a
combined EC-FO system for recovering produced water will depend on a number of other factors.
Suitable FO membranes and adequate EC pretreatment of the feed to suppress fouling is essential.
Development of efficient cleaning protocols for membrane regeneration will be necessary as well
as the availability of a draw solution that has a high enough activity such that the activity difference
between the feed and draw solution is sufficient to lead to practical permeate fluxes and water
recovery.
Recovery and reuse of the draw solute is essential when considering FO[54]. McCutcheon
et al. [55] introduced the mixture of two highly soluble gases, ammonia and carbon dioxide, as a
Page 141
127
low-cost, effective and regenerable draw solution. This draw solution is made by dissolving
ammonium bicarbonate in water. In addition to NaCl, we have investigated the effect of EC
pretreatment on water recovery by FO using 2 M ammonium bicarbonate as draw solution. Figure
12 represents the volume of recovered water as well as water recovery as functions of time. As can
be seen, 2 min EC pretreatment resulted in 19 percent water recovery increase over 32 hours of
experiment. In a practical applications loss of the draw solute must be investigated as this will
affect the viability of the process [56,57]. Finally, the cost of a combined EC FO process must be
compared to current treatment options such as trucking to a centralized treatment facility as well
as the benefit of recovering water for reuse on site.
Fig. 12. Water recovery for raw and pretreated (2 min EC reaction time) produced water. 1 L
raw/pretreated PW and 1 L of 2 M ammonium bicarbonate solutions were used as feed and draw
solutions, respectively. Experiments were conducted in 32 hours.
Page 142
128
4.5. Conclusion
Here we have focused on pretreatment of a produced water feed stream prior to FO. We
show that significant fouling and consequently, a drop in flux will occur when treating hydraulic
fracturing produced waters due to the presence of high values of TOC and TSS. We show that EC
prior to FO significantly reduces membrane fouling. Though NaCl is used as the draw solute,
development of an actual combined EC-FO process will require the use of a draw solute that can
be economically recovered. Further, cross-over of the draw solute into feed will affect the viability
of the process. We show that for an EC reaction time of two min as a pretreatment step, over 70%
reduction of TSS, TOC and turbidity results. Over a 24 hour period, suppression in fouling due to
this pretreatment, leads to close to 21% increase in water recovery.
Pretreatment of hydraulic fracturing flowback waters will be essential if membrane-based
separation processes such as FO are to be used to treat these highly impaired waters. The permeate
flux may be predicted by using a resistance in series model to account for internal and external CP
as well as fouling of the membrane barrier layer by adsorbed species in the produced water. EC
units with a small footprint could be integrated with a FO system. The economic feasibility of the
process will depend on the cost of the recovered water, membrane lifetime and recovery and reuse
of the draw solute.
Acknowledgements
Funding for this work was provided by Southwestern Energy through the National Science
Foundation Industry/University Cooperative Research Center for Membrane Science, Engineering
and Technology, the National Science Foundation (IIP 1361809) and the University of Arkansas.
Page 143
129
References
[1] P.H. Gleick, L. Allen, M.J. Cohen, H. Cooley, J. Christian-Smith, M. Heberger, J.
Morrison, M. Palaniappan, P. Schulte, The World’s Water, Vol. 7, The Biennal Report on
Freshwater Resources, 2012. doi:10.1007/978-1-59726-228-6.
[2] A. Fakhru’l-Razi, A. Pendashteh, L.C. Abdullah, D.R.A. Biak, S.S. Madaeni, Z.Z. Abidin,
Review of technologies for oil and gas produced water treatment, J. Hazard. Mater. 170
(2009) 530–551. doi:10.1016/j.jhazmat.2009.05.044.
[3] C.R. Clarkson, Production data analysis of unconventional gas wells: Review of theory
and best practices, Int. J. Coal Geol. 109–110 (2013) 101–146.
doi:10.1016/j.coal.2013.01.002.
[4] K.B. Gregory, R.D. Vidic, D. A. Dzombak, Water Management Challenges Associated
with the Production of Shale Gas by Hydraulic Fracturing, Elements. 7 (2011) 181–186.
doi:10.2113/gselements.7.3.181.
[5] United States Environmental Protection Agency, Study of the Potential Impacts of
Hydraulic Fracturing on Drinking Water Resources, EPA Prog. Rep. 601/R (2012) 1–7.
[6] N. Abualfaraj, P.L. Gurian, M.S. Olson, Characterization of Marcellus Shale Flowback
Water, Environ. Eng. Sci. 31 (2014) 140716083132007. doi:10.1089/ees.2014.0001.
[7] R. Yang, E. Goktekin, K. K. Gleason, Zwitterionic Antifouling Coatings for the
Purification of High-Salinity Shale Gas Produced Water, Langmuir 31 (2015) 11895–
11903. doi:10.1021/acs.langmuir.5b02795.
[8] S. Munirasu, M.A. Haija, F. Banat, Use of membrane technology for oil field and refinery
produced water treatment—A review, Process Saf. Environ. Prot. 100 (2016) 183–202.
doi:10.1016/j.psep.2016.01.010.
[9] T.Y. Cath, Osmotically and thermally driven membrane processes for enhancement of
water recovery in desalination processes, Desalin. Water Treat. 15 (2010) 279–286.
doi:10.5004/dwt.2010.1760.
[10] J. Drewes, T. Cath, P. Xu, J. Graydon, An Integrated Framework for Treatment and
Management of Produced Water, Tech. Assess. Prod. Water Treat. Technol. (2009) 8–
128. http://www.rpsea.org/media/files/user/cath1.pdf.
[11] B.D. Coday, P. Xu, E.G. Beaudry, J. Herron, K. Lampi, N.T. Hancock, T.Y. Cath, The
sweet spot of forward osmosis: Treatment of produced water, drilling wastewater, and
other complex and difficult liquid streams, Desalination 333 (2014) 23–35.
doi:10.1016/j.desal.2013.11.014.
Page 144
130
[12] C. Fritzmann, J. Löwenberg, T. Wintgens, T. Melin, State-of-the-art of reverse osmosis
desalination, Desalination 216 (2007) 1–76. doi:10.1016/j.desal.2006.12.009.
[13] F. Edwie, T.S. Chung, Development of hollow fiber membranes for water and salt
recovery from highly concentrated brine via direct contact membrane distillation and
crystallization, J. Memb. Sci. 421–422 (2012) 111–123.
doi:10.1016/j.memsci.2012.07.001.
[14] T. Cath, A. Childress, M. Elimelech, Forward osmosis: Principles, applications, and recent
developments, J. Memb. Sci. 281 (2006) 70–87. doi:10.1016/j.memsci.2006.05.048.
[15] J.R. McCutcheon, R.L. McGinnis, M. Elimelech, A novel ammonia-carbon dioxide
forward (direct) osmosis desalination process, Desalination. 174 (2005) 1–11.
doi:10.1016/j.desal.2004.11.002.
[16] Q. Ge, M. Ling, T.S. Chung, Draw solutions for forward osmosis processes:
Developments, challenges, and prospects for the future, J. Memb. Sci. 442 (2013) 225–
237. doi:10.1016/j.memsci.2013.03.046.
[17] D.L. Shaffer, L.H. Arias Chavez, M. Ben-Sasson, S. Romero-Vargas Castrilln, N.Y. Yip,
M. Elimelech, Desalination and reuse of high-salinity shale gas produced water: Drivers,
technologies, and future directions, Environ. Sci. Technol. 47 (2013) 9569–9583.
doi:10.1021/es401966e.
[18] N.M. Mazlan, D. Peshev, A.G. Livingston, Energy consumption for desalination — A
comparison of forward osmosis with reverse osmosis, and the potential for perfect
membranes, Desalination 377 (2016) 138–151. doi:10.1016/j.desal.2015.08.011.
[19] C. Boo, M. Elimelech, S. Hong, Fouling control in a forward osmosis process integrating
seawater desalination and wastewater reclamation, J. Memb. Sci. 444 (2013) 148–156.
doi:10.1016/j.memsci.2013.05.004.
[20] R. Maltos, S. Fox, J. Regnery, B.D. Coday, T.Y. Cath, Onsite Treatment of Raw Produced
Water through the Use of Forward and Reverse Osmosis, in: Am. Ist. Chem. Eng., 2016.
[21] K. Farahbakhsh, C. Svrcek, R.K. Guest, D.W. Smith, A review of the impact of chemical
pretreatment on low-pressure water treatment membranes, J. Environ. Eng. Sci. 3 (2004)
237–253. doi:10.1139/s03-078.
[22] E. Metcalf, H. Eddy, Wastewater engineering: treatment and reuse, 2003.
doi:10.1016/0309-1708(80)90067-6.
[23] H. Huang, K. Schwab, J.G. Jacangelo, Pretreatment for Low Pressure Membranes in
Water Treatment: A Review, Environ. Sci. Technol. 43 (2009) 3011–3019.
doi:10.1021/es802473r.
Page 145
131
[24] P.K. Holt, G.W. Barton, C.A. Mitchell, The future for electrocoagulation as a localized
water treatment technology., Chemosphere. 59 (2005) 355–367.
doi:10.1016/j.chemosphere.2004.10.023.
[25] M. Kobya, O.T. Can, M. Bayramoglu, Treatment of textile wastewaters by
electrocoagulation using iron and aluminum electrodes, J. Hazard. Mater. 100 (2003) 163–
178. doi:10.1016/S0304-3894(03)00102-X.
[26] E. Butler, Y.-T. Hung, R.Y.-L. Yeh, M. Suleiman Al Ahmad, Electrocoagulation in
Wastewater Treatment, Water. 3 (2011) 495–525. doi:10.3390/w3020495.
[27] M.Y. Mollah, R. Schennach, J.R. Parga, D.L. Cocke, Electrocoagulation (EC)--science
and applications., J. Hazard. Mater. 84 (2001) 29–41. doi:10.1016/S0304-3894(01)00176-
5.
[28] O. Sahu, B. Mazumdar, P.K. Chaudhari, Treatment of wastewater by electrocoagulation:
A review, Environ. Sci. Pollut. Res. 21 (2014) 2397–2413. doi:10.1007/s11356-013-2208-
6.
[29] J.R. McCutcheon, M. Elimelech, Influence of concentrative and dilutive internal
concentration polarization on flux behavior in forward osmosis, J. Memb. Sci. 284 (2006)
237–247. doi:10.1016/j.memsci.2006.07.049.
[30] N.N. Bui, J.T. Arena, J.R. McCutcheon, Proper accounting of mass transfer resistances in
forward osmosis: Improving the accuracy of model predictions of structural parameter, J.
Memb. Sci. 492 (2015) 289–302. doi:10.1016/j.memsci.2015.02.001.
[31] W.C.L. Lay, J. Zhang, C. Tang, R. Wang, Y. Liu, A.G. Fane, Factors affecting flux
performance of forward osmosis systems, J. Memb. Sci. 394–395 (2012) 151–168.
doi:10.1016/j.memsci.2011.12.035.
[32] D. Jo, O.S. Al-Yahia, R.M. Altamimi, J. Park, H. Chae, Experimental Investigation of
Convective Heat Transfer in a Narrow Rectangular Channel for Upward and Downward
Flows, Nucl. Eng. Technol. 46 (2014) 195–206. doi:10.5516/NET.02.2013.057.
[33] T.Y. Cath, M. Elimelech, J.R. McCutcheon, R.L. McGinnis, A. Achilli, D. Anastasio,
A.R. Brady, A.E. Childress, I. V. Farr, N.T. Hancock, J. Lampi, L.D. Nghiem, M. Xie,
N.Y. Yip, Standard Methodology for Evaluating Membrane Performance in Osmotically
Driven Membrane Processes, Desalination 312 (2013) 31–38.
doi:10.1016/j.desal.2012.07.005.
[34] B.E. Poling, G.H. Thomson, D.G. Friend, R.L. Rowley, W.V. Wilding, Perry’s Chemical
Engineers’ Handbook, 2007. doi:10.1036/0071511253.
[35] C.Y. Tang, Q. She, W.C.L. Lay, R. Wang, A.G. Fane, Coupled effects of internal
concentration polarization and fouling on flux behavior of forward osmosis membranes
Page 146
132
during humic acid filtration, J. Memb. Sci. 354 (2010) 123–133.
doi:10.1016/j.memsci.2010.02.059.
[36] A. Amirtharajah, K.M. Mills, Rapid-Mix Design for Mechanisms of Alum Coagulation.,
J. Am. Water Work. Assoc. 74 (1982) 210–216. doi:10.2307/41271001.
[37] P.K. Holt, G.W. Barton, M. Wark, C.A. Mitchell, A quantitative comparison between
chemical dosing and electrocoagulation, Colloids Surfaces A Physicochem. Eng. Asp. 211
(2002) 233–248. doi:10.1016/S0927-7757(02)00285-6.
[38] T. Harif, M. Khai, A. Adin, Electrocoagulation versus chemical coagulation:
Coagulation/flocculation mechanisms and resulting floc characteristics, Water Res. 46
(2012) 3177–3188. doi:10.1016/j.watres.2012.03.034.
[39] T. Picard, G. Cathalifaud-Feuillade, M. Mazet, C. Vandensteendam, Cathodic dissolution
in the electrocoagulation process using aluminium electrodes., J. Environ. Monit. 2 (2000)
77–80. doi:10.1039/a908248d.
[40] M. Rebhun, M. Lurie, Control of organic matter by coagulation and floc separation, Water
Sci. Technol., 1993: pp. 1–20.
[41] B. Zhu, D.A. Clifford, S. Chellam, Comparison of electrocoagulation and chemical
coagulation pretreatment for enhanced virus removal using microfiltration membranes,
Water Res. 39 (2005) 3098–3108. doi:10.1016/j.watres.2005.05.020.
[42] D. Mills, New process for electrocoagulation, J. Am. Water Work. Assoc. 92 (2000) 34–
43.
[43] E. Metcalf, H. Eddy, Wastewater engineering: treatment and reuse, 2003.
doi:10.1016/0309-1708(80)90067-6.
[44] K.L. Hickenbottom, N.T. Hancock, N.R. Hutchings, E.W. Appleton, E.G. Beaudry, P. Xu,
T.Y. Cath, Forward osmosis treatment of drilling mud and fracturing wastewater from oil
and gas operations, Desalination 312 (2013) 60–66. doi:10.1016/j.desal.2012.05.037.
[45] Z.Y. Li, V. Yangali-Quintanilla, R. Valladares-Linares, Q. Li, T. Zhan, G. Amy, Flux
patterns and membrane fouling propensity during desalination of seawater by forward
osmosis, Water Res. 46 (2012) 195–204. doi:10.1016/j.watres.2011.10.051.
[46] S. Phuntsho, F. Lotfi, S. Hong, D.L. Shaffer, M. Elimelech, H.K. Shon, Membrane scaling
and flux decline during fertiliser-drawn forward osmosis desalination of brackish
groundwater, Water Res. 57 (2014) 172–182. doi:10.1016/j.watres.2014.03.034.
[47] M. Xie, W.E. Price, L.D. Nghiem, M. Elimelech, Effects of feed and draw solution
temperature and transmembrane temperature difference on the rejection of trace organic
contaminants by forward osmosis, J. Memb. Sci. 438 (2013) 57–64.
Page 147
133
doi:10.1016/j.memsci.2013.03.031.
[48] D. Ghernaout, A.I. Al-Ghonamy, N. Ait Messaoudene, M. Aichouni, M.W. Naceur, F.Z.
Benchelighem, A. Boucherit, Electrocoagulation of Direct Brown 2 (DB) and BF Cibacete
Blue (CB) Using Aluminum Electrodes, Sep. Sci. Technol. 50 (2015) 1413–1420.
doi:10.1080/01496395.2014.982763.
[49] D. Ghernaout, A. Al-Ghonamy, M.W. Naceur, N. Messaoudene, M. Aichouni, Influence
of operating parameters on electrocoagulation of C.I. disperse yellow 3, J. Electrochem.
Sci. Eng. 4 (2014) 271–283. doi:http://dx.doi.org/10.5599/jese.146.
[50] D. Ghernaout, B. Ghernaout, A. Saiba, A. Boucherit, A. Kellil, Removal of humic acids
by continuous electromagnetic treatment followed by electrocoagulation in batch using
aluminium electrodes, Desalination 238 (2009) 295–308. doi:10.1016/j.desal.2008.04.001.
[51] D. Ghernaout, B. Ghernaout, A. Boucherit, M.W. Naceur, A. Khelifa, A. Kellil, Study on
mechanism of electrocoagulation with iron electrodes in idealised conditions and
electrocoagulation of humic acids solution in batch using aluminium electrodes, Desalin.
Water Treat. 8 (2009) 91–99. doi:10.5004/dwt.2009.668.
[52] E.M. Ephraim, M. Sparrow, J.P. John, P. Abraham, J.M. Gorman, Advances in Heat
Transfer, San Diego, CA, Elsevier Science, 2016.
http://www.sciencedirect.com/science/bookseries/00652717 (accessed March 26, 2017).
[53] E.L. Cussler, Diffusion: Mass Transfer in Fluid Systems, Engineering. Second Edition
(1997) 580. doi:10.1017/CBO9780511805134.010.
[54] T.-S. Chung, S. Zhang, K.Y. Wang, J. Su, M.M. Ling, Forward osmosis processes:
Yesterday, today and tomorrow, Desalination 287 (2012) 78–81.
doi:10.1016/j.desal.2010.12.019.
[55] J.R. McCutcheon, R.L. McGinnis, M. Elimelech, Desalination by ammonia-carbon
dioxide forward osmosis: Influence of draw and feed solution concentrations on process
performance, J. Memb. Sci. 278 (2006) 114–123. doi:10.1016/j.memsci.2005.10.048.
[56] J.-J. Qin, G. Danasamy, W.C.L. Lay, K.A. Kekre, Challenges in Forward Osmosis of
Seawater Using Ammonium Bicarbonate as Osmotic Agent, Am. J. Water Resour. 1
(2013) 51–55. doi:10.12691/ajwr-1-3-6.
[57] N.T. Hancock, T.Y. Cath, Solute coupled diffusion in osmotically driven membrane
processes, Environ. Sci. Technol. 43 (2009) 6769–6775. doi:10.1021/es901132x.
Page 148
134
Chapter 5. Integrated Electrocoagulation - Forward osmosis – Membrane Distillation
System for Sustainable Water Recovery from Hydraulic Fracturing Produced Water
Abstract
Forward osmosis (FO) and membrane distillation (MD) are emerging technologies of interest
for the treatment of high salinity brines. In this study, we aim to demonstrate the feasibility of an
integrated FO-MD system for water recovery from actual high salinity produced waters obtained
from shale gas extraction facilities. In the proposed hybrid system, FO draws water from high
salinity feed, while MD regenerates the diluted FO draw solution. We show that this process
integration can combine the advantages of both processes; low fouling tendency and high quality
permeate. We further integrated the FO-MD system with an electrocoagulation (EC) system as
pretreatment and showed a stable performance with minimal fouling. EC removed TOC and TSS
by up to 78 and 96%, respectively. We studied the impact of experimental conditions (temperature,
flow velocity and draw solution concentration) on performance of the integrated system in short-
term experiments. In addition, we conducted long-term experiments using two different produced
waters. We show that in order to achieve continuous high recoveries with maximized water flux,
a combination of two MD membranes can provide a viable solution.
5.1. Introduction
The largest waste stream produced within the oil and gas industry is produced water (PW),
with an annual estimated volume of 21 billion barrels in the United States (US) [1]. Discharging
untreated PW, containing various organic and inorganic components, can pollute surface and
underground water and soil. Major contaminants in PW (oil content and salinity) can be reduced
Page 149
135
through various physical, chemical, and biological methods [2]. However, treating the vast
amounts of PW in a cost-effective way, sometimes in remote locations, demands advanced
solutions, often a combination of several separation processes, so the water can be safely
discharged or re-used for other applications [3].
Hydraulic fracturing and horizontal drilling have enabled the oil and gas industry to rapidly
develop a large number of unconventional oil and gas reserves over the past two decades [4]. The
amount of dry natural gas produced directly from unconventional resources was increased from
0.3 trillion cubic feet (Tcf) in 2000 to 15.8 Tcf in 2016 [5,6]. The hydraulic fracturing process
generates large volumes of PW, ranging from 1.7 to 14.3 million L per well in the first 5-10 years
of production, requiring management [7]. The hydraulic fracturing PW mainly consists of injected
fracturing fluid and naturally occurring formation brines and it usually represents high levels of
total dissolved solids (TDS) (from 650 up to 400,000 mg L-1) [7]. Deep-well injection has been
the most common hydraulic fracturing PW management practice in the U.S. over the past two
decades [8–10]. However, costs as well as environmental concerns associated with deep-well
injection necessitate development of cost-effective and environmentally friendly technologies for
treatment of these wastewater streams, with primary consideration of TDS reduction [10]. A
number of treatment technologies are under investigation, such as forward osmosis (FO) [11],
membrane distillation (MD) [12], electrodialysis [13] mechanical vapor compression [14], multi-
effect distillation [15] and ion-exchange [16]. In this study, we focus an integrated FO-MD system.
FO has the potential to treat high TDS PW and generate high quality permeate. In FO, the
osmotic pressure difference is the driving force for water transport from the feed to a high
concentration draw solution (DS) across a semi-permeable membrane [17]. The FO process results
Page 150
136
in concentration of the feed stream and dilution of the DS. The main advantages of using FO are
operation at low or no hydraulic pressures, high rejection of a wide range of contaminants, simple
equipment requirement and lower membrane fouling propensity than pressure-driven membrane
processes such as reverse osmosis (RO) [18,19]. Research in the field of FO membrane technology
has grown significantly over the last 10 years, but its real application in the scope of PW treatment
has been much slower [20]. One of the main challenges associated with the widespread use of FO
is the efficient regeneration of DS. In continuous FO operation, diluted DS must be repeatedly
regenerated, using a thermodynamically favorable re-concentration system, in order to separate
the original DS from the product water [17,20]. A range of processes have been investigated
regarding DS recovery and reuse, including: conventional distillation, multi-stage flash,
electrodialysis, RO, nanofiltration (NF), etc. [21–28]. The chosen recovery system depends on the
type of application and solute, the recovery rate required and the energy consumption of the unit.
For hydraulic fracturing PW treatment, high feed TDS leads to use of high DS concentration. RO
and NF require elevated pressures when dealing with high TDS DS (e.g. 380 bar at 365,000 mg L-
1 sodium chloride in de-ionized (DI) water) [29]. Here, we focus on MD regarding DS recovery.
MD is a thermally-driven separation technology whereby the water recovery from the hot feed
takes place by the following steps: vaporization, transfer across a hydrophobic microporous
membrane and condensation in the permeate side [12,30]. The vapor pressure difference across
the membrane is the driving force for MD. Integrated FO-MD system has the potential for
sustainable treatment of high TDS PW and production of clean product water. MD can offer
complete rejection of nonvolatile substances in DS and its efficiency is relatively independent of
DS concentration [31]. In the hybrid FO-MD system, FO draws water from the feed solution,
while MD re-concentrates the diluted DS and produces clean product water. The integrated FO-
Page 151
137
MD process combines the advantages of both processes, providing low fouling tendency and high
permeate quality [32]. In addition, high operational temperature (e.g. 50-70 ⁰C) in MD can result
in higher recycled DS temperature and consequently, higher flux in FO as the FO driving force is
a linear function of temperature [33]. Use of MD can be a favorable and cost-effective method for
DS re-concentration, specifically when low-grade waste heat is abundant. So far, only a limited
number of studies on hybrid FO-MD have been reported in the literature for wastewater treatment
and feed solution concentration [21,31,33].
Although the fouling tendency of FO is thought to be lower than RO, NF and MD, the presence
of small, highly fouling suspended and organic species combined with internal concentration
polarization can lead to significant membrane fouling and flux deterioration when treating real PW
streams with FO [19]. Maltos et al. [20] and Bell et al. [34] reported major fouling of FO
membranes while treating raw PW In our previous work [11], we have demonstrated that a
pretreatment step prior to FO can successfully suppress fouling during FO and increase water
recovery. Here, we aim to further modify the hybrid FO-MD system by adding a pretreatment
step. Electrocoagulation (EC) is our proposed pretreatment method.
EC is a physio-chemical method where the separation of suspended particles and dissolved
macromolecular organic species from the feed water takes place by means of electrically forced
dissolution of coagulant precursors into solution followed by flocculation, charge neutralization
and consequently, phase separation (sedimentation or floatation) [11,35]. Although the chemical
basis of EC is similar to conventional coagulation (e.g. alum and ferric chloride coagulation), it
can provide the following advantages: lack of moving parts, ease of operation, reduced sludge
production, minimal use of added chemicals and low operating costs [36–38]. In addition, EC
Page 152
138
requires relatively low electrical energy input when treating wastewater streams with high
conductivity, making it a favorable pretreatment for high TDS PW [39].
Here, we aim to demonstrate the feasibility and stability of the integrated EC-FO-MD process
in water recovery from high salinity PW streams. We show that this process integration can be
used to systematically enhance and reconcile various objectives, such as cost effectiveness,
recovery and energy efficiency. Fig. 1 presents the concept of integrated EC-FO-MD process.
Fig. 1. Concept of integrated EC-FO-MD process. EC pretreats the feed PW, FO draws water
from the pretreated PW and MD re-concentrates the diluted DS. Integrated process combines the
strength of EC, FO and MD processes for high TDS PW treatment.
Page 153
139
5.2. Summary of Theoretical Background
5.2.1. Electrocoagulation
The following reactions occur in the EC reactor when using aluminum electrodes [40]:
Anode: 𝐴𝑙(𝑠) → 𝐴𝑙(𝑎𝑞)3+ + 3𝑒− (1)
Cathode: 2𝐻2𝑂 + 2𝑒− → 2𝑂𝐻− + 𝐻2 (2)
Analogous to chemical (alum) coagulation, the produced Al3+ and OH- ions form variety of
aluminum hydroxide species such as Al(OH)2+, Al(OH)2+, Al(OH)4
- [11,41]. These species
develop polynuclear complexes (coordination compounds containing two or more Al atoms) while
the solution ages and transform to amorphous Al(OH)3(s) solids governed by complex-precipitation
kinetics [39]:
As the solution ages: 𝐴𝑙𝑛(𝑂𝐻)𝑚(3𝑛−𝑚)+ → 𝑛 𝐴𝑙(𝑂𝐻)3(𝑠) (3)
With their large surface area, Al(OH)3(s) solids can adsorb organic compounds, polymerize and
trap suspended particles and finally, deposit as settable flocs according to Eq. (4) [42]:
Deposition: 𝑥 𝐴𝑙(𝑂𝐻)3 → 𝐴𝑙𝑥(𝑂𝐻)3𝑥 (4)
Electrical energy consumption of the EC system can be calculated using the following equation:
𝐸 =𝐼 ꓫ 𝑉 ꓫ 𝑡
𝑉𝑟 (5)
where I is applied current, V is average voltage, 𝑡 is EC reaction time and Vr is reactor volume.
Page 154
140
5.2.2. Forward Osmosis
The FO water flux can be represented by Eq. (6):
𝐽𝐹𝑂 = 𝐴 (𝜋𝐷𝑆 − 𝜋𝐹) (6)
where JFO is the transmembrane water flux, A is the pure water permeability coefficient and πDS
and πF are the osmotic pressure of the bulk draw and feed solutions, respectively. The pure water
permeability coefficient (A) depends on the resistance to water flow through the membrane, while
the osmotic pressures are mainly a function of solution concentration and temperature [43]. In a
real FO operation, permeability is compromised by internal and external concentration polarization
[11,44]. The following expression may be used to model the water flux during FO, assuming the
osmotic pressure varies linearly with salt concentration within the concentration boundary layer:
𝐽𝐹𝑂 = 𝐴. [𝛱𝐷𝑆 . 𝑒
(−𝐽𝐹𝑂{1
𝑘𝐷𝑆+
𝑆𝐷𝐷𝑆
} )−𝛱𝐹 . 𝑒
(𝐽𝐹𝑂𝑘𝐹
)
1 + 𝐵
𝐽𝐹𝑂 {𝑒
(𝐽𝐹𝑂𝑘𝐹
) − 𝑒
(−𝐽𝐹𝑂 {1
𝑘𝐷𝑆+
𝑆𝐷𝐷𝑆
} ) }
] (7)
where kF and kDS are feed and DS convective mass transfer coefficients, S is membrane structural
parameter, B is solute permeability coefficient and DDS is solute diffusion coefficient [43]. In this
study, the FO water flux is estimated using Eq. (7) along with the procedure described in our earlier
work [11].
Page 155
141
5.2.3. Membrane Distillation
Water Flux across a hydrophobic membrane in MD may be represented as:
𝐽𝑀𝐷 = 𝐶 (𝑃ℎ − 𝑃𝑐) (8)
where JMD is transmembrane water flux, C is membrane permeability coefficient and Ph and Pc are
partial pressure of water across the MD membrane in the hot and cold streams, respectively [30].
The membrane permeability coefficient is a function of different resistances in series for water
transfer across the membrane including viscous, molecular and Knudsen diffusion and it strongly
depends on the MD configuration. In direct contact MD (DCMD) (most commonly used and the
focus in this study), the impact of viscous flow is negligible and vapor transfer is dominated by
molecule-molecule and molecule-pore wall collisions [30]. The reduced Knudsen-molecular
diffusion model (Eq. (9)) may be used to predict the water flux during DCMD when considering
a membrane with approximately 0.2 µm average pore size [45,46]:
𝐶 =𝑀𝑤
𝑅𝛿𝑇𝑚
( 𝐷𝑘𝐷𝑚
𝑝𝑎𝐷𝑘+𝐷𝑚) (9)
where Mw is molecular weight of water, R is universal gas constant, δ is membrane thickness, Tm
is average temperature of the hot and cold streams across the membrane and pa is the partial
pressure of the stagnant air within the membrane pores. Dk and Dm are Knudsen and molecular
diffusion coefficients and are defined as follows:
𝐷𝑘 =2Ɛ𝑟
3𝜏 (
8𝑅𝑇𝑚
𝜋𝑀𝑤)
0.5
(10)
𝐷𝑚 = 4.46 ∗ 10−6 (Ɛ
𝜏) 𝑇𝑚
2.334 (11)
Page 156
142
where Ɛ is the membrane porosity, r is the average pore radius and τ is membrane tortuosity. For
membranes with very small pore sizes (e.g. 0.02 µm), the mean free path of water vapor molecules
is much larger than the average pore size and the mass transfer is more likely controlled by
Knudsen diffusion (molecule – pore wall collisions) [30,47]. Thus, membrane permeability
coefficient can be estimated using only the Knudsen diffusion coefficient, as following:
𝐶 =𝐷𝑘
𝑅𝛿𝑇𝑚
(12)
Eqs. (9) to (12) along with the mathematical modeling procedure described by Yun et al. [45] are
used to estimate the water flux across the MD membrane in DCMD configuration.
5.3. Experimental
5.3.1. Produced Water Samples
PW samples were received from Southwestern Energy (Houston, TX) shale gas production
facilities in Pennsylvania (Marcellus shale) and Arkansas (Fayetteville shale). PW samples were
passed through a 300 µm stainless steel mesh screen (Twp Inc. Berkley, CA) prior to storage at 4
⁰C in order to remove larger particulate matter. All samples were analyzed at the Arkansas Water
Resources Center, University of Arkansas. The following parameters were measured: TDS, total
suspended solids (TSS), total organic carbon (TOC) and turbidity. TDS, TSS and TOC were
measured using EPA standard methods 160.1, 160.2 and 415.1 [48], respectively. Turbidity was
measured using a Turb 550 (WTW, Weilheim, Germany) turbidity-meter. In addition, the
inorganic composition of PW samples were analyzed using EPA methods 200.7 (for cations) and
300.0 (for anions), respectively. Electroneutrality of each sample (percent difference between the
Page 157
143
sum of anions and cations in equivalent weight per liter) was calculated to ensure the accuracy of
the chemical analysis.
5.3.2. Electrocoagulation
Aluminum-based EC was employed as the primary pretreatment method. A schematic
diagram of the EC setup is given in Fig. 2. As can be seen, 5 aluminum electrodes (6061 aluminum
alloy) with total surface area of 0.18 m2 were placed in a 0.6 L polycarbonate reactor. A DC power
source (Hewlett Packard, Palp Alto, CA) was connected to the anode and cathode (first and last
electrodes) and was used to provide the required electrical current for the EC experiments. The
current density was maintained at 2.78 mA cm2 by continuous adjustment of voltage using the DC
power source. All experiments were run for 2 min, based on optimization results obtained in our
previous publication [11]. After each EC run, electrocoagulated water was transferred to a 1 L
glass separatory funnel for aging and phase separation. After 6 h aging time, deposited flocs
(bottom) and floating skimmings (top) were wasted and the clear portion of water (middle section)
was recovered as the pretreated water.
Page 158
144
Fig. 2. Schematic diagram of the EC reactor and phase separation funnel. The anode and cathode
are connected to the DC power source. Positively charged aluminum ions are released at anode
and hydroxide ions are produced at the cathode following water hydrolysis. After 6 h
sedimentation time, flocs are deposited at the bottom of the separatory funnel, with light flocs
floating on the top.
5.3.3. Membranes
Flat sheet cellulose triacetate (CTA) membranes with an embedded polyester mesh support
were acquired from HTI (Albany, OR) and used as the FO membrane. CTA membranes have been
widely investigated by a number of researchers [11,49–52]. The CTA membranes were soaked in
DI water for 2 h and rinsed with DI water several times before use in order to remove the glycerin
in which they are shipped.
Following hydrophobic membranes were used in MD experiments: Ethylene
chlorotrifluoroethylene (ECTFE) copolymer, provided by 3M (Maplewood, MN) and
polytetrafluoroethylene (PTFE), provided by Pall Corporation (Port Washington, NY). Table 1
Page 159
145
lists the characteristics of the studied MD membrane, including mean pore size, porosity,
thickness, contact angle and liquid entry pressure (LEP). ECTFE membrane properties were
extracted from our earlier publication [12]. PTFE membrane characteristics were measured using
characterization procedures described in our previous work [12].
Table 1. Characteristics of MD hydrophobic membranes.
Membrane
Nominal pore
size (µm)
Measured mean
pore size (µm)
Porosity
Thickness
(µm)
Contact angle
(⁰)
LEP
(kPa)
ECTFE 0.2 0.18 0.71 82±15 130±1 330
PTFE 0.02 0.03 0.76 54±5 153±4 540
5.3.4. Membrane Separation Setup
The membrane separation experimental setup (used in FO and MD experiments) was
mainly composed of two 4 L reservoirs, two variable speed peristaltic pumps (Masterflex I/P, Cole
Parmer, Vernon Hills, IL), two shell and tube titanium heat exchangers (Brazetek, Brooklyn, NY)
and a computer-connected analytical balance (Mettler Toledo, Columbus, OH). Fig. 3 depicts the
experimental apparatus employed in our study. Heat exchangers were used to adjust the solutions
temperature. Heater and chiller oils were pumped through the tube side of the heat exchangers.
The temperature of the heater and chiller oils were controlled using two circulating baths
(PolyScience AD07R-40, Niles, IL). A digital thermometer employing two k type thermocouples
was used to monitor both streams temperature. Two conductivity-meters (VWR, Radnor, PA)
Page 160
146
were installed in both tanks. Weight change of the tank #1 was recorded by means of the computer-
connected balance regarding water flux measurement.
Fig. 3. Schematic diagram of the experimental apparatus for FO and MD experiments. In FO
experiments, feed PW and DS were placed in tank#1 and tank#2, respectively. In MD
experiments, tank#1 was filled with DI water and tank#2 was filled with diluted DS.
5.3.5. Forward Osmosis
A homemade polycarbonate tangential flow cell providing 33.75 cm2 effective membrane
area was used as FO membrane module. CTA membrane coupons were first soaked in DI water
for 2 h and rinsed with DI water several times. Then they were installed in the polycarbonate
membrane module. Mesh spacers (XN4510, Industrial Netting, Minneapolis, MN) filled the 2 mm
deep channels on both sides of the membrane cell to improve support and flow turbulence. PW
samples (raw or pretreated) were placed in the tank#1 and were recirculated on the active side of
the FO membrane. DS was placed in the tank#2 and was recirculated on the support side of the
Page 161
147
CTA membrane. Draw and feed solutions were recirculated counter-currently with equal flow
velocities and were returned to their respective reservoirs. A range of flow velocities and DS
temperatures were tested.
In each FO run, a CTA membrane was first installed in the membrane module. 2 L PPW
feed and 2 L DS were placed in their respective reservoirs. Cross-flows of feed and DS were run
until stable temperatures were attained, while bypassing the membrane module. After reaching
the desired temperature, both streams were allowed to pass through both sides of the membrane
module. FO experiments were carried out with various temperatures, a range of concentrations of
sodium chloride in DI water as DS and two real hydraulic fracturing PW as feed solutions. Table
A.1 (appendix A) represents the conditions of the FO experiments conducted in this work.
5.3.6. Membrane Distillation
Experimental apparatus showed in Fig. 3 was used for DCMD experiments. A custom-
made PTFE membrane cell with 40 cm2 effective membrane area and 2 mm deep channels was
used as the MD module. PTFE spacers (ET 8700, Industrial Netting, Minneapolis, MN) were used
within the module channels for mechanical support and flow mixing. Feed water (diluted FO DS)
was placed in the tank#2 and was recirculated back to its reservoir, bypassing the membrane
module, until the desired temperature was obtained. DI water was placed in the tank#1 and the
same procedure as for the feed was followed, until temperature was stable at 20 ⁰C. After reaching
the target temperatures, feed and DI water streams were allowed to flow over the opposite surfaces
of the membrane at an equal flow rate of 0.9 L min-1 (equal to 16.7 cm s-1 flow velocity).
Page 162
148
The water flux was calculated based on the rate of increase in the weight of tank#1.
Experiments were continued until the target water recovery was attained. DI water conductivity
was continuously monitored using the conductivity-meter installed in the tank#1 and was kept
under 50 µS cm-1 to ensure the MD membrane was not wetted. Wetting (state were liquid water
crossed the MD membrane) was assumed when the conductivity of the permeate was increased
rapidly above 50 µS cm-1. Experimental conditions of the MD experiments conducted here is
shown in Table A.1.
5.3.7. Scanning Electron Microscopy (SEM) and Energy-dispersive X-ray Spectroscopy
(EDX)
SEM using a Nova Nanolab 200 Duo-Beam (FEI, Hillsboro, Oregon) was used to visually
analyze the membrane surface before and after FO and MD experiments. The same equipment
was used to perform EDX elemental analysis on fouled membrane surface after experiments.
5.4. Results and Discussion
5.4.1. Wastewater Characterization
Table 3 gives the characteristics of raw (after screen filtration) and EC-pretreated hydraulic
fracturing PW samples. The TDS, TSS, TOC, turbidity and inorganic species in the samples are
shown. The TDS of the studied PW samples ranged from 11,341 to 57,523 mg L-1. Hydraulic
fracturing PW sample obtained from Marcellus shale (referred to as PW2) shows higher TDS and
TOC content compared to the sample received from Fayetteville shale (PW1). PW1 shows higher
Page 163
149
levels of TSS and turbidity than PW2. Sodium and chloride account for the majority of the
dissolved ions in PW1. In addition to these two ions, calcium is also observed in PW2. PW1 and
PW2 contain 111.86 and 6.19 mg L-1 sulfate. The presence of sulfate can lead to membrane scaling
due to sulfate salts (e.g. calcium sulfate) precipitation.
Table 3. Characteristics of raw and EC-pretreated PW samples.
Parameter Unit
PW1
Obtained from Fayetteville shale
PW2
Obtained from Marcellus shale
Raw After EC Raw After EC
TDS mg L-1 11,341.60 11,212.70 57,523.10 57,193.50
TSS mg L-1 317.21 13.69 235.06 3.15
TOC mg L-1 87.27 24.13 139.10 29.57
Turbidity Ntu 32.10 2.50 86.33 1.74
Chloride mg L-1 6,550.96 6,672.64 32,871.45 31,694.21
Sulfate mg L-1 111.86 113.40 6.19 6.12
Aluminum mg L-1 0.66 1.23 0.29 0.89
Calcium mg L-1 84.56 80.51 5,261.65 5,058.33
Iron mg L-1 0.00 0.36 0.85 0.71
Magnesium mg L-1 35.08 35.98 29.93 34.76
Potassium mg L-1 24.77 21.75 6.12 4.56
Sodium mg L-1 3,799.01 3,812.26 16,355.31 16,222.50
Page 164
150
5.4.2. Electrocoagulation Performance
Here, EC using aluminum electrodes was used as the pretreatment step prior to FO.
According to Eqs. (1) to (3) (see section 5.2.1), aluminum and hydroxide ions were released into
the solution and reacted to form a variety of monomeric (e.g. Al(OH)2+) and polynuclear (e.g.
Al5(OH)123+) species. By transferring the electrocoagulated water into the separatory funnel and
allowing the sample to age, these species were converted into amorphous Al(OH)3(s) particles [53].
Due to their large surface area, Al(OH)3(s) precipitates adsorbed organic compounds, trapped
suspended particles, formed agglomerated flocs and were separated from the solution by 6 h
sedimentation. The remainder of the positively charged aluminum hydroxide species (e.g.
Al(OH)2+) contributed to charge neutralization of negatively charged suspended solids and
destabilization of organic macromolecules and enhanced the contaminate removal [11]. However,
negatively charged aluminum hydroxide compounds (e.g. Al(OH)4-) restrict the adsorption and
complexation by charge repulsion [54].
Performance of the EC process for removing different contaminates was evaluated using
removal efficiency as following:
𝑅𝑒𝑚𝑜𝑣𝑎𝑙 𝐸𝑓𝑓𝑖𝑐𝑖𝑒𝑛𝑐𝑦 (%) =𝑥𝑝𝑤−𝑥𝑟𝑤
𝑥𝑝𝑤 ꓫ 100 (13)
where, xpw and xrw are the concentration in the raw PW and recovered water after EC, respectively.
Removal efficiencies for both wastewaters tested are given in Fig. 4, while the characteristics of
the pretreated samples are given in Table 3. As can be seen, TSS and turbidity were removed by
greater than 90% for both PW samples. TOC was removed by 72 and 78% for PW1 and PW2,
respectively. Minimal TDS removal was observed for both waters. This is not unexpected given
Page 165
151
that EC removal mechanism cannot target dissolved inorganic compounds [55]. The removal of
TSS, TOC and turbidity is higher for PW2 compared to PW1. The reason for this observation can
be related to the nature of PW samples since all the EC experiments were conducted at similar
conditions (2 min reaction at 2.78 mA cm2 current density). As can be seen in Table 3, almost
similar amount of aluminum is released into PW1 and PW2 during the EC reaction.
Fig. 4. Removal efficiency of EC for PW1 (Fayetteville shale) and PW2 (Marcellus shale). Minor
TDS removal is observed. TSS and Turbidity are removed by over 90%. TOC is removed by 72
and 78% for PW1 and PW2, respectively.
Page 166
152
5.4.3. Bassline Experiments
Baseline FO and MD experiments were carried out employing CTA membrane in FO and
ECTFE membrane in MD system. Pretreated PW1 and PW2 were used as the FO feed stream and
maintained at 20 ⁰C in all experiments. The MD permeate stream was also maintained at 20 ⁰C.
A range of concentrations of sodium chloride in DI water were used as the FO DS as well as the
MD feed stream. Figs. 5(a) to 5(c) present the permeate flow rate of the CTA and ECTFE
membranes in FO and MD systems under a variety of experimental conditions. Dashed lines show
the modeled results while the symbols give the experimental data.
Fig. 5(a) gives the variation of permeate flux variation for FO and MD membranes as a
function of DS temperature. DS was used as the MD feed stream. In this set of experiments, all
flow rates were maintained at 0.7 L min-1 and all experiments were run with an initial DS
concentration of 4 M (234 g L-1 sodium chloride in DI water). As can be seen, the MD water flux
increase exponentially as the feed water temperature increases. This is not unexpected since
permeate transport trough the MD membrane is governed by the vapor pressure difference across
the membrane (see Eq. (8)). The vapor pressure increases rapidly by increasing temperature,
resulting in much higher permeate fluxes at higher temperatures [56]. In the case of FO
experiments with PW1 and PW2 at different DS temperatures, permeate fluxes increased almost
linearly with increasing temperature. This is not unexpected as the FO driving force (osmotic
pressure) is a linear function of temperature. Zhao et al. [57] report a similar trend. Predicted
permeate fluxes were in good agreement with the experimental results.
Fig. 5(b) gives the permeate flux of FO and MD membranes as a function of circulation
rate. In this set of experiments, FO and MD feed temperatures were maintained at 25 and 60 ⁰C,
Page 167
153
respectively. In addition, all experiments were run with an initial DS concentration of 4 M. the
MD permeate flux increased as the flow rate of feed and permeate increased. However, this
increase was not linear. This observation is due to an increase in the heat transfer coefficient of
the feed and permeate sides of the MD membrane by reducing the temperature and concentration
polarization effects. As the heat transfer coefficient on both sides increases, the temperature at the
membrane surface approaches the temperature in the bulk solution and higher permeate flux is
observed due to higher water vapor pressure difference caused by the elevated temperature
difference across the membrane [47].
On the contrary, increase in FO permeate flux in very minor compared to MD. As can be
seen in Fig. 5(b), for both PW1 and PW2, FO water flux slightly increases by increasing the
circulation rate. Increasing the circulation rate from 0.3 to 0.9 L min-1 (equal to 5.5 to 16.65 cm s-
1 cross-flow velocity) resulted in 14% and 8% increase in FO permeate flux when operating PW1
and PW2, respectively. This flux enhancement is related to the reduced external concentration
polarization as a result of the increased mass transfer coefficient at elevated cross-flow velocities
[58].
Fig. 5(c) shows the variations in permeate flux for FO and MD membranes as a function
of DS concentration. DS is used as the MD feed stream. FO and MD feed temperatures were
maintained at 25 and 60 ⁰C, respectively. All flow rates were maintained at 0.7 L min-1. It is well
known that MD can be used for treatment of highly concentrated brines without suffering the large
drop in permeability observed in other membrane processes such as RO [47]. As can be seen in
Fig. 5(c), MD permeate flux ranges from 48.9 L m-2 h-1 to 36.5 L m-2 h-1 when increasing the DS
concentration from 115 to 295 g L-1. The observed decreased is mainly due to the fact that the
Page 168
154
increase in MD feed water salinity reduces the partial vapor pressure and consequently, reduces
the driving force of the MD process [30,47].
In case of FO with PW1 and PW2, greater permeate flow rate was observed at higher DS
concentration. This was due to the increased osmotic pressure difference across the CTA
membrane when employing a higher DS concentration. This increase was less significant at higher
DS concentrations (>200 g L-1). During all bassline experiments (Figs. 5(a) to 5(c)), PW1 gave a
higher FO permeate flux range compared to PW2. The reason for this observation was the
presence of lower TDS in the PW1 which led to higher osmotic pressure difference across the CTA
membrane and consequently, resulted in higher permeate flux. In all cases, the predicted permeate
fluxes were in reasonable agreement with the experimental observation.
Page 169
155
Fig. 5. FO and MD baseline results. DS was used as MD feed solution. a) water flux as a function
of DS temperature. b) Water flux as a function of flow rate. c) Water flux as a function of DS
concentration.
Page 170
156
5.4.4. Actual Forward Osmosis-Membrane Distillation Runs
A second set of FO-MD experiments was carried out in concentration mode using EC-
pretreated PW1 and PW2 as the FO feed water and a range of sodium chloride concentrations in
DI water (2, 3.5 and 5 M) as the DS. Diluted DS during each FO experiment was then used as the
MD feed water. All flow rates were adjusted at 0.7 L min-1. FO and MD temperatures were
adjusted at 25 and 60 ⁰C, respectively. Fig. 6(a) depicts the variations of model and experimental
FO permeate flux as functions of recovered permeate volume for PW1 and PW2. Water recovery
is shown in the secondary horizontal axis. 2.0 M DS concentration was used as the FO draw
solution.
As can be seen in Fig. 6(a), permeate fluxes decreased as the collected permeate volume
increased. PW1 and PW2 were continuously concentrated in the FO process, while the DS was
continuously diluted by permeate cross-over from feed to DS. Thus, the observed decrease can be
directly linked to a decrease in driving force (osmotic pressure). PW1 showed a higher permeate
flux compared to PW2 due to the presence of less dissolved solids. PW1 was concentrated up to
80%, while PW2 only achieved 31% recovery and permeate flux dropped to zero upon collection
of 620 ml permeate. This is not unexpected given the TDS content of PW2 and DS should be
almost the same after over 30% permeate recovery, resulting in almost zero osmotic pressure
difference across the membrane.
As can be seen, model and experimental FO permeate fluxes were in good agreement.
SEM images taken from the CTA membrane surface before and after the FO experiment (see Fig.
6(a)) are shown in Fig. 7(a) and 7(b), respectively. As can be seen, minimal fouling was observed.
Diluted DS during FO experiments with PW1 and PW2 were regenerated in the MD system. Fig.
Page 171
157
6(b) shows the variation of MD permeate flux as a function of recovered permeate volume for
diluted DS. Diluted DS were concentrated up to 2.0 M. As can be seen, both water fluxes decline
during the collection of permeate due to concentration of MD feed. Final MD permeate fluxes for
both samples were ⁓46.5 as both diluted DS were concentrated up to 2.0 M.
Figs. 6(c) and 6(e) give the FO water flux as a function of both permeate volume and
recovery rate when treating PW1 and PW2 using 3.5 and 5.0 M sodium chloride in DI water as
DS, respectively. Similar to the case of 2.0 M DS, PW1 gave a higher permeate flux range
compared to PW2 due to the presence of less dissolved solids. As can be seen, the FO permeate
flux increased with increasing sodium chloride concentration in the DS. PW2 was concentrated
54 and 67% using 3.5 and 5.0 M DS, while PW1 was concentrated up to ⁓85% in both cases. This
results confirms the necessity of using high concentration DS (high osmotic pressure) for achieving
higher recovery rates when treating PW containing high levels of dissolved solids (e.g. >57 g L-1).
Figs. 6(d) and 6(f) show the MD water flux as a function of permeate volume for diluted
3.5 and 5.0 M DS. MD water fluxes decline during the collection of the permeate due to the
increase in MD feed concentration. Diluted DS samples were concentrated back to their original
concentrations. Comparing Figs. 6(b), 6(d) and 6(f), MD permeate fluxes in each figure achieve
similar values. As can be seen in Figs. 6(a) to 6(f), the estimated permeate fluxes were in excellent
agreement with the experimental data.
Page 172
158
Fig. 6. FO-MD experiments for PW1 and PW2 using CTA (FO) and ECTFE (MD) membranes.
Flow rates were adjusted at 0.7 L min-1. FO and MD temperatures were adjusted to 25 and 60 ⁰C,
respectively. a, c and e) FO permeate flux as a function of permeate volume collected as well as
the recovery rate for 2, 3.5 and 5 M NaCl in DI water as DS. b, d and f) MD permeate flux as a
function of permeate volume using diluted DS in experiments shown in (a), (c) and (e) diagrams,
respectively.
Page 173
159
Fig. 7. SEM images taken from a) CTA membrane feed side (active side), b) CTA membrane DS
side after FO experiment with PW2 using 2 M sodium chloride in DI water as DS, c) ECTFE
membrane after DCMD experiment concentrating the diluted DS up to 2.0 M and d) ECTFE
membrane after DCMD experiment concentrating the diluted DS up to 5.0 M.
5.4.5. Long-term EC-FO-MD
Long-term FO-MD experiments were carried using PW1 and PW2. Both samples were
pretreated using the EC process described (see section 5.3.2) prior to FO-MD experiments. FO
experiments for treating PW1 was performed employing 2.0 M sodium chloride in DI water as
DS. All experiments were repeated for four times. After each FO run, the diluted DS was
regenerated using the MD system using ECTFE membrane (experimental conditions shown in
Page 174
160
Table A.1). Fig. 8(a) depicts the FO permeate flux as a function of collected permeate volume,
while Fig. 8(b) shows the corresponding MD permeate flux. Modeled permeate fluxes are also
shown. As can be seen, both FO and MD fluxes decrease as the collected permeate volume
increases. MD permeate fluxes in the range of ⁓45 to 50 L m-2 h-1 are observed. Good agreement
between experimental and modeled FO fluxes are observed. However, experimental MD fluxes
deviate from the estimated data in the third and fourth runs. The reason for this observation could
be membrane scaling, changes in membrane properties and adsorption of organics on membrane
surface. However, SEM images taken of the surface of the tested ECTFE membrane showed
minimal fouling/scaling. TOC content of the DS and MD permeate solutions were measured after
the fourth run. Concentrated DS after fourth run contained 16.1 mg L-1, while the MD permeate
contained 4.6 mg L-1 TOC.
Fig. 8. Long-term FO-MD experiment with pretreated PW1 using 2.0 M sodium chloride in DI
water as DS. a) FO permeate flux as a function of cumulative permeate volume, b) MD permeate
flux as a function of cumulative permeate volume.
Page 175
161
A second long-term EC-FO experiment was carried out using pretreated PW2 as
feed and 5.0 M sodium chloride in DI water as DS. Experiment was repeated four times. After
each FO experiment, diluted DS was re-concentrated using MD. Figs. 9(a) and 9(b) give the model
and experimental permeate flux for FO and MD as a function of cumulative permeate volume,
respectively. As can be seen, a similar FO permeate flux trend to the case of PW1 is observed.
Model and experimental FO flux data are in good agreement. Minor localized fouling was
observed on the CTA membrane surface. EDX analysis of the FO membrane surface is shown in
Fig. 10. As can be seen, sodium chloride scale accounts for majority of fouling. Carbon and
oxygen peaks, indicating the structure of CTA polymer were observed. These two peaks could
also be attributed to the organic species adsorbed on the membrane surface.
Fig. 9(b) gives the MD permeate flux as a function of cumulative permeate volume. MD
permeate fluxes deviated from the estimated curves in third and fourth runs. Membrane wetting
was observed in the fourth MD run. As can be seen in Fig. 9(b), a concurrent rapid increase in
MD permeate flux and MD permeate conductivity was observed in the fourth run, denoting
membrane wetting. Membrane wetting may be due to crystal/scale growth within the membrane
pores in high TDS concentration (up to 292 g L-1). The MD experiment was repeated using 177 g
L-1 sodium chloride in DI water as feed solution and was concentrated up to 293 g L-1 (~5.0 M)
for four times. Similar wetting behavior was observed in the fourth run.
Page 176
162
Fig. 9. Long-term FO-MD experiment with pretreated PW2 using 5.0 M sodium chloride in DI
water as DS. a) FO permeate flux as a function of cumulative permeate volume, b) MD permeate
flux as a function of cumulative permeate volume.
Page 177
163
Fig. 10. EDX elemental analysis of the CTA membrane surface after four FO runs with PW2 as
feed and 5.0 M sodium chloride in DI water as DS.
Page 178
164
In order to mitigate membrane wetting during DS re-concentration in long-term
experiments, a two membrane scenario was designed. In this set of experiments, two MD
membranes were used for DS regeneration. ECTFE membrane was used for concentrating a
simulated dilute DS, containing 177 g L-1 sodium chloride in DI water, up to 250 g L-1 and PTFE
membrane (0.02 µm nominal pore size, see Table 1) was used to concentrate the DS from 250 to
293 g L-1 (~5.0 M). Experiments were repeated for six times. Permeate flux results as well as MD
permeate conductivity throughout the experiment are shown in Fig. 11. As can be seen, wetting
was successfully mitigated in this round of experiments.
Fig. 11. Long-term FO-MD experiment with pretreated PW2 using 5.0 M sodium chloride in DI
water as DS. MD permeate flux as well as permeate conductivity as functions of cumulative
permeate volume. ECTFE membrane was used to concentrated the simulated DS up to 4.3 M.
PTFE membrane was utilized to further concentrate the DS up to 5.0 M.
Page 179
165
5.5. Conclusion
The results reported in this work indicate the potential of FO-MD integration for
sustainable water recovery from high TDS produced waters. If appropriately chosen, a
pretreatment system (e.g. EC) can significantly aid in fouling mitigation and achieving stable
performance. Here, we showed that EC pretreatment led to TOC, TSS and turbidity removal of
up to 78, 96 and 95%, respectively. Among different experimental conditions, temperature
presented the most significant impact on increasing FO and MD water flux in short-term
experiments.
Selection of DS concentration depends on a number of factors including feed water salinity
content and target water recovery. Use of 2.0 M sodium chloride in DI water as DS resulted in
76% water recovery from PW1 (TDS=11.2 g L-1) and 30% water recovery from PW2 (TDS=57.2
g L-1). Increasing the DS concentration to 5.0 M significantly increased the water recovery for
PW2, while this increase for PW1 was less than 10%. Long-term FO-MD experiments with PW1
using 2.0 M DS concentration, CTA membrane in FO module and ECTFE membrane in MD
module was performed over 4 cycles. Long-term experiment with PW2 using 5.0 M DS
concentration failed at the 4th cycle due to MD membrane wetting. This problem was overcome
using 2 separate membranes in the MD regeneration steps. ECTFE membrane was used to provide
high flux and concentrate the diluted DS up to 4.2 M, while the PTFE was used to further
concentrate the DS to 5.0 M.
Page 180
166
Appendix A
Table. A.1. FO–MD experiments conducted.
Experiments Feed Permeate
Temperature
(⁰C)
Flow rate
(L min-1)
Length of experiment
Bassline 1.1
FO PW1 & PW2 4.0 M DS 25 - 75 0.7 30 min after stabilization
MD 4.0 M DS DI Water 25 - 75 0.7 30 min after stabilization
Bassline 1.2
FO PW1 & PW2 4.0 M DS 25 0.3 -0.9 30 min after stabilization
MD 4.0 M DS DI Water 60 0.3 -0.9 30 min after stabilization
Bassline 1.3
FO PW1 & PW2 2.0-5.0 M DS 25 0.7 30 min after stabilization
MD 2.0-5.0 M DS DI Water 60 0.7 30 min after stabilization
Short-term 1.1
FO PW1 & PW2 2.0 M DS 25 0.7 Up to maximum FO recovery
MD Diluted 2.0 M DS DI Water 60 0.7 Concentrating diluted DS up to 2.0 M
Short-term 1.2 FO PW1 & PW2 3.5 M DS 25 0.7 Up to maximum FO recovery
166
Page 181
167
Table. A.1. FO–MD experiments conducted (cont.)
Experiments Feed Permeate
Temperature
(⁰C)
Flow rate
(L min-1)
Length of experiment
Short-term 1.2 MD Diluted 3.5 M DS DI Water 60 0.7 Concentrating diluted DS up to 3.5 M
Short-term 1.3
FO PW1 & PW2 5.0 M DS 25 0.7 Up to maximum FO recovery
MD Diluted 5.0 M DS DI Water 60 0.7 Concentrating diluted DS up to 5.0 M
Long-term 1.1
FO PW1 2.0 M DS 25 0.7 4 runs, each up to maximum recovery
MD Diluted 2.0 M DS DI Water 60 0.7
4 runs, concentrating diluted DS up to
2.0 M
Long-term 1.2
FO PW2 5.0 M DS 25 0.7 4 runs, each up to maximum recovery
MD Diluted 5.0 M DS DI Water 60 0.7
4 runs concentrating diluted DS up to
5.0 M, 4th experiment failed due to
wetting
Long-term 1.3 MD Diluted 5.0 M DS DI Water 60 0.7
6 successful runs, concentrating diluted
DS up to 5.0 M
167
Page 182
168
References
[1] J.A. Veil, Produced Water Management Options and Technologies, in: Prod. Water, 2011:
pp. 537–571. doi:10.1007/978-1-4614-0046-2_29.
[2] A. Fakhru’l-Razi, A. Pendashteh, L.C. Abdullah, D.R.A. Biak, S.S. Madaeni, Z.Z. Abidin,
Review of technologies for oil and gas produced water treatment, J. Hazard. Mater. 170
(2009) 530–551. doi:10.1016/j.jhazmat.2009.05.044.
[3] J.M. Dickhout, J. Moreno, P.M. Biesheuvel, L. Boels, R.G.H. Lammertink, W.M. de Vos,
Produced water treatment by membranes: A review from a colloidal perspective, J.
Colloid Interface Sci. 487 (2017) 523–534. doi:10.1016/J.JCIS.2016.10.013.
[4] D.S. Alessi, A. Zolfaghari, S. Kletke, J. Gehman, D.M. Allen, G.G. Goss, Comparative
analysis of hydraulic fracturing wastewater practices in unconventional shale
development: Water sourcing, treatment and disposal practices, Can. Water Resour. J. 42
(2017) 105–121. doi:10.1080/07011784.2016.1238782.
[5] U.S.E.I. Administration, Technically Recoverable Shale Oil and Shale Gas Resources : An
Assessment of 137 Shale Formations in 41 Countries Outside the United States, U.S.
Energy Inf. Adm. 2013 (2013) 76 pp. doi:www.eia.gov/analysis/studies/worldshalegas/.
[6] U.S. Energy Information Administration (EIA), (n.d.).
https://www.eia.gov/tools/faqs/faq.php?id=907&t=8 (accessed January 17, 2018).
[7] A.J. Kondash, E. Albright, A. Vengosh, Quantity of flowback and produced waters from
unconventional oil and gas exploration, Sci. Total Environ. 574 (2017) 314–321.
doi:10.1016/j.scitotenv.2016.09.069.
[8] D.M. Akob, A.C. Mumford, W. Orem, M.A. Engle, J.G. Klinges, D.B. Kent, I.M.
Cozzarelli, Wastewater Disposal from Unconventional Oil and Gas Development
Degrades Stream Quality at a West Virginia Injection Facility, Environ. Sci. Technol. 50
(2016) 5517–5525. doi:10.1021/acs.est.6b00428.
[9] K.B. Gregory, R.D. Vidic, D. a. Dzombak, Water Management Challenges Associated
with the Production of Shale Gas by Hydraulic Fracturing, Elements. 7 (2011) 181–186.
doi:10.2113/gselements.7.3.181.
[10] D.L. Shaffer, L.H. Arias Chavez, M. Ben-Sasson, S. Romero-Vargas Castrill??n, N.Y.
Yip, M. Elimelech, Desalination and reuse of high-salinity shale gas produced water:
Drivers, technologies, and future directions, Environ. Sci. Technol. 47 (2013) 9569–9583.
doi:10.1021/es401966e.
[11] K. Sardari, P. Fyfe, D. Lincicome, S.R. Wickramasinghe, Aluminum electrocoagulation
followed by forward osmosis for treating hydraulic fracturing produced waters,
Page 183
169
Desalination. 428 (2018) 172–181. doi:10.1016/j.desal.2017.11.030.
[12] M. Malmali, P. Fyfe, D. Lincicome, K. Sardari, S.R. Wickramasinghe, Selecting
membranes for treating hydraulic fracturing produced waters by membrane distillation,
Sep. Sci. Technol. 52 (2017) 266–275. doi:10.1080/01496395.2016.1244550.
[13] M. Çakmakce, N. Kayaalp, I. Koyuncu, Desalination of produced water from oil
production fields by membrane processes, Desalination. 222 (2008) 176–186.
doi:10.1016/j.desal.2007.01.147.
[14] A. Koren, N. Nadav, Mechanical vapour compression to treat oil field produced water,
Desalination. 98 (1994) 41–48. doi:10.1016/0011-9164(94)00130-8.
[15] I.S. Al-Mutaz, Features of multi-effect evaporation desalination plants, Desalin. Water
Treat. 54 (2015) 3227–3235. doi:10.1080/19443994.2014.910842.
[16] Q. Jiang, J. Rentschler, R. Perrone, K. Liu, Application of ceramic membrane and ion-
exchange for the treatment of the flowback water from Marcellus shale gas production, J.
Memb. Sci. 431 (2013) 55–61. doi:10.1016/j.memsci.2012.12.030.
[17] T. CATH, A. CHILDRESS, M. ELIMELECH, Forward osmosis: Principles, applications,
and recent developments, J. Memb. Sci. 281 (2006) 70–87.
doi:10.1016/j.memsci.2006.05.048.
[18] T.-S. Chung, S. Zhang, K.Y. Wang, J. Su, M.M. Ling, Forward osmosis processes:
Yesterday, today and tomorrow, Desalination. 287 (2012) 78–81.
doi:10.1016/j.desal.2010.12.019.
[19] B.D. Coday, P. Xu, E.G. Beaudry, J. Herron, K. Lampi, N.T. Hancock, T.Y. Cath, The
sweet spot of forward osmosis: Treatment of produced water, drilling wastewater, and
other complex and difficult liquid streams, Desalination. 333 (2014) 23–35.
doi:10.1016/j.desal.2013.11.014.
[20] K. Lutchmiah, A.R.D. Verliefde, K. Roest, L.C. Rietveld, E.R. Cornelissen, Forward
osmosis for application in wastewater treatment: A review, Water Res. 58 (2014) 179–
197. doi:10.1016/J.WATRES.2014.03.045.
[21] L. Chekli, S. Phuntsho, J.E. Kim, J. Kim, J.Y. Choi, J.S. Choi, S. Kim, J.H. Kim, S. Hong,
J. Sohn, H.K. Shon, A comprehensive review of hybrid forward osmosis systems:
Performance, applications and future prospects, J. Memb. Sci. 497 (2016) 430–449.
doi:10.1016/j.memsci.2015.09.041.
[22] J.R. McCutcheon, R.L. McGinnis, M. Elimelech, Desalination by ammonia–carbon
dioxide forward osmosis: Influence of draw and feed solution concentrations on process
performance, J. Memb. Sci. 278 (2006) 114–123. doi:10.1016/j.memsci.2005.10.048.
Page 184
170
[23] T.S. Chung, X. Li, R.C. Ong, Q. Ge, H. Wang, G. Han, Emerging forward osmosis (FO)
technologies and challenges ahead for clean water and clean energy applications, Curr.
Opin. Chem. Eng. 1 (2012) 246–257. doi:10.1016/j.coche.2012.07.004.
[24] R.L. McGinnis, M. Elimelech, Energy requirements of ammonia-carbon dioxide forward
osmosis desalination, Desalination. 207 (2007) 370–382. doi:10.1016/j.desal.2006.08.012.
[25] A. Altaee, G. Zaragoza, A conceptual design of low fouling and high recovery FO-MSF
desalination plant, Desalination. 343 (2014) 2–7. doi:10.1016/j.desal.2013.09.025.
[26] C.H. Tan, H.Y. Ng, A novel hybrid forward osmosis - nanofiltration (FO-NF) process for
seawater desalination: Draw solution selection and system configuration, Desalin. Water
Treat. 13 (2010) 356–361. doi:10.5004/dwt.2010.1733.
[27] S. Zhao, L. Zou, D. Mulcahy, Brackish water desalination by a hybrid forward osmosis-
nanofiltration system using divalent draw solute, Desalination. 284 (2012) 175–181.
doi:10.1016/j.desal.2011.08.053.
[28] G. Blandin, A.R.D. Verliefde, C.Y. Tang, P. Le-Clech, Opportunities to reach economic
sustainability in forward osmosis-reverse osmosis hybrids for seawater desalination,
Desalination. 363 (2015) 26–36. doi:10.1016/j.desal.2014.12.011.
[29] G.P. Thiel, E.W. Tow, L.D. Banchik, H.W. Chung, J.H. Lienhard V, Energy consumption
in desalinating produced water from shale oil and gas extraction, Desalination. 366 (2015)
94–112. doi:10.1016/j.desal.2014.12.038.
[30] K.W. Lawson, D.R. Lloyd, Membrane distillation, J. Memb. Sci. 124 (1997) 1–25.
doi:10.1016/S0376-7388(96)00236-0.
[31] T.Y. Cath, D. Adams, A.E. Childress, Membrane contactor processes for wastewater
reclamation in space: II. Combined direct osmosis, osmotic distillation, and membrane
distillation for treatment of metabolic wastewater, J. Memb. Sci. 257 (2005) 111–119.
doi:10.1016/j.memsci.2004.07.039.
[32] Q. Liu, C. Liu, L. Zhao, W. Ma, H. Liu, J. Ma, Integrated forward osmosis-membrane
distillation process for human urine treatment, Water Res. 91 (2016) 45–54.
doi:10.1016/j.watres.2015.12.045.
[33] K.Y. Wang, M.M. Teoh, A. Nugroho, T.S. Chung, Integrated forward osmosis-membrane
distillation (FO-MD) hybrid system for the concentration of protein solutions, Chem. Eng.
Sci. 66 (2011) 2421–2430. doi:10.1016/j.ces.2011.03.001.
[34] E.A. Bell, T.E. Poynor, K.B. Newhart, J. Regnery, B.D. Coday, T.Y. Cath, Produced
water treatment using forward osmosis membranes: Evaluation of extended-time
performance and fouling, J. Memb. Sci. 525 (2017) 77–88.
doi:10.1016/j.memsci.2016.10.032.
Page 185
171
[35] T. Harif, M. Khai, A. Adin, Electrocoagulation versus chemical coagulation:
Coagulation/flocculation mechanisms and resulting floc characteristics, Water Res. 46
(2012) 3177–3188. doi:10.1016/j.watres.2012.03.034.
[36] Electrocoagulation for the treatment of textile industry effluent – A review, J. Environ.
Manage. 128 (2013) 949–963. doi:10.1016/J.JENVMAN.2013.06.043.
[37] B. Zhu, D.A. Clifford, S. Chellam, Comparison of electrocoagulation and chemical
coagulation pretreatment for enhanced virus removal using microfiltration membranes,
Water Res. 39 (2005) 3098–3108. doi:10.1016/j.watres.2005.05.020.
[38] Electrocoagulation treatment of raw landfill leachate using iron-based electrodes: Effects
of process parameters and optimization, J. Environ. Manage. 204 (2017) 75–81.
doi:10.1016/J.JENVMAN.2017.08.028.
[39] M. Kobya, O.T. Can, M. Bayramoglu, Treatment of textile wastewaters by
electrocoagulation using iron and aluminum electrodes, J. Hazard. Mater. 100 (2003) 163–
178. doi:10.1016/S0304-3894(03)00102-X.
[40] T. Picard, G. Cathalifaud-Feuillade, M. Mazet, C. Vandensteendam, Cathodic dissolution
in the electrocoagulation process using aluminium electrodes., J. Environ. Monit. 2 (2000)
77–80. doi:10.1039/a908248d.
[41] Electrocoagulation treatment of raw landfill leachate using iron-based electrodes: Effects
of process parameters and optimization, J. Environ. Manage. 204 (2017) 75–81.
doi:10.1016/J.JENVMAN.2017.08.028.
[42] D. Ghernaout, B. Ghernaout, A. Saiba, A. Boucherit, A. Kellil, Removal of humic acids
by continuous electromagnetic treatment followed by electrocoagulation in batch using
aluminium electrodes, Desalination. 238 (2009) 295–308.
doi:10.1016/j.desal.2008.04.001.
[43] N.N. Bui, J.T. Arena, J.R. McCutcheon, Proper accounting of mass transfer resistances in
forward osmosis: Improving the accuracy of model predictions of structural parameter, J.
Memb. Sci. 492 (2015) 289–302. doi:10.1016/j.memsci.2015.02.001.
[44] J.R. McCutcheon, M. Elimelech, Influence of concentrative and dilutive internal
concentration polarization on flux behavior in forward osmosis, J. Memb. Sci. 284 (2006)
237–247. doi:10.1016/j.memsci.2006.07.049.
[45] Y. Yun, R. Ma, W. Zhang, A.G. Fane, J. Li, Direct contact membrane distillation
mechanism for high concentration NaCl solutions, Desalination. 188 (2006) 251–262.
doi:10.1016/j.desal.2005.04.123.
[46] S. Al-Obaidani, E. Curcio, F. Macedonio, G. Di Profio, H. Al-Hinai, E. Drioli, Potential of
membrane distillation in seawater desalination: Thermal efficiency, sensitivity study and
Page 186
172
cost estimation, J. Memb. Sci. 323 (2008) 85–98. doi:10.1016/j.memsci.2008.06.006.
[47] M.S. El-Bourawi, Z. Ding, R. Ma, M. Khayet, A framework for better understanding
membrane distillation separation process, J. Memb. Sci. 285 (2006) 4–29.
doi:10.1016/j.memsci.2006.08.002.
[48] E. Metcalf, H. Eddy, Wastewater engineering: treatment and reuse, 2003.
doi:10.1016/0309-1708(80)90067-6.
[49] K.L. Hickenbottom, N.T. Hancock, N.R. Hutchings, E.W. Appleton, E.G. Beaudry, P. Xu,
T.Y. Cath, Forward osmosis treatment of drilling mud and fracturing wastewater from oil
and gas operations, Desalination. 312 (2013) 60–66. doi:10.1016/j.desal.2012.05.037.
[50] Z.Y. Li, V. Yangali-Quintanilla, R. Valladares-Linares, Q. Li, T. Zhan, G. Amy, Flux
patterns and membrane fouling propensity during desalination of seawater by forward
osmosis, Water Res. 46 (2012) 195–204. doi:10.1016/j.watres.2011.10.051.
[51] S. Phuntsho, F. Lotfi, S. Hong, D.L. Shaffer, M. Elimelech, H.K. Shon, Membrane scaling
and flux decline during fertiliser-drawn forward osmosis desalination of brackish
groundwater, Water Res. 57 (2014) 172–182. doi:10.1016/j.watres.2014.03.034.
[52] M. Xie, W.E. Price, L.D. Nghiem, M. Elimelech, Effects of feed and draw solution
temperature and transmembrane temperature difference on the rejection of trace organic
contaminants by forward osmosis, J. Memb. Sci. 438 (2013) 57–64.
doi:10.1016/j.memsci.2013.03.031.
[53] D. Ghernaout, A. Al-Ghonamy, M.W. Naceur, N. Messaoudene, M. Aichouni, Influence
of operating parameters on electrocoagulation of C.I. disperse yellow 3, J. Electrochem.
Sci. Eng. 4 (2014) 271–283. doi:http://dx.doi.org/10.5599/jese.146.
[54] D. Ghernaout, B. Ghernaout, A. Boucherit, M.W. Naceur, A. Khelifa, A. Kellil, Study on
mechanism of electrocoagulation with iron electrodes in idealised conditions and
electrocoagulation of humic acids solution in batch using aluminium electrodes, Desalin.
Water Treat. 8 (2009) 91–99. doi:10.5004/dwt.2009.668.
[55] A comprehensive review of electrocoagulation for water treatment: Potentials and
challenges, J. Environ. Manage. 186 (2017) 24–41.
doi:10.1016/J.JENVMAN.2016.10.032.
[56] B.E. Poling, G.H. Thomson, D.G. Friend, R.L. Rowley, W.V. Wilding, Perry’s Chemical
Engineers’ Handbook, 2007. doi:10.1036/0071511253.
[57] S. Zhao, L. Zou, Effects of working temperature on separation performance, membrane
scaling and cleaning in forward osmosis desalination, Desalination. 278 (2011) 157–164.
doi:10.1016/j.desal.2011.05.018.
Page 187
173
[58] P. Bacchin, D. Si-Hassen, V. Starov, M.J. Clifton, P. Aimar, A unifying model for
concentration polarization, gel-layer formation and particle deposition in cross-flow
membrane filtration of colloidal suspensions, Chem. Eng. Sci. 57 (2002) 77–91.
doi:10.1016/S0009-2509(01)00316-5.
Page 188
174
Chapter 6: Conclusions and Future Directions
6.1. Conclusions
Treatment of high salinity produced waters often involves maximizing water recovery in
order to minimize the volume of concentrated brine that has to be transported to a centralized
treatment or disposal facility. The concentrated brine can also be sent to a crystallization unit for
zero liquid discharge scenarios. Membrane distillation can be used to concentrate the wastewater
to close to the solubility limit of the dissolved salts in the water. However, it is likely that an
optimized process will be a multistep process. As the total dissolved solids (TDS) of the feed
increases, lower flux membranes with larger thickness and smaller pore sizes will be required in
order to prevent breakthrough the of the feed solution.
For real feed streams containing surfactant and other dissolved organic compounds, either
pre-treatment or optimized membrane surface properties will be required in order minimize flux
decline due to membrane fouling as well as early breakthrough of the feed due do adsorption of
surfactant molecules onto the membrane surface. The results obtained here indicate the utility of
defining an appropriate bulk membrane structural parameter that can provide insights into
expected membrane performance when tested with low fouling model feed streams. Under these
conditions, bulk membrane properties such as pore size, tortuosity and thickness will have a greater
effect on membranes performance compared to surface properties such as hydrophobicity and
roughness.
The results reported in this dissertation indicate the importance of pretreatment prior to
membrane distillation when treating high salinity produced waters. Actual produced water streams
Page 189
175
can lead to severe membrane fouling and consequent drop in water recovery due to containing
hydrophobic suspended and dissolved organics. If appropriately designed, pretreatment could
successfully mitigate fouling and wetting during treatment of real produced waters. We show that
electrocoagulation could effectively remove most contaminations, except for TDS, from produced
water samples obtained from natural gas extraction facilities in Marcellus Shale. Maintaining a 3
A current in the electrocoagulation reactor for 30 seconds, turbidity, total suspended solids (TSS)
and total organic carbon (TOC) were removed by 96, 91 and 61%, respectively. Higher removal
of contaminates such as TSS and TOC resulted in lower membrane fouling as well as lower water
flux decline in membrane distillation.
Using resistance in series modeling for membrane permeability, considering a fouling layer
permeability coefficient, water flux of membrane distillation system for pretreated high TDS
produced water was accurately estimated. Pretreated produced water was concentrated up to 265
g L-1 in a continuous direct contact membrane distillation process for over 434 h reporting stable
water flux. However, we indicate that even small levels of organic content could result in
membrane fouling in longer experimental runs.
The application of forward osmosis for concentration of synthetic and actual high salinity
produced waters was investigated. We show that significant fouling and consequently, a drop in
flux will occur when treating actual hydraulic fracturing produced waters due to the presence of
high values of TOC and TSS. It is shown that the feed water pretreatment will be essential if
membrane-based separation processes such as forward osmosis are to be used to treat these highly
impaired waters. We show that electrocoagulation prior to forward osmosis significantly reduces
membrane fouling. Though sodium chloride is used in this research as the draw solute,
Page 190
176
development of an actual combined electrocoagulation-forward osmosis process will require the
use of a draw solute that can be economically recovered. Further, crossover of the draw solute
into feed will affect the viability of the process. We show that for a reaction time of two min as a
pretreatment step, over 70% reduction of TSS, TOC and turbidity results in electrocoagulation.
Over a 24 hour period, suppression in fouling due to this pretreatment, leads to close to 21%
increase in water recovery. In addition, the forward osmosis permeate flux may be predicted by
using a resistance in series model to account for internal and external concentration polarization
as well as fouling of the membrane barrier layer by adsorbed species in the produced water. The
economic feasibility of the process will depend on the cost of the recovered water, membrane
lifetime and recovery and reuse of the draw solute.
The feasibility of an integrated forward osmosis-membrane distillation system for water
recovery from actual high salinity produced waters obtained from hydrocarbon extraction facilities
at Marcellus and Fayetteville Shales has been demonstrated. In the proposed hybrid system,
forward osmosis draws water from a high salinity feed, while membrane distillation regenerates
the diluted draw solution and re-concentrates it back to its original concentration. We show that
this process integration can combine the advantages of both processes; low fouling tendency
membrane facing the majority of foulants and production of high quality permeate.
Selection of draw solution concentration depends on a number of factors including feed
water salinity content and targeted water recovery. Utilization of 2.0 M sodium chloride in DI
water as forward osmosis draw solution resulted in 76% water recovery from an actual produced
water sample containing 11.2 g L-1 TDS and 30% water recovery from a second produced water
sample with TDS content of 57.2 g L-1. Increasing the draw solution concentration to 5.0 M
Page 191
177
significantly increased the water recovery for the higher concentration feed water, while this
increase for produced water containing 11.2 g L-1 TDS was less than 10%. Long-term integrated
experiments with lower concentration produced water sample using 2.0 M draw solution, CTA
membrane in FO module and ECTFE membrane in MD module, was successfully performed over
4 cycles. However, we showed that for higher concentration feed waters, a combination of two
membranes with different tolerance for TDS are required in order to complete long-term cyclic
experiments without breakthrough during membrane distillation.
6.2. Future Directions
Future work could be focused on development of anti-fouling hydrophobic membranes for
membrane distillation. This research indicated the necessity of rigorous pretreatment prior to
membrane distillation regarding fouling mitigation. Development of fouling resistant membranes
can lead to significant capital and operational cost savings by pretreatment minimization. In
addition, extended research on membrane distillation module design is required in order to
integrate and maximize the use of low-grade waste heat as energy source. Moreover, the
possibility of hydrophobic membrane regeneration after loss of anti-wetting characteristics
(decrease in contact angle and liquid entry pressure) in membrane distillation operation can be
investigated.
The application of hybrid forward osmosis-membrane distillation system can be extended
to a variety of areas such as food and dairy industry. In addition, this integration can be
investigated for production of ultra-pure water. Moreover, the possibility of using novel draw
solutions such as thermolytic salts in this hybrid process can be studied.