Membrane Domain Formation, Interdigitation, and Morphological Alterations Induced by the Very Long Chain Asymmetric C24:1 Ceramide Sandra N. Pinto,* Liana C. Silva,* Rodrigo F. M. de Almeida, y and Manuel Prieto* *Centro de Quı ´mica-Fı ´sica Molecular, Instituto Superior Te ´ cnico, 1049-001 Lisbon, Portugal; and y Centro de Quı ´mica e Bioquı ´mica, Faculdade de Cie ˆncias, Universidade de Lisboa, 1749-016 Lisbon, Portugal ABSTRACT Ceramide (Cer) is involved in the regulation of several biological processes, such as apoptosis and cell signaling. The alterations induced by Cer in the biophysical properties of membranes are thought to be one of the major routes of Cer action. To gain further knowledge about the alterations induced by Cer, membrane reorganization by the very long chain asymmetric nervonoylceramide (NCer) was studied. The application of an established fluorescence multiprobe approach, together with x-ray diffraction, differential scanning calorimetry, and confocal fluorescence microscopy, allowed the character- ization of NCer and the determination of the phase diagram of palmitoyloleoylphosphatidylcholine (POPC)/NCer binary mixtures. Nervonoylceramide undergoes a transition from a mixed interdigitated gel phase to a partially interdigitated gel phase at ;20°C, and a broad main transition to the fluid phase at ;52°C. The solubility of NCer in the fluid POPC is low, driving gel- fluid phase separation, and the binary-phase diagram is characterized by multiple and large coexistence regions between the interdigitated gel phases and the fluid phase. At 37°C, the relevant phases are the fluid and the partially interdigitated gel. Moreover, the formation of NCer interdigitated gel phases leads to strong morphological alterations in the lipid vesicles, driving the formation of cochleate-type tubular structures. INTRODUCTION Ceramide (Cer) has emerged as one of the most important sphingolipids, given that it is the key intermediate in the sphingomyelin (SM) synthetic pathway (1), and because it is involved in the regulation of various cellular processes such as proliferation, differentiation, apoptosis, growth, and inflammation (2). Different processes, including tumor necrosis factor-a signaling, conditions known to provoke cell stress (e.g., ra- diation and heat), and chemotherapeutic drugs and oxidants, are inducers of Cer accumulation, as reviewed elsewhere (3,4). The major route of acute Cer formation, in addition to de novo synthesis, is the hydrolysis of sphingomyelin by the action of the enzyme sphingomyelinase (3). The Cer N-acyl chains can vary both in length (from 14–26 carbon atoms) and in degree of unsaturation (5). The most common Cer N-acyl chains in mammalian cells are C16–C24 (6), and it was suggested that Cer with different structures participates in distinct cell functions (7). In addition, several pieces of evidence indicate a biophysical role of Cer in the modulation of biological processes, e.g., through the for- mation of so-called Cer platforms (8). Therefore, it is im- portant to understand the impact of the acyl chain of Cer in the properties of a model membrane. Several studies showed that long-chain Cer (mainly with C16 and C18) can increase the order of acyl chains of the surrounding phospholipids (9,10), permeabilize lipid bila- yers (11), induce membrane fusion, fission, and transmem- brane (flip-flop) lipid motion (12,13), and laterally separate in the plane of the membrane, leading to the formation of dis- tinct Cer-rich and phospholipid-rich domains (14–18). However, literature concerning the biophysical behavior of very long-chain Cer or mixtures of long-chain Cer (e.g., bovine brain Cer [bbCer]) is scarce (14,15,19,20). Nerv- onoylceramide (C24:1, NCer, Fig. 1) is a very common lipid in several mammalian tissues, presenting relatively high levels in the liver, kidney, and brain, compared with other long-chain forms of Cer (21). Nervonoylceramide has very asymmetrical hydrocarbon chains (different lengths) and an unsaturation close to the center of the longer chain (Fig. 1). It is thus plausible that NCer forms interdigitated phases be- cause of the strong asymmetry among the acyl chain and the sphingoid base (22), which might facilitate cell-signaling through the coupling between the inner and outer membrane leaflets (23). To understand how NCer affects the properties of a fluid membrane, the binary system palmitoyloleoylphosphati- dylcholine (POPC)/NCer was characterized by fluorescence spectroscopy. Through the application of a multiprobe methodology (10), complemented by differential scanning calorimetry (DSC) and x-ray scattering, it was possible to describe the biophysical behavior of this system, and to de- termine its binary-phase diagram. It was shown that NCer presents low solubility in fluid POPC, leading to the forma- tion of NCer-rich gel domains. The application of confocal fluorescence microscopy further shows the ability of NCer to segregate into gel domains with typical flower-like patterns, and to induce vesicle aggregation and tubular structure for- mation. Moreover, the complexity of the phase behavior and doi: 10.1529/biophysj.108.129858 Submitted January 18, 2008, and accepted for publication June 11, 2008. Address reprint requests to Liana C. Silva, Centro de Quı ´mica-Fı ´sica Molecular, Instituto Superior Te ´cnico, Av. Rovisco Pais, 1049-001 Lisbon, Portugal. Fax: 351-218-464-455; E-mail: [email protected]. Editor: Petra Schwille. Ó 2008 by the Biophysical Society 0006-3495/08/09/2867/13 $2.00 Biophysical Journal Volume 95 September 2008 2867–2879 2867
Transcript
Membrane Domain Formation, Interdigitation, and MorphologicalAlterations Induced by the Very Long Chain Asymmetric C24:1 Ceramide
Sandra N. Pinto,* Liana C. Silva,* Rodrigo F. M. de Almeida,y and Manuel Prieto**Centro de Quımica-Fısica Molecular, Instituto Superior Tecnico, 1049-001 Lisbon, Portugal; and yCentro de Quımica e Bioquımica,Faculdade de Ciencias, Universidade de Lisboa, 1749-016 Lisbon, Portugal
ABSTRACT Ceramide (Cer) is involved in the regulation of several biological processes, such as apoptosis and cell signaling.The alterations induced by Cer in the biophysical properties of membranes are thought to be one of the major routes ofCer action. To gain further knowledge about the alterations induced by Cer, membrane reorganization by the very long chainasymmetric nervonoylceramide (NCer) was studied. The application of an established fluorescence multiprobe approach,together with x-ray diffraction, differential scanning calorimetry, and confocal fluorescence microscopy, allowed the character-ization of NCer and the determination of the phase diagram of palmitoyloleoylphosphatidylcholine (POPC)/NCer binarymixtures. Nervonoylceramide undergoes a transition from a mixed interdigitated gel phase to a partially interdigitated gel phaseat ;20�C, and a broad main transition to the fluid phase at ;52�C. The solubility of NCer in the fluid POPC is low, driving gel-fluid phase separation, and the binary-phase diagram is characterized by multiple and large coexistence regions between theinterdigitated gel phases and the fluid phase. At 37�C, the relevant phases are the fluid and the partially interdigitated gel.Moreover, the formation of NCer interdigitated gel phases leads to strong morphological alterations in the lipid vesicles, drivingthe formation of cochleate-type tubular structures.
INTRODUCTION
Ceramide (Cer) has emerged as one of the most important
sphingolipids, given that it is the key intermediate in the
sphingomyelin (SM) synthetic pathway (1), and because it
is involved in the regulation of various cellular processes
such as proliferation, differentiation, apoptosis, growth, and
inflammation (2).
Different processes, including tumor necrosis factor-asignaling, conditions known to provoke cell stress (e.g., ra-
diation and heat), and chemotherapeutic drugs and oxidants,
are inducers of Cer accumulation, as reviewed elsewhere
(3,4). The major route of acute Cer formation, in addition to
de novo synthesis, is the hydrolysis of sphingomyelin by the
action of the enzyme sphingomyelinase (3).
The Cer N-acyl chains can vary both in length (from 14–26
carbon atoms) and in degree of unsaturation (5). The most
common Cer N-acyl chains in mammalian cells are C16–C24
(6), and it was suggested that Cer with different structures
participates in distinct cell functions (7). In addition, several
pieces of evidence indicate a biophysical role of Cer in the
modulation of biological processes, e.g., through the for-
mation of so-called Cer platforms (8). Therefore, it is im-
portant to understand the impact of the acyl chain of Cer in
the properties of a model membrane.
Several studies showed that long-chain Cer (mainly with
C16 and C18) can increase the order of acyl chains of the
DPH, 355 nm, chloroform)¼ 523 103 M�1cm�1 (determined in this study).
Absorption and fluorescence measurements
All measurements were performed in 0.5 cm3 0.5 cm quartz cuvettes under
magnetic stirring. For absorption, a Shimadzu UVPC-3100 spectrophometer
(Shimadzu, Kyoto, Japan) was used. Fluorescence steady-state measure-
ments were performed in a SLM-Aminco 8110 Series 2 spectrofluorometer
(Rochester, NY). The excitation (lexc) and emission (lem) wavelengths were:
lexc¼ 358 nm and lem¼ 430 nm for DPH and TMA-DPH, and lexc¼ 303 nm
and lem ¼ 405 nm for t-PnA. The temperature was achieved using a Julabo
F25 circulating water bath (Houston, TX), and was controlled within 0.1�Cdirectly inside the cuvette with a type-K thermocouple (Electrical Electronic
Corp., Taipei, Taiwan). The heating rate was always below 0.2�C/min.
The fluorescence-decay measurements were obtained by a single photon-
timing technique. Measurements with t-PnA (lexc ¼ 295 nm and lem ¼ 405
nm) were performed using a secondary laser of rhodamine 6G (27). For
DPH and TMA-DPH measurements (lexc ¼ 360 nm and lem ¼ 430 nm), a
Ti-Sapphire laser was used (28). To obtain the fitting curves, experimental
decays were analyzed using TRFA software (Scientific Software Technol-
ogies Center, Minsk, Belarus). Fluorescence decays were described by a sum
of exponentials, where ai is the normalized pre-exponential (or amplitude),
and ti is the lifetime of the decay component i. The mean fluorescence
lifetime Ætæ is given by Ætæ ¼ +iait
2i =+i
aiti .
Differential scanning calorimetry
For DSC measurements, MLVs with total lipid concentrations of 0.75 mM
were prepared as described above. Because of the low solubility of pure Cer
and mixtures containing high molar fractions of long-chain Cer (14,15,29),
and the strong tendency of Cer to form nonbilayer aggregates, it was nec-
essary to sonicate samples (Branson Sonifier 250 with a microprobe
(Schawbisch Gmund, Germany)) to obtain stable dispersions (samples were
centrifuged for 5 min at 8000 rpm to isolate titanium released from the probe
tip). The DSC experiments were performed with a Microcal VP-DSC
(Microcal, Northampton, MA). All mixtures were prepared 1 day before
DSC measurements, and were allowed to equilibrate overnight at 4�C. Be-fore loading into the DSC cells, both sample and buffer were degassed under
a vacuum.Heating and cooling scanswere run at a rate of 0.5�C/min, unless statedotherwise. Thermogram analysis was performed using software supplied with
the calorimeter (ORIGIN, MicroCal), based on the Levenberg/Marquardt
nonlinear least-squares fittingmethod. The best fit to the experimental data was
obtained with the independent non-two-state transitions model, previously
shown to be the best model for describingDSC data from bbCer mixtures (29).
X-ray diffraction
For x-ray scattering measurements, MLVs with a final lipid concentration of
35mMwere prepared as described above. After liposome preparation, samples
were centrifuged at 13,000 rpm for 30 min, and the pellets were stored at 4�C.To perform the measurements, the pellets were transferred to a glass capil-
lary. Small and wide-angle x-ray scattering (SAXS and WAXS) was per-
formed at 20�C, using a Philips X’Pert diffractometer (Warsaw, Poland),
operating with a monochromatic CuKa radiation source at 40 kV and 50mA,
from 0.63� to 65� with 0.03� steps and a 2-s time per step.
Confocal fluorescence microscopy
Giant unilamellar vesicles (GUVs) containing adequate lipids and Rho-
DOPE (e(Rho-DOPE, 559 nm, chloroform) ¼ 95 3 103 M�1cm�1) at a
probe/lipid ratio of 1:500were prepared by electroformation, using Pt electrodes,
as described previously (30), or using Ti plates (31) separated by a tightly
fitted Teflon spacer. The results obtained were essentially the same. Re-
garding the use of Pt electrodes, an alteration to the previous protocol was
made, to improve the methodology. Briefly, we used glass tubes with plastic
stoppers protected with Teflon. Two holes were machined on the stoppers,
with the diameter matching the diameter of the Ag wire in the plastic outer
part, and the diameter was 0.25 mm smaller than the Ag wire in the Teflon
inner part, for the sake of tight accommodation with the wire. Hence, we
minimized the entry of air into the tube during vesicle formation, and ach-
ieved ease of parallel positioning of the Pt tips where the lipid mixture was
spread. In both the Ti capacitor and Pt electrodes, the lipids and probe were
mixed in chloroform/methanol (;2:1 v/v), with a total concentration of
;1 mM. The hydration medium was 200 mM sucrose in MilliQ (Billerica,
MA) purified water, preheated to a temperature above the main transition
temperature for the particular mixture (room temperature, 40�C, and 50�C for
5, 20, and 30 mol % NCer, respectively). The hydration medium was deox-
ygenated, and the GUVs formed at these hydration temperatures. After GUV
formation, the temperature was slowly reduced to 22�C. Aliquots of 50 mL for
the Ti plates and 150mL for the Pt electrodes were collected and transferred to
the wells of an eight-well plastic plate with a coverslip-like bottom. To settle
the GUVs to the bottom of the chamber, a difference in the density between the
solutions inside and outside the vesicles was created by adding 300 or 200 mL
of 200 mM glucose solution in MilliQ water to the aliquots.
Microscopy was performed with a Leica TCS SP5 (Leica Mycrosystems
CMS GmbH, Mannheim, Germany) inverted microscope (DMI6000) with a
633 water (1.2 numerical aperture) apochromatic objective. Before turning
to the confocal mode, the GUV suspension was directly observed using a
sodium lamp as the light source, and using a filter to select Rho-DOPE
fluorescence, to evaluate the yield of GUV formation and the homogeneity of
FIGURE 1 Structure of NCer.
2868 Pinto et al.
Biophysical Journal 95(6) 2867–2879
the suspension, in terms of size, morphology, and fluorescence intensity. The
GUV yield was very high for the lowest Cer fraction, and decreased with
increasing Cer content, a trend also observed for average GUV size, as
previously verified in systems containing other long-chain Cer and nerv-
onoyl-PC (32,33). The GUVs had similar maximum intensity within a
sample, showing a homogeneous probe distribution, and between samples of
similar or different composition, in agreement with the expected presence of
a similar POPC-enriched fluid phase in all samples.
For confocal fluorescence microscopy, excitation was performed with the
514-nm line from an Ar1 laser. The emission was collected from 550–680
nm, i.e., practically all the emission was collected, and at the same time,
photons with wavelengths where emission did not occur were not reaching
the detector, taking advantage of the acoustic-optical tunable fiber and beam
splitter of the Leica TCS SPC5 system. The laser power and the gain of the
photomultiplier tube detector were similar in all samples, further showing
homogeneous probe distribution and similar fluid phase in all observed
GUVs. Stray light was minimized, in accordance with a ‘‘smart offset’’ al-
ways below 0.5%, and photon counts outside the lipid structures were neg-
ligible. Confocal sections of thickness below 0.5mmwere obtained using the
galvanometric motor stage. Three-dimensional (3D) projections were ob-
tained using Leica Application Suite-Advanced Fluorescence software.
RESULTS
Thermotropic characterization of NCer andPOPC/NCer mixtures byfluorescence spectroscopy
To determine the thermotropic behavior of fully hydrated
NCer, the steady-state fluorescence anisotropy of different
probes (incorporated in NCer membranes) was measured as a
function of temperature (Fig. 2 A). It was observed that TMA-
DPH anisotropy is very high and typical of a gel phase in the
low temperature range, and upon increasing the temperature
above 40�C, there is a sharp decrease in the anisotropy of theprobe, down to values typical of a fluid phase. This variation
is attributable to the transition from the gel to the fluid phase
of NCer, and from these data, the main transition temperature
(Tm) of the lipid was determined. Briefly, the Tm of ;52�Cwas taken as the midpoint of intersection of the lines de-
scribing the initial (gel), intermediate, and final (fluid) re-
gimes. In addition to the main transition, it is also possible to
distinguish a smaller transition at ;20�C. This pretransition
is probably an interconversion between two interdigitated gel
states, as previously observed for other asymmetric lipids,
e.g., N-lignoceroylsphingosylphosphocholine (34), leading
to only a slight variation of the parameter under observation
;30�C below Tm.Neither DPH (data not shown) nor t-PnA is able to report
the gel-fluid phase transition, because the probes are ex-
cluded from the membrane because of the formation of a
highly compact NCer gel. Although DPH and TMA-DPH
present the same chromophore, TMA-DPH is not excluded
from the membrane because of the presence of the cationic
trimethylamonium group, which anchors the probe to the
membrane surface.
Fig. 2 B shows the anisotropy of t-PnA, TMA-DPH, and
DPH in POPC as a function of temperature. This lipid is fluid
in the temperature range of this study (Tm ¼ �2.9 6 1.3�C(35)), and therefore the observed decrease in anisotropy is
attributable only to a gradual increase of membrane fluidity
with temperature, and is not associated with a phase transi-
tion. In the presence of 10% NCer (Fig. 2 C), t-PnA can
detect NCer-induced changes in fluid POPC. At 4�C, t-PnAanisotropy is higher than in POPC, and in addition, an in-
flection is observed in the curve, suggesting the presence of
NCer-enriched gel domains. Slightly increasing the temper-
ature leads to an abrupt decrease in t-PnA anisotropy down to
values similar to those obtained in pure POPC, reflecting a
transition from the gel to the fluid phase, which ends at
;24�C. In this mixture, TMA-DPH and DPH anisotropy
have values and a trend of variation identical to what was
observed in POPC, showing that these probes are unable to
detect the presence of NCer-gel domains. With 50% NCer
(Fig. 2 D), DPH fluorescence anisotropy values are lower
than those typical of a gel phase (e.g., 0.3 in POPC/SM
mixtures (27)), and this probe remains unable to report the
gel-fluid phase transition. In contrast, t-PNA and TMA-DPH
present clearly different regimes. It should be stressed that the
attachment of the TMA group to DPH confers an additional
restriction to the rotational diffusion of the chromophore,
leading to a higher intrinsic anisotropy in the fluid phase (Fig.
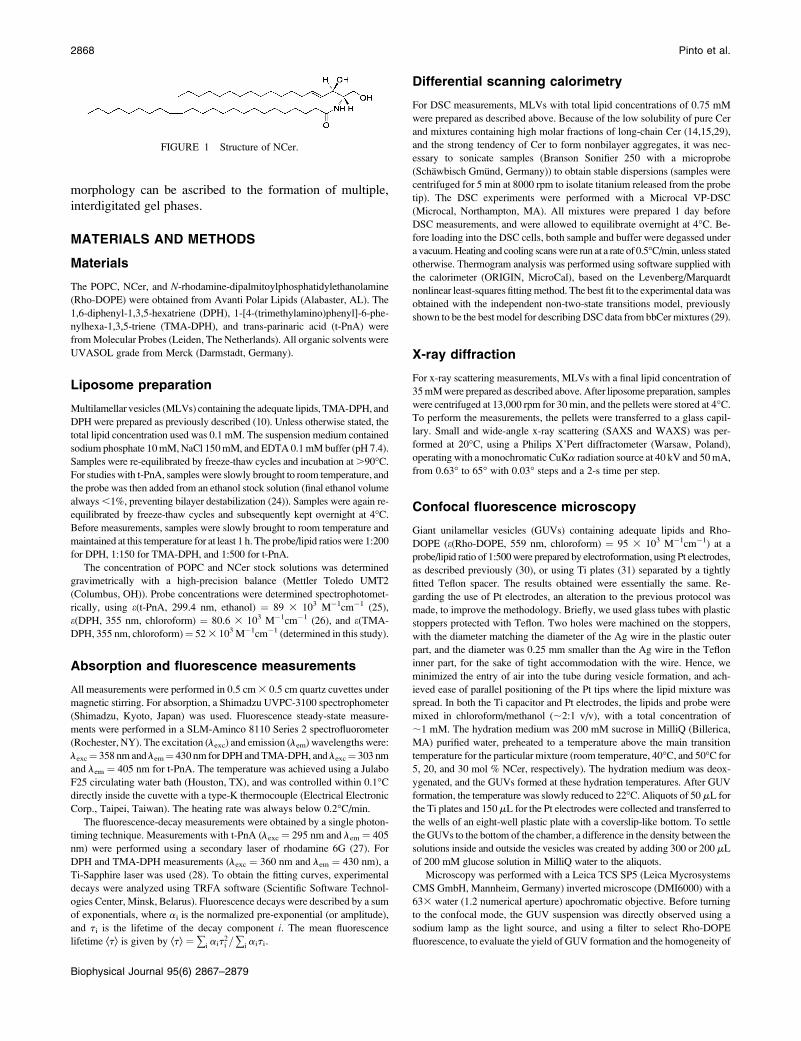
FIGURE 2 Thermotropic behavior of
POPC/NCer. Steady-state fluorescence
anisotropy of t-PNA (d), DPH (e), and
TMA-DPH (:) as a function of tem-
perature (T) in MLV composed of (A)
NCer, (B) POPC, and POPC/NCer mix-
tures containing (C) 10% NCer, (D)
50% NCer, (E) 70% NCer, and (F)
80% NCer. Dashed lines are given as
visual aids. Values are the averages of
three independent experiments.
Membrane Behavior of Nervonoylceramide 2869
Biophysical Journal 95(6) 2867–2879
2 B). As a consequence, the difference between the anisot-
ropy values of TMA-DPH in the gel and fluid phase is not as
large as the difference observed for t-PnA. For 70% NCer
(Fig. 2 E), all probes presented an anisotropy profile of var-
iation typical of a gel-fluid phase transition. However, in-
creasing NCer to 80% leads to the exclusion of DPH (Fig.
2 F), and only t-PnA and TMA-DPH are able to report the
thermotropic behavior of this mixture.
Similar to 100% NCer, the mixtures containing more than
50% NCer also present a smaller transition at ;20�C, asdetected by TMA-DPH and t-PnA (Fig. 2, A, D, E, and F),and corresponding to a transition between interdigitated gel
phases.
The temperatures at which the system became 100% fluid
(Tf), as determined using the different probes (in cases where
the transition was detected), were identical, and comprised
the starting point for building up a binary-phase diagram (see
Discussion).
Thermotropic characterization of NCer andPOPC/NCer mixtures by DSC
To obtain additional information regarding the thermotropic
behavior of the system under study, DSC was performed for
the NCer and POPC/NCer binary mixtures. Representative
heating scans of these samples are shown in Fig. 3. Nerv-
onoylceramide presents a broad endothermic peak centered
at ;52�C, coincident with the transition reported by TMA-
DPH anisotropy. Because of the complex nature of the main
endotherm (very broad, asymmetric, and with a low signal/
noise ratio), it was not possible to determine with accuracy
the enthalpy of the main transition. In addition to the main
peak, a small endothermic peak (;20�C) and a shoulder at
higher temperatures (;70�C) were also detected (Fig. 3). Thepretransition is attributable to the conversion between inter-
digitated gel phases, and the highest temperature transition
can be ascribed to a conversion to a nonlamellar phase, as
suggested for other long-chain Cer (29).
Regarding the binary mixtures, for those containing 5%
NCer, no transition was detected in the temperature range
studied. For mixtures containing more NCer, an endothermic
peak, corresponding to a gel-fluid phase transition, was present
in the thermogram. Furthermore, with increasing NCer con-
tent, it is clear that: 1), the transition temperature is shifted
toward higher values; and 2), the main endotherm becomes
broader, i.e., the temperature width at half-maximum in-
creases, and becomes more asymmetric. In addition, the pre-
transition becomes clear with increasing NCer amounts, as
evidenced by the presence of a small peak for mixtures con-
taining NCer $70%.
Defining the lipid phases
Fig. 4 A shows the fluorescence anisotropy of the three probes
as a function of NCer mole fraction (XNCer) at room tem-
perature (24�C). The t-PnA anisotropy presents a sharp in-
crease for XNCer .10%, reaching a plateau between 50–70%
NCer. These high anisotropy values are typical of the Cer gel
phase (10). For higher NCer concentrations, t-PnA anisot-
ropy decreases, showing that the probe is excluded from the
membrane because of the formation of a highly compact gel
phase, similar to the one reported for palmitoyl-Cer (PCer)
(10). The t-PnA fluorescence excitation spectra in mixtures
containing NCer $70–80% also present the excitonic spec-
tral alterations (data not shown) typical of the formation of
probemicelles in water (36). Thus the variation profile of t-PnA
anisotropy allows us to distinguish between three regimes:1),
a fluid phase, up to 10% NCer; 2), a gel-fluid phase coexis-
tence region, up to 70% NCer; and 3), a highly ordered gel
phase for XNCer higher than ;70%. Using TMA-DPH as a
probe, it is also possible to distinguish these three regimes: up
to 10%NCer, TMA-DPH anisotropy is constant and typical of
a fluid phase; upon increasing the NCer concentration, the
anisotropy of the probe increases linearly up to 70% NCer,
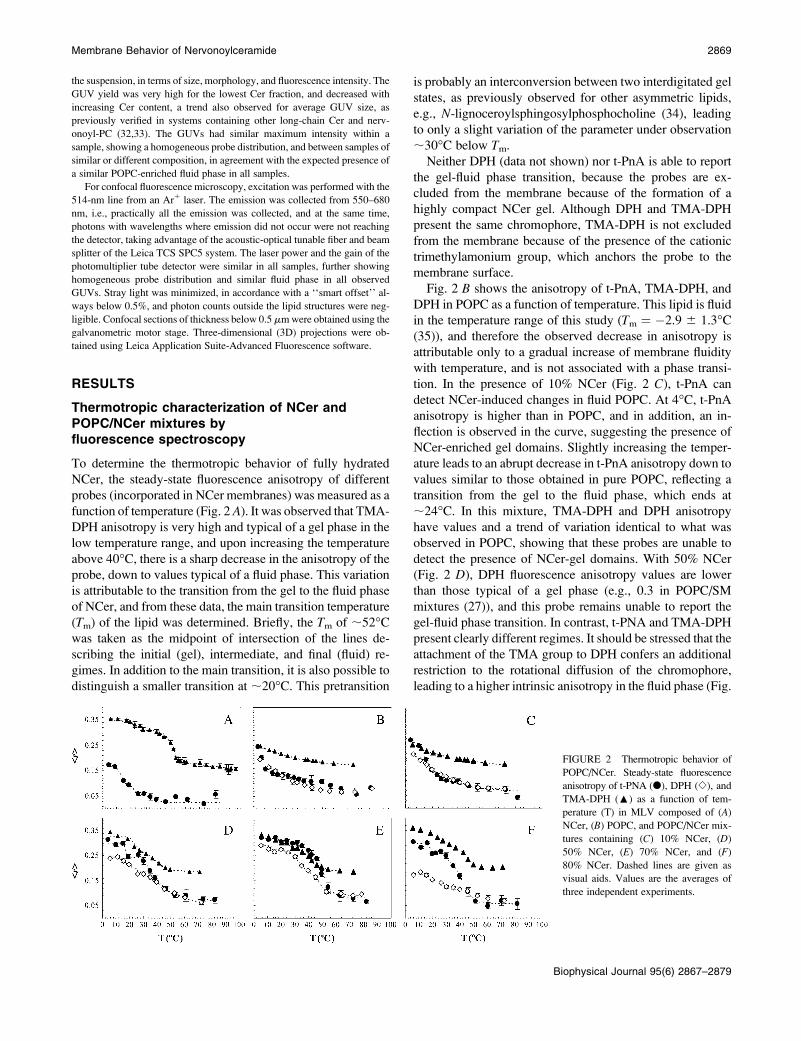
FIGURE 3 DSC thermograms of NCer and POPC/NCer mixtures. The
y-scales were adjusted to better define the spectral characteristics of each
sample. Arrows indicate the main transition (gel-fluid phase transition) and,
for the highest NCer mol fraction, the transition between interdigitated gel
phases (pretransition at ;20�C). See text for further details. T, temperature.
2870 Pinto et al.
Biophysical Journal 95(6) 2867–2879
remaining constant and with values typical of gel phase until
100%NCer is reached. Similar anisotropy profiles of variation
were observed for t-PnA and TMA-DPH at 37�C (Fig. 4 B),demonstrating once again the existence of the three regimes:
fluid phase up to ;25%, gel-fluid phase coexistence from
;25–80%, and gel. For DPH, the anisotropy trend of variation
is completely different. The anisotropy of the probe remains
low, presenting a slight increase with NCer content. For 70%
NCer, DPH anisotropy increases up to a value of 0.23, indi-
cating that the probe is not completely excluded from the
NCer-gel phase, but has a very low partition into it. Only when
the gel phase approaches 100% inside the coexistence region is
DPH able to report the presence of that phase. It should be
stressed that this was the only mixture studied for which DPH
was able to detect the gel-fluid phase transition (Fig. 2 E).Above this Cer content, DPH anisotropy decreases, because of
the exclusion of the probe from the membrane, meaning that a
phase boundary at 24�C must be very close to XNCer ; 0.7.
Fig. 4 C shows the mean fluorescence lifetimes of the
probes in POPC/NCer mixtures as a function of XNCer at
24�C. For t-PnA, the profile of variation is similar to that
observed for anisotropy (Fig. 4 A), further showing the
presence of the three regimes, i.e., fluid, gel1 fluid, and gel.
Also, the longer mean fluorescence lifetime values are unique
to the gel phase (25), undoubtedly confirming the presence of
the NCer-rich gel phase. It should be stressed that the increase
in anisotropy is not attributable to a decrease in fluorescence
lifetime (according to the Perrin equation (37)), and, there-
fore, the profiles of variation of both anisotropy fluorescence
lifetimes strongly support the presence of a highly ordered
environment in the vicinity of the probe.
The variation in fluorescence lifetimes observed for both
TMA-DPH and DPH is less steep than for t-PnA. The de-
pendence of the fluorescence lifetime of these probes on the
lipid phase is small (38). Once again, the absence of a strong
decrease in the fluorescence lifetime of the probes confirms
that the increase in anisotropy is attributable to an increase in
the order of the membrane, validating the conclusions de-
rived from the anisotropy data.
X-ray scattering of NCer and NCer/POPC mixtures
Both SAXS and WAXS were used to obtain further structural
information on the types of phases formed by NCer and NCer/
POPC mixtures (Fig. 5). A single reflection was observed at
4.2 A in the wide-angle region for mixtures containing 20–60%
NCer, typical of a lamellar gel phase with hexagonal packing
(39,40). For 5% and 10% NCer, this reflection appeared as a
broader peak, with the maximum shifted to 4.3 A and a
shoulder at ;4.5 A, because of the contribution of the fluid
phase. IncreasingNCer to 80%and 90%, the peak split into two
(Fig. 5, A and C), with the appearance of an additional reflec-
tion at 3.9 A, revealing the presence of two gel phases (41).
The SAXS diffractrograms showed a single and symmetric
peak, with a repeat distance that increased with NCer content
up to 50%. Upon increasing NCer to 80%, the first-order
diffractions became broader and asymmetric, with a maxi-
mum at ;58 A, and a shoulder at longer distances (;65 A).
For pure NCer, the SAXS diffractogram presented a single
broad and asymmetric peak at ;57 A.
FIGURE 4 Steady-state fluorescence anisotropy (A and B) and mean
fluorescence lifetime (C) of t-PNA (d), DPH (e), and TMA-DPH (:), in
POPC/NCer binary mixtures at (A and C) 24�C and (B) 37�C. Verticaldashed lines correspond to gel and fluid phase boundaries. Dotted lines are
given as visual aids. Values are the averages of three independent exper-
iments. In C, the error bars are smaller than the size of the symbol.
Membrane Behavior of Nervonoylceramide 2871
Biophysical Journal 95(6) 2867–2879
Observation of micron-scale gel/fluid phaseseparation in NCer containing GUVs
To characterize further the biophysical properties of POPC/
NCer mixtures, confocal fluorescence microscopy was per-
formed on GUVs (Fig. 6) at 22�C. The probe used for this
purpose was Rho-DOPE because of its absorption and
emission in the visible range, photostability, high molar ab-
sorption coefficient and quantum yield, and known gel-fluid
partition coefficient in a mixture of saturated and unsaturated
PC. The quantum yield of the probe is similar in gel and fluid
phases for probe concentrations,0.5mol%, but the partition
is highly unfavorable for the gel phase (30). In this way, gel/
fluid-phase separation should be easily observed in GUVs, as
bright (fluid) and dark (gel) domains.
In Fig. 6 A, a 3D projection of confocal slices of POPC/NCer
(95:5 mol/mol) GUV is shown. As observed for all GUVs with
this composition, no domains are present, in agreement with
fluorescence spectroscopy and DSC results. However, increas-
ing the NCer concentration to 20 mol % (Fig. 6 B) leads to theappearance of micron-sized domains. The dark domains, be-
cause of their lower brightness and nonround shape, are un-
doubtedly gel (Cer-enriched) domains (30). Increasing theNCer
content further to 30 mol % (Fig. 6 C), the dark domains are
larger, exhibiting a clear flower-like pattern. The gel-domain
surface-area fraction is higher than for the previous composi-
tion, as expected for higher Cer content, and again in agreement
with fluorescence spectroscopy data (e.g., Fig. 4).
In addition to the vesicles with clearly defined gel domains,
for 20 and 30 mol % NCer, aggregated vesicles, and mixed
vesicle-tubular and tubular structures, were also observed. The
3D projections of confocal slices of representative structures are
shown in Fig. 6, D–F. The number and complexity of this kind
of structure are larger for 30% NCer (Fig. 6 F), suggesting a
direct relationship with composition/phase behavior.
DISCUSSION
Thermotropic behavior of NCer and propertiesof phases
Regarding NCer and mixtures containing NCer, little is
known about their phase behavior and the structures formed.
To our knowledge, only one work reported on the properties
of monolayers containing NCer (19), whereas other studies
focused on the effects of bovine or porcine brain Cer mixed
with different lipids (14,15,20,29,42). For a better definition
of NCer properties and effects on membrane biophysics,
DSC and X-ray diffraction were used to complement fluo-
rescence spectroscopy and microscopy, keeping in mind the
shortcomings of each technique.
Fluorescence anisotropy (Fig. 2 A) and DSC (Fig. 3)
showed that the gel-to-fluid phase transition of NCer occurs
in a broad range of temperatures, and at relatively low values
(Figs. 2 A and 3), compared with other long-chain Cer, e.g.,
PCer and SCer (Tm; 90�C) (43,44). The difference betweenthe Tm of these Cer can be explained by the presence of one
unsaturation in the NCer acyl chain, i.e., a cis double bond
between carbon atoms 15 and 16. Considering, for example,
SM, the introduction of a double bond into position 15 of the
24-carbon acyl chain has the similar effect of decreasing
the saturated acyl chain length to 14 carbons in regard to the
resulting Tm (Tm; 25�C for 14:0 SM,;40.5�C for 16:0 SM,
and ;23–26�C for C24:1 SM (45,46)). Structurally, the
FIGURE 5 Wide-angle (A) and small-angle (B) x-ray scattering spectra of
NCer and POPC/NCer mixtures. The y-scales were adjusted to better define
the spectral characteristics of each sample. (C) Wide-angle (solid circles)and small-angle (open circles) reflections as a function of NCer content.
Beside the main reflection (both inWAXS and SAXS), additional reflections
are shown, when detected, for a particular mixture.
2872 Pinto et al.
Biophysical Journal 95(6) 2867–2879
magnitude of the effect is dependent on the position of the
double bond in the chain, and the maximal effect is observed
when the cis double bond is in the middle of the chain (47).
The cis double bond strongly perturbs the packing of the
chains in the gel state, and therefore reduces Tm. Thus,
sphingolipids with saturated acyl chains are more tightly
packed and ordered than their monounsaturated counterparts
(48). Note that the introduction of a double bond in galactosyl
(Gal)-24:0 Cer leads to a decrease in Tm from 84�C to 59�C(46). The thermotropic behavior of the lipids is dependent not
only on the acyl chain, but also on the polar headgroup, ex-
plaining the high difference in melting temperature of 24:1
SM and NCer (49,50). Nevertheless, it was previously shown
that the thermotropic behavior of PCer and the corresponding
glycosphingolipids glucosyl-PCer and Gal-PCer was similar,
presenting multiple phase transitions and a high melting
temperature (51). For these lipids it was also shown that
phase behavior was strongly influenced by the acyl chain, but
was highly insensitive to the presence and type of sugar
moiety (43,51). Therefore, a similarity in the thermotropic
behavior of NCer and Gal-NCer can be anticipated. The Tmdetermined in this study is comparable to the Tm reported for
whereas the high-enthalpy peak (second endotherm) was as-
cribed to the transition from the partial interdigitated gel to the
fluid phase. In the mixed interdigitated gel phase, the longest
chain completely interdigitates into the other leaflet, allowing
an end-to-end contact between the smaller chains of the two
leaflets of the membrane (see Fig. 7). The presence of other
phospholipids tends to destabilize this interdigitated gel phase,
and to promote a rearrangement of lipids into a more stable
interdigitated gel phase, i.e., the partial interdigitated gel phase.
In this phase, the longest chains partially interdigitate into the
other leaflet,making end-to-end contactwith the smaller chains
(see Fig. 7) (34).
Further evidence for the formation of interdigitated gel
phases was obtained by x-ray diffraction. A split peak with
two sharp reflections at 3.9 and 4.2 A was observed in the
wide-angle region (Fig. 5 A). The value at 4.2 A is very close
to the value reported by Lewis et al. (40), in a study of a very
large number of asymmetric cholines. This reflection was
attributed to a hexagonal packing of mixed-interdigitated gel
phases. Interestingly, another reflection was also present in
the range of 3.7–3.9 A, such as was observed in this work (at
3.9 A), for pure NCer. The existence of a lamellar interdig-
itated gel phase with hexagonal chain packing was also
suggested for C24:0 Gal-Cer, which presents a reflection at
4.2 A in WAXS (53).
The repeat distance obtained for NCer in the small-angle
region (Fig. 5 B) is shorter compared with the above-men-
tioned repeat distance for C24:0 Gal-Cer (53), where a value
of 65.4 A was reported for the interdigitated gel phase.
However, this lipid contains a saturated chain and a bulky
headgroup, and it is likely that this distance could be short-
ened in the case of the C24:1 Cer under study. Takahashi
et al. (54) showed that C24:0 SM can form a mixed inter-
FIGURE 6 Confocal fluorescence microscopy of NCer/
POPC mixtures, to observe gel domains and morphological
alterations induced by NCer: 3D projection images ob-
tained from 0.4-mm confocal slices of POPC/NCer GUV
labeled with Rho-DOPE (0.2 mol %) equilibrated at 22�C.The GUVs were prepared from mixtures of POPC/NCer
containing (A) 5%, (B) 20%, and (C) 30% NCer. Mixed
vesicle-tubular and cochleate structures were observed for
(D and E) 20%NCer and (F) 30%NCer, respectively. Scale
bars correspond to 10 mm.
Membrane Behavior of Nervonoylceramide 2873
Biophysical Journal 95(6) 2867–2879
digitated gel phase with a repeat distance of 56.2 A. There-
fore, a value of 57 A, as obtained for NCer, is within the range
of values reported for other (glyco)sphingolipids with inter-
digitation.
In addition to the data presented above, it is interesting to
analyze the so-called chain equivalence parameter (DC/CL),where the two variables are related to the length difference
between the two chains (DC) and the total length of the longerone (CL) (55), and that predicts the ability of asymmetric
lipids to form interdigitated phases. According to the authors,
a ratio ranging from 0.44–0.57 is typical of mixed interdig-
itated gel phases (56), although Lewis et al. (40) showed that
some PCs whose DC/CL ratios were not in the defined range
were able to form mixed interdigitated gel phases (40). For
NCer, DC/CL ¼ 0.41, i.e., a value consistent with a change
from a partial interdigitated to a mixed interdigitated gel
phase (57).
Altogether, the results show that NCer is able to form
multiple interdigitated gel phases.
Microdomains in GUVs and other morphologiesformed by POPC/NCer mixtures
Confocal fluorescence microscopy in giant vesicles allowed
the direct observation of NCer-enriched domains. These do-
mains present a flower-like pattern (i.e., they are not round),
and are micrometer-sized, as expected in the case of gel/fluid-
phase separation (30).
For the lowest NCer concentration used, no gel domains
were observed (Fig. 6 A), and the fraction of gel phase in-
creased abruptly when NCer content was raised from 20 to 30
mol %. In fact, for 20 mol % NCer (Fig. 6 B), the contrast
between dark and bright domains was lower than for 30mol %
NCer (Fig. 6 C). However, in the gel and fluid domains ob-
served in GUVs with 20% and 30% NCer, it is expected that
the probe concentration ratio in the two phases (partition co-
efficient) and the properties are the same. Indeed, for the 30
mol % NCer GUV, the gel domains are present throughout
most of the surface area, and in the 3D projection, gel domains
on one face of the sphere overlap with gel domains on the other
face, whereas for the 20 mol % NCer GUV, they most fre-
quently overlap with fluid domains, leading to intermediate
brightness, a consequence of the 3D projection data treatment.
If the hemispheres are projected (not shown), the intensity ratio
of dark/bright is the same for both compositions. In addition,
the huge difference in gel-phase fraction between the two
mixtures suggests that close to 22�C, the tie-line should end at;50 mol % of NCer. This implies that other phases and phase
coexistence regions should be present in the POPC/NCer
phase diagram for high XNCer. It was previously shown that
NCer can induce domains with a flower-like pattern in DMPC
monolayers (19). Using fluorescence microscopy, the authors
(19) showed that 70% NCer induced domain formation at all
surface pressures, but with 20% NCer, no domains were
formed at low surface pressure.
The complexity in phase behavior of NCer is further evi-
denced by the ability of relatively low XNCer (20% and 30%)
to form aggregates and tubular structures (Fig. 6, D–F). We
did not observe these structures in other POPC/long-chain
Cer binary mixtures, using the same preparation protocol
(S. Pinto, unpublished observations). It is interesting that
these tubules segregate from the vesicles (Fig. 6, D and F),showing that the arrangement of NCer in the form of vesicles
is unstable. This is likely attributable to the coexistence of the
fluid and the interdigitated gel that leads to strong perturba-
tions in the packing between adjacent lipids, which together
with the small headgroup of NCer may induce curvature
stress incompatible with GUV morphology. Therefore, the
lipids in the gel phase have a high tendency to bud out of the
vesicles in the form of tubules. Despite the low partition of
Rho-DOPE into gel domains (30), and in particular into Cer-gel
domains (17), as also shown by the contrast between dark and
bright domains in GUVs (Fig. 6, B andC), it was still possibleto visualize the tubules with a relatively high intensity. This
suggests that these structures are cochleate in nature, formed by
rolling up the bilayer. In this situation, the fairly high fluores-
cence intensity observed in these structures is attributable to the
overlap of several membrane layers. This type of structures was
observed via transmission electron microscopy for pure NCer
(58,59) and other long-chain (glyco)sphingolipids (46,59).
The fact that these structures were observed for 20% NCer
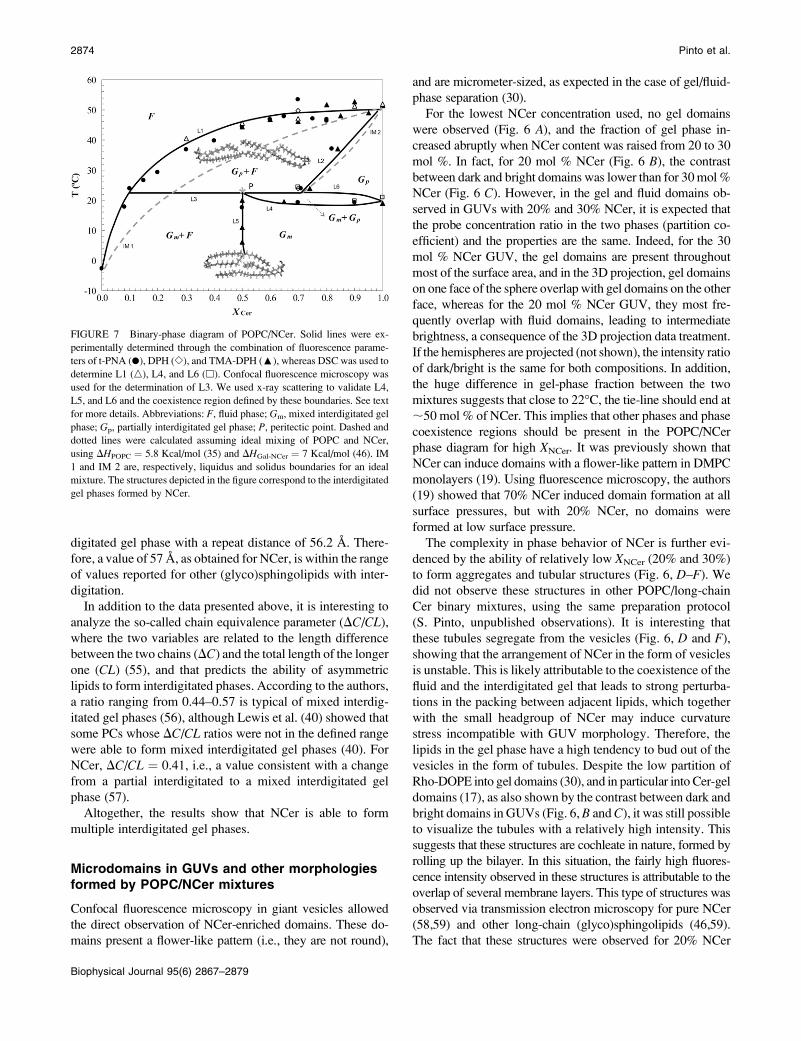
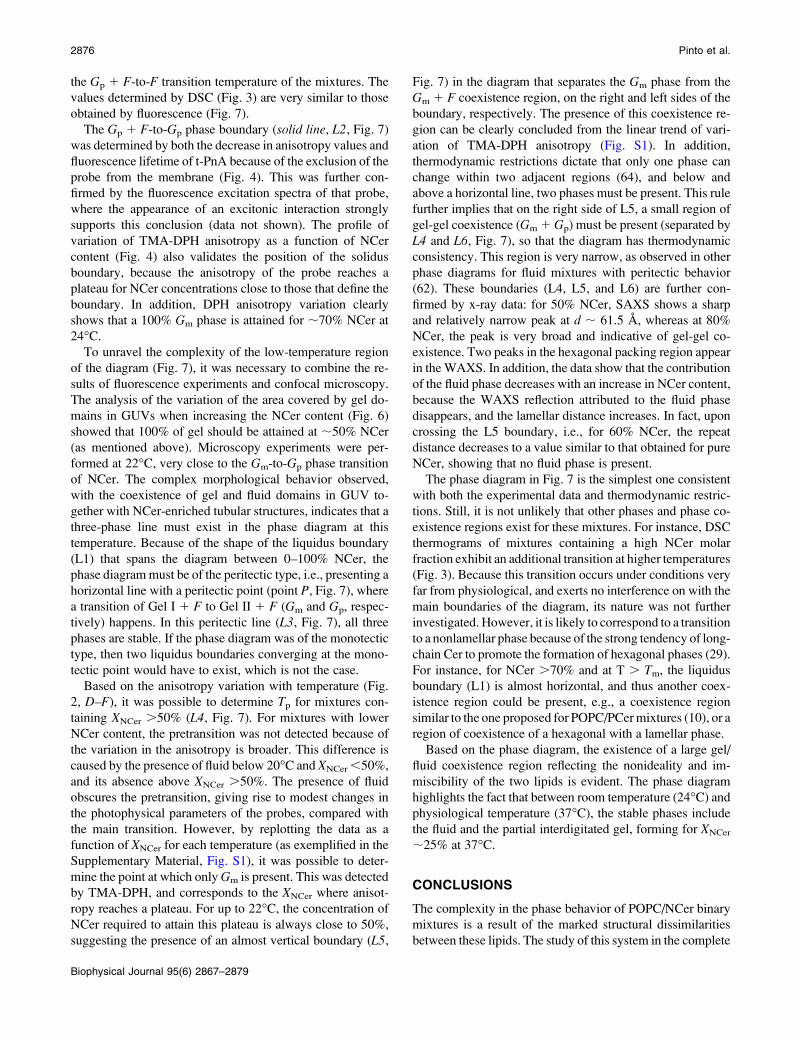
FIGURE 7 Binary-phase diagram of POPC/NCer. Solid lines were ex-
perimentally determined through the combination of fluorescence parame-
ters of t-PNA (d), DPH (e), and TMA-DPH (:), whereas DSC was used to
determine L1 (n), L4, and L6 (h). Confocal fluorescence microscopy was
used for the determination of L3. We used x-ray scattering to validate L4,
L5, and L6 and the coexistence region defined by these boundaries. See text
for more details. Abbreviations: F, fluid phase; Gm, mixed interdigitated gel
phase; Gp, partially interdigitated gel phase; P, peritectic point. Dashed and
dotted lines were calculated assuming ideal mixing of POPC and NCer,
using DHPOPC ¼ 5.8 Kcal/mol (35) and DHGal-NCer ¼ 7 Kcal/mol (46). IM
1 and IM 2 are, respectively, liquidus and solidus boundaries for an ideal
mixture. The structures depicted in the figure correspond to the interdigitated
gel phases formed by NCer.
2874 Pinto et al.
Biophysical Journal 95(6) 2867–2879
suggests that in vivo, where Cer can attain high local con-
centrations (60), the confined formation of this lipid in the cell
membrane can lead to strong, local morphological alterations.
Characteristics of phases formed byPOPC/NCer mixtures
The use of several biophysical techniques proved to be a
major advantage when studying complex POPC/NCer mix-
tures. From the thermotropic point of view, the results ob-
tained from fluorescence spectroscopy and DSC studies
provided complementary information (Figs. 2 and 3). On the
other hand, fluorescence spectroscopy, x-ray diffraction, and
microscopy together gave structural information, allowing
the correct assignment of phases (Figs. 4–6).
From the data above, it is clear that NCer is able to induce
gel-fluid phase separation. At 37�C,;25% NCer is required
to induce phase separation, whereas;10% is enough to drive
NCer-rich gel phase formation at 24�C. These results are
comparable to those previously reported for POPC/porcine
brain Cer mixtures (42) and DMPC/bbCer above DMPC
Tm (15).
Also of interest is the high rigidity of NCer gel when
compared with other gel phases. For instance, NCer gel is
able to exclude DPH (Fig. 4), whereas SM gel can accom-
modate this probe (27). However, compared with PCer, NCer
gel is less rigid, because the probe is not completely ex-
cluded, as is the case with PCer (10). This difference is most
likely related to the fact that at 24�C, the usual gel phase is
formed in the case of PCer, whereas a partial interdigitated
gel phase forms with NCer.
Overall, the data support the ability of NCer to form inter-
digitated gel phases, both by itself and when in lipid mixtures,
e.g., in the presence of pretransitions both in fluorescence
anisotropy temperature scans (Fig. 2) and DSC thermograms
(Fig. 3). The presence of other phospholipids tends to desta-
bilize the mixed interdigitated gel phase, and induce the for-
mation of a partial interdigitated gel phase (34).
As observed for pure NCer, x-ray diffraction shows that
POPC/NCer mixtures also form lamellar phases whose
characteristics are dependent on NCer content. From exam-
ination of the wide-angle region, it is clear that up to 10%
NCer, there is a contribution from a fluid phase, because the
reflection is broader, spanning up to 4.7 A, with a maximum
shifted to;4.3 A (Fig 5, A and C). Increasing the NCer up to60%, a single reflection was observed ;4.2 A, undoubtedly
confirming the presence of a gel phase. An additional weaker
reflection at 3.9 A was obtained for the 80% and 90% NCer
mixtures. This shows that up to 60% NCer at the temperature
of x-ray scattering measurements, one gel phase is present,
and that for higher NCer fractions, two gel phases are formed.
As a corollary, the x-ray diffraction was performed at a
temperature very close to Tp because in the pure NCer, both
phases were detected. From the small-angle region, an in-
teresting pattern of variation is obtained (Fig. 5, B and C): 1),
for the lowest NCer concentrations, the repeat distance, d, isshorter and in the range of the repeat distance reported for
POPC (57.4 A (61)), showing the contribution of the fluid
phase, in agreement with WAXS results; 2), d increases
slightly with NCer (up to 50%), and this variation is con-
sistent with DSC and spectroscopic data, showing that at this
concentration, a gel phase is present. Taking into account that
a higher increase in d is expected when passing from a fluid to
a gel phase (62), and all the more when the molecule involved
in this phase formation presents a long chain, the small in-
crease in d can be explained if an interdigitated phase is beingformed. Also, comparing this value with those reported, e.g.,
for the DPPCgel (d; 66 A), DPPC/bbCer mixtures (d; 71 A
gel phase) (20), and DMPC/PCer mixtures (d$ 60 A, both in
the fluid and in the gel) (16), it is clear that d for POPC/NCer
mixtures is much smaller, and therefore ascribed to interdigi-
tation; and 3), for higher NCer concentrations, the maximum
of the peak is shifted toward lower values (d; 58 A), close to
the value obtained for pure NCer. In addition, for the highest
NCer concentrations (80–90%), this peak is also very broad
and asymmetric, showing the coexistence of different phases.
In fact, the decomposition of the peak clearly shows the
presence of two populations, which can be ascribed to gel
phases with different degrees of interdigitation.
POPC/NCer binary-phase diagram
For the pure lipids POPC and NCer, the main transition
temperature was taken from Koynova and Caffrey (35) and
Figs. 2 A and 3, respectively. The pretransition observed for
NCer (Tp ; 20�C) is attributable to the conversion between
two interdigitated gel phases, i.e., the mixed interdigitated gel
phase, Gm, and the partial interdigitated gel phase, Gp.
Therefore, below Tp, NCer is in the Gm phase, and presents a
transition into Gp phase when T . Tp.Based on anisotropy variation as a function of temperature
(Fig. 2), it is possible to determine the end of the melting of
gel domains and thus the Gp1 fluid-to-fluid (Gp 1 F-to-F)phase transition (liquidus boundary, L1 in Fig. 7). The points
in L1 correspond to the temperature value for the end of the
transition for each of the mixtures. These values were then
corrected for the width of the transition of the pure lipids,
according to Mabrey and Sturtevant (63). For the lower NCer
concentrations, the main transition was detected by the fluo-
rescence properties of t-PnA (Fig. 2 C), because of the
higher preference of the probe for the gel phase. For NCer
concentrations up to 80%, t-PnA and TMA-DPH data (Fig.
2, D–F) gave similar results with respect to the transition
between the gel and fluid phases. For 70% NCer, DPH was
also used for the determination of L1, confirming the tran-
sition temperature obtained with the other two probes. For
very high NCer content (.90%), TMA-DPH was essential
for the determination of L1, because it was the only probe that
was not excluded from the highly ordered NCer-gel phase, as
explained above. The DSC experiments further confirmed
Membrane Behavior of Nervonoylceramide 2875
Biophysical Journal 95(6) 2867–2879
the Gp 1 F-to-F transition temperature of the mixtures. The
values determined by DSC (Fig. 3) are very similar to those
obtained by fluorescence (Fig. 7).
The Gp 1 F-to-Gp phase boundary (solid line, L2, Fig. 7)was determined by both the decrease in anisotropy values and
fluorescence lifetime of t-PnA because of the exclusion of the
probe from the membrane (Fig. 4). This was further con-
firmed by the fluorescence excitation spectra of that probe,
where the appearance of an excitonic interaction strongly
supports this conclusion (data not shown). The profile of
variation of TMA-DPH anisotropy as a function of NCer
content (Fig. 4) also validates the position of the solidus
boundary, because the anisotropy of the probe reaches a
plateau for NCer concentrations close to those that define the
boundary. In addition, DPH anisotropy variation clearly
shows that a 100% Gm phase is attained for ;70% NCer at
24�C.To unravel the complexity of the low-temperature region
of the diagram (Fig. 7), it was necessary to combine the re-
sults of fluorescence experiments and confocal microscopy.
The analysis of the variation of the area covered by gel do-
mains in GUVs when increasing the NCer content (Fig. 6)
showed that 100% of gel should be attained at ;50% NCer
(as mentioned above). Microscopy experiments were per-
formed at 22�C, very close to the Gm-to-Gp phase transition
of NCer. The complex morphological behavior observed,
with the coexistence of gel and fluid domains in GUV to-
gether with NCer-enriched tubular structures, indicates that a
three-phase line must exist in the phase diagram at this
temperature. Because of the shape of the liquidus boundary
(L1) that spans the diagram between 0–100% NCer, the
phase diagrammust be of the peritectic type, i.e., presenting a
horizontal line with a peritectic point (point P, Fig. 7), wherea transition of Gel I 1 F to Gel II 1 F (Gm and Gp, respec-
tively) happens. In this peritectic line (L3, Fig. 7), all threephases are stable. If the phase diagram was of the monotectic
type, then two liquidus boundaries converging at the mono-
tectic point would have to exist, which is not the case.
Based on the anisotropy variation with temperature (Fig.
2, D–F), it was possible to determine Tp for mixtures con-
taining XNCer .50% (L4, Fig. 7). For mixtures with lower
NCer content, the pretransition was not detected because of
the variation in the anisotropy is broader. This difference is
caused by the presence of fluid below 20�C and XNCer,50%,
and its absence above XNCer .50%. The presence of fluid
obscures the pretransition, giving rise to modest changes in
the photophysical parameters of the probes, compared with
the main transition. However, by replotting the data as a
function of XNCer for each temperature (as exemplified in the
Supplementary Material, Fig. S1), it was possible to deter-
mine the point at which onlyGm is present. This was detected
by TMA-DPH, and corresponds to the XNCer where anisot-
ropy reaches a plateau. For up to 22�C, the concentration of
NCer required to attain this plateau is always close to 50%,
suggesting the presence of an almost vertical boundary (L5,
Fig. 7) in the diagram that separates the Gm phase from the
Gm 1 F coexistence region, on the right and left sides of the
boundary, respectively. The presence of this coexistence re-
gion can be clearly concluded from the linear trend of vari-
ation of TMA-DPH anisotropy (Fig. S1). In addition,
thermodynamic restrictions dictate that only one phase can
change within two adjacent regions (64), and below and
above a horizontal line, two phases must be present. This rule
further implies that on the right side of L5, a small region of
gel-gel coexistence (Gm 1 Gp) must be present (separated by
L4 and L6, Fig. 7), so that the diagram has thermodynamic
consistency. This region is very narrow, as observed in other
phase diagrams for fluid mixtures with peritectic behavior
(62). These boundaries (L4, L5, and L6) are further con-
firmed by x-ray data: for 50% NCer, SAXS shows a sharp
and relatively narrow peak at d ; 61.5 A, whereas at 80%
NCer, the peak is very broad and indicative of gel-gel co-
existence. Two peaks in the hexagonal packing region appear
in theWAXS. In addition, the data show that the contribution
of the fluid phase decreases with an increase in NCer content,
because the WAXS reflection attributed to the fluid phase
disappears, and the lamellar distance increases. In fact, upon
crossing the L5 boundary, i.e., for 60% NCer, the repeat
distance decreases to a value similar to that obtained for pure
NCer, showing that no fluid phase is present.
The phase diagram in Fig. 7 is the simplest one consistent
with both the experimental data and thermodynamic restric-
tions. Still, it is not unlikely that other phases and phase co-
existence regions exist for these mixtures. For instance, DSC
thermograms of mixtures containing a high NCer molar
fraction exhibit an additional transition at higher temperatures
(Fig. 3). Because this transition occurs under conditions very
far from physiological, and exerts no interference on with the
main boundaries of the diagram, its nature was not further
investigated. However, it is likely to correspond to a transition
to a nonlamellar phase because of the strong tendency of long-
chain Cer to promote the formation of hexagonal phases (29).
For instance, for NCer .70% and at T . Tm, the liquidus
boundary (L1) is almost horizontal, and thus another coex-
istence region could be present, e.g., a coexistence region
similar to the one proposed for POPC/PCer mixtures (10), or a
region of coexistence of a hexagonal with a lamellar phase.
Based on the phase diagram, the existence of a large gel/
fluid coexistence region reflecting the nonideality and im-
miscibility of the two lipids is evident. The phase diagram
highlights the fact that between room temperature (24�C) andphysiological temperature (37�C), the stable phases include
the fluid and the partial interdigitated gel, forming for XNCer
;25% at 37�C.
CONCLUSIONS
The complexity in the phase behavior of POPC/NCer binary
mixtures is a result of the marked structural dissimilarities
between these lipids. The study of this system in the complete
2876 Pinto et al.
Biophysical Journal 95(6) 2867–2879
composition range, together with the microscopic morpho-
logical study for selected compositions, was important for
understanding POPC/NCer interactions, and for assigning
lipid phases. Moreover, it was necessary to determine how
NCer affects a fluid bilayer fully hydrated at 37�C. This isbecause it is difficult to predict what kind of behavior should
have the system of an asymmetric phospholipid such as
POPC, with a saturated and monounsaturated chain, mixed
with an even more asymmetric lipid, with a sphingoid base
that matches approximately the POPC chain, but also has a
very small headgroup, and furthermore a very long acyl chain
that presents an unsaturation.
Systematic and thermodynamic studies of mixtures of
highly asymmetric lipids with different headgroups are far
from abundant. Here we show that despite its high com-
plexity, the system can be accurately described with a peri-
tectic phase diagram similar to the iron-carbon mixture (64).
The phase diagram is characterized by several regions pre-
senting phase separations, both gel-fluid and gel-gel. Nerv-
onoylceramide presents a relatively low solubility in fluid
POPC, leading to a broad region of Gp 1 F coexistence. For
comparison, the liquidus and solidus predicted for this mix-
ture, in case it behaved ideally, are also shown in the phase
diagram (IM 1 and IM 2, respectively, in Fig. 7). These
boundaries were calculated using DHPOPC ¼ 5.8 kcal/mol
(35) and DHGal-NCer ¼ 7 kcal/mol (46). It can be seen that
the realGp1 F region is much broader than it would be if the
system behaved ideally. Importantly, the deviation from the
ideality is more pronounced in the region of low NCer frac-
tions. Nevertheless, compared with other long-chain Cer,
e.g., PCer (10), the NCer solubility in fluid is higher. For
example, 10% and 30% NCer are required to drive gel-fluid
phase separation at 24�C and 37�C, respectively. Similar
observations were made for DMPC/PCer and DMPC/NCer
mixtures (19). In addition, for very high NCer concentra-
tions, the liquidus and solidus boundaries (L1 and L2, re-
spectively) are quite close to ideality. The similarity between
the experimental solidus boundaries and ideal mixing sug-
gests that DH for NCer should be slightly lower than the one
used (Gal-NCer), because the entire diagram suggests strong
deviation from the ideality, and the DSC scans indicate a low
DH for NCer.
Also interesting is the ability of NCer to form interdigitated
gel phases that can segregate into tubular structures, making
this lipid a good candidate in the modulation of biological
processes such as: 1), signal transduction across membrane
leaflets; 2), membrane fusion, fission, and budding; and 3),
sorting of lipids and proteins, or even morphological spe-
cializations that occur, e.g., in neural cells which are enriched
in C24:1 sphingolipids.
On the other hand, if the formation of Cer gel domains is
required for the activation of signaling cascades that lead to
apoptosis, then NCer is probably a worse candidate than PCer
for apoptosis induction, because higher levels of NCer are
needed for gel-domain formation (10). The distinct biophys-
ical behavior of different Cer again raises the question (or
hypothesis) of a requirement for a certain Cer to modulate a
specific biological process, as previously suggested for the
differential expression of ceramide synthase genes (65).
SUPPLEMENTARY MATERIAL
To view all of the supplemental files associated with this
article, visit www.biophysj.org.
The authors thank Alexander Fedorov for assistance with time-resolved
fluorescence measurements, Anabela Fernandes for facilities with DSC
instrumentation, and Claudio Soares for the simulation of NCer structures
in Fig. 7. The Fundacxao para a Ciencia e Tecnologia, Portugal, supported
this work (POCTI/QUI/57123/2004 and POCTI/QUI/68151/2006) and
provided a research grant to L.C.S. (BPD/30289/2006).
REFERENCES
1. Merrill, A. H. 2002. De novo sphingolipid biosynthesis: a necessary,but dangerous, pathway. J. Biol. Chem. 277:25843–25846.
2. Ohanian, J., and V. Ohanian. 2001. Sphingolipids in mammalian cellsignalling. Cell. Mol. Life Sci. 58:2053–2068.
3. Zheng, W., J. Kollmeyer, H. Symolon, A. Momin, E. Munter, E. Wang,S. Kelly, J. C. Allegood, Y. Liu, Q. Peng, H. Ramaraju, M. C. Sullards,M. Cabot, and A. H. Merrill. 2006. Ceramides and other bioactivesphingolipid backbones in health and disease: lipidomic analysis,metabolism and roles in membrane structure, dynamics, signalingand autophagy. Biochim. Biophys. Acta. 1758:1864–1884.
4. Taha, T. A., T. D. Mullen, and L. M. Obeid. 2006. A house divided:ceramide, sphingosine, and sphingosine-1-phosphate in programmedcell death. Biochim. Biophys. Acta. 1758:2027–2036.
5. Fahy, E., S. Subramaniam, H. A. Brown, C. K. Glass, A. H. Merrill,R. C. Murphy, C. R. H. Raetz, D. W. Russell, Y. Seyama, W. Shaw, T.Shimizu, F. Spener, G. van Meer, M. S. VanNieuwenhze, S. H. White,J. L. Witztum, and E. A. Dennis. 2005. A comprehensive classificationsystem for lipids. J. Lipid Res. 46:839–861.
6. Goni, F. M., F. X. Contreras, L. R. Montes, J. Sot, and A. Alonso.2005. Biophysics (and sociology) of ceramides. Biochem. Soc. Symp.72:177–188.
7. Futerman, A. H., and Y. A. Hannun. 2004. The complex life of simplesphingolipids. EMBO Rep. 5:777–782.
8. Schenck, M., A. Carpinteiro, H. Grassme, F. Lang, and E. Gulbins.2007. Ceramide: physiological and pathophysiological aspects. Arch.Biochem. Biophys. 462:171–175.
9. Hsueh, Y. W., R. Giles, N. Kitson, and J. Thewalt. 2002. The effect ofceramide on phosphatidylcholine membranes: a deuterium NMR study.Biophys. J. 82:3089–3095.
10. Silva, L., R. F.M.DeAlmeida,A. Fedorov, A. P.A.Matos, andM. Prieto.2006.Ceramide-platform formation and -induced biophysical changes in afluid phospholipid membrane.Mol. Membr. Biol. 23:137–150.
11. Siskind, L. J., R. N. Kolesnick, and M. Colombini. 2006. Ceramideforms channels in mitochondrial outer membranes at physiologicallyrelevant concentrations. Mitochondrion. 6:118–125.
12. Contreras, F. X., A. V. Villar, A. Alonso, R. N. Kolesnick, and F. M.Goni. 2003. Sphingomyelinase activity causes transbilayer lipid trans-location in model and cell membranes. J. Biol. Chem. 278:37169–37174.
13. Contreras, F. X., G. Basanez, A. Alonso, A. Herrmann, and F. M.Goni. 2005. Asymmetric addition of ceramides but not dihydrocer-amides promotes transbilayer (flip-flop) lipid motion in membranes.Biophys. J. 88:348–359.
14. Carrer, D. C., and B. Maggio. 1999. Phase behavior and molecularinteractions in mixtures of ceramide with dipalmitoylphosphatidylcho-line. J. Lipid Res. 40:1978–1989.
Membrane Behavior of Nervonoylceramide 2877
Biophysical Journal 95(6) 2867–2879
15. Holopainen, J. M., J. Y. A. Lehtonen, and P. K. J. Kinnunen. 1997.Lipid microdomains in dimyristoylphosphatidylcholine—ceramide lip-osomes. Chem. Phys. Lipids. 88:1–13.
16. Holopainen, J. M., J. Lemmich, F. Richter, O. G. Mouritsen, G. Rapp,and P. K. J. Kinnunen. 2000. Dimyristoylphosphatidylcholine/C16:0-ceramide binary liposomes studied by differential scanning calorimetryand wide- and small-angle x-ray scattering. Biophys. J. 78:2459–2469.
17. Silva, L. C., R. F. M. De Almeida, B. M. Castro, A. Fedorov, and M.Prieto. 2007. Ceramide-domain formation and collapse in lipid rafts:Membrane reorganization by an apoptotic lipid.Biophys. J. 92:502–516.
18. Castro, B. M., R. F. M. De Almeida, L. C. Silva, A. Fedorov, and M.Prieto. 2007. Formation of ceramide/sphingomyelin gel domains in thepresence of an unsaturated phospholipid: a quantitative multiprobeapproach. Biophys. J. 93:1639–1650.
19. Holopainen, J. M., H. L. Brockman, R. E. Brown, and P. K. J.Kinnunen. 2001. Interfacial interactions of ceramide with dimyristoyl-phosphatidylcholine: impact of the N-acyl chain. Biophys. J. 80:765–775.
20. Carrer, D. C., S. Hartel, H. L. Monaco, and B. Maggio. 2003. Ceramidemodulates the lipid membrane organization at molecular and supra-molecular levels. Chem. Phys. Lipids. 122:147–152.
21. Laviad, E. L., L. Albee, I. Pankova-Kholmyansky, S. Epstein, H. Park,A. H. Merrill, and A. H. Futerman. 2008. Characterization of ceramidesynthase 2—tissue distribution, substrate specificity, and inhibition bysphingosine 1-phosphate. J. Biol. Chem. 283:5677–5684.
22. Huang, C. H., and J. T. Mason. 1986. Structure and properties ofmixed-chain phospholipid assemblies. Biochim. Biophys. Acta. 864:423–470.
23. Putzel, G. G., and M. Schick. 2008. Phase behavior of a model bilayermembrane with coupled leaves. Biophys. J. 94:869–877.
24. Vierl, U., L. Lobbecke, N. Nagel, and G. Cevc. 1994. Solute effects onthe colloidal and phase-behavior of lipid bilayer-membranes—ethanol-dipalmitoylphosphatidylcholine mixtures. Biophys. J. 67:1067–1079.
25. Sklar, L. A., B. S. Hudson, M. Petersen, and J. Diamond. 1977.Conjugated polyene fatty-acids on fluorescent-probes—spectroscopiccharacterization. Biochemistry. 16:813–819.
26. Lentz, B. 1988. Membrane ‘‘fluidity’’ from fluorescence anisotropymeasurements. In Spectroscopic Membrane Probes, Vol. I. L. Loew,editor. CRC, Boca Raton, FL. 13–41.
27. De Almeida, R. F. M., A. Fedorov, and M. Prieto. 2003. Sphingo-myelin/phosphatidylcholine/cholesterol phase diagram: boundaries andcomposition of lipid rafts. Biophys. J. 85:2406–2416.
28. De Almeida, R. F. M., L. M. S. Loura, A. Fedorov, and M. Prieto.2005. Lipid rafts have different sizes depending on membrane com-position: a time-resolved fluorescence resonance energy transfer study.J. Mol. Biol. 346:1109–1120.
29. Veiga, M. P., J. L. R. Arrondo, F. M. Goni, and A. Alonso. 1999.Ceramides in phospholipid membranes: effects on bilayer stability andtransition to nonlamellar phases. Biophys. J. 76:342–350.
30. De Almeida, R. F. M., J. Borst, A. Fedorov, M. Prieto, and A. J. W. G.Visser. 2007. Complexity of lipid domains and rafts in giant uni-lamellar vesicles revealed by combining imaging and microscopic andmacroscopic time-resolved fluorescence. Biophys. J. 93:539–553.
31. Ayuyan,A.G., and F.S.Cohen. 2006. Lipid peroxides promote large rafts:effects of excitation of probes in fluorescence microscopy and electro-chemical reactions during vesicle formation. Biophys. J. 91:2172–2183.
32. Sot, J., L. A. Bagatolli, F. M. Goni, and A. Alonso. 2006. Detergent-resistant, ceramide-enriched domains in sphingomyelin/ceramide bila-yers. Biophys. J. 90:903–914.
33. Metso, A. J., H. X. Zhao, K. Tuunainen, and P. K. J. Kinnunen. 2005.Observation of the main phase transition of dinervonoylphosphocho-line giant liposomes by fluorescence microscopy. Biochim. Biophys.Acta. 1713:83–91.
34. Levin, I. W., T. E. Thompson, Y. Barenholz, and C. Huang. 1985. Twotypes of hydrocarbon chain interdigitation in sphingomyelin bilayers.Biochemistry. 24:6282–6286.
35. Koynova, R., and M. Caffrey. 1998. Phases and phase transitions of thephosphatidylcholines. Biochim. Biophys. Acta. 1376:91–145.
36. Sklar, L. A., G. P. Miljanich, and E. A. Dratz. 1979. Phospholipid lateralphase separation and the partition of cis-parinaric acid and trans-parinaricacid among aqueous, solid lipid, and fluid lipid phases. Biochemistry.18:1707–1716.
37. Lakowicz, J. 1999. Principles of Fluorescence Spectroscopy. KluwerAcademics, New York.
38. Parente, R. A., and B. R. Lentz. 1985. Advantages and limitationsof 1-palmitoyl-2-[[2-[4-(6-phenyl-trans-1,3,5-hexatrienyl)phenyl]eth-yl]carb onyl]-3-Sn-phosphatidylcholine as a fluorescent membraneprobe. Biochemistry. 24:6178–6185.
39. Mcintosh, T. J., S. A. Simon, J. C. Ellington, and N. A. Porter. 1984.New structural model for mixed-chain phosphatidylcholine bilayers.Biochemistry. 23:4038–4044.
40. Lewis, R. N., R. N. McElhaney, F. Osterberg, and S. M. Gruner. 1994.Enigmatic thermotropic phase behavior of highly asymmetric mixed-chain phosphatidylcholines that form mixed-interdigitated gel phases.Biophys. J. 66:207–216.
41. Shah, J., J. M. Atienza, A. V. Rawlings, and G. G. Shipley. 1995.Physical-properties of ceramides—effect of fatty-acid hydroxylation.J. Lipid Res. 36:1945–1955.
42. Fidorra, M., L. Duelund, C. Leidy, A. C. Simonsen, and L. A.Bagatolli. 2006. Absence of fluid-ordered/fluid-disordered phase coex-istence in ceramide/ POPC mixtures containing cholesterol. Biophys. J.90:4437–4451.
43. Shah, J., J. M. Atienza, R. I. Duclos, A. V. Rawlings, Z. X. Dong, andG. G. Shipley. 1995. Structural and thermotropic properties of syn-thetic C16–0 (palmitoyl) ceramide—effect of hydration. J. Lipid Res.36:1936–1944.
44. Chen, H. C., R. Mendelsohn, M. E. Rerek, and D. J. Moore. 2000.Fourier transform infrared spectroscopy and differential scanning calo-rimetry studies of fatty acid homogeneous ceramide 2. Biochim. Biophys.Acta. 1468:293–303.
45. Li, X. M., J. M. Smaby, M. M. Momsen, H. L. Brockman, and R. E.Brown. 2000. Sphingomyelin interfacial behavior: the impact ofchanging acyl chain composition. Biophys. J. 78:1921–1931.
46. Kulkarni, V. S., W. H. Anderson, and R. E. Brown. 1995. Bilayernanotubes and helical ribbons formed by hydrated galactosylcer-amides: acyl chain and headgroup effects. Biophys. J. 69:1976–1986.
47. Robert, B. Gennis. 1989. Biomembranes Molecular Structure and Func-tion. New York.
48. Niemela, P. S., M. T. Hyvonen, and I. Vattulainen. 2006. Influence ofchain length and unsaturation on sphingomyelin bilayers. Biophys. J.90:851–863.
49. Boggs, J. M. 1987. Lipid intermolecular hydrogen-bonding—influenceon structural organization and membrane-function. Biochim. Biophys.Acta. 906:353–404.
50. Ramstedt, B., and J. P. Slotte. 2006. Sphingolipids and the formation ofsterol-enriched ordered membrane domains. Biochim. Biophys. Acta.1758:1945–1956.
51. Saxena, K., R. I. Duclos, P. Zimmermann, R. R. Schmidt, and G. G.Shipley. 1999. Structure and properties of totally synthetic galacto- andgluco-cerebrosides. J. Lipid Res. 40:839–849.
52. Carrer, D. C., S. Schreier, M. Patrito, and B. Maggio. 2006. Effects of ashort-chain ceramide on bilayer domain formation, thickness, and chainmobility: DMPC and asymmetric ceramide mixtures. Biophys. J. 90:2394–2403.
53. Reed, R. A., and G. G. Shipley. 1987. Structure and metastability ofN-lignocerylgalactosylsphingosine (cerebroside) bilayers. Biochim.Biophys. Acta. 896:153–164.
54. Takahashi, H., T. Hayakawa, Y. Kawasaki, K. Ito, T. Fujisawa, M.Kodama, and T. Kobayashi. 2007. Structural characterization ofN-lignoceroyl (C24:0) sphingomyelin bilayer membranes: a re-evalua-tion. J. Appl. Cryst. 40:s312–s317.
2878 Pinto et al.
Biophysical Journal 95(6) 2867–2879
55. Mason, J. T., C. H. Huang, and R. L. Biltonen. 1981. Calorimetric
investigations of saturated mixed-chain phosphatidylcholine bilayer
dispersions. Biochemistry. 20:6086–6092.
56. Huang, C. 1990. Mixed-chain phospholipids and interdigitated bilayer
systems. Klin. Wochenschr. 68:149–165.
57. Li, S., Z. Q. Wang, H. N. Lin, and C. Huang. 1993. Energy-minimized
structures and packing states of a homologous series of mixed-chain
phosphatidylcholines: a molecular mechanics study on the diglyceride
moieties. Biophys. J. 65:1415–1428.
58. Goldstein, A. S., A. N. Lukyanov, P. A. Carlson, P. Yager, and M. H.
Gelb. 1997. Formation of high-axial-ratio-microstructures from natural
and synthetic sphingolipids. Chem. Phys. Lipids. 88:21–36.
59. Kulkarni, V. S., J. M. Boggs, and R. E. Brown. 1999. Modulation of
nanotube formation by structural modifications of sphingolipids.
Biophys. J. 77:319–330.
60. Hannun, Y. A. 1996. Functions of ceramide in coordinating cellular
responses to stress. Science. 274:1855–1859.
61. Gutberlet, T., U. Dietrich, G. Klose, and G. Rapp. 1998. X-ray
diffraction study of the lamellar-hexagonal phase transition in phos-
pholipid/surfactant mixtures. J. Colloid Interface Sci. 203:317–327.
62. Marsh, D. 1990. Handbook of Lipid Bilayers. CRC Press, Boca Raton, FL.
63. Mabrey, S., and J. M. Sturtevant. 1976. Investigation of phase
transitions of lipids and lipid mixtures by high sensitivity differential
scanning calorimetry. Proc. Natl. Acad. Sci. USA. 73:3862–3866.
64. Rhines, F. N. 1956. Phase Diagrams in Metallurgy: Their Development
and Application. McGraw-Hill, New York.
65. Pewzner-Jung, Y., S. Ben Dor, and A. H. Futerman. 2006. When do
lasses (longevity assurance genes) become CerS (ceramide synthases)?
Insights into the regulation of ceramide synthesis. J. Biol. Chem. 281:25001–25005.