Page 1
1
Membrane Process to Capture Carbon
Dioxide from Coal-Fired Power Plant
Flue Gas
NETL Review Meeting
September 14, 2010
K. Amo, R. Baker, B. Firat, Z. He, H. Lin, T. Merkel,
S. Pande, X. Wei, and H. Wijmans
Membrane Technology and Research, Inc.
Page 2
2
Outline
Project timeline and objectives overview
Introduction to MTR
Membrane technology background
Results to date
o NT43085
o NT05312
Future plans
Page 3
3
Project Overview
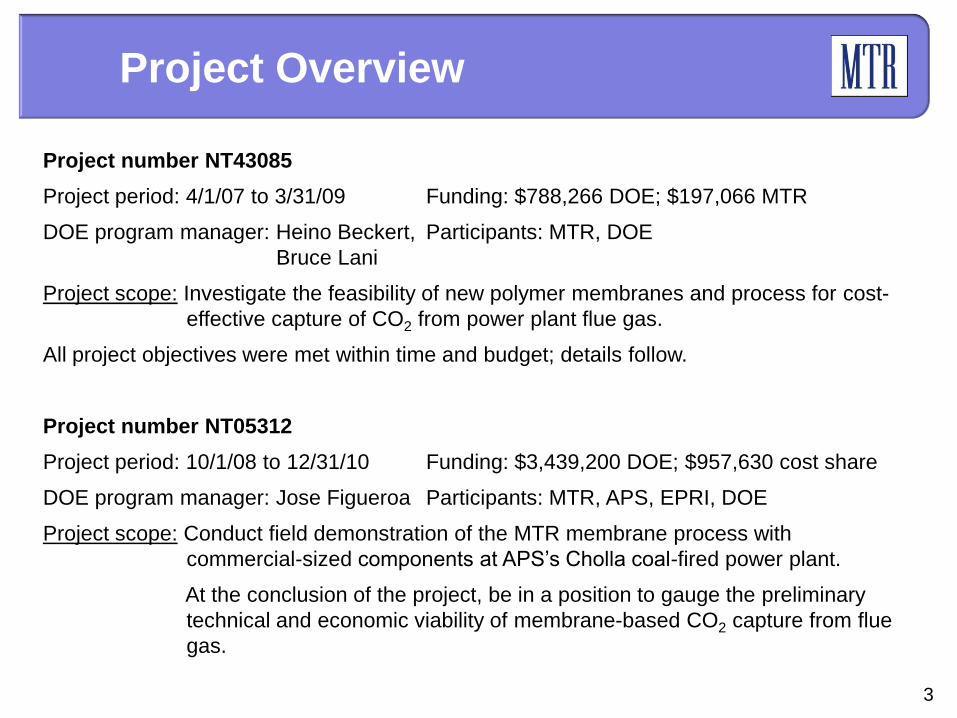
Project number NT43085
Project period: 4/1/07 to 3/31/09 Funding: $788,266 DOE; $197,066 MTR
DOE program manager: Heino Beckert, Participants: MTR, DOE
Bruce Lani
Project scope: Investigate the feasibility of new polymer membranes and process for cost-
effective capture of CO2 from power plant flue gas.
All project objectives were met within time and budget; details follow.
Project number NT05312
Project period: 10/1/08 to 12/31/10 Funding: $3,439,200 DOE; $957,630 cost share
DOE program manager: Jose Figueroa Participants: MTR, APS, EPRI, DOE
Project scope: Conduct field demonstration of the MTR membrane process with
commercial-sized components at APS’s Cholla coal-fired power plant.
At the conclusion of the project, be in a position to gauge the preliminary
technical and economic viability of membrane-based CO2 capture from flue
gas.
Page 4
4
Introduction to MTR
Natural Gas:
Petrochemicals:
Hydrogen (Refinery):
Propylene/Nitrogen
CO2/CH4, CH4/N2
NGL/CH4
H2/CH4, CO, CO2
MTR designs, manufactures, and sells membrane systems for industrial gas separations
Customers include: BP, Chevron,
Dominion Exploration, Ercros,
ExxonMobil, Formosa Plastics,
Innovene, Sabic, Sasol, Sinopec,
Solvay, and Statoil.
Page 5
5
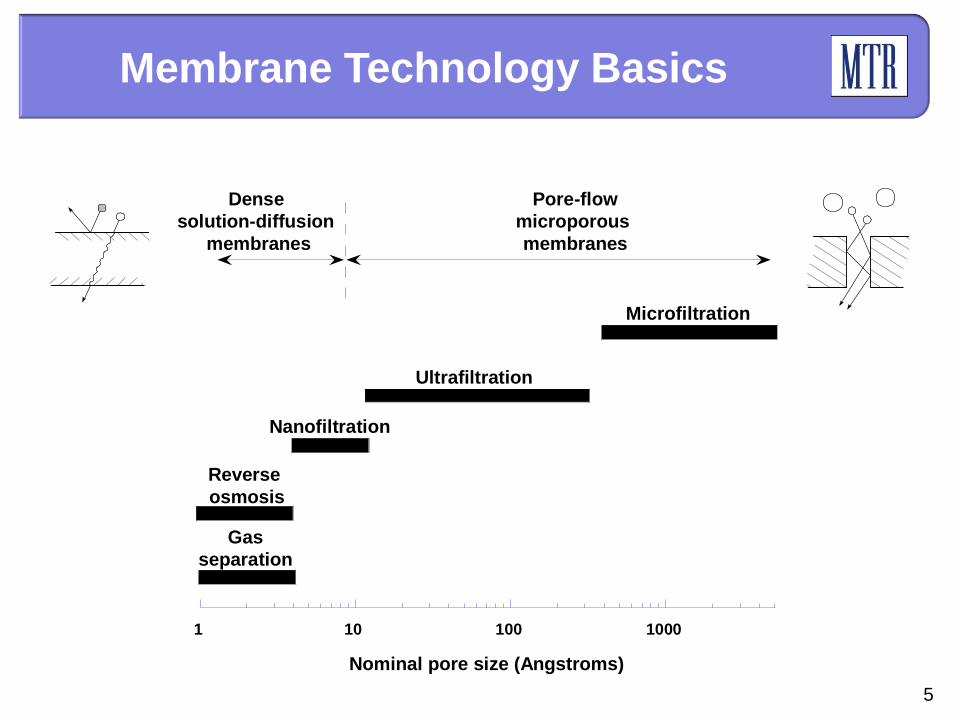
1 10 100 1000
Nominal pore size (Angstroms)
Microfiltration
Ultrafiltration
Nanofiltration
Reverse
osmosis
Gas
separation
Pore-flow
microporous
membranes
Dense
solution-diffusion
membranes
Membrane Technology Basics
Page 6
6
10-3
10-2
10-1
100
101
102
103
104
0 100 200 300
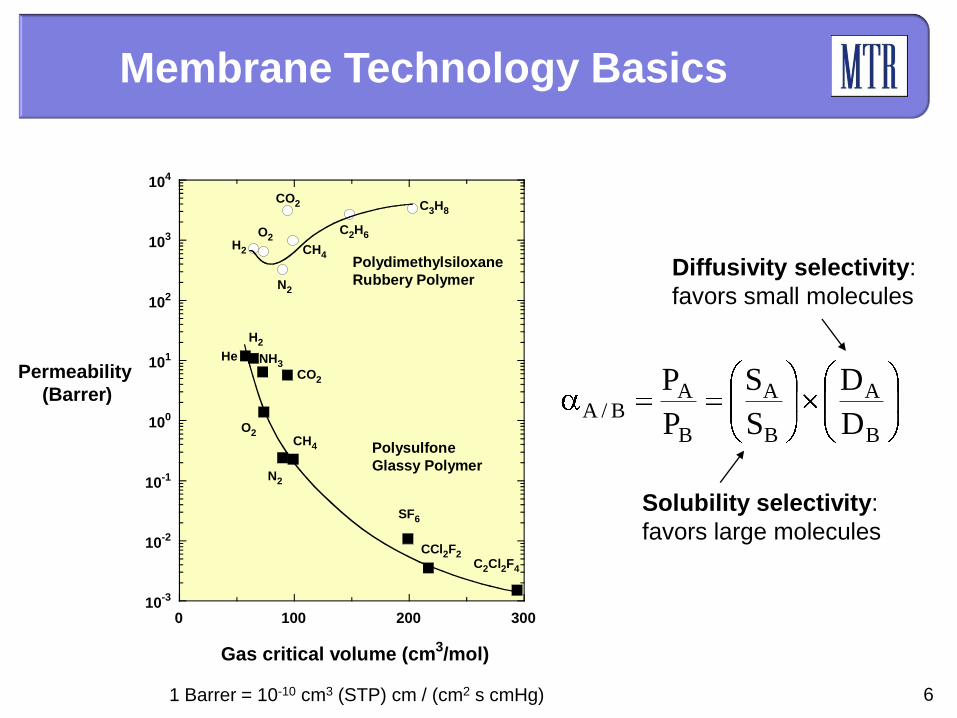
Permeability
(Barrer)
Polydimethylsiloxane
Rubbery Polymer
Polysulfone
Glassy Polymer
H2
O2
N2
CO2
CH4
C2H6
C3H8
C2Cl2F4
CCl2F2
SF6
CH4
N2
O2
CO2
NH3
H2
He
Gas critical volume (cm3/mol)
B
A
B
A
B
AB/A
D
D
S
S
P
P
Solubility selectivity:
favors large molecules
Diffusivity selectivity:
favors small molecules
1 Barrer = 10-10 cm3 (STP) cm / (cm2 s cmHg)
Membrane Technology Basics
Page 7
7
• Spiral-wound modules are used.
• Membranes have to be thin to provide useful fluxes.
(0.1-0.5 μm)
(50-100 μm)
Membrane Technology Basics
Page 8
8
• Simple operation; no chemical reactions, no moving parts, no heating
required to recover CO2, no use of hazardous chemicals
• Tolerance to high levels of wet acid gases; inert to oxygen
• Compact and modular with a small footprint; easily scalable
• Inherently energy efficient (~20 % plant energy at 90% capture)
• No additional water used (recovers water from flue gas)
• No steam use, so no modifications to existing boiler and steam turbine
are required
Advantages of a Membrane
Process
Page 9
9
CO2 Capture at a Coal-Fired Power Plant
BoilerCoal
CO2
AirESP FGD
Ash
Steam to turbines
Membrane challenges for treating this large volume of gas:
• Large membrane area needed → high CO2 permeance is a must!
• How to generate driving force w/o using large compression or vacuum power
• Potential harmful contaminants (fly ash, SO2, NOx, water, and trace metals)
may reduce effectiveness and lifetime.
Sulfur
• 600 MWe → 500 Nm3/s = 1,540 MMscfd flue gas
• 10 – 15% CO2 in N2 = 10,000 ton CO2/day at low pressure
Page 10
10
MTR CO2 Capture Process
Countercurrent sweep with combustion air provides “free” driving force
that lowers the required energy
CO2 recycled in combustion air stream decreases membrane area
required
1.8% CO2
83% CO2
4.7% CO2
7.4% CO2
1 Bar 1.1 to 2 Bar
19% CO2
0.2 Bar
68% CO2
18% H2O
100 Bar
Page 11
11
Polaris™ Membranes
Pure-gas data at 25°C and 50 psig feed pressure
1 gpu = 10-6 cm3(STP)/(cm2 s cmHg)= 3.35 x 10⁻¹⁰ mol/(m2 s Pa)
10
20
30
40
50
60
100 1,000 10,000
CO2/N2
selectivity
CO2 permeance (gpu)
PolarisTM
Target area
identified from
design calculations
Commercial
CO2 membranes
Page 12
12
Flue gas membranes must be robust
Feed composition 18% CO2 in N2; Temperature: 50°C
0
2
4
6
8
10
0
10
20
30
40
50
60
70
80
0 10 20 30 40 50 60 70
Mixed-gas
CO2 flux
(slpm/m2)
CO2/N2
selectivity
Permeation time (days)
no SO2 100 ppm SO2
1,000 ppm
SO2
Page 13
13
A six-month field test of 8-inch diameter Polaris™ membrane modules started operation in April 2010
Capacity is 1 ton CO2/day
(1/10,000 of 90% capture from a 600 MW power plant)
Objectives:
oDemonstrate performance of commercial-sized modules with real coal-fired flue gas
o Demonstrate air sweep operation in commercial-sized modules
o Obtain experience on operating rotating equipment with real flue gas
Cholla Power Plant Field Test Objectives
Page 14
14
Field Tests at APS Cholla Power Plant
A 995 MW PC plant using sub-bituminous coal from the El Segundo
mine in New Mexico
Unit 1 commissioned in 1962; 4 units currently in operation
MTR membrane skid treats post-FGD flue gas from Unit 3
Page 15
15
Cholla Power Plant
FGD
Flue gas
vent line
Flue gas delivery line to
membrane
Page 16
16
Skid houses 8-inch diameter cross-
flow and countercurrent/sweep
modules
Treats ~0.25 MMscfd of post-FGD
flue gas containing about 1 ton
CO2/day (0.05 MWe)
MTR Skid at Cholla
Page 17
17
TPreliminary Cholla Test Results
Module NumberNormalized CO2 Permeance Normalized CO2/N2 Selectivity
Before After Before After
5839
(Cross-flow)100% 110% 100% 118%
5879
(Sweep)100% 108% 100% 96%
Fresh module
Preliminary Cholla Test Results
After 45 days
operation at Cholla
The module looks rusty, but no performance degradation!
Page 18
18
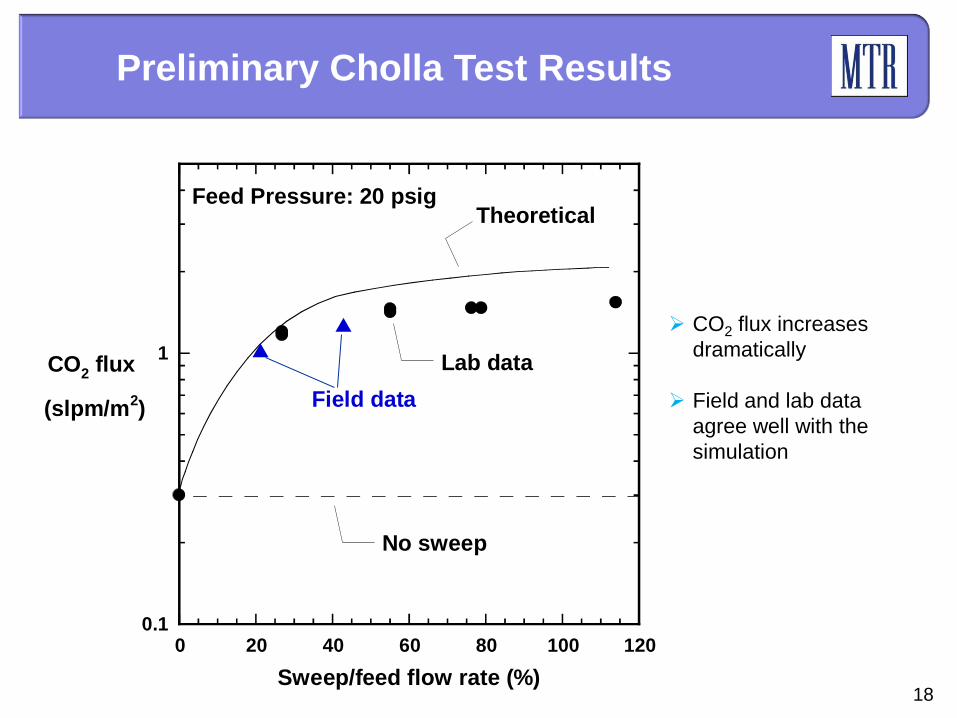
Preliminary Cholla Test Results
CO2 flux increases
dramatically
Field and lab data
agree well with the
simulation
0.1
1
0 20 40 60 80 100 120
CO2 flux
(slpm/m2)
Sweep/feed flow rate (%)
No sweep
Theoretical
Lab data
Field data
Feed Pressure: 20 psig
Page 19
19
Preliminary Cholla Test Results
Cumulative Run
Time (days)
CO2 Captured
(ton)
Feed CO2
(%)
Treated Flue
Gas CO2 (%)
1st Permeate
CO2 (%)
1 0.6 9.4 5.0 43.9
15* 0.9 9.4 2.2 43.6
30 0.9 9.6 2.3 43.8
* Increased capture capacity by adding cross-flow modules
The membrane modules show no performance degradation or pressure drop
increases so far
Most of the early issues are related to water and auxiliary equipment corrosion
rather than ash
Rotating equipment, particularly the feed compressor, bears the brunt of the
contaminants (acidic water, particulates)
Page 20
20
Energy Use Favors
Low Pressure Operation
Process conditions, calculation methods, and cost assumptions are based on the DOE baseline report of
November 2007 (DOE/NETL-401/110907)
Net plant output w/o
CCS is 434 MWe
Base case amine
gives 30% energy
penalty and 85%
increase in LCOE
Base case membrane
process gives 20%
energy penalty and
40-45% increase in
LCOE0
200
400
600
800
1,000
200
250
300
350
400
1 2 3 4 5 6
Membrane
area
(000 m2)
Net
plant
power
(MWe)
Feed pressure (bar)
MEA
base case
90% CO2 capture
Permeate pressure = 0.2 bar
Page 21
21
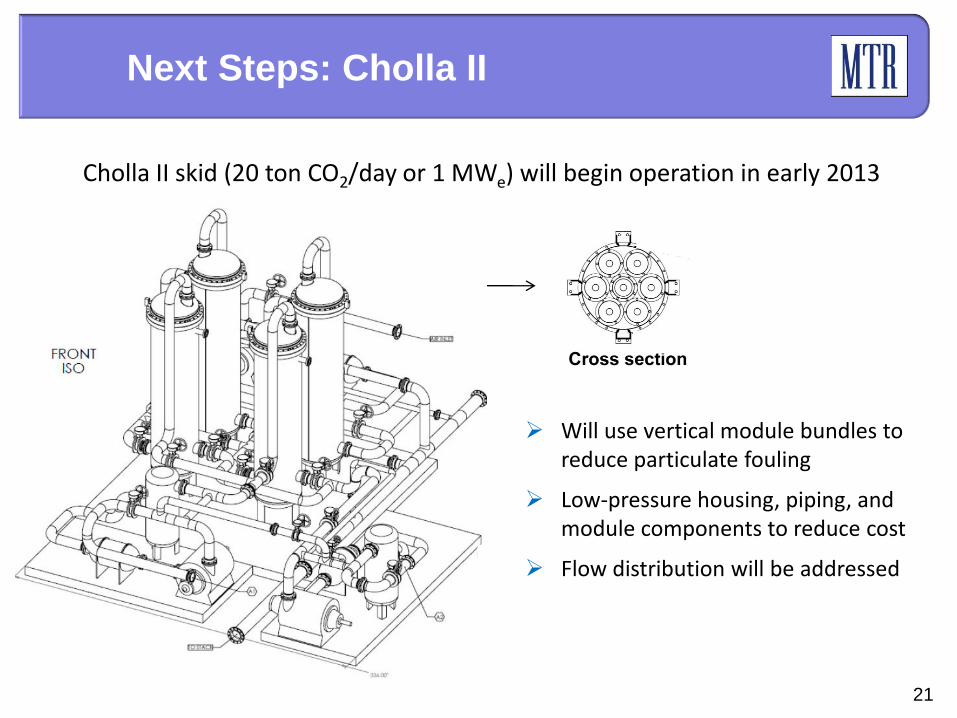
Next Steps: Cholla II
Will use vertical module bundles to reduce particulate fouling
Low-pressure housing, piping, and module components to reduce cost
Flow distribution will be addressed
Cholla II skid (20 ton CO2/day or 1 MWe) will begin operation in early 2013
Page 22
22
Summary
No technology is a clear winner; membranes have some
advantages
Process design is vital to controlling energy use
Better membranes (higher permeance, better selectivity,
stable) can help competitiveness
Field demonstrations with real gases are key to
determining process viability
Page 23
23
Acknowledgements
U.S. Department of Energy,
National Energy Technology Laboratory
– Heino Beckert and Jose Figueroa
Arizona Public Services
– Xiaolei Sun, Ray Hobbs, George Rogers
Electric Power Research Institute
– Abhoyjit Bhown, Brice Freeman