1 Membrane Separation: An Essential Component for A Wood-Based Biorefinery Thomas E. Amidon, Christopher David Wood, and Shijie Liu Faculty of Paper and Bioprocess Engineering SUNY College of Environmental Science and Forestry 1 Forestry Drive, Syracuse, NY 13210 Email: [email protected](Thomas E. Amidon) [email protected](Shijie Liu) Starting from a wood-based biorefinery, this paper discusses the separation and purification platform chemicals from the wood extracts. When wood is subject to hot-water extraction, extractives, hemicelluloses and other components leach out into the extraction liquor. Up to 25% of the woody biomass can be leached out while the wood chips retain much of their potential for traditional uses. The wood extracts can be fractionated for platform chemicals such as monomeric sugars, acetic acid, and methanol. Membrane units can be employed to accomplish the separation and concentration tasks. It has been found that with this complex extract, permeate flow rate increases with increasing pressure drop and decreases with increasing extract concentration as expected for simpler solute / solvent systems. Keywords: acetic acid, biorefinery, ethanol, extraction, fractionation, green power, hot-water, hydrolysis, membrane separation, methanol, wood Introduction Fossil has become the dominant energy and chemical source for mankind since the industrial revolution. Table 1 shows the time scale for which the chemical and/or energy resources we harvest today can be replenished [1]. One can notice from Table 1 that the recharge or natural replenishment of petroleum is in the order of 200 million years. The 200 million years rotation is far too long to be useful to today’s society and the amount of possible reserves is negligible compared to the recharge duration from a human use standpoint. In addition, human activities reduce the accumulation of organic residues available for fossilization due to our tendency to maintain a habitable environment and find uses for organic mater. Thus, the petroleum or fossil energy resources in general are deemed nonrenewable. Effectively, there is only a finite amount of fossil energy available on Earth of current use rates. Societal awareness of environmental impacts as well as problems in stability and sustainability of energy supply has increased the importance of developing and implementing bio- based chemical and energy sources. Domestic energy security and rural economies both benefit from a plant derived chemical/energy economic base. Persistent utilization of fossil supplies as energy and chemical sources has been favored by the relatively low cost to harvest the concentrated energy and chemicals. Technological developments that improve renewable energy and chemical sources must be made to reduce fossil and prepare for the future when we must use less of them. Biomass has been an important energy source for mankind since the beginning of civilization. Ligno-cellulosic biomass is the most abundant organic source on earth, with an annual production in the biosphere of about 170 billion metric tons [2]. Taping into the chemical energy of biomass and reclaiming the historically important position for biomass in energy and transportation is an essential component of improving the sustainability of the world’s economy. Forests cover about 9.5% of the Earth’s surface, but account for 89.3% of the total standing biomass and 73 billion metric tons per year or 42.9% of the total annual biomass production. The distant second on the list is Savanna and grasses which account for 11% of total biomass production. When measured in energy terms, the amount synthesized by the forest alone is equivalent to about three times the world’s total non- renewable energy consumption of 379.343 Quadrillion Btu in 2002 [3]. Research and development is required to increase the energy conversion efficiency from forest biomass to industrial and residential energy and commodity chemical requirements to improve the potential contribution from the carbon sustainably captured by forests. Renewable forest material is carbon neutral, i.e. utilizing forest material will not create a carbon Table 1. Recyle (or Renewable) Times for Chemical Feedstocks. Chemical Recycle time algae 1 month agricultural crops 3 month - 1 year grasses 1 year shrubs 1 – 5 years trees 5 – 80+ years oil, gas and coal 200 million years
Transcript
1
Membrane Separation: An Essential Component for A Wood-Based
Biorefinery
Thomas E. Amidon, Christopher David Wood, and Shijie Liu
Faculty of Paper and Bioprocess Engineering
SUNY College of Environmental Science and Forestry
Starting from a wood-based biorefinery, this paper discusses the separation and purification platform chemicals from the wood extracts. When wood is subject to hot-water extraction, extractives, hemicelluloses and other components leach out into the extraction liquor. Up to 25% of the woody biomass can be leached out while the wood chips retain much of their potential for traditional uses. The wood extracts can be fractionated for platform chemicals such as monomeric sugars, acetic acid, and methanol. Membrane units can be employed to accomplish the separation and concentration tasks. It has been found that with this complex extract, permeate flow rate increases with increasing pressure drop and decreases with increasing extract concentration as expected for simpler solute / solvent systems. Keywords: acetic acid, biorefinery, ethanol,
extraction, fractionation, green power, hot-water, hydrolysis, membrane separation, methanol, wood
Introduction
Fossil has become the dominant energy and chemical source for mankind since the industrial revolution. Table 1 shows the time scale for which the chemical and/or energy resources we harvest
today can be replenished [1]. One can notice from Table 1 that the recharge or natural replenishment of petroleum is in the order of 200 million years. The 200 million years rotation is far too long to be useful to today’s society and the amount of possible reserves is negligible compared to the recharge duration from a human use standpoint. In addition, human activities reduce the accumulation of organic residues available for fossilization due to our tendency to maintain a habitable environment and find uses for organic mater. Thus, the petroleum or fossil energy resources in general are deemed nonrenewable. Effectively, there is only a finite amount of fossil energy available on Earth of current use rates. Societal awareness of environmental impacts as well as problems in stability and sustainability of energy supply has increased the importance of developing and implementing bio-based chemical and energy sources. Domestic energy security and rural economies both benefit from a plant derived chemical/energy economic base. Persistent utilization of fossil supplies as energy and chemical sources has been favored by the relatively low cost to harvest the concentrated energy and chemicals. Technological developments that improve renewable energy and chemical sources must be made to reduce fossil and prepare for the future when we must use less of them.
Biomass has been an important energy source for mankind since the beginning of civilization. Ligno-cellulosic biomass is the most abundant organic source on earth, with an annual production in the biosphere of about 170 billion metric tons [2]. Taping into the chemical energy of biomass and reclaiming the historically important position for biomass in energy and transportation is an essential component of improving the sustainability of the world’s economy. Forests cover about 9.5% of the Earth’s surface, but account for 89.3% of the total standing biomass and 73 billion metric tons per year or 42.9% of the total annual biomass production. The distant second on the list is Savanna and grasses which account for 11% of total biomass production. When measured in energy terms, the amount synthesized by the forest alone is equivalent to about three times the world’s total non-renewable energy consumption of 379.343 Quadrillion Btu in 2002 [3]. Research and development is required to increase the energy conversion efficiency from forest biomass to industrial and residential energy and commodity chemical requirements to improve the potential contribution from the carbon sustainably captured by forests.
Renewable forest material is carbon neutral, i.e. utilizing forest material will not create a carbon
Table 1. Recyle (or Renewable) Times for Chemical Feedstocks.
Chemical Recycle time algae 1 month
agricultural crops 3 month - 1 year grasses 1 year shrubs 1 – 5 years
trees 5 – 80+ years oil, gas and coal 200 million years
2
imbalance over the life cycle of the forest, which is an extended 5 ~ 80+ years time frame as shown in Table 1. Carbon dioxide is drawn from the atmosphere for plants to grow, while plantation, management, conversion of biomass to bio-products, utilization and decomposition of bio-products will all produce carbon dioxide. In an optimal balanced operation, carbon dioxide is simply being recycled during the life span of the plant growth and bio-products [1]. The net effect is that the solar energy converted to energy forms that are being utilized by humans.
Plant biomass is predominantly polymers of carbohydrates, but can be separated into a large number of compounds. Table 2 shows the chemical composition of various wood species. Utilization of this heterogeneous bonded-together mixture is the key for the future supply of chemicals and energy from woody biomass. The process and/or facility that enables the use of plant biomass for chemicals, energy, and commodity products is conceptually
called a Biorefinery, or a fractionation facility of plant biomass to yield desired products. To this end, the separation of wood components is the key to the success of taping woody biomass as an economically viable energy and fuel source. ESF Biorefinery: Water-Based Technology
Besides direct utilization as a building material, major uses of wood today are to make paper and to generate energy by burning. Large volumes of wood, in the order of 1000 metric tons per day or more, are consumed at many industrial sites. In a pulp mill, residual wood from nearby lumber mills and / or wood chips from round wood are either chemically or mechanically disintegrated into fibers. In a chemical pulp (Kraft) mill, aqueous caustic (NaOH) and sulfide (Na2S) solution, referred to as white liquor, is used to cook the wood chips. Lignin and a large fraction of hemicelluloses are dissolved in the aqueous phase, referred to as black liquor. The
Table 2. Chemical Composition (%wt based on dry wood mass) of Various Wood Species, compiled from [4] and [5].
Species Common name
Tota
l Ext
ract
ives
(C
H2C
l 2 fo
lled
by
C2H
5OH
)
Lign
in
Cel
lulo
se
Glu
com
anna
n (in
cl. g
alac
tose
and
ac
etyl
e in
softw
ood)
Glu
curo
noxy
lan
(incl
. ara
bino
se in
so
ftwoo
d an
d ac
etyl
in
har
dwoo
d)
Oth
er
Poly
sacc
harid
es
Res
idua
l con
stitu
ents
Softwoods Abies balsamea
Pseudotsuga menziesii Tsuga canadensis
Juniperus communis Pinus radiata
Pinus sylvestris Picea abies
Picea glauca Larix sibirica
Balsam fir Douglas fir
Eastern hemlock Common juniper Monterey pine
Scots pine Norway spruce White spruce Siberian larch
black liquor is then burned to generate energy and recover caustic and sulfide. To a significant extent, a pulp mill is already a biorefinery whereby energy and cellulosic fibers are produced from wood and transported out to consumers. Therefore, extension of the pulp mill model is easy to envision as a starting point for the development of the next generation of biorefineries.
In a CHP (Combined Heat and Power) facility, wood or woody biomass is burned or combusted (perhaps after gasification) to generate thermal energy (steam) and power (electricity). Both steam and electricity are delivered to other industrial installations. Like a Kraft pulp mill, the CHP plant is also a simplistic biorefinery. CHP pants have an already established large woody biomass handling capacity and extension of the CHP model is also easy to envision as a starting point for the development of the next generation of biorefineries.
Xylan, or pentosan (i.e. 5-carbon sugar polymers, mainly Xylan), is the dominant component in the hemicellulose fraction of hardwood woody biomass, typically 15 ~ 30 % of the dry wood mass as shown in Table 2. Xylan is a polymer made of β-xylopyranose units linked through (1→4)-glycosidic bonds, where arabinose, acetyl groups, and uronic acids are also present as lateral chains. The three major components of hardwood Xylan are xylose, glucuronic acid and acetic acid. Xylan is the most easily separable component in woody biomass among the three major components of hardwood wood: cellulose (glucan), hemicellulose (xylan), and lignin. Lignin has the highest heating value, and cellulose (Glucan) is of the highest current commodity value (as fibers). Therefore, extraction of Xylan for an alternative higher value use is an attractive potential starting point for first implementation of a more sophisticated biorefinery process. Championed through SUNY ESF, expansion of a Kraft pulp mill
and/or CHP plant, converting Xylan into commercial ethanol and biodegradable plastics has become the leading component of the biorefinery effort in New York. Hot-water extraction prior to chemical pulping or burning of woodchips makes for potentially profitable utilization and commercialization of the wood extracts and may improve the niche market advantage of pulps produced (Kraft pulp mill) or the economics of the green electrical power produced (CHP plant).
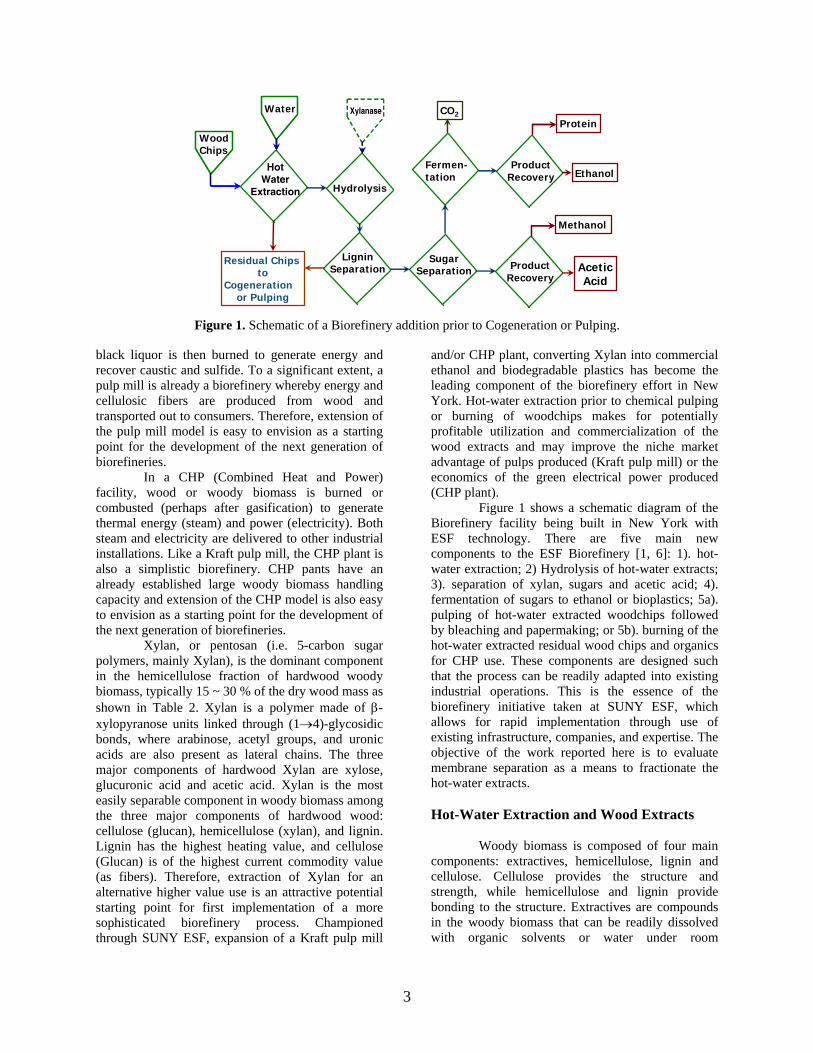
Figure 1 shows a schematic diagram of the Biorefinery facility being built in New York with ESF technology. There are five main new components to the ESF Biorefinery [1, 6]: 1). hot-water extraction; 2) Hydrolysis of hot-water extracts; 3). separation of xylan, sugars and acetic acid; 4). fermentation of sugars to ethanol or bioplastics; 5a). pulping of hot-water extracted woodchips followed by bleaching and papermaking; or 5b). burning of the hot-water extracted residual wood chips and organics for CHP use. These components are designed such that the process can be readily adapted into existing industrial operations. This is the essence of the biorefinery initiative taken at SUNY ESF, which allows for rapid implementation through use of existing infrastructure, companies, and expertise. The objective of the work reported here is to evaluate membrane separation as a means to fractionate the hot-water extracts. Hot-Water Extraction and Wood Extracts
Woody biomass is composed of four main
components: extractives, hemicellulose, lignin and cellulose. Cellulose provides the structure and strength, while hemicellulose and lignin provide bonding to the structure. Extractives are compounds in the woody biomass that can be readily dissolved with organic solvents or water under room
Wood Chips
HotWater
Extraction
Water
Residual Chipsto
Cogenerationor Pulping
Hydrolysis
Lignin Separation
SugarSeparation
Fermen-tation
Product Recovery
Product Recovery
CO2
Ethanol
Methanol
AceticAcid
Xylanase
Protein
Figure 1. Schematic of a Biorefinery addition prior to Cogeneration or Pulping.
4
temperature and atmospheric conditions. In addition, there are inorganic compounds present in the woody biomass. There are over 70 metal and earth elements found in woody biomass, with Potassium and Calcium being the major metals in woody biomass, followed by Magnesium and Phosphorus [4]. In hardwood, for example, Calcium contributes to 0.08 ~ 0.2% of dry stemwood mass and 0.85 ~ 3.05% stem bark mass. Magnesium contributes to 0.02 ~ 0.04% of dry hard wood stem mass and 0.07 ~ 0.11% dry hardwood stem bark mass. Table 3 shows the major components in the extractives and hemicellulose fractions of wood. These components are the first ones that can be extracted from wood. Extraction of the readily hydrolysable carbohydrates with hot water in the absence of added mineral acids or bases is desirable for facilitating the recovery and utilization of the hydrolyzate components. When heating values of the residual chips are to be recovered after extraction, there is no reduction in value due to caustic or metal hydroxides and no increase in corrosion from mineral acids. Environmental and recovery side effects are also avoided as caustic or sodium is not added to the process streams and no byproducts from mineral acid neutralization are produced.
The hot-water extraction process could be catalyzed by base, acid or Xylanase. The hot-water
extraction performed here is either with Xylanase and/or under acidic conditions. Without caustic addition, hydrolyzed hemicelluloses produce acetic acid, in addition to polysaccharides and many other minor components. Figure 2 shows typical mass distributions as a result of hot-water extraction. One can observe that cellulose (Glucan) and lignin (Klason Lignin) are mostly retained by the residual wood chips whereas other components are mostly in the extraction liquor.
Table 3 shows the distribution of major hemicellulose and extractives and some representative structures. Table 2 shows the chemical compositions of various wood species. One can observe from Tables 2 and 3 that there are acidic compounds in the extractives portion of the woody biomass. The dissolution of extractives in water causes the liquor pH to drop and effectively generate acid as catalyst for the extraction. The acetyl groups from hemicellulose, for example, contribute to acetic acid formation in the extraction liquor or the wood extracts. Our experimental results show that the pH level of the hot-water hardwood (maple or willow) extracts is approximately 3.2 for moderate to harsh extraction conditions. Figure 3 shows the change in pH during hot-water extraction for sugar maple woodchips. The pH in the extraction liquor drops from the initial neutral conditions (~ 7.0) to acidic
Table 3. Major Components of Hemicellulose and Extractives (Compiled from [5] and [7]). Distribution, wt% Type Softwoods Hardwoods
Others: cyclitols; tropolones; amino acids, protein, Alkaloids, … Ash 0.2 ~ 0.5 0.2 ~ 0.8 Where G stands for Glucose unit, Ga stands for Galactose unit, M stands for Mannose unit; X stands for Xylose
unit, A stands for Arabinose unit; Ac stands for Acetyl group (CH3CO), and Gu stands for 4-O-methyl-glucuronic acid.
5
conditions. This acidic condition during the hot-water extraction process further catalyzes the extraction and hydrolysis reactions. Therefore, the hot-water extraction reactions are referred to as autocatalytic and, sometimes, as autohydrolysis.
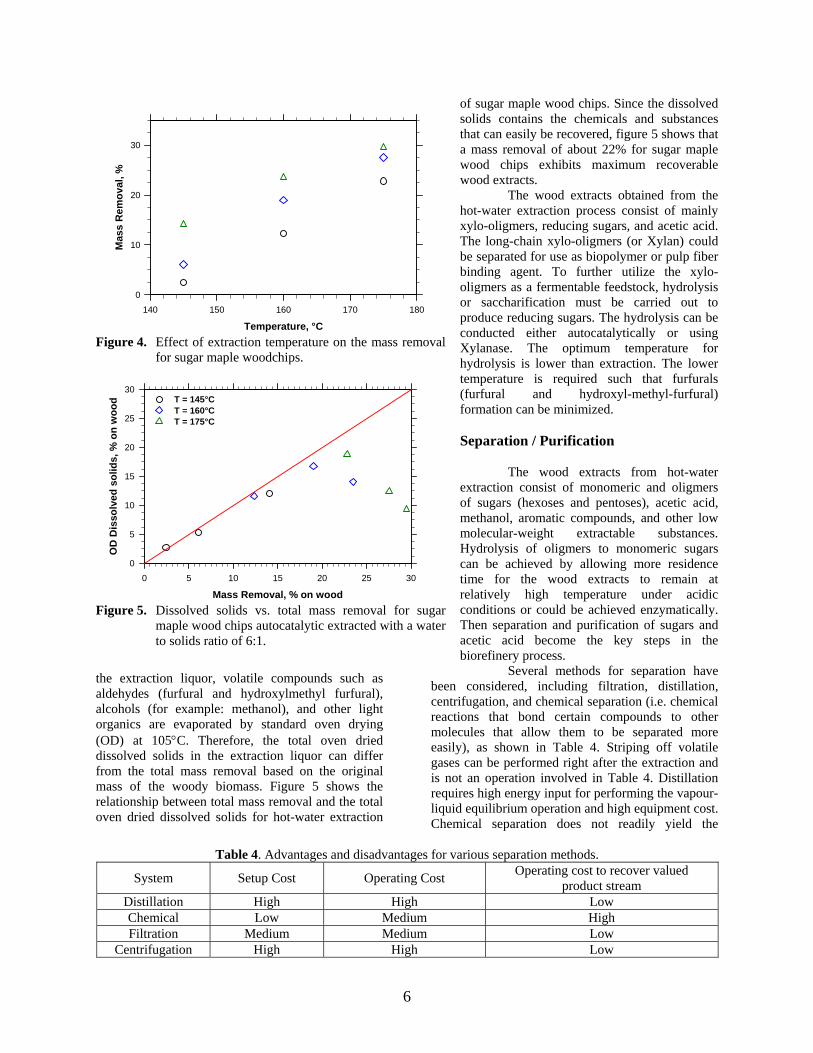
The hot-water extraction proceeds faster and more components are dissoluble under higher extraction temperatures. Figure 4 shows the variation of total mass removal as a function of extraction temperature and extraction time (at desired temperature) for sugar maple wood chips. One can observe from Figure 4 that as temperature is
increased, more mass removal is achieved. As the extraction time is extended, a higher extent of extraction is also observed.
The hemicelluose is extracted from the wood chips in the form of xylo-oligmers with various degree of polymerization. The xylo-oligmers can be hydrolyzed in the extraction liquor to lower molecular weights. The monomeric sugars formed during the extraction and hydrolysis can further decompose into furfural (from xylose) and hydroxymethyl furfural (from glucose). When dissolved solids are measured gravimetrically from
Figure 2. Distribution of main wood components after hot-water extraction for aspen woodchips. The data is taken
from Tschirner et al. (2006) [8]. time, min.
-50 0 50 100 150 200
pH
3
4
5
6
7369.20 g OD Maple Woodchips+ 3024.04 g Water
369.70 g OD Maple Woodchips+ 3002.86 g Water
time, min.-50 0 50 100 150 200
T, °C
0
50
100
150
200
Tota
l Wat
er, g
1000
2000
3000
Figure 3. pH variation with autocatalytic extraction time in a semi-batch M/K digester.
6
the extraction liquor, volatile compounds such as aldehydes (furfural and hydroxylmethyl furfural), alcohols (for example: methanol), and other light organics are evaporated by standard oven drying (OD) at 105°C. Therefore, the total oven dried dissolved solids in the extraction liquor can differ from the total mass removal based on the original mass of the woody biomass. Figure 5 shows the relationship between total mass removal and the total oven dried dissolved solids for hot-water extraction
of sugar maple wood chips. Since the dissolved solids contains the chemicals and substances that can easily be recovered, figure 5 shows that a mass removal of about 22% for sugar maple wood chips exhibits maximum recoverable wood extracts.
The wood extracts obtained from the hot-water extraction process consist of mainly xylo-oligmers, reducing sugars, and acetic acid. The long-chain xylo-oligmers (or Xylan) could be separated for use as biopolymer or pulp fiber binding agent. To further utilize the xylo-oligmers as a fermentable feedstock, hydrolysis or saccharification must be carried out to produce reducing sugars. The hydrolysis can be conducted either autocatalytically or using Xylanase. The optimum temperature for hydrolysis is lower than extraction. The lower temperature is required such that furfurals (furfural and hydroxyl-methyl-furfural) formation can be minimized. Separation / Purification
The wood extracts from hot-water
extraction consist of monomeric and oligmers of sugars (hexoses and pentoses), acetic acid, methanol, aromatic compounds, and other low molecular-weight extractable substances. Hydrolysis of oligmers to monomeric sugars can be achieved by allowing more residence time for the wood extracts to remain at relatively high temperature under acidic conditions or could be achieved enzymatically. Then separation and purification of sugars and acetic acid become the key steps in the biorefinery process.
Several methods for separation have been considered, including filtration, distillation, centrifugation, and chemical separation (i.e. chemical reactions that bond certain compounds to other molecules that allow them to be separated more easily), as shown in Table 4. Striping off volatile gases can be performed right after the extraction and is not an operation involved in Table 4. Distillation requires high energy input for performing the vapour-liquid equilibrium operation and high equipment cost. Chemical separation does not readily yield the
Temperature, °C140 150 160 170 180
Mas
s R
emov
al, %
0
10
20
30
Figure 4. Effect of extraction temperature on the mass removal
for sugar maple woodchips.
Mass Removal, % on wood0 5 10 15 20 25 30
OD
Dis
solv
ed s
olid
s, %
on
woo
d
0
5
10
15
20
25
30T = 145°CT = 160°CT = 175°C
Figure 5. Dissolved solids vs. total mass removal for sugar
maple wood chips autocatalytic extracted with a water to solids ratio of 6:1.
Table 4. Advantages and disadvantages for various separation methods.
System Setup Cost Operating Cost Operating cost to recover valued product stream
Distillation High High Low Chemical Low Medium High Filtration Medium Medium Low
Centrifugation High High Low
7
desirable product stream and chemicals are consumed for the separation to occur. Besides high equipment cost and energy input, centrifugation works only when molecules are at most partially miscible and significantly different in mass. Filtration is simple to implement, medium in cost, and preserves the value of the separated streams. Therefore, filtration systems have been the focus of fractionation efforts with the wood extracts.
Filtration uses a membrane with pores small enough to separate different size particles / molecules. There are five main classes of filtration as shown in Table 5.
The applicable membranes for the wood extracts are RO and NF membranes. The pore size is often given by molecular-weight cut-off instead of pore diameter. Separating acetic acid and sugars requires at least a two-stage membrane operation. Since the molecular weights of six carbon sugars (Hexoses), five carbon sugars (Pentoses) and acetic acid are: 180.16, 150.13 and 60.05; respectively, the two membranes should have molecular-weight cut-offs of about 200 and 130, which are in the NF and RO range. There are membranes available for use, for example, from GE Osmonics® and Koch® Membrane Systems. The first stage with a molecular-weight cut-off of 200 is used to take the high molecular-weight molecules, for example lignin, from the product streams. Lignin has been shown to be detrimental to the fermentation process and has alternative uses as a chemical feedstock or direct energy recovery through burning or gasification. The use of molecular-weight cut-off of 130 is preferred because the membrane will pass the furfurals with the acetic acid. Furfurals are detrimental to the fermentation process, hence elimination of furfurals from sugar stream is highly desired. Furfural and hydroxyl methyl furfural (HMF) have molecular-weights of 96.09 and 110.11; respectively. Acetic acid purification will require additional stages but can then produce an additional furfural product.
Membranes can be mounted several ways in scaled-up industrial systems. The most commonly used are plate and frame, spiral wound, hollow fiber, and tubular. Tubular designs use groups of larger-
diameter tubes which are filled with concentrate, while the permeate is contained in the space in-between the tubes. This system is often used when the fluid has large quantities of suspended solids, eliminating the need for a prefilter and is common in commercial application.
Flux across Membrane and Pressure Drop
Figure 6 shows a schematic of the
membrane separation unit set-up in our pilot plant. The raffinate (or concentrate) and permeate streams are discharged at one end whereas the wood extracts are fed to the membrane unit by a pump at the other end.
The pressure drop (for the permeate stream) across the membrane can be separated into two contributions: the osmotic pressure (π) of the solution (against the solvent or solution across from the membrane) and the friction of the permeate flow across the membrane. Based on the model of Liu et al. [10] for flow through orifices, one can describe the overall pressure drop for flow across the membrane as
⎟⎟⎠
⎞⎜⎜⎝
⎛
++
+=Δ
−− mFmT
mm
m
UkcUkC
UU
k
p
μρ
μρμ
π2/1
22212
21
(1)
Table 5. Classes of filtration [9] Class Pore size, Å Applications
Figure 6. A schematic of the membrane separation unit.
8
where μ and ρ are the viscosity and density of the permeate stream; Um is the flux or superficial velocity of the permeate across the membrane from the feed side to the permeate side; Δpm is the pressure drop across the membrane from the feed side to the permeate side; k is the permeability of the membrane; CT is a constant or the transition parameter for creeping or Darcy flow to inertial or Forchheimer flow; and cF is the Forchheimer constant. The osmotic pressure is a strong function of the solute concentrations and a function of the temperature. When the sugar, acetic acid, and solid concentrations are higher in the feed stream, the osmotic pressure is significantly higher.
Mass balance for the permeate over a differential section of the membrane unit leads to
Pmm dQdAU = (2)
Where Am is the membrane area and QP is the volumetric flow rate of the permeate stream. Um changes with Am because the pressure drop changes along the membrane.
Differentiating equation (1), we obtain
[
mmFmT
mT
m
dUUkcUkC
UkCk
pd
⎥⎥⎦
⎤
+
+
+=Δ
−−
−−3
2/1
222212
22212
)(24
1
μρ
μρμρ
μ
(3)
Noting that Δpm is the pressure difference across the membrane or between the raffinate (or concentrate) and the permeate sides. Energy balance or the Bernouli equation can be applied to estimate the pressure change on either (permeate of raffinate) side of the membrane. For simplicity, we can estimate the pressure drop by linearly relating it to the membrane length along the permeate flow or membrane area,
i.e.,
)( 00 eT
mm pp
AA
pp Δ−Δ−Δ=Δ (4)
where Δp0 and Δpe are the pressure drops across the membrane at the entrance, and at the exit locations, respectively and AT is the total membrane area available for the separation unit.
Substituting equation (4) into equation (3), we have
[
⎥⎥⎦
⎤
+
+
+Δ−Δ
−=
−−
−−3
2/1
222212
222120
)(24
1
mFmT
mT
e
mTm
UkcUkC
UkC
ppdUA
kdA
μρ
μρ
μρ
μ
(5)
which can be substituted into equation (2) to yield
[
mmFmT
mT
me
TP
dUUkcUkC
UkC
Upp
Ak
dQ
⎥⎥⎦
⎤
+
+
+Δ−Δ
−=
−−
−−3
2/1
222212
222120
)(24
1
μρ
μρ
μρ
μ
(6)
Assuming that “back flow” or permeate stream goes back to the retentate or raffinate side where the pressure drop is lower than the osmotic pressure and is negligible, one can integrate equation (6) to obtain the permeate stream output rate as
[
mmFmT
mT
U
Um
e
TP
dUUkcUkC
UkC
Upp
Ak
Qe
⎥⎥⎦
⎤
+
+
+Δ−Δ
=
−−
−−
∫3
2/1
222212
222120
)(24
10
μρ
μρ
μρ
μ
(7)
where U0 and Ue are the “volumetric flux” at the entrance, and the exit ends, respectively, of the membrane unit where the corresponding pressure drops are Δp0 and Δpe. They can be determined separately by equation (1), i.e.
⎟⎟⎠
⎞
+
++=Δ
−− 0
2/1
20
2212
20
00 1(
UkcUkC
U
Uk
p
FT μ
ρμρ
μπ
(8)
Assuming that the osmotic pressure, viscosity and the permeability are constant during the separation process, equation (7) can be reduced to
If the transition from “creeping” or Darcy flow to “inertial” or Forchheimer flow occurs at very low flow Reynolds number or CT ≈ 0, equation (9) is reduced to
⎥⎥⎦
⎤
⎢⎢⎣
⎡ −+
−Δ−Δ
=23
2 220
3302/1
0
eeF
e
TP
UUUUkc
ppA
kQ
μρμ
(10) Therefore, the permeate flow rate increases with increasing initial pressure drop. In most applications, the transition from Darcy’s flow to Forchheimer flow
⎥⎥⎦
⎤
⎟⎟
⎠
⎞⎜⎜⎝
⎛−−
+
⎢⎢⎣
⎡−
++
−+
−+
−Δ−Δ
=
−−−−
−−
−−
−−
μρ
μρ
μρμρ
μρ
μρμρ
ρμ
μρμ
T
e
TFT
eT
eFT
T
FTeFT
eeF
e
TP
CUk
CUk
kcCUkCUkcC
UkCUkcC
kUU
cCUUUU
kcpp
Ak
Q
2/10
2/12213
22212
332/34
20
22120
332/34
2/102
220
3302/1
0
arctanarctan2
4312
(9)
9
is not noticeable within the measurable certainty, Equation (10) can be used without loss of accuracy. In this case, equation (1) is reduced to
⎟⎟⎠
⎞⎜⎜⎝
⎛++=Δ mFmm UkcU
kp
μρμπ
2/11 (11)
Let
μ
ρμ
2/1;1 k
Ac
bkA
aT
F
T== (12)
Equation (11) can be simplified to give ( )TmmTm AbUUaAp ++=Δ 1π (13)
While equation (10) is more accurate in most applications, equation (13) can be directly utilized in some experimental situations where the pressure drop is not varied to a large extent. When pressure drop change is negligible, equation (2) can be approximated by mTp UAQ ≈ (14)
Substituting equation (14) into equation (13), we obtain ( )PP bQaQp ++=Δ 1π (15)
or
b
pab
QP 2
1)0,max(41 −−Δ+=
π (16)
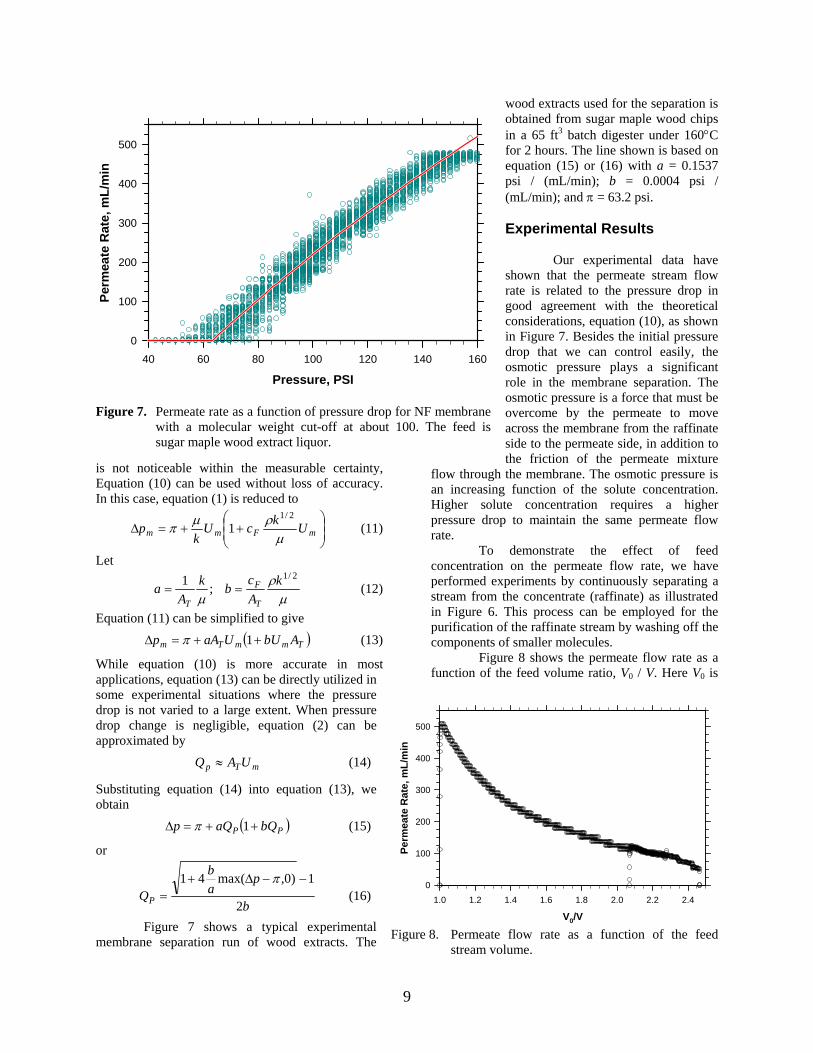
Figure 7 shows a typical experimental membrane separation run of wood extracts. The
wood extracts used for the separation is obtained from sugar maple wood chips in a 65 ft3 batch digester under 160°C for 2 hours. The line shown is based on equation (15) or (16) with a = 0.1537 psi / (mL/min); b = 0.0004 psi / (mL/min); and π = 63.2 psi. Experimental Results
Our experimental data have shown that the permeate stream flow rate is related to the pressure drop in good agreement with the theoretical considerations, equation (10), as shown in Figure 7. Besides the initial pressure drop that we can control easily, the osmotic pressure plays a significant role in the membrane separation. The osmotic pressure is a force that must be overcome by the permeate to move across the membrane from the raffinate side to the permeate side, in addition to the friction of the permeate mixture
flow through the membrane. The osmotic pressure is an increasing function of the solute concentration. Higher solute concentration requires a higher pressure drop to maintain the same permeate flow rate.
To demonstrate the effect of feed concentration on the permeate flow rate, we have performed experiments by continuously separating a stream from the concentrate (raffinate) as illustrated in Figure 6. This process can be employed for the purification of the raffinate stream by washing off the components of smaller molecules.
Figure 8 shows the permeate flow rate as a function of the feed volume ratio, V0 / V. Here V0 is
Pressure, PSI40 60 80 100 120 140 160
Perm
eate
Rat
e, m
L/m
in
0
100
200
300
400
500
Figure 7. Permeate rate as a function of pressure drop for NF membrane
with a molecular weight cut-off at about 100. The feed is sugar maple wood extract liquor.
V0/V1.0 1.2 1.4 1.6 1.8 2.0 2.2 2.4
Perm
eate
Rat
e, m
L/m
in
0
100
200
300
400
500
Figure 8. Permeate flow rate as a function of the feed
stream volume.
10
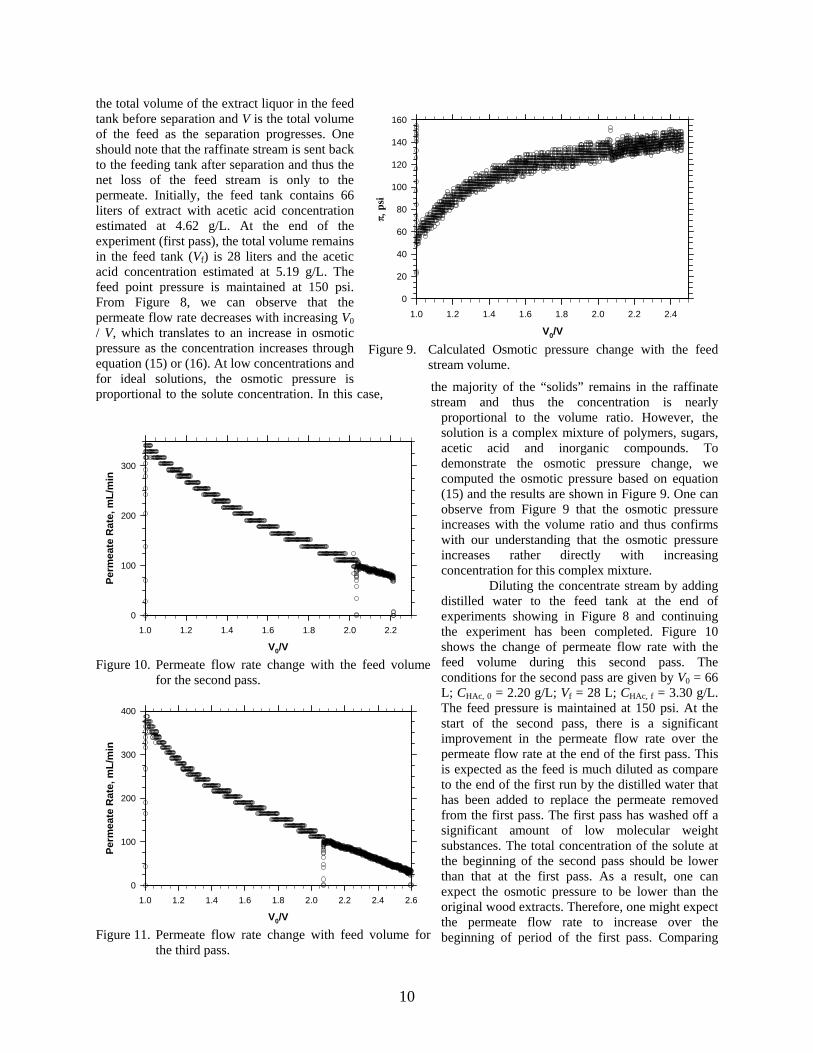
the total volume of the extract liquor in the feed tank before separation and V is the total volume of the feed as the separation progresses. One should note that the raffinate stream is sent back to the feeding tank after separation and thus the net loss of the feed stream is only to the permeate. Initially, the feed tank contains 66 liters of extract with acetic acid concentration estimated at 4.62 g/L. At the end of the experiment (first pass), the total volume remains in the feed tank (Vf) is 28 liters and the acetic acid concentration estimated at 5.19 g/L. The feed point pressure is maintained at 150 psi. From Figure 8, we can observe that the permeate flow rate decreases with increasing V0 / V, which translates to an increase in osmotic pressure as the concentration increases through equation (15) or (16). At low concentrations and for ideal solutions, the osmotic pressure is proportional to the solute concentration. In this case, the majority of the “solids” remains in the raffinate
stream and thus the concentration is nearly proportional to the volume ratio. However, the solution is a complex mixture of polymers, sugars, acetic acid and inorganic compounds. To demonstrate the osmotic pressure change, we computed the osmotic pressure based on equation (15) and the results are shown in Figure 9. One can observe from Figure 9 that the osmotic pressure increases with the volume ratio and thus confirms with our understanding that the osmotic pressure increases rather directly with increasing concentration for this complex mixture.
Diluting the concentrate stream by adding distilled water to the feed tank at the end of experiments showing in Figure 8 and continuing the experiment has been completed. Figure 10 shows the change of permeate flow rate with the feed volume during this second pass. The conditions for the second pass are given by V0 = 66 L; CHAc, 0 = 2.20 g/L; Vf = 28 L; CHAc, f = 3.30 g/L. The feed pressure is maintained at 150 psi. At the start of the second pass, there is a significant improvement in the permeate flow rate over the permeate flow rate at the end of the first pass. This is expected as the feed is much diluted as compare to the end of the first run by the distilled water that has been added to replace the permeate removed from the first pass. The first pass has washed off a significant amount of low molecular weight substances. The total concentration of the solute at the beginning of the second pass should be lower than that at the first pass. As a result, one can expect the osmotic pressure to be lower than the original wood extracts. Therefore, one might expect the permeate flow rate to increase over the beginning of period of the first pass. Comparing
V0/V1.0 1.2 1.4 1.6 1.8 2.0 2.2 2.4
π, p
si
0
20
40
60
80
100
120
140
160
Figure 9. Calculated Osmotic pressure change with the feed
stream volume.
V0/V1.0 1.2 1.4 1.6 1.8 2.0 2.2
Perm
eate
Rat
e, m
L/m
in
0
100
200
300
Figure 10. Permeate flow rate change with the feed volume
for the second pass.
V0/V1.0 1.2 1.4 1.6 1.8 2.0 2.2 2.4 2.6
Perm
eate
Rat
e, m
L/m
in
0
100
200
300
400
Figure 11. Permeate flow rate change with feed volume for
the third pass.
11
Figures 10 and 8, however, one can observe that the permeate flow rate at the beginning of the second pass is significantly lower that that for the first pass. Thus, there is significant fouling of the membrane system by the wood extract.
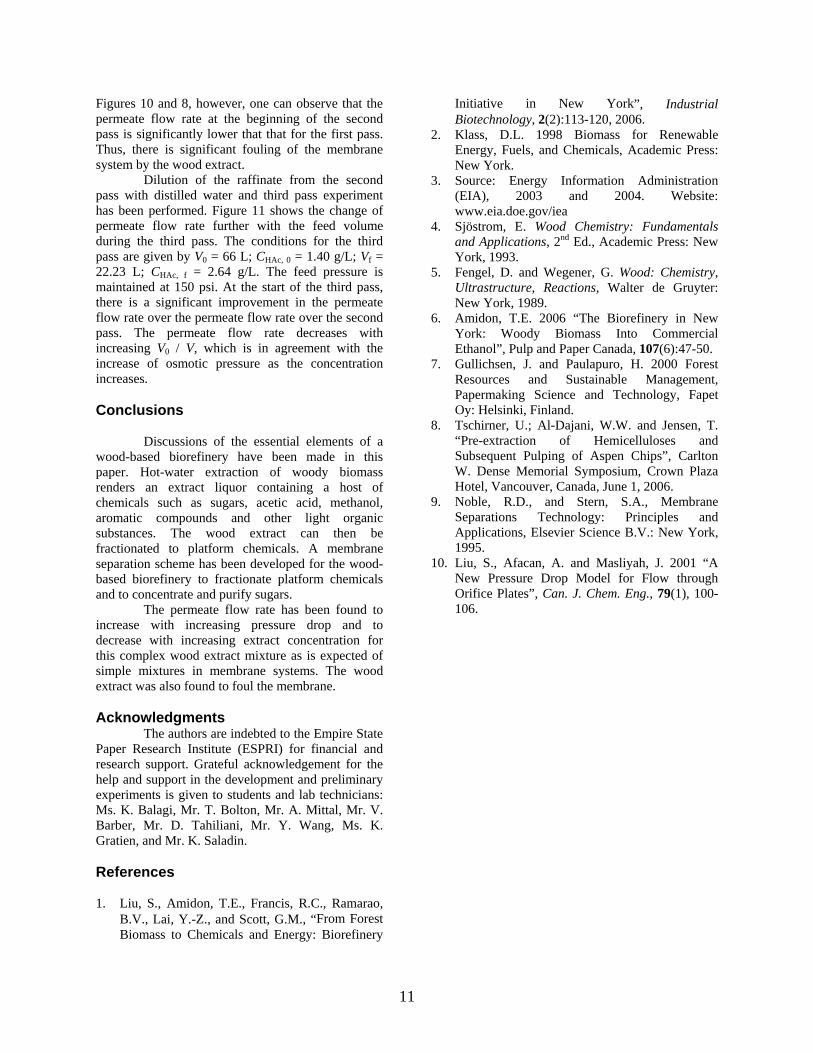
Dilution of the raffinate from the second pass with distilled water and third pass experiment has been performed. Figure 11 shows the change of permeate flow rate further with the feed volume during the third pass. The conditions for the third pass are given by V0 = 66 L; CHAc, 0 = 1.40 g/L; Vf = 22.23 L; CHAc, f = 2.64 g/L. The feed pressure is maintained at 150 psi. At the start of the third pass, there is a significant improvement in the permeate flow rate over the permeate flow rate over the second pass. The permeate flow rate decreases with increasing V0 / V, which is in agreement with the increase of osmotic pressure as the concentration increases. Conclusions
Discussions of the essential elements of a
wood-based biorefinery have been made in this paper. Hot-water extraction of woody biomass renders an extract liquor containing a host of chemicals such as sugars, acetic acid, methanol, aromatic compounds and other light organic substances. The wood extract can then be fractionated to platform chemicals. A membrane separation scheme has been developed for the wood-based biorefinery to fractionate platform chemicals and to concentrate and purify sugars.
The permeate flow rate has been found to increase with increasing pressure drop and to decrease with increasing extract concentration for this complex wood extract mixture as is expected of simple mixtures in membrane systems. The wood extract was also found to foul the membrane.
Acknowledgments
The authors are indebted to the Empire State Paper Research Institute (ESPRI) for financial and research support. Grateful acknowledgement for the help and support in the development and preliminary experiments is given to students and lab technicians: Ms. K. Balagi, Mr. T. Bolton, Mr. A. Mittal, Mr. V. Barber, Mr. D. Tahiliani, Mr. Y. Wang, Ms. K. Gratien, and Mr. K. Saladin. References 1. Liu, S., Amidon, T.E., Francis, R.C., Ramarao,
B.V., Lai, Y.-Z., and Scott, G.M., “From Forest Biomass to Chemicals and Energy: Biorefinery
Initiative in New York”, Industrial Biotechnology, 2(2):113-120, 2006.
2. Klass, D.L. 1998 Biomass for Renewable Energy, Fuels, and Chemicals, Academic Press: New York.
3. Source: Energy Information Administration (EIA), 2003 and 2004. Website: www.eia.doe.gov/iea
4. Sjöstrom, E. Wood Chemistry: Fundamentals and Applications, 2nd Ed., Academic Press: New York, 1993.
5. Fengel, D. and Wegener, G. Wood: Chemistry, Ultrastructure, Reactions, Walter de Gruyter: New York, 1989.
6. Amidon, T.E. 2006 “The Biorefinery in New York: Woody Biomass Into Commercial Ethanol”, Pulp and Paper Canada, 107(6):47-50.
7. Gullichsen, J. and Paulapuro, H. 2000 Forest Resources and Sustainable Management, Papermaking Science and Technology, Fapet Oy: Helsinki, Finland.
8. Tschirner, U.; Al-Dajani, W.W. and Jensen, T. “Pre-extraction of Hemicelluloses and Subsequent Pulping of Aspen Chips”, Carlton W. Dense Memorial Symposium, Crown Plaza Hotel, Vancouver, Canada, June 1, 2006.
9. Noble, R.D., and Stern, S.A., Membrane Separations Technology: Principles and Applications, Elsevier Science B.V.: New York, 1995.
10. Liu, S., Afacan, A. and Masliyah, J. 2001 “A New Pressure Drop Model for Flow through Orifice Plates”, Can. J. Chem. Eng., 79(1), 100-106.