SANDIA REPORT SAND2014-18581 Unlimited Release Printed October 2014 Membrane Separator for Redox Flow Batteries that Utilize Anion Radical Mediators Frank Delnick Prepared by Sandia National Laboratories Albuquerque, New Mexico 87185 and Livermore, California 94550 Sandia National Laboratories is a multi-program laboratory managed and operated by Sandia Corporation, a wholly owned subsidiary of Lockheed Martin Corporation, for the U.S. Department of Energy's National Nuclear Security Administration under contract DE-AC04-94AL85000. Approved for public release; further dissemination unlimited.
Transcript
SANDIA REPORTSAND2014-18581Unlimited ReleasePrinted October 2014
Membrane Separator for Redox Flow Batteries that Utilize Anion Radical Mediators
Frank Delnick
Prepared bySandia National LaboratoriesAlbuquerque, New Mexico 87185 and Livermore, California 94550
Sandia National Laboratories is a multi-program laboratory managed and operated by Sandia Corporation, a wholly owned subsidiary of Lockheed Martin Corporation, for the U.S. Department of Energy's National Nuclear Security Administration under contract DE-AC04-94AL85000.
Approved for public release; further dissemination unlimited.
2
Issued by Sandia National Laboratories, operated for the United States Department of Energy by Sandia Corporation.
NOTICE: This report was prepared as an account of work sponsored by an agency of the United States Government. Neither the United States Government, nor any agency thereof, nor any of their employees, nor any of their contractors, subcontractors, or their employees, make any warranty, express or implied, or assume any legal liability or responsibility for the accuracy, completeness, or usefulness of any information, apparatus, product, or process disclosed, or represent that its use would not infringe privately owned rights. Reference herein to any specific commercial product, process, or service by trade name, trademark, manufacturer, or otherwise, does not necessarily constitute or imply its endorsement, recommendation, or favoring by the United States Government, any agency thereof, or any of their contractors or subcontractors. The views and opinions expressed herein do not necessarily state or reflect those of the United States Government, any agency thereof, or any of their contractors.
Printed in the United States of America. This report has been reproduced directly from the best available copy.
Available to DOE and DOE contractors fromU.S. Department of EnergyOffice of Scientific and Technical InformationP.O. Box 62Oak Ridge, TN 37831
Membrane Separator for Redox Flow Batteries that Utilize Anion Radical Mediators
Frank DelnickPower Sources Technology Group
Sandia National LaboratoriesP.O. Box 5800
Albuquerque, New Mexico 87185-MS0613
Abstract
A Na+ ion conducting polyethylene oxide membrane is developed for an organic electrolyte redox flow battery that utilizes anion radical mediators. To achieve high specific ionic conductivity, tetraethyleneglycol dimethylether (TEGDME) is used as a plasticizer to reduce crystallinity and increase the free volume of the gel film. This membrane is physically and chemically stable in TEGDME electrolyte that contains highly reactive biphenyl anion radical mediators.
4
ACKNOWLEDGMENTS
We would also like to acknowledge the DOE Office of Electricity and specifically Dr. Imre Gyuk, Manager of the Electrical Energy Storage Program for support of the Energy Storage Program.
Appendix 1: Arrhenius Plots for Polymer Gel Films in Table 1 ...................................................19
Distribution ....................................................................................................................................25
FIGURES
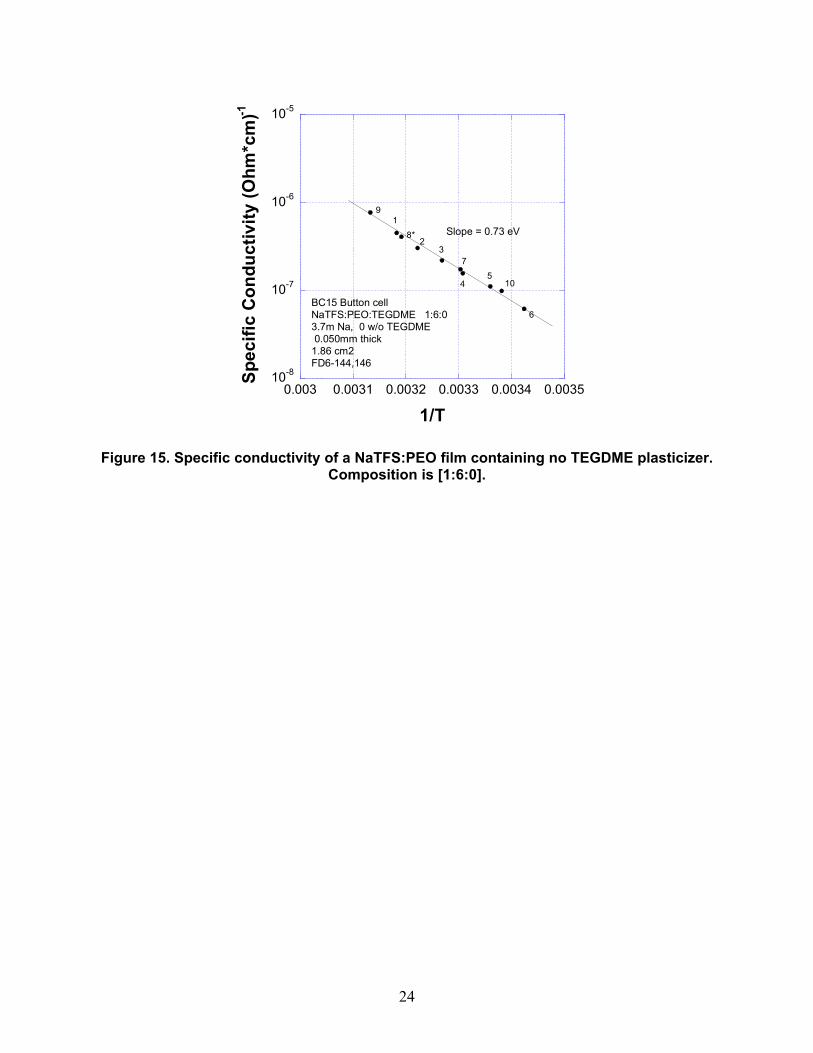
Figure 1. Complex impedance of a polymer gel film with composition [na:peo:tegdme] = [1:4:1]. Frequency range 600kHz – 3kHz. Temperature for each measurement is shown in the graph. Film contains 39 w/o TEGDME plasticizer. .................................................................................11Figure 2. Complex impedance of a polymer gel film with composition [na:peo;tegdme] = [1:6:1]. Frequency range 600kHz – 1.5kHz. Temperature for each measurement is shown in the graph. Film contains 34 w/o TEGDME plasticizer. .................................................................................12Figure 3. Complex impedance of a polymer gel film with composition [na:peo:tegdme] = [1:8:1]. Frequency range 600kHz – 150 Hz. Temperature for each measurement is shown in the graph. Film contains 30 w/o TEGDME plasticizer. .................................................................................12Figure 4. Specific conductivity at 45 °C of polymer gel films as a function of TEGDME content........................................................................................................................................................13Figure 5. Complex impedance of redox flow cells DC2 and DC4. Sep = Celgard™ 2500 separator, C = 10AA porous carbon disc electrode. PEO = Polyethylene oxide membrane composition [1.3:4:1.6] with 10 w/o Al2O3. ..................................................................................14Figure 6. Specific conductivity of NaTFS:PEO:TEGDME films having composition [1:8:1].....19Figure 7. Specific conductivity of NaTFS:PEO:TEGDME films having composition [1:8:2].....20Figure 8. Specific conductivity of NaTFS:PEO:TEGDME films having composition [1:8:4].....20Figure 9. Specific conductivity of NaTFS:PEO:TEGDME films having composition [1:6:1].....21Figure 10. Specific conductivity of NaTFS:PEO:TEGDME films having composition [1:6:2]...21Figure 11. Specific conductivity of NaTFS:PEO:TEGDME films having composition [1:6:4]...22Figure 12. Specific conductivity of NaTFS:PEO:TEGDME films having composition [1:4:1]...22Figure 13. Specific conductivity of NaTFS:PEO:TEGDME films having composition [1:4:2]...23Figure 14. Specific conductivity of NaTFS:PEO:TEGDME films having composition [1:4:4]...23Figure 15. Specific conductivity of a NaTFS:PEO film containing no TEGDME plasticizer. Composition is [1:6:0]. ..................................................................................................................24
TABLES
Table 1. Samples for Complex Impedance Analysis.....................................................................13
6
NOMENCLATURE
β Biphenylβ- Biphenyl radical anionDOE Department of EnergyESR Effective Series ResistancePEO Polyethylene OxidePTFE Polytetrafluoroethylene, Teflon™SNL Sandia National LaboratoriesTEGDME Tetraethyleneglycol DimethyletherTFS Trifluoromethane Sulfonate, Triflate
7
1. BACKGROUND
Conventional redox flow batteries store energy in soluble redox couples at the anode and cathode respectively. Since both anode and cathode are soluble they must be separated by an ionic conductive membrane which selectively permits the conduction of a counter ion (typically H+
for
aqueous systems) while preventing the intermixing of the anode and cathode redox couples. Nafion™, for example, has been used as the membrane separator in the all vanadium redox flow battery.
The operating voltage and corresponding energy density of the redox flow battery can be improved by using organic/organometallic redox couples in organic solvents with large voltage windows compared to water. However, in this case, considerable solvent is still required to solubilize the organic/organometallic redox couples.
The energy density of the redox flow battery can be further improved by using the redox couples, not to store energy, but to mediate follow-on redox reactions on the surface of solid, high capacity electrode materials located in flow reactor reservoirs. For this modification, two redox couples are required at the anode and cathode respectively. One redox couple controls the charge reaction and the second redox couple controls the discharge at each electrode respectively. The high energy density is achieved because each redox couple can be turned-over in the cell stack and recycled through the flow reactor hundreds of times for each charge and discharge respectively. Therefore, large volumes of solvent are not required to solubilize large quantities of redox couples, instead, small volumes are recycled many times, and the energy density of the redox flow battery approaches the energy density of the high capacity electrode materials located in the flow reactor reservoirs not the energy density of dilute solutions of electroactive redox couples which define the energy density of conventional redox flow batteries.
Membrane separators are required for the organic solvent mediated redox flow battery to prevent the intermixing of the redox mediators in the electrochemical stack. However, these membrane separators must be more stable than membranes that are used in aqueous systems because the voltage drop across the membrane is significantly larger and the organic electrolytes are typically more aggressive against conventional polymers used for aqueous membranes.
This report describes the development of a membrane separator for a mediated organic redox flow battery which utilizes the solvent tetraethyleneglycol dimethylether (TEGDME). This solvent is stable against reduction at about the Na/Na+ redox potential (Na/Na+ redox potential = +0.132 V vs Li/Li+ redox potential) and enables the use of very negative redox mediators and very negative anodes in the flow reactor. The voltage window for TEGDME is also greater than 4 volts. This enables the use of very positive cathodes and corresponding cathode redox mediators.
To fully utilize this large voltage window, radical anions will be used as the redox mediators at the anode because they are reversibly oxidized and reduced at very negative potentials and they are stable in TEGDME. However, these radicals are highly reactive with most other solvents and polymeric material by deprotonation and/or dearomatization (Birch reaction). They also react readily with fluorinated polymers such as PTFE and Nafion™. This report will focus on the
8
development of membrane separators that are stable against the biphenyl radical anion. Biphenyl yields the most negative potential of all polyaromatic hydrocarbons upon reduction to the radical anion (biphenyl radical anion = β-). Its redox potential in TEGDME is β-/β = +0.06 V vs Na/Na+ when reduced at 0.1m concentration with Na+ counterions. This report will not directly address stability against oxidation by cathode redox mediators.
Since β- is stable in TEGDME, it follows that it should be stable against the polymer polyethylene oxide (PEO) which is comprised of the same ethylene oxide repeat units.
TEGDME = H3C(OCH2CH2)4OCH3
PEO = (OCH2CH2)n
Therefore, this report describes the development of a membrane separator based on PEO.
9
2. EXPERIMENTAL
PEO (Sigma-Aldrich, average molecular weight 600,000) was dissolved in acetonitrile (AN) to make a 5 w/o PEO solution. This solution was maintained over 4A molecular sieves for several days before use. Sodium triflate (NaTFS) was dissolved in AN to make a 4 w/o NaTFS solution. This solution was also stored over 4A molecular sieves. These stock solutions were blended together with TEGDME (also stored over 4A molecular sieves) to make solutions of varying compositions which, upon casting onto glass or stainless steel substrates yielded polymeric films after evaporation of the AN solvent. The molar composition of the resulting polymeric film is designated [na:peo:tegdme], where na represents the number of moles of Na , peo represents the number of moles of oxygen (in PEO), and tegdme represents the number of moles of TEGDME. For example, a film with composition [1:8:2] contains eight moles of oxygen (in PEO) for every mole of Na, and 2 moles of TEGDME for every mole of Na. This film is comprised of 17.6 w/o NaTFS, 36.4 w/o PEO and 46.0 w/o TEGDME. If we assume that the PEO and TEGDME form a uniform solid (gel) electrolyte, and if we assume that the NaTFS is dissolved in that electrolyte, then the Na+ concentration is 1.25 m (m = molal) in the dry film.
To measure the specific ionic conductivity of each film, the corresponding acetonitrile solution was pipetted into a stainless steel CR2032 button cell can and evaporated to dryness in the glove box, the can was then held at 40 °C on a hot plate in the glove box for about three hours, then held under vacuum at ambient temperature over-night. This procedure yielded a film 2 ± 0.5 mils thick in the bottom of the can. On the following day the button cell was assembled in the glove box using two 20 mil thick stainless steel spacers and a wave spring. This yielded a conductivity cell with two stainless steel blocking electrodes.
Before impedance measurements were made, each button cell was thermally cycled from room temperature to 50 °C three times to anneal stresses in the film and at the stainless steel/film interfaces. Attempts to measure the impedance before thermal cycling yielded very irreproducible results. For samples that exhibited large trans-granular impedances (see discussion below), the conductivity measurements drifted (decreased) slowly with time especially at low temperatures. This is probably caused by the slow formation and growth of crystalline domains in the film. This usually occurred when the sample was cooled from high temperatures where the impedance showed homogeneous conduction. This drift could last several days. Therefore, the impedance measurements were made about one hour after thermal equilibration. When slow crystallization was suspected, the sample was maintained at temperature overnight (~16 hrs) before measurement (or re-measurement). These measurements are indicated with a (*) in the Arrhenius plots in Appendix 1. For example, if the 8th measurement in a series of 20 measurements was made after 16 (or more) hours of thermal equilibration, then it is designated as 8* and the other measurements in the series were equilibrated for about one hour each.
To test the PEO films in a redox flow cell, larger (~ 5 cm x 5 cm) films were cast onto glass plates and air dried in a laboratory fume hood. After dryness, the film was heated on a hot plate at 40 °C for about three hours. A 1.5 in. diameter circle was cut into the film, and the disc was peeled off of the glass substrate and stored under vacuum until assembly in the redox flow cell. These films were also 2 ± 0.5 mils thick. The redox flow cell consisted of stainless steel plates
10
with machined flow fields behind 7.9 cm2, 10AA carbon paper disc electrodes (SGL Technologies GmbH). The design assured compression of the electrodes against the membrane separator using a “zero gap” configuration1,2,3. Sometimes, the cell compression forced some carbon fibers in the 10AA electrodes to penetrate the membrane and short circuit the cell. When this occurred, a Celgard™ 2500 separator was placed on one side or both sides of the membrane separator to prevent short circuits. In some cases 10 w/o Al2O3 powder was added to the polymer film to make it more ridged.
11
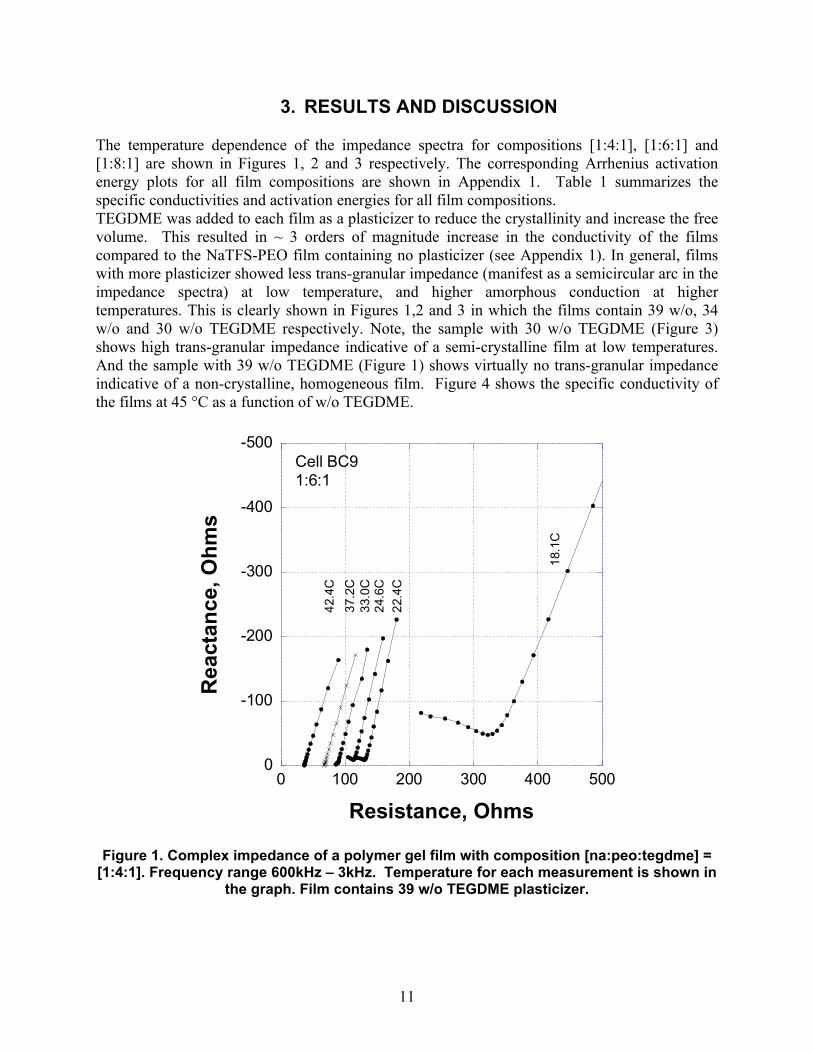
3. RESULTS AND DISCUSSION
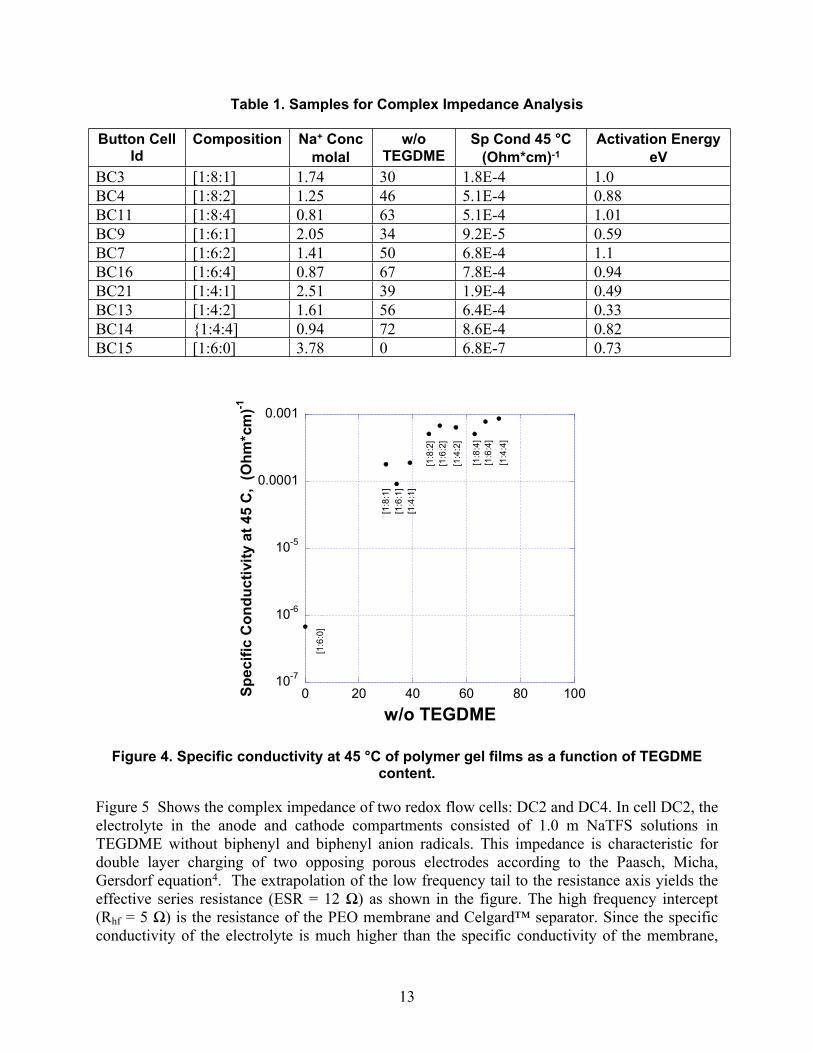
The temperature dependence of the impedance spectra for compositions [1:4:1], [1:6:1] and [1:8:1] are shown in Figures 1, 2 and 3 respectively. The corresponding Arrhenius activation energy plots for all film compositions are shown in Appendix 1. Table 1 summarizes the specific conductivities and activation energies for all film compositions. TEGDME was added to each film as a plasticizer to reduce the crystallinity and increase the free volume. This resulted in ~ 3 orders of magnitude increase in the conductivity of the films compared to the NaTFS-PEO film containing no plasticizer (see Appendix 1). In general, films with more plasticizer showed less trans-granular impedance (manifest as a semicircular arc in the impedance spectra) at low temperature, and higher amorphous conduction at higher temperatures. This is clearly shown in Figures 1,2 and 3 in which the films contain 39 w/o, 34 w/o and 30 w/o TEGDME respectively. Note, the sample with 30 w/o TEGDME (Figure 3) shows high trans-granular impedance indicative of a semi-crystalline film at low temperatures. And the sample with 39 w/o TEGDME (Figure 1) shows virtually no trans-granular impedance indicative of a non-crystalline, homogeneous film. Figure 4 shows the specific conductivity of the films at 45 °C as a function of w/o TEGDME.
-500
-400
-300
-200
-100
00 100 200 300 400 500
Rea
ctan
ce, O
hms
Resistance, Ohms
Cell BC91:6:1
42.4
C37
.2C
33.0
C24
.6C
22.4
C
18.1
C
Figure 1. Complex impedance of a polymer gel film with composition [na:peo:tegdme] = [1:4:1]. Frequency range 600kHz – 3kHz. Temperature for each measurement is shown in
the graph. Film contains 39 w/o TEGDME plasticizer.
12
-100
-80
-60
-40
-20
00 20 40 60 80 100
Rea
ctan
ce, O
hms
Resistance, Ohms
Cell BC211:4:1
46.1
C40
.1C 33
.0C
28.9
C
22.4
C 18.5
C
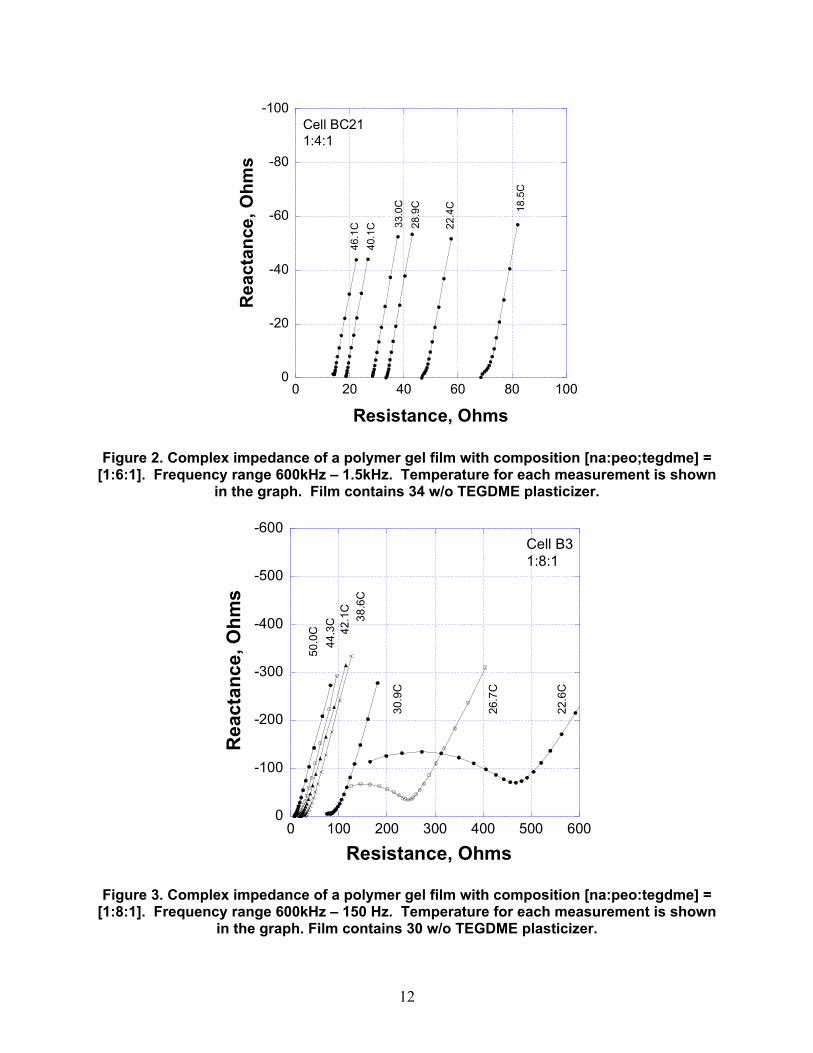
Figure 2. Complex impedance of a polymer gel film with composition [na:peo;tegdme] = [1:6:1]. Frequency range 600kHz – 1.5kHz. Temperature for each measurement is shown
in the graph. Film contains 34 w/o TEGDME plasticizer.
-600
-500
-400
-300
-200
-100
00 100 200 300 400 500 600
Rea
ctan
ce, O
hms
Resistance, Ohms
50.0
C44
.3C
42.1
C38
.6C
30.9
C
26.7
C
22.6
CCell B31:8:1
Figure 3. Complex impedance of a polymer gel film with composition [na:peo:tegdme] = [1:8:1]. Frequency range 600kHz – 150 Hz. Temperature for each measurement is shown
in the graph. Film contains 30 w/o TEGDME plasticizer.
Figure 4. Specific conductivity at 45 °C of polymer gel films as a function of TEGDME content.
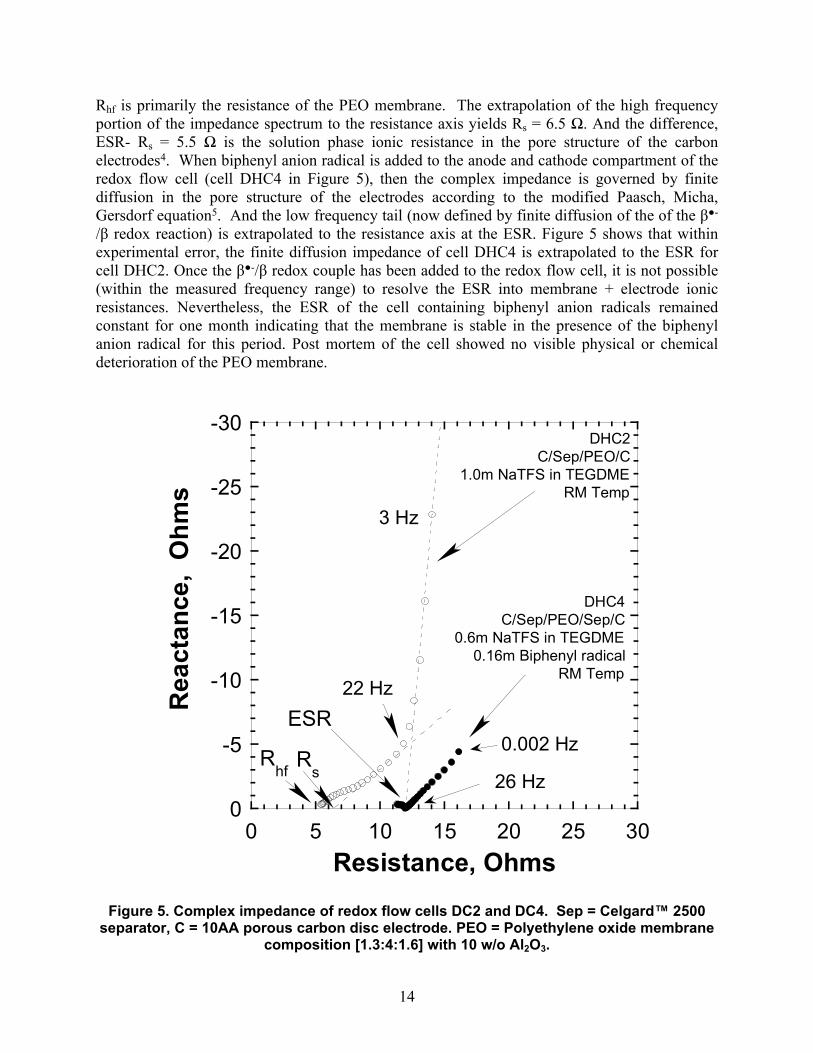
Figure 5 Shows the complex impedance of two redox flow cells: DC2 and DC4. In cell DC2, the electrolyte in the anode and cathode compartments consisted of 1.0 m NaTFS solutions in TEGDME without biphenyl and biphenyl anion radicals. This impedance is characteristic for double layer charging of two opposing porous electrodes according to the Paasch, Micha, Gersdorf equation4. The extrapolation of the low frequency tail to the resistance axis yields the effective series resistance (ESR = 12 Ω) as shown in the figure. The high frequency intercept (Rhf = 5 Ω) is the resistance of the PEO membrane and Celgard™ separator. Since the specific conductivity of the electrolyte is much higher than the specific conductivity of the membrane,
14
Rhf is primarily the resistance of the PEO membrane. The extrapolation of the high frequency portion of the impedance spectrum to the resistance axis yields Rs = 6.5 Ω. And the difference, ESR- Rs = 5.5 Ω is the solution phase ionic resistance in the pore structure of the carbon electrodes4. When biphenyl anion radical is added to the anode and cathode compartment of the redox flow cell (cell DHC4 in Figure 5), then the complex impedance is governed by finite diffusion in the pore structure of the electrodes according to the modified Paasch, Micha, Gersdorf equation5. And the low frequency tail (now defined by finite diffusion of the of the β-
/β redox reaction) is extrapolated to the resistance axis at the ESR. Figure 5 shows that within experimental error, the finite diffusion impedance of cell DHC4 is extrapolated to the ESR for cell DHC2. Once the β-/β redox couple has been added to the redox flow cell, it is not possible (within the measured frequency range) to resolve the ESR into membrane + electrode ionic resistances. Nevertheless, the ESR of the cell containing biphenyl anion radicals remained constant for one month indicating that the membrane is stable in the presence of the biphenyl anion radical for this period. Post mortem of the cell showed no visible physical or chemical deterioration of the PEO membrane.
-30
-25
-20
-15
-10
-5
00 5 10 15 20 25 30
Rea
ctan
ce,
Ohm
s
Resistance, Ohms
3 Hz
22 Hz
0.002 Hz
26 Hz
DHC2C/Sep/PEO/C
1.0m NaTFS in TEGDMERM Temp
DHC4C/Sep/PEO/Sep/C
0.6m NaTFS in TEGDME0.16m Biphenyl radical
RM Temp
ESR
Rhf R
s
Figure 5. Complex impedance of redox flow cells DC2 and DC4. Sep = Celgard™ 2500 separator, C = 10AA porous carbon disc electrode. PEO = Polyethylene oxide membrane
composition [1.3:4:1.6] with 10 w/o Al2O3.
15
Under these circumstances, the TEGDME plasticized PEO films serve as stable membrane separators for anion radical mediated redox flow batteries which utilize TEGDME electrolytes. The area specific resistance of the membrane at room temperature is ~ 40 Ohm*cm2. This is 4X to 6X higher than the typical separators in commercial lithium batteries. Further optimization is required.
16
17
5. REFERENCES
1. Mench, Journal of Power Sources, 206 (2012) p450
2. Q. Liu, G. Grim, A. Papandrew, A. Turhan, T. Zawodzinski and M. Mench, J. Electrochem. Soc., 159(8) (2012) A1246
3. U.S. 14/075,390 Patent Application
4. G. Paasch, K. Micha and P. Gersdorf, Electrochim. Acta, 38 (1993) p2653
5. C-N Sun, F. Delnick, D. Aaron, A. Papandrew, M. Mench and T. Zawodzinski, J. Electrochem. Soc., 161(6) (2014) A988
18
19
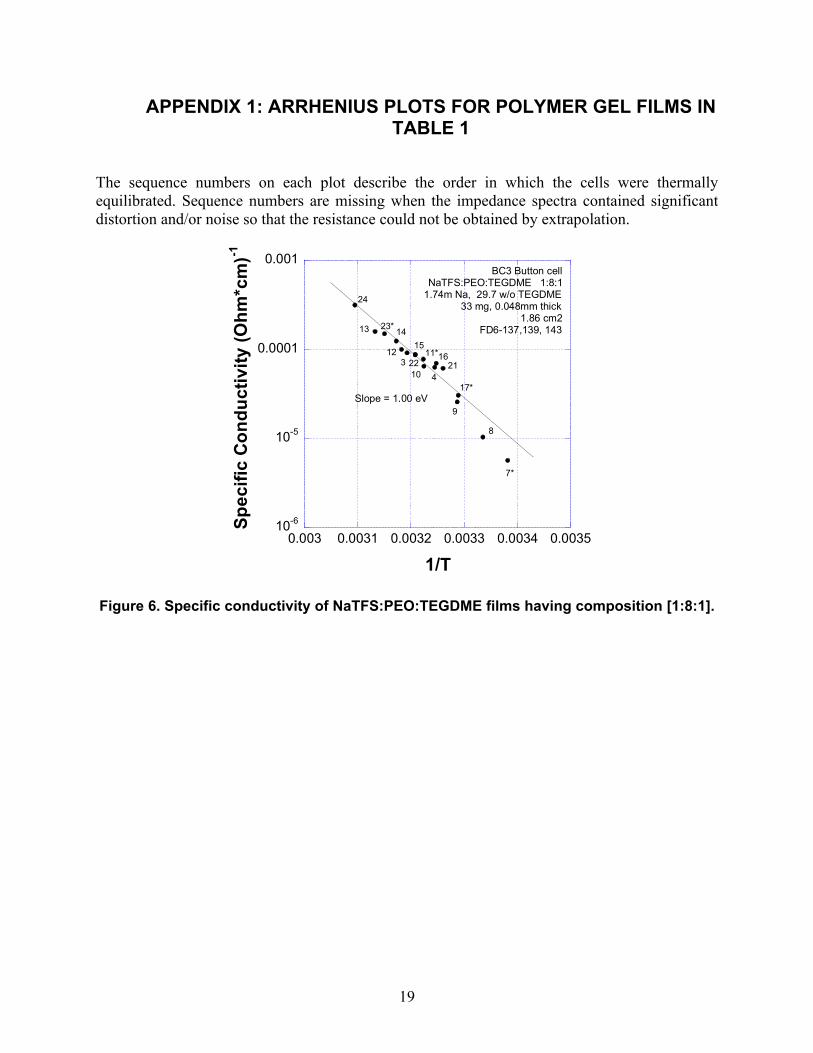
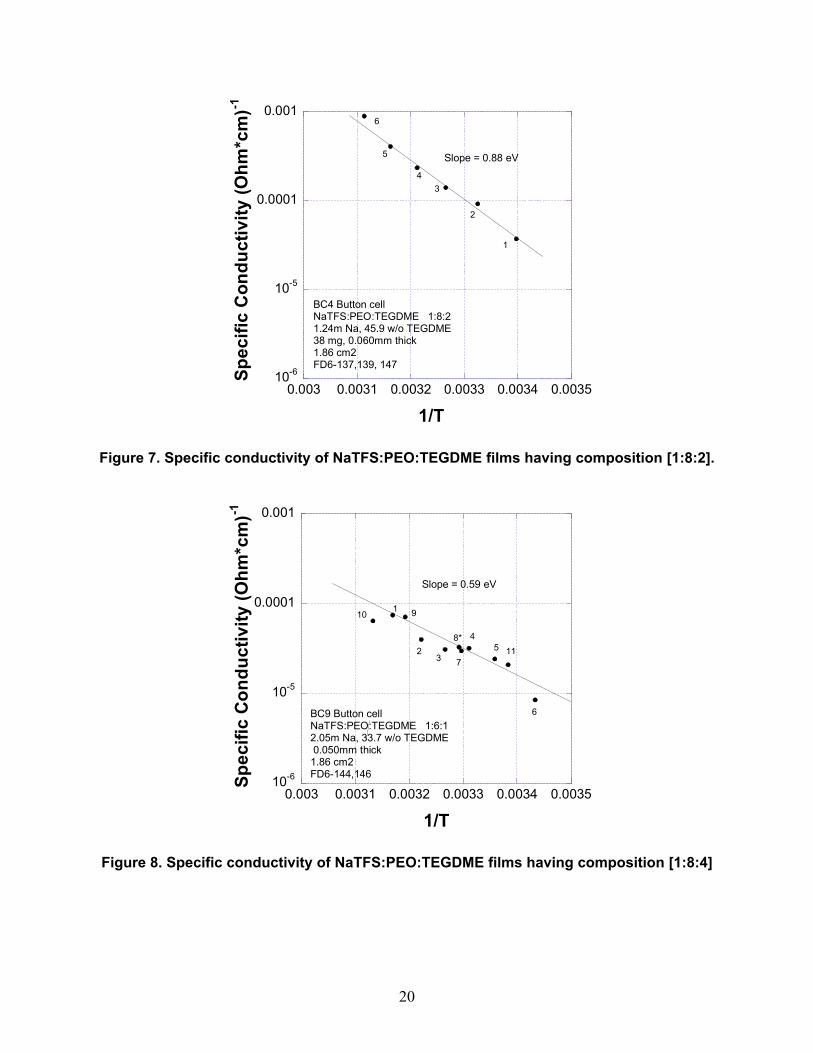
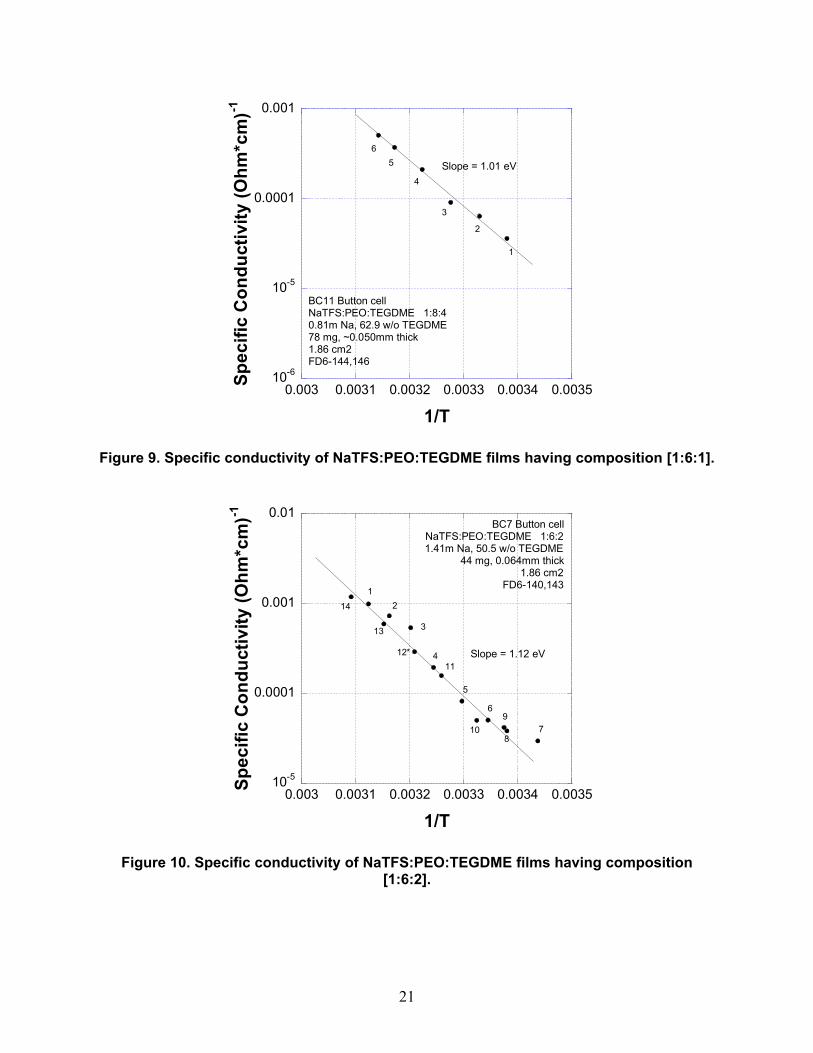
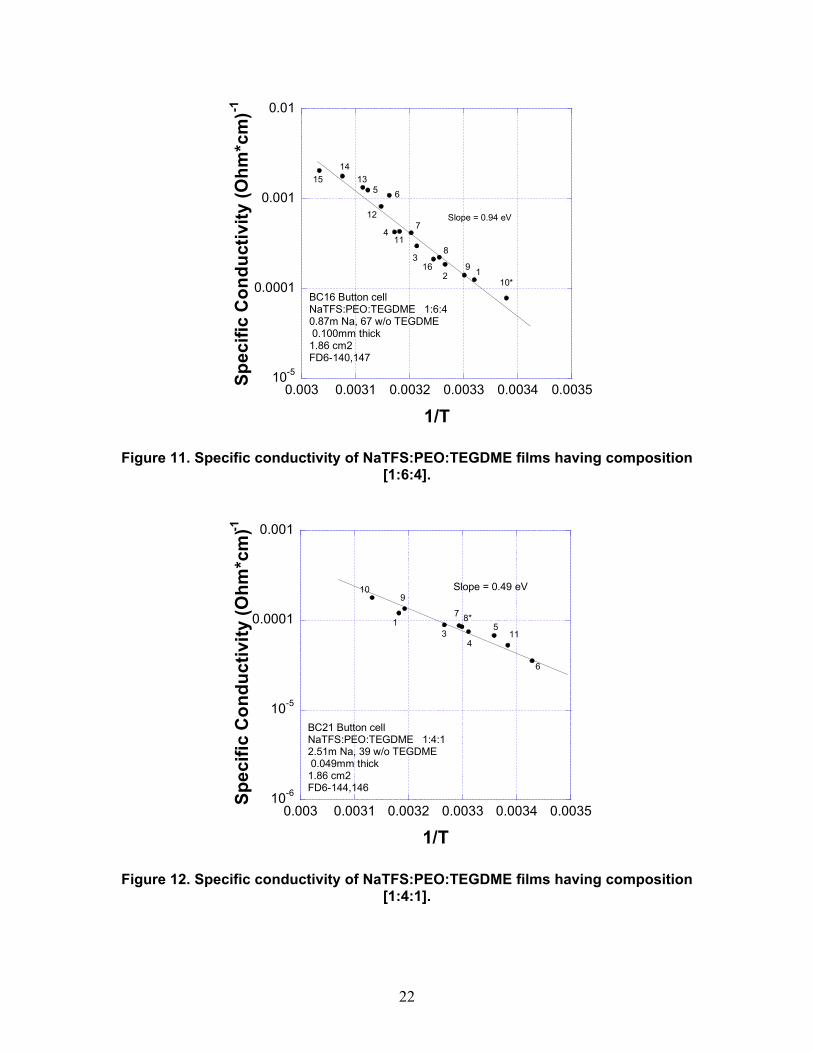
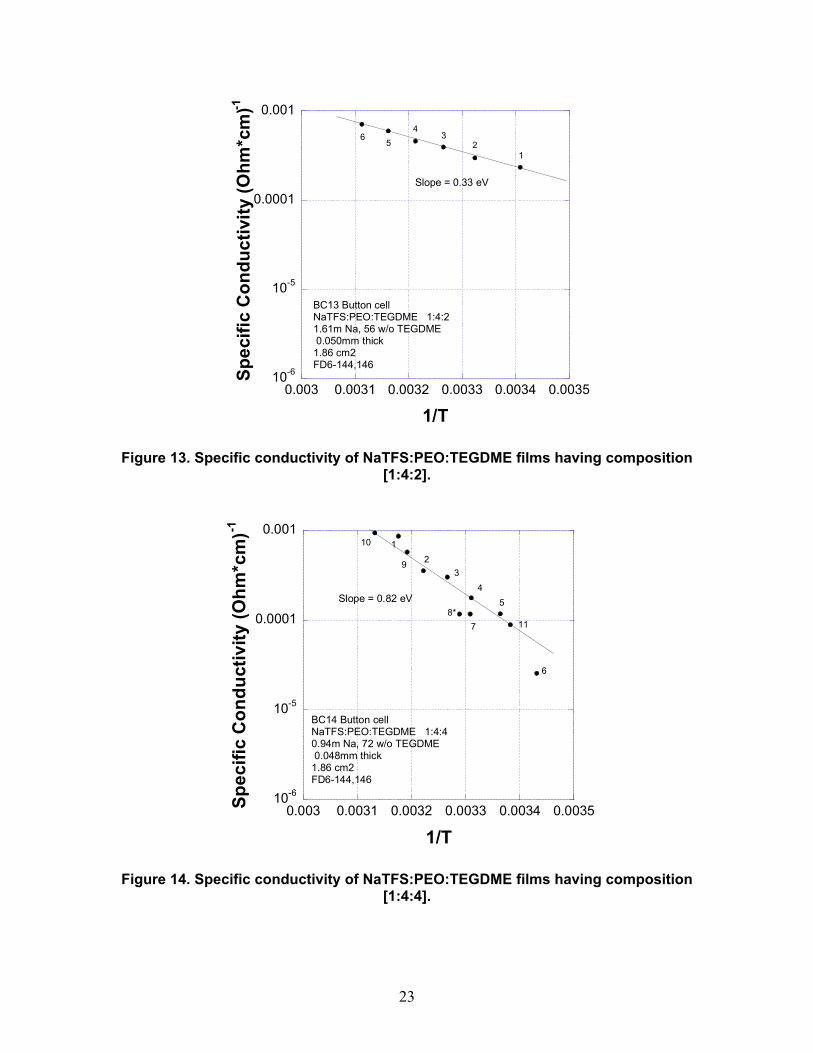
APPENDIX 1: ARRHENIUS PLOTS FOR POLYMER GEL FILMS IN TABLE 1
The sequence numbers on each plot describe the order in which the cells were thermally equilibrated. Sequence numbers are missing when the impedance spectra contained significant distortion and/or noise so that the resistance could not be obtained by extrapolation.
10-6
10-5
0.0001
0.001
0.003 0.0031 0.0032 0.0033 0.0034 0.0035
Spec
ific
Con
duct
ivity
(Ohm
*cm
)-1
1/T
3
4
7*
8
9
10
11*12
13 1415
16
17*
2122
24
23*
BC3 Button cellNaTFS:PEO:TEGDME 1:8:1
1.74m Na, 29.7 w/o TEGDME33 mg, 0.048mm thick
1.86 cm2FD6-137,139, 143
Slope = 1.00 eV
Figure 6. Specific conductivity of NaTFS:PEO:TEGDME films having composition [1:8:1].