MEMBRANE TECHNOLOGIES By Peter S. Cartwright, PE CWQA PROFESIONAL DEVELOPMENT SEMINAR May 4, 2007 United States Office European office 8324 16 th Avenue South President Kennedylaan 94 Minneapolis, MN 55425-1742 2343 GT Oegstgeest Phone: (952) 854-4911 The Netherlands Fax: (952) 854-6964 Phone: 31-71-5154417 [email protected]Fax: 31-71-5156636 www.cartwright-consulting.com Cartwright Consulting Co.
Transcript
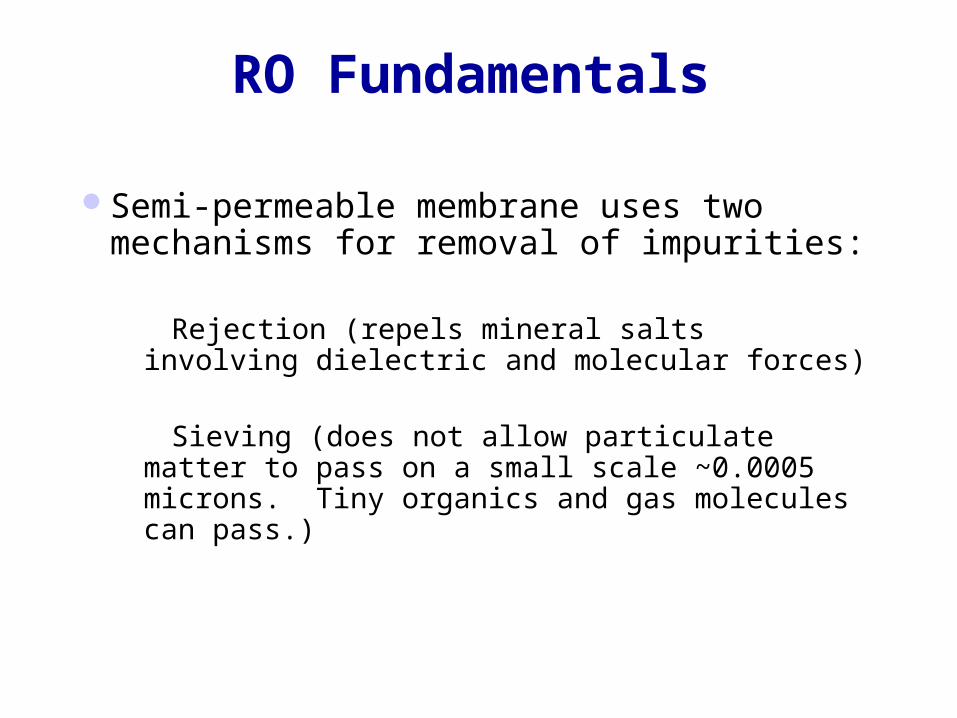
MEMBRANE TECHNOLOGIES
By
Peter S. Cartwright, PE
CWQA PROFESIONAL DEVELOPMENT SEMINAR
May 4, 2007
United States Office European office8324 16th Avenue South President Kennedylaan 94Minneapolis, MN 55425-1742 2343 GT OegstgeestPhone: (952) 854-4911 The NetherlandsFax: (952) 854-6964 Phone: [email protected] Fax: 31-71-5156636www.cartwright-consulting.com
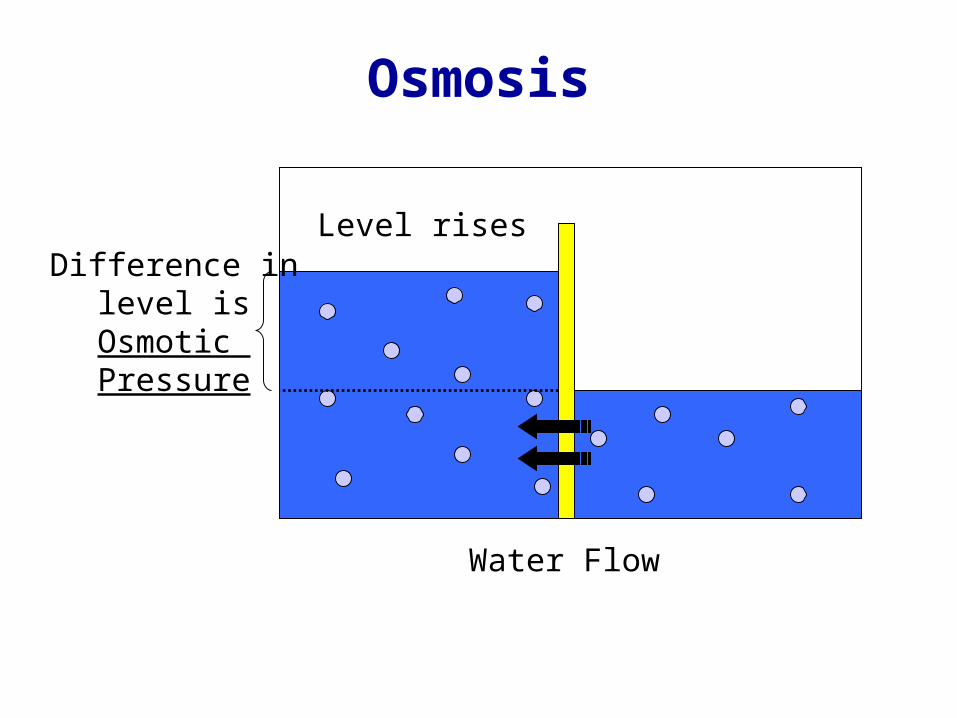
Osmotic Pressure Effects None Slight Moderate High
Concentration Capabilities High High Moderate Moderate
Permeate Purity High High Moderate-high High
Energy Usage Low Low Low-moderate Moderate
Membrane Stability High High Moderate Moderate
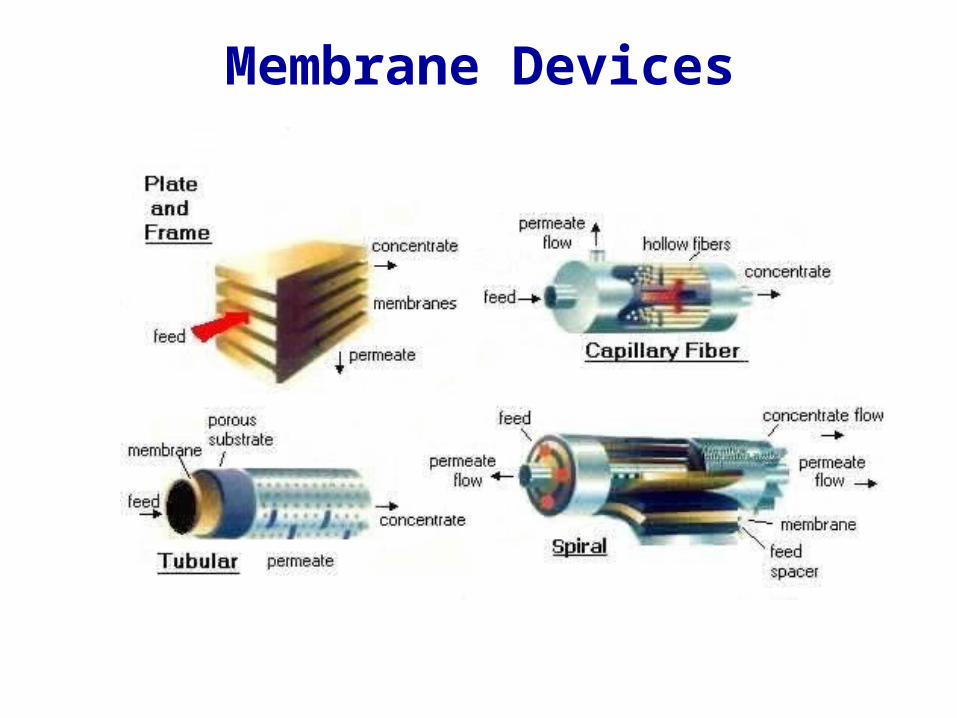
Membrane Devices
Plate & Frame
Capillary (Hollow) Fiber
Hollow Fiber UF
Tubular
Tubular Membrane Elements
Spiral Wound
Membrane Element Configuration Comparison
Element Configura-
tion
Packing Density *
Fouling Resistance
**
Capillary Fiber
Medium High
Plate and Frame
Low High
Spiral Wound Medium Moderate
Tubular Low high
* Membrane area per unit volume of element ** Tolerance to suspended solids
Pump
Permeate
Concentrate
Feed
Membrane Schematic
Concentration Effects
x
Concentration Factor vs. Percent Recovery
POU RO Performance Equations
Production Rate: The rate at which product water is made directly from the RO membrane. It is customarily expressed at Standard Operating Conditions (50-60 psi for POU at 77oF) by applying the appropriate conversion factors.
Conversion Factor: ml/min x 0.38 = gal/day
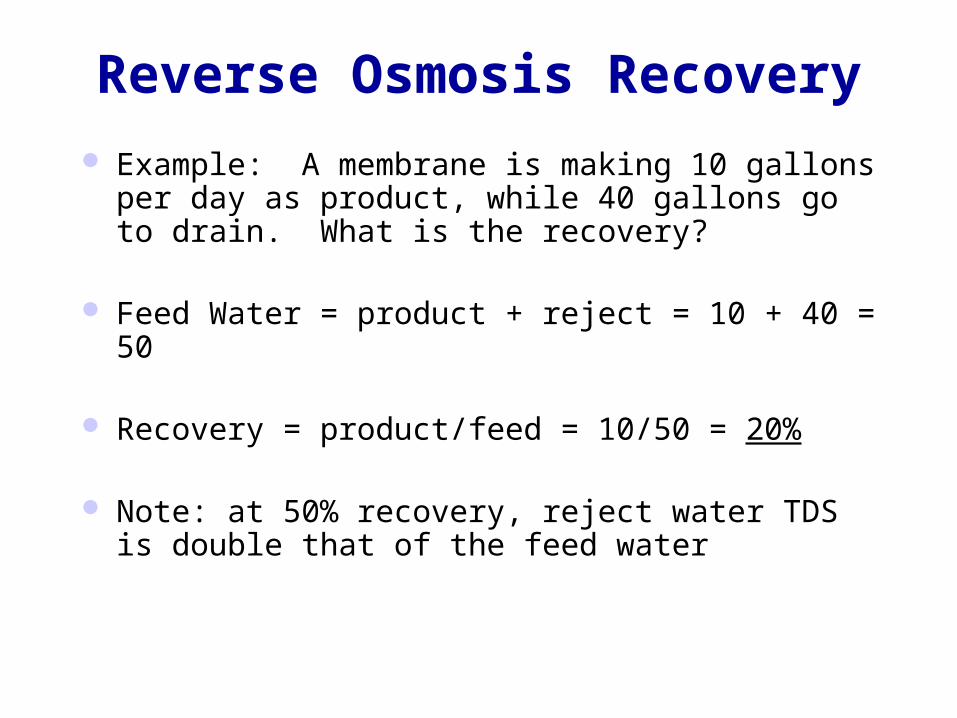
Reverse Osmosis Recovery
Recovery: the percentage of feed water that passes through the membrane as product water. (i.e. how efficiently water is being used to make product water)
Reverse Osmosis Recovery
Example: A membrane is making 10 gallons per day as product, while 40 gallons go to drain. What is the recovery?
Feed Water = product + reject = 10 + 40 = 50
Recovery = product/feed = 10/50 = 20%
Note: at 50% recovery, reject water TDS is double that of the feed water
Generic POU RO System Flow Diagram
Generic Undersink RO Installation
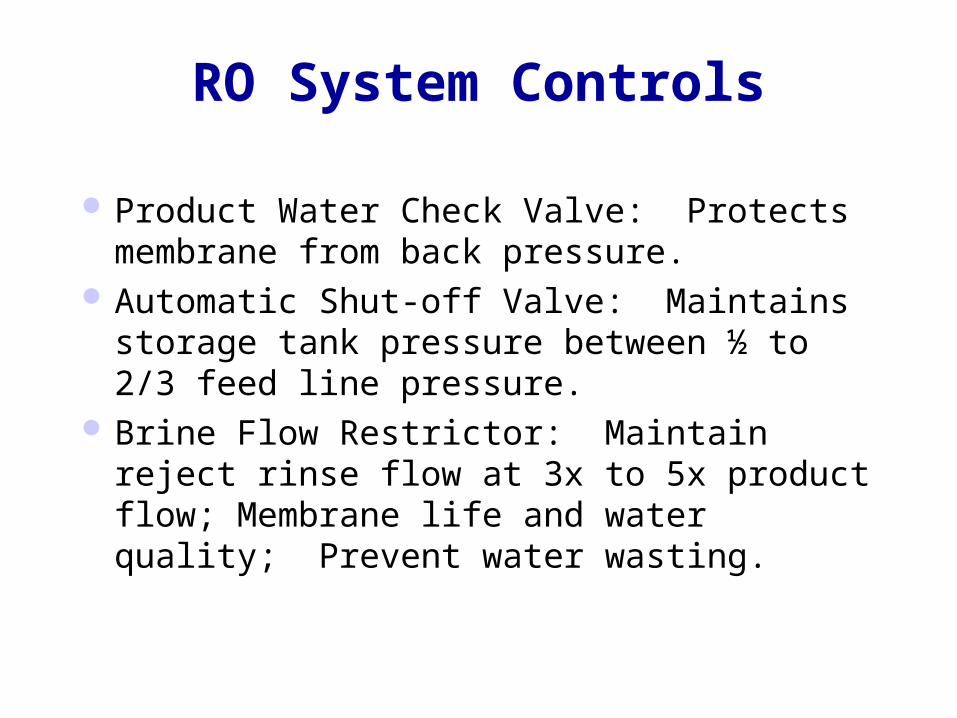
RO System Controls
Product Water Check Valve: Protects membrane from back pressure.
Automatic Shut-off Valve: Maintains storage tank pressure between ½ to 2/3 feed line pressure.
Brine Flow Restrictor: Maintain reject rinse flow at 3x to 5x product flow; Membrane life and water quality; Prevent water wasting.