57
MemJet Membrane Bioreactor Technology USFilter, Jet Tech Products

MemJetMembrane Bioreactor
Technology
USFilter, Jet Tech Products

Presentation Outline
Membrane Filtration BasicsMBR EvolutionValue of MBR TechnologyUSFilter MBR designPilot CapabilitiesDemonstration Plant

Membrane Filtration Basics
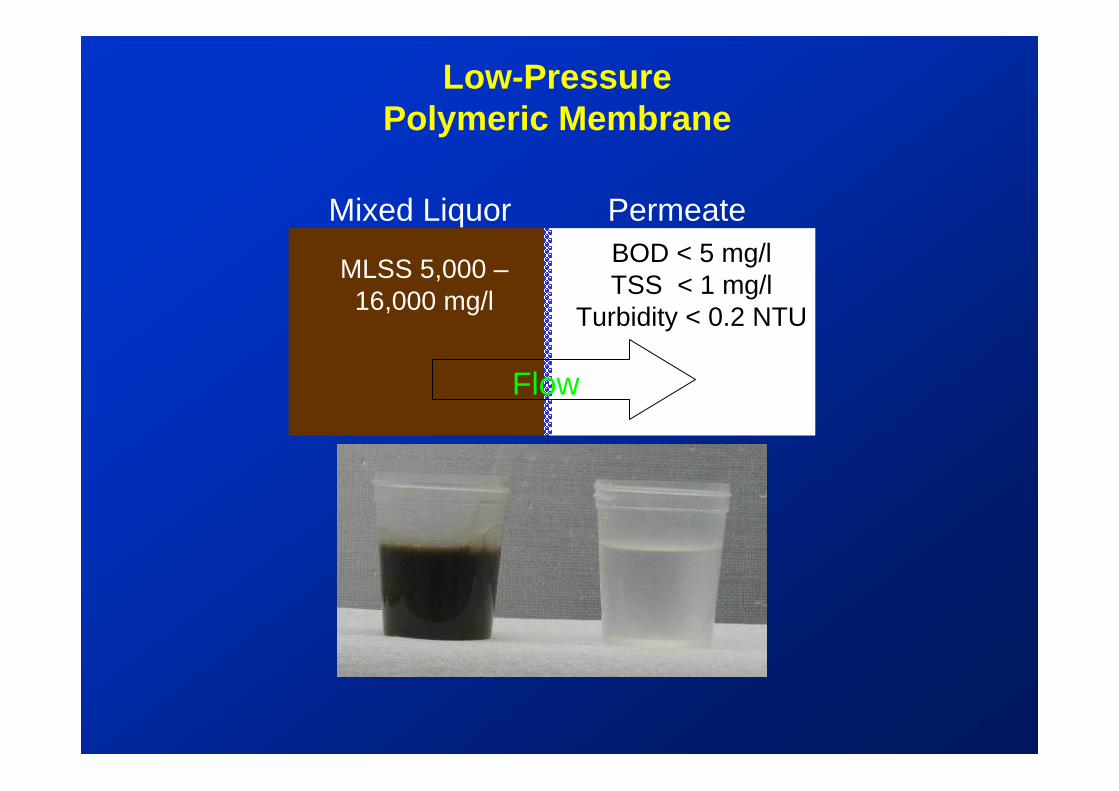
Low-PressurePolymeric Membrane
Mixed Liquor Permeate
MLSS 5,000 –16,000 mg/l
Flow
BOD < 5 mg/lTSS < 1 mg/l
Turbidity < 0.2 NTU

Membrane Filtration SpectrumMicrofiltrationUltrafiltrationNanofiltrationReverse Osmosis
Transmembrane Pressure Decreasing
Pore Size Increasing
MembraneSeparationProcess
Reverse Osmosis
Ultrafiltration
Microfiltration
Size of Common Materials
Salts Carbon Bk. Paint Pigments Human Hair
Pyrogens Sand
MetalIons Vitamin
B12
DNA, Viruses Bacteria Mist
Tobacco Smoke Coal Dust
PollensRedBloodCells
DustColloidsSugar
FlourAtoms
Particle Type Ions MacroMolecules Micro Particles
Micrometers(Log Scale) 0.001 0.01 0.1 1.0 10 100 1000
Nanofiltration
Molecules Macro Particles

Membrane Spectrum
Microfiltration Ultrafiltration Nanofiltration Reverse Osmosis
INCREASING TRANSMEMBRANE PRESSUREDECREASING MEMBRANE OPERATIONAL LIFE
Filtration in the 0.1 micron range is the most widely used membrane type in wastewater
treatment applications.
PRESSURE

DefinitionsImmersed membrane: Membrane submerged directly in process, outside to inside flow under vacuum
Flux: Loading rate of flow per membrane surface area in GPD/Ft2
(“GFD”)
TMP: Pressure across membrane surface in PSI
Permeability: Flux divided by the pressure GFD/PSI
Packing Density: Area of fibers divided by module area
Lumen: Open center of the fiber
Backpulse: Reverse flow with change from vacuum to pressure on membrane
CIP: Clean-In-Place chemical clean process
Maintenance Clean: Short term, in-process cleaning procedure

Four-Module Pilot
1.5 meters

Membrane Configurations
Polymer MonolithSingle material (homogeneous)Self-supportingSingle manufacturing processHollow fiber configuration only
LaminateMultiple materials (non-homogeneous)Multiple manufacturing processesSupportedHollow fiber or flat-sheet configuration

Polymer Monolith
SymmetricalPore structure similar through membrane depthMicrofiltration only
Asymmetrical (used in MBR)Also called “skin” membranesVery thin, tight membrane layer at surface with macroporous substructure
MicrofiltrationUltrafiltration

Laminated Membrane
Membrane

Laminated Membrane
Membrane
Backing/Substrate
• Membrane is applied to a substrate or backing for support
• Mechanical bond is critical

Membrane Comparison
USFilter Configuration
Delamination Potential
Radial Strength
Tensile Strength
Materials
LaminatePolymer MonolithCharacteristic
1 (Homogeneous) 2 or more
Low
High
High
Low
None Yes
Yes No
Membrane Bioreactor Evolution

Tubular Membrane Feed & Bleed MBR’s
Permeate
Bleed
Recirculation
Feed
Pump
Pump
Bioprocess
Commercialized Mid 1970’s

Cross Flow Tubular
Turbulent crossflow 17 fps
Permeate
PVC outer shell
Porous membrane support
1”
Low surface area - high energy consumption

Cross Flow Tubular
Turbulent crossflow 17 fps
Permeate
PVC outer shell
Porous membrane support
Cross Flow
1”
High Pressure (70 psi)
Low surface area - high energy consumption

Immersed Membrane MBR
Permeate
Recirculation
low vacuum pressure(up to 7.5 psi)
Bioreactor
Commercialized 1990’s
High surface area – reduced energy consumption

Typical MBR Layout
Aeration Basin
Anoxic Basin
Aerobic Digester
Membrane Operating
System
Fine screening

Typical MBR Layout
Aeration Basin
Anoxic Basin
Aerobic Digester
Membrane Operating
System
Membrane Operating System
Fine screening

Benefits of Immersed MBR Technology
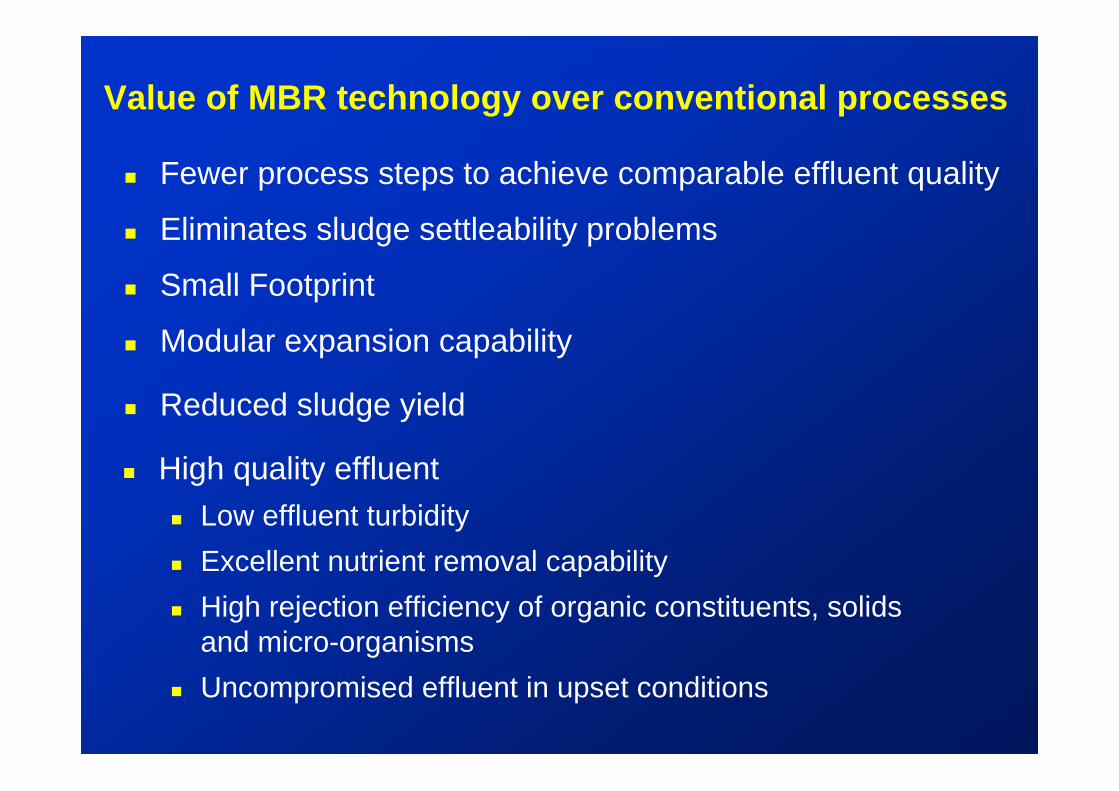
Value of MBR technology over conventional processes
Fewer process steps to achieve comparable effluent quality
Eliminates sludge settleability problems
Small Footprint
Modular expansion capability
Reduced sludge yield
High quality effluentLow effluent turbidityExcellent nutrient removal capabilityHigh rejection efficiency of organic constituents, solids and micro-organismsUncompromised effluent in upset conditions

“Less is More”
ActivatedSludge Clarifier
SandFilter
SludgeHolding
Membranes
Conventional Process Using Low Pressure Membranes
ActivatedSludge
SludgeHolding
Integrated Membrane Bioreactor
Membranes
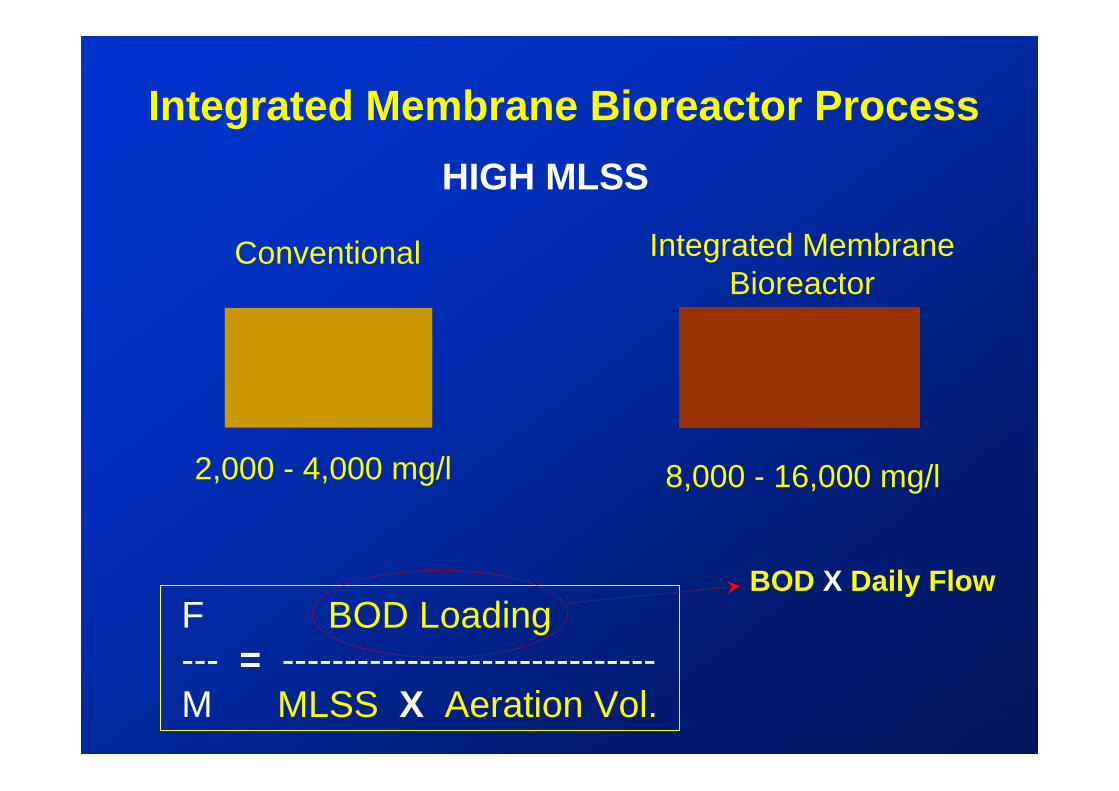
Integrated Membrane Bioreactor ProcessHIGH MLSS
Conventional Integrated MembraneBioreactor
2,000 - 4,000 mg/l 8,000 - 16,000 mg/l
F BOD Loading--- = ------------------------------M MLSS X Aeration Vol.
BOD X Daily Flow

Small Footprint
25%
CONVENTIONAL MBR
100%
TANK VOLUMEActivated Sludge Process
Integrated Membrane Bioreactor Process

Low Sludge Yield
Conventional Integrated Membrane Bioreactor
60-100% 40%
Integrated Membrane Bioreactor Process

Where do MBR’s fit?
Advanced phosphorus and nitrogen removal
Effluent reuse and recharge
Limited footprint
Upgrade of existing plants
Increased flow in existing tankage
Restricted effluent requirements
Add-on to existing biological process
Nutrient reduction

USFilter
MemJet
MBR Technology

0MLSS grams/liter
Visc
osity
10 20
MBR Operating range
Viscosity vs. Mixed Liquor Solids Concentration
Temperature decreaseincreases viscosity

Managing the Membrane Environment
Keys to success:
Controlling fluid transfer
Failure results in:
Fine screening
Solids packing around fibers
Loss of Permeability (Fouling)
High Maintenance
High Fluid Viscosity around fibers
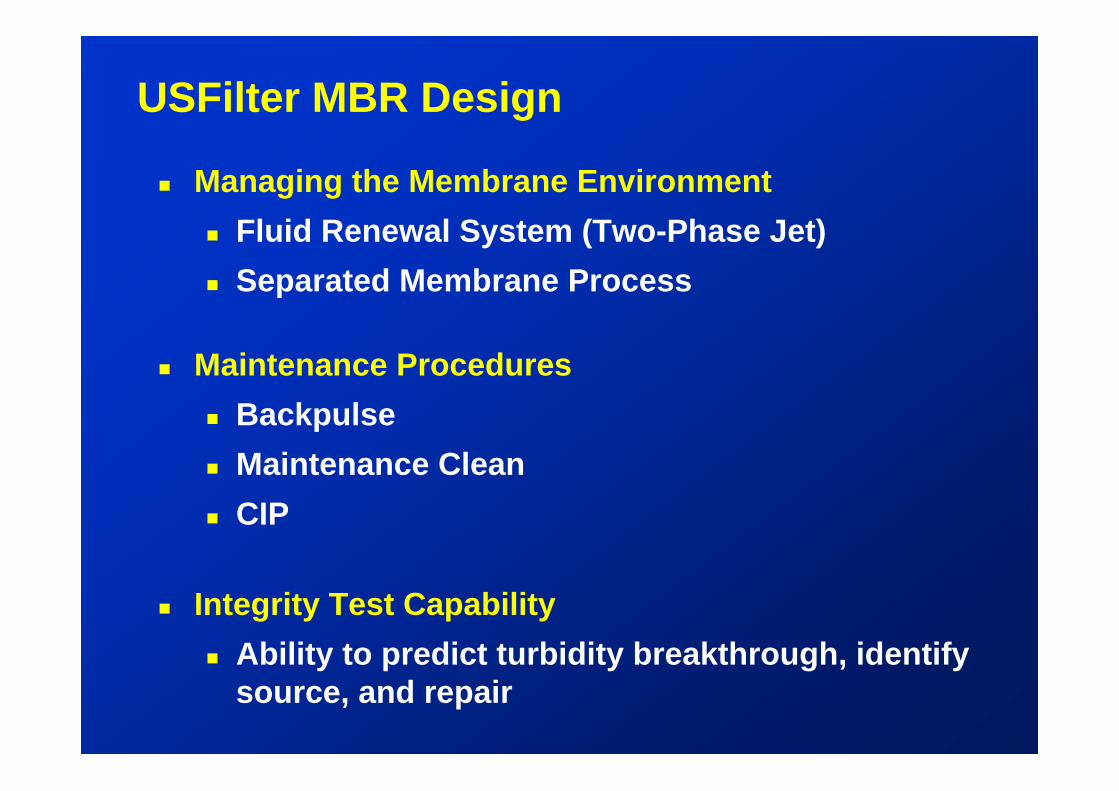
USFilter MBR Design
Managing the Membrane EnvironmentFluid Renewal System (Two-Phase Jet)Separated Membrane Process
Maintenance ProceduresBackpulseMaintenance CleanCIP
Integrity Test CapabilityAbility to predict turbidity breakthrough, identify source, and repair

Features & Benefits ofUSFilter MBR
• Controlled environment around membrane system
• Positive fluid transfer into fiber bundles
• Uniform distribution of flow and solids
• Cross-flow dynamics minimize energy consumption
• Automated, in-place, membrane cleaning process
(membrane removal unnecessary)
• Safe environment for plant operators
• Flexibility in biological process selection

Membrane Fiber
Cro
ss F
l ow
Airl
if t
Cr o
ss F
l ow
Cr o
ss F
l ow
Cr o
ss F
l ow
Perm
eate
Perm
eate
Perm
eate
Perm
eate
ProcessMixed Liquor
Cro
ss F
l ow
Increasi
ng Viscosity

Permeate
Partitioned fiber bundles
Narrow fiber bundles provide excellent fluid transfer withinentire module
nd mixed liquor scouringlivery slots Air
o-Phase Jetent Pending)
Two-Phase Jet
30% less aeration energy

Bottom of Module
Air & Mixed Liquor “Ports”
vides even distribution r & mixed liquor withinule
-divides module into ller partitioned bundles
membrane fibers are ured with air and mixed

Membrane Operating System
xed liquorerflow & ase
moval
d liquor embranes
membranes
Uniform air/mixed liquordistribution across membranes
liquor & air operatedendently
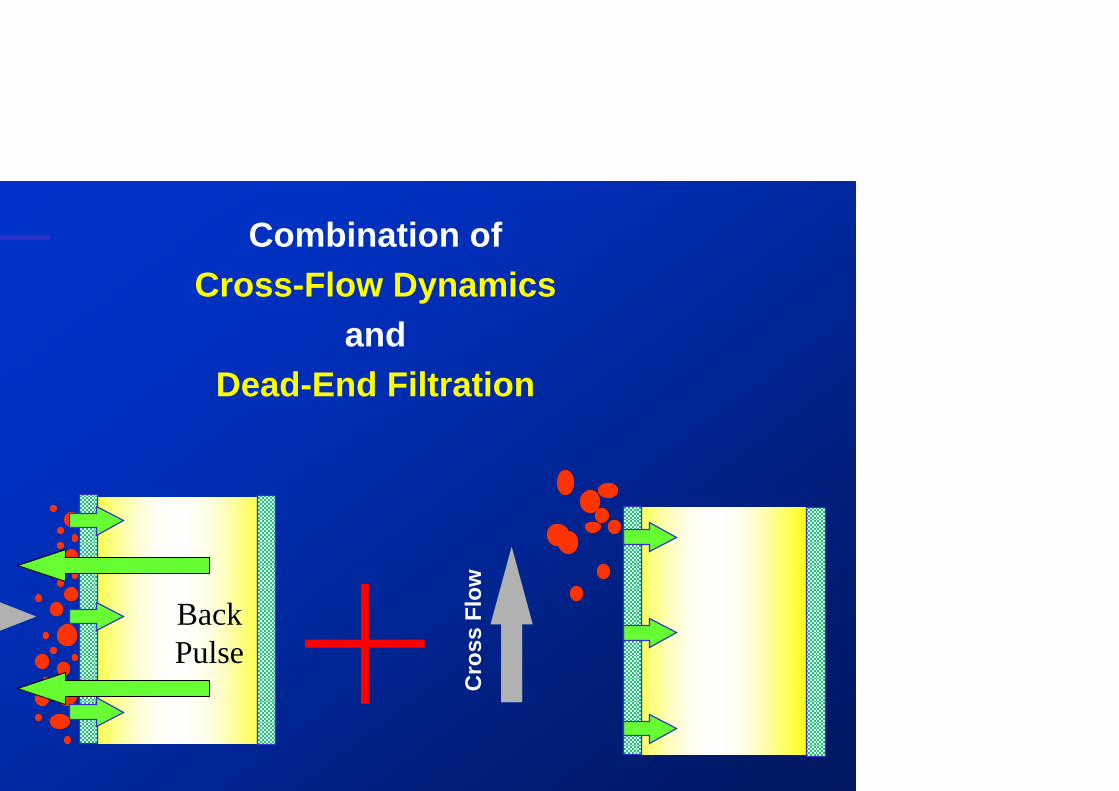
Combination ofCross-Flow Dynamics
andDead-End Filtration
Cro
ss F
low
BackPulse

Factors impacting cleaning interval
rescreen: Poor prescreen will cause fibers and debris o be trapped in fiber bundles restricting movement
ree oils and greases: These can coat the membranes nd decrease flux. Standard municipal wastewater not a roblem.
olymers: High concentration of polymers can coat membranes and decrease flux.

ermeability Curve - Flux vs. TMP
0 1 45 2 90 3 45 5 80 7 25 8 70 10 15 11 60
0 5
10
15
20
25
30
35
40
45
50
55
60
Membrane with fouling layer
New / clean membrane
StableStableoperatingoperating
zonezone
Membrane needing CIP
Maintenance
cleans slow decay
pact of fouling layer on permeability
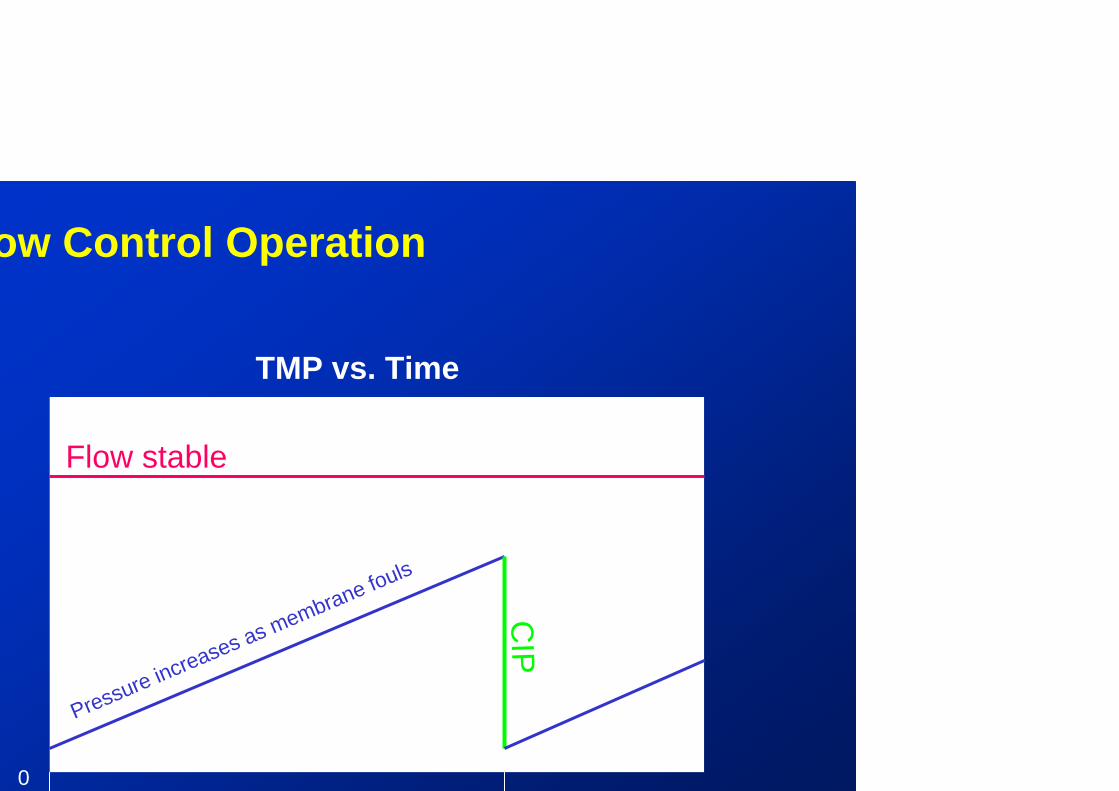
ow Control Operation
0
Flow stable
CIP
Pressure increases as membrane fouls
TMP vs. Time

Membrane Maintenance
Backpulse
Relaxation
Maintenance Clean
Clean-In-Place (CIP)

ckpulse
Completely AutomatedEvery 12-20 minutes15 second durationReverse flow utilizing filtrate pumpsJet with mixed liquor and air remains in operation

axation
Completely AutomatedUsing periodically to reduce solids buildup on membrane surfaceRelieves solids tension on membrane surface so they are scoured awayFiltrate pumps are stoppedJet with mixed liquor and air remains in operation

ntenance CleanCompletely AutomatedEvery 1-2 weeks on larger plants30-40 minutes durationInject chlorinated filtrate (200 mg/l) into membraneInhibits biological surface foulingMixed liquor remains in tank
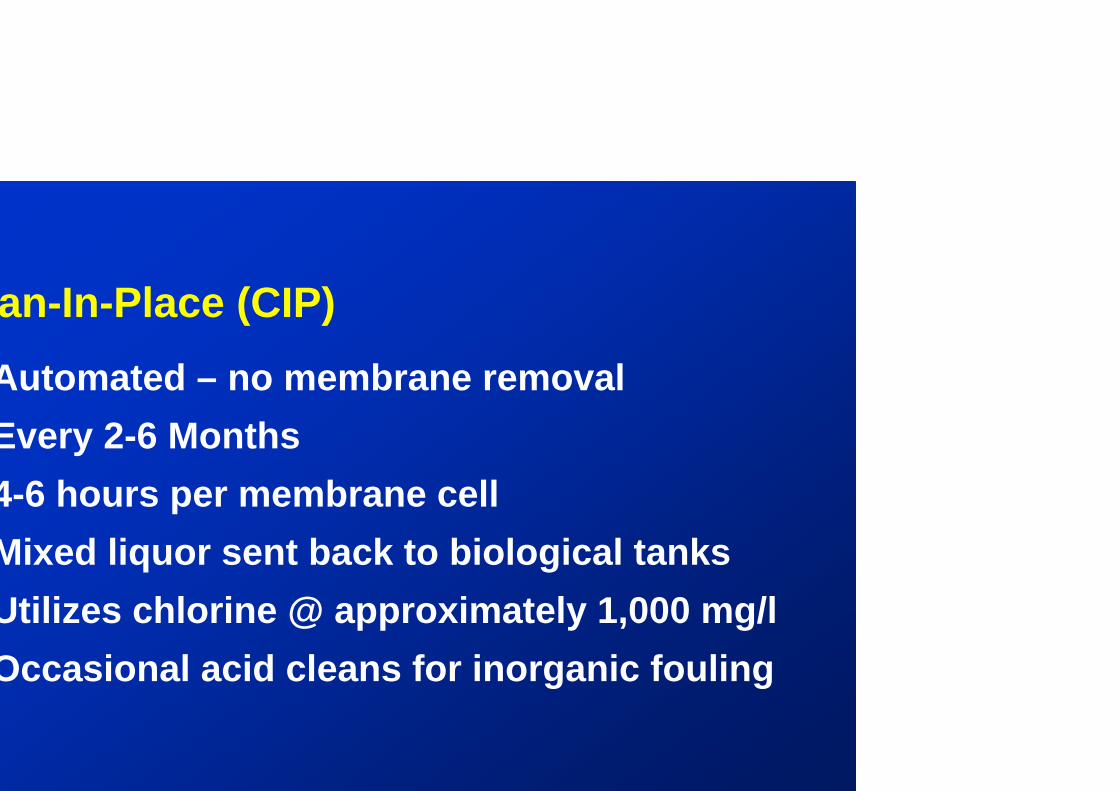
an-In-Place (CIP)Automated – no membrane removalEvery 2-6 Months4-6 hours per membrane cellMixed liquor sent back to biological tanksUtilizes chlorine @ approximately 1,000 mg/l Occasional acid cleans for inorganic fouling
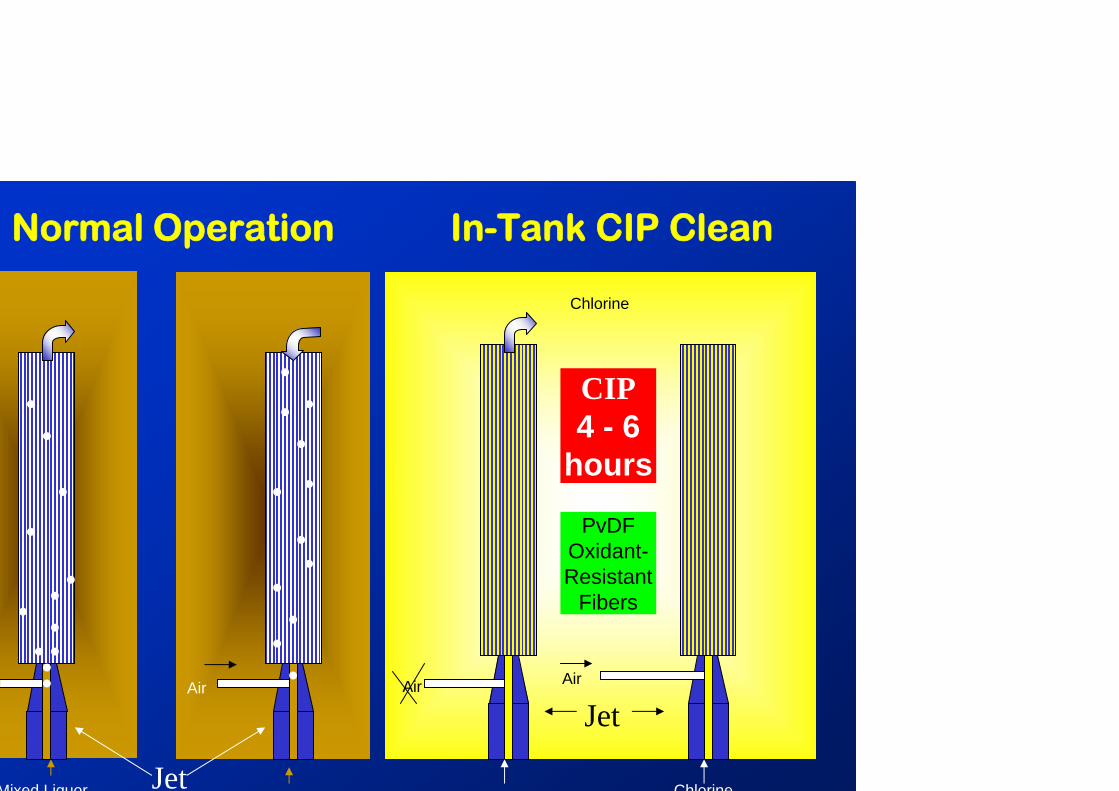
Mixed Liquor
Air
Chlorine
Normal Operation
Air
In-Tank CIP Clean
Air
Jet
Jet
Chlorine
CIP4 - 6
hours
PvDFOxidant-Resistant
Fibers
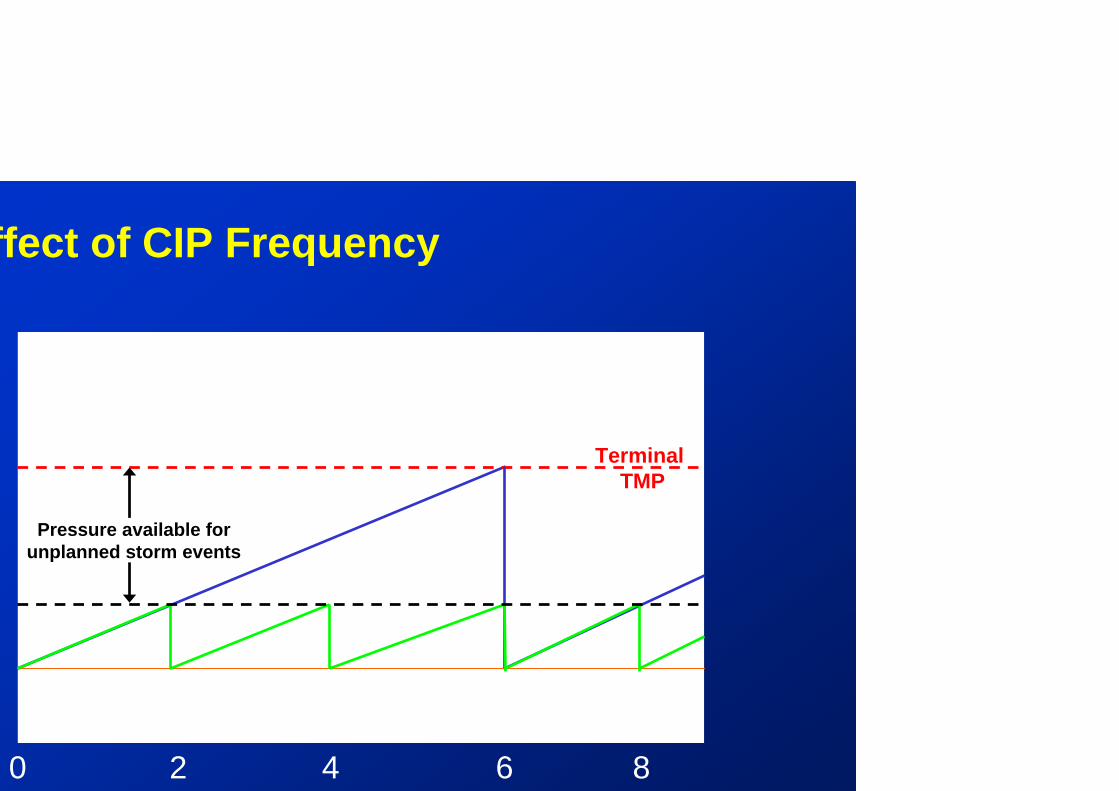
ffect of CIP Frequency
TerminalTMP
62 40 8
Pressure available for unplanned storm events

cations Piloting

AerobicAnoxicCIP
PrescreenS
Blower
5,760 GPD MBR Pilot5,760 GPD MBR Pilot

Membrane Operating SystemMOS

omplete “Rack” Assembly
MBR Demonstration Plant
Kansas City, Kansas MUD
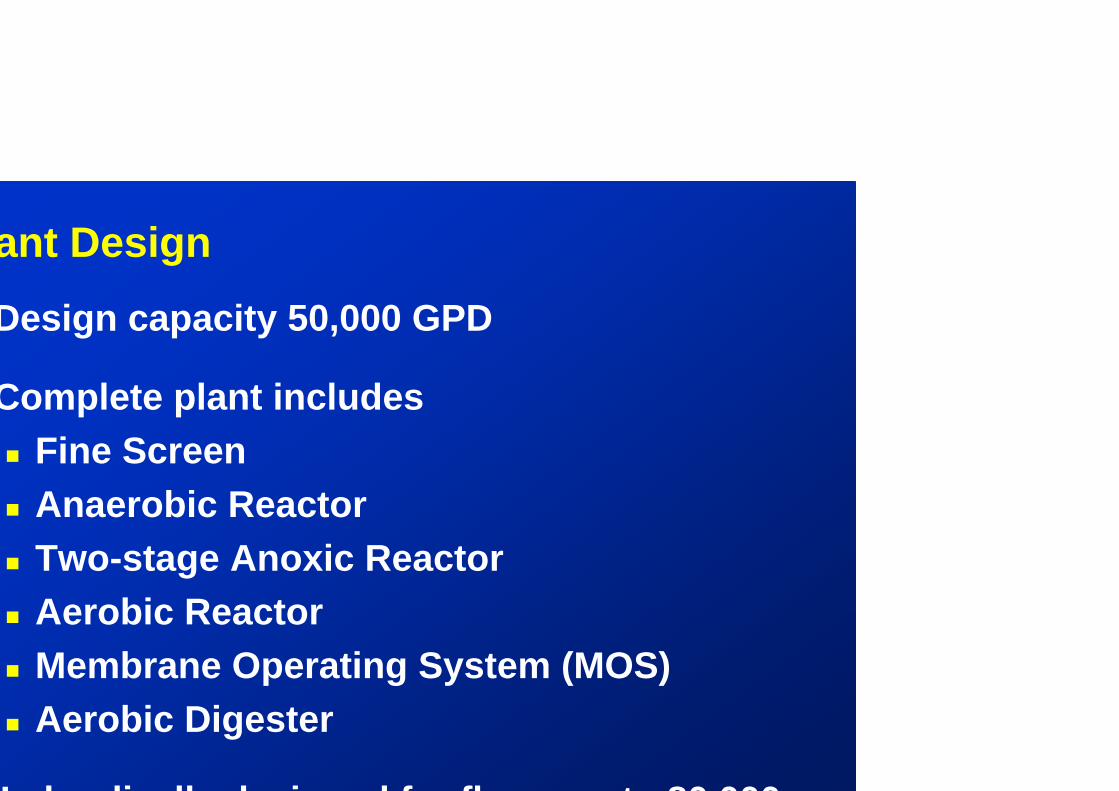
ant Design
Complete plant includesFine ScreenAnaerobic ReactorTwo-stage Anoxic ReactorAerobic ReactorMembrane Operating System (MOS)Aerobic Digester
H d li ll d i d f fl t 80 000
Design capacity 50,000 GPD

ant Schematic
Fine screen
Filtr
ate
Tank
(als
o us
ed in
CIP
&
bac
kwas
h)
Mem
bran
e Ta
nk
Two-
stag
e A
noxi
c Zo
ne
Ana
erob
ic Z
one
Aer
obic
Dig
este
r
Aerobic Zone
Mixed Liquor return
(Not currently in service)
Biological Process Air
wastewater from pump station
Outdoors

Biological Process Tanks

monstration Plantmbrane Tank

Thank youThank you for your
CONCERNCONCERN
or questions:
imitri.lazarou @ veoliawater.com


