1 June 18, 1999 MEMO FOR THE RECORD SUBJECT: Review of Compliance with the Testing Requirements of 40 CFR 227.6 and 227.27, and Site Designation Provisions of 40 CFR 228.15 for the Federal Project No. 72, Arthur Kill to Raritan River Cutoff Channel, New York Bay, New York. FROM: Douglas Pabst, Team Leader Dredged Material Management Team Division of Environmental Planning and Protection EPA Region 2 John Tavolaro Chief, Operations Support Branch New York District U.S. Army Corps of Engineers I. SUMMARY This memorandum provides comprehensive review and analysis of the Federal Project No. 72, Arthur Kill to Raritan River Cutoff Channel sediment test results. This memorandum addresses compliance with the regulatory testing criteria of 40 CFR Sections 227.6 and 227.27, and the requirements of the rule establishing the Historic Area Remediation Site (HARS) set out in Section 228.15(d)(6). These requirements hereinafter are referred to as the “Regulations.” As discussed in the HARS rulemaking preamble (See 62 Fed. Reg. 46142 (August 29, 1997) and 62 Fed. Reg. 26267 (May 13, 1997)) and its accompanying documentation, the need to remediate the Historic Area Remediation Site is amply supported by the presence in the HARS of toxic effects, dioxin bioaccumulation exceeding Category I levels in worm tissue, as well as TCDD/PCB contamination in area lobster stocks. Individual elements of the aforementioned data do not prove that sediments within the Study Area are imminent hazards to the New York Bight Apex ecosystem, living resources, or human health. However, the collective evidence presents cause for concern, justifies that a need for remediation exists, that the site is Impact Category I (see , 40 CFR 228.10), and that the site should be managed to reduce impacts to acceptable levels (see , 40 CFR 228.11(c)). Further information on the
Transcript
1
June 18, 1999 MEMO FOR THE RECORD
SUBJECT: Review of Compliance with the Testing Requirements of 40 CFR 227.6 and 227.27,and Site Designation Provisions of 40 CFR 228.15 for the Federal Project No. 72,Arthur Kill to Raritan River Cutoff Channel, New York Bay, New York.
FROM: Douglas Pabst, Team LeaderDredged Material Management TeamDivision of Environmental Planning and ProtectionEPA Region 2
John TavolaroChief, Operations Support BranchNew York DistrictU.S. Army Corps of Engineers
I. SUMMARY
This memorandum provides comprehensive review and analysis of the Federal Project No. 72, ArthurKill to Raritan River Cutoff Channel sediment test results. This memorandum addresses compliancewith the regulatory testing criteria of 40 CFR Sections 227.6 and 227.27, and the requirements of therule establishing the Historic Area Remediation Site (HARS) set out in Section 228.15(d)(6). Theserequirements hereinafter are referred to as the “Regulations.”
As discussed in the HARS rulemaking preamble (See 62 Fed. Reg. 46142 (August 29, 1997) and 62Fed. Reg. 26267 (May 13, 1997)) and its accompanying documentation, the need to remediate theHistoric Area Remediation Site is amply supported by the presence in the HARS of toxic effects, dioxinbioaccumulation exceeding Category I levels in worm tissue, as well as TCDD/PCB contamination inarea lobster stocks. Individual elements of the aforementioned data do not prove that sediments withinthe Study Area are imminent hazards to the New York Bight Apex ecosystem, living resources, orhuman health. However, the collective evidence presents cause for concern, justifies that a need forremediation exists, that the site is Impact Category I (see, 40 CFR 228.10), and that the site should bemanaged to reduce impacts to acceptable levels (see, 40 CFR 228.11(c)). Further information on the
2
conditions in the Study Area and the surveys performed may be found in the SupplementalEnvironmental Impact Statement (EPA, 1997c).
This evaluation confirms that: 1) all tests required under the Regulations were conducted; 2) this projectmeets the criteria at 40 CFR Section 227.6 for trace contaminants and Section 227.27 for LimitingPermissible Concentration (LPC); and 3) the dredged material is Category I under U.S. EnvironmentalProtection Agency (USEPA) Region 2/Corps of Engineers, N.Y. District (CENAN) guidance and issuitable for placement at the HARS as Remediation Material.
II. PROJECT DESCRIPTION
The proposal is to dredge and place approximately 114,583 cubic yards (yd) of dredged material at theHARS. The project encompassed one reach; seven sediment core samples were taken to characterizethe sediment (see sampling plan (CENAN, 1998)).
III. REGULATORY REQUIREMENTS
In order for dredged material to be suitable for use as Remediation Material to be placed at the HARS,it must conform to the Regulations. The Marine Protection, Research, and Sanctuaries Act (MPRSA)or “The Act” prohibits dumping of materials into the ocean except as authorized by USEPA or, in thecase of dredged materials, by the U.S. Army Corps of Engineers (USACE). Section 102 of the Actdirects the USEPA to establish and apply criteria for reviewing and evaluating permit applications (33U.S.C. Section 1412). The USEPA has adopted such criteria in the Regulations. 40 CFR Section227.6(a) lists constituents that are prohibited from being placed in the ocean unless only present astrace contaminants in material otherwise suitable for dumping (hereinafter referred to as “listedconstituents”). Section 227.27 addresses compliance with the LPC. See also, Section 227.13(c).
Section 227.6(b) states that constituents are considered to be present as trace contaminants only whenthey are present in such forms and amounts that the “dumping of the materials will not cause significantundesirable effects, including the possibility of danger associated with their bioaccumulation in marineorganisms.” The regulations set forth criteria for determining the potential for significant undesirableeffects in Section 227.6(c). In order to be found environmentally acceptable for ocean placement, itmust be found that the liquid phase does not contain any of the listed constituents in concentrations thatwould exceed applicable marine water quality criteria after allowance for initial mixing (Section227.6(c)(1)). For the suspended particulate phase (Section 227.6(c)(2)) and the solid phase (Section227.6(c)(3)), bioassay results must not indicate occurrence of significant mortality or significant adversesublethal effects due to the ocean placement of wastes containing the listed constituents.
Section 227.27 of the regulations addresses the LPC. For the liquid phase, Section 227.27(a)provides that the LPC is that concentration which does not exceed applicable marine water qualitycriteria after initial mixing, or when there are no applicable marine water criteria, that concentration of
3
material that, after initial mixing, would not exceed 0.01 of a concentration shown to be acutely toxic toappropriate sensitive marine organisms in a bioassay carried out in accordance with proceduresapproved by USEPA and USACE. For the suspended particulate phase and the solid phase, Section227.27(b) provides that the LPC is that concentration of material which will not cause unreasonableacute or chronic toxicity or other sublethal adverse effects based on results of bioassays usingappropriate sensitive organisms and conducted according to procedures that have been approved byUSEPA and USACE, and which will not cause accumulation of toxic materials in the human foodchain.
The HARS encompasses an area which includes the Mud Dump Site (MDS), and which has exhibitedthe potential for adverse ecological impacts and has been identified for remediation. The site will beremediated with uncontaminated dredged material (i.e., dredged material that meets current Category Istandards and will not cause significant undesirable effects including through bioaccumulation)(hereinafter referred to as “Remediation Material” or “Material for Remediation”). Under 40 CFR228.15 (d)(6)(v)(A) the site will be managed to reduce impacts within the Primary Remediation Area(PRA) to acceptable levels in accordance with 40 CFR Section 228.11(c). Use of the site is restrictedto dredged material suitable for use as Material for Remediation. This material shall be selected so asto ensure it will not cause significant undesirable effects including through bioaccumulation orunacceptable toxicity in accordance with 40 CFR 227.6.
Section 228.15(d)(6) of the Regulations describes the locations where material from NY/NJ Harborand surrounding areas may be placed in the HARS, provided that it is suitable as Remediation Material. The HARS consists of a PRA, a Buffer Zone, and a No Discharge Zone. Under 228.15(d)(6)placement of Remediation Material is limited to the PRA.
IV. GUIDANCE FOR TESTING AND EVALUATION OF DREDGED MATERIAL
The discussion below describes how the material proposed for placement at the HARS as RemediationMaterial, resulting from the maintenance dredging of Federal Project No. 72, Arthur Kill to RaritanRiver Cutoff Channel was evaluated for compliance with the requirements of 40 CFR 227.6, 227.27,and 228.15(d)(6). Testing of the material was conducted following procedures approved by USEPAand USACE, and contained in the joint USEPA/USACE national guidance “Evaluation of DredgedMaterial Proposed for Ocean Dumping - Testing Manual” (February, 1991) (the “Green Book”)(USEPA/USACE, 1991), and the regional implementation manual developed by the USEPA Region 2and CENAN (USEPA/CENAN, 1992).
These test results were analyzed in accordance with the Regulations to ensure that the proposedplacement meets the criteria of Part 227 and the requirements of 228.15(d)(6). As explained in thepreamble to the HARS Rule, Remediation Material is uncontaminated dredged material (i.e., dredgedmaterial that meets current Category I standards and will not cause significant undesirable effects
4
including through bioaccumulation). The determination of whether materials meeting the Part 227criteria are assigned to Category I is based upon technical and scientific judgment as set out below.
Applying the USEPA Region 2/CENAN guidance to this project, the material would be Category I if itmeets the Part 227 criteria (including the requirements regarding acute toxicity) and:
< bioaccumulation test results are below the regional Matrix levels for cadmium, mercury, totalPCBs, and total DDT, and are below the regional Category I values for dioxin; and
< bioaccumulation test results for the other bioaccumulative chemicals of concern identified inUSEPA/CENAN (1992) do not indicate a potential for undesirable effects using conservativeassessment techniques.
Sediments that meet this Category I definition are suitable for placement at the HARS as RemediationMaterial as they will improve sediment conditions at the HARS to reduce impacts to acceptable levelsin accordance with 40 CFR Section 228.11(c). Sediments that do not meet this definition are notsuitable for placement at the HARS.
V. RESULTS OF EVALUATION OF THE MATERIAL
A. Evaluation of the liquid phase
The liquid phase of the material was evaluated for compliance with Sections 227.6(c)(1) and227.27(a). There are applicable marine water quality criteria for constituents in the material, includinglisted constituents, and the applicable marine water quality criteria would not be exceeded after initialmixing. In addition, liquid phase bioassays run as part of the suspended particulate phase on threeappropriate sensitive marine organisms, show that after initial mixing (as determined under 40 CFR227.29(a)(2)), the liquid phase of the material would not exceed a toxicity threshold of 0.01 of aconcentration shown to be acutely toxic to appropriate sensitive marine organisms. Accordingly, it isconcluded that the liquid phase of the material would be in compliance with 40 CFR 227.6(c)(1) and227.27(a). The specific test results and technical analysis of the data underlying this conclusion aredescribed and evaluated in CENAN (1999).
B. Evaluation of the suspended particulate phase
The suspended particulate phase of the material was evaluated for compliance with Sections227.6(c)(2) and 227.27(b). Bioassay testing of the suspended particulate phase of the material hasbeen conducted using three appropriate sensitive marine organisms: inland silversides (Menidiaberyllina), mysid shrimp (Mysidopsis bahia), and blue mussel (Mulinia lateralis). That informationshows that when placed in the HARS and after initial mixing (as determined under 40 CFR227.29(a)(2)), the suspended particulate phase of this material would not exceed a toxicity threshold of0.01 of a concentration shown to be acutely toxic in the laboratory bioassays, and thus would not result
5
in significant mortality. The material may be dumped on either incoming or outgoing tides. Howeverdisposal may occur only at distances of at least 3,733 feet from the northern boundary and at least3,698 feet from the western boundary of the HARS, during flood tide. The specific test results andtechnical analysis of the data underlying this conclusion are described in CENAN (1999). The factor of0.01 was applied to ensure that there would be no significant adverse sublethal effects. Moreover, thefact that after placement, the suspended particulate phase would only exist in the environment for ashort time, means the suspended particulate phase would not cause significant undesirable effects,including the possibility of danger associated with bioaccumulation, since these impacts require longexposure durations (see USEPA, 1994). Accordingly, it is concluded that the suspended phase of thematerial would be in compliance with 40 CFR 227.6(c)(2) and 227.27(b).
C. Evaluation of the solid phase
The solid phase of the material was evaluated for compliance with Sections 227.6(c)(3) and 227.27(b). This evaluation was made using the results of two specific types of evaluations on the solid phase of thematerial, one focusing on the acute (10-day) toxicity of the material, and the other focusing on thepotential for the material to cause significant adverse effects due to bioaccumulation. Both types oftests used appropriate sensitive benthic marine organisms according to procedures approved byUSEPA and the USACE. The following sections address the results of those tests and further analyzecompliance with the regulatory criteria of Sections 227.6(c)(3), 227.27(b), and 228.15 and with EPARegion 2/CENAN guidance.
1. Solid phase toxicity evaluation
Ten-day toxicity tests were conducted on project materials using mysids (M. bahia) and amphipods(Ampelisca abdita), which are appropriate sensitive benthic marine organisms. These organisms aregood predictors of adverse effects to benthic marine communities (see, USEPA, 1996a). The toxicityof project sediments was not statistically greater than reference for either mysids or amphipods and didnot exceed mortality in the reference sediment by 10% for mysid shrimp or 20% for amphipods andwas not statistically greater than reference for either mysids or amphipods. These results show that thesolid phase of the material would not cause significant mortality and meets the solid phase toxicitycriteria of Sections 227.6 and 227.27.
2. Solid phase bioaccumulation evaluation
USEPA/USACE (1991) describes an approved process of evaluating bioaccumulation potential usingcomparative analysis of project sediment bioaccumulation to reference sediment bioaccumulation, FDAAction levels and evaluation of eight additional factors for assessing the significance of bioaccumulation. These factors are:
6
C number of species in which bioaccumulation from the dredged material is statistically greaterthan bioaccumulation from the reference material
C number of contaminants for which bioaccumulation from the dredged material is statisticallygreater than bioaccumulation from the reference material
C magnitude by which bioaccumulation from the dredged material exceeds bioaccumulation fromthe reference material
C toxicological importance of the contaminants whose bioaccumulation from the dredged materialexceeds that from the reference material
C phylogenetic diversity of the species in which bioaccumulation from the dredged material
statistically exceeds that from the reference material
C propensity for the contaminants with statistically significant bioaccumulation to biomagnify withinaquatic food webs
C magnitude of toxicity and number and phylogenetic diversity of species exhibiting greatermortality in the dredged material than in the reference material
C magnitude by which contaminants whose bioaccumulation from the dredged material exceedsthat from the reference material also exceed the concentrations found in comparable speciesliving in the vicinity of the proposed site
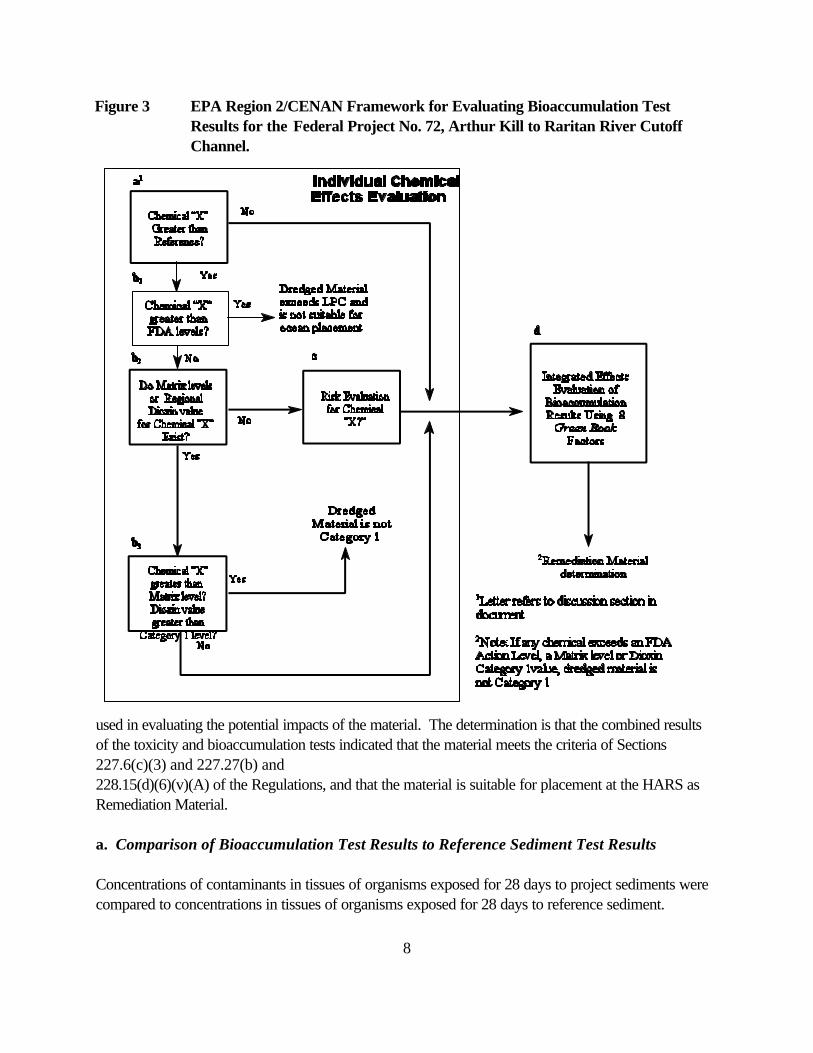
In following this guidance, USEPA Region 2 and CENAN used a framework (described in Figure 1)for evaluating project sediment bioaccumulation results. As shown in Figure 1, this process involvesfour consecutive evaluations. In the first three evaluations, the project sediment bioaccumulation testresults for each compound of concern are sequentially compared to: a) reference test results; b1) FDA Action levels; b2 ) Regional Matrix levels; b3) regional dioxin values;and, c) general risk-based evaluations (including comparison to background tissue concentrations). Ifthese evaluations show that the project sediment does not exceed the reference test results in step (a),the FDA levels in step (b1), and the Regional Matrix levels/dioxin Category I values in steps (b2 to b3)for a particular compound, this indicates that the placement of the material would not result in adverseeffects due to that chemical, and there is no need to further evaluate that individual chemical in the nextstep. Markings in columns 5 or 7 of Table 1 indicate where project test results were statistically greaterthan the reference levels for the clam or the worm. If any species are marked for a particularcompound, the evaluation will proceed to the next step. General risk-based evaluations are conductedin step (c) for compounds not resolved in steps (a) or (b1 to b3). The fourth evaluation (d) uses all theinformation and results of the individual chemical evaluations (particularly as these results relate to the
7
eight Green Book factors listed above), to evaluate the solid phase of the dredged material as a whole. These evaluations for this project are discussed below in the order described in Figure 1.
Bioaccumulation tests were conducted on the solid phase of the project material for contaminants ofconcern identified in USEPA/CENAN (1992) and the project sampling plan (CENAN, 1997) usingtwo appropriate sensitive benthic marine organisms, sand worm (Nereis virens) and nut clam(Macoma nasuta). These species are considered to be good representatives of the phylogeneticallydiverse base of the marine food chain. Contaminants of concern were identified for the regional testingmanual from the NY/NJ Harbor Estuary Program Toxics Characterization report (Squibb, et al.,1991). That report was prepared as part of development of the Harbor Estuary Program in order toidentify and characterize contaminants in Harbor sediments. Those compounds with the potential tobioaccumulate (Kow of approximately 4 or greater) are included on the testing list and evaluated by useof bioaccumulation tests when expected to be present in project sediments based upon the location ofcontaminant inputs and results of previous sediment sampling. The bioaccumulation test results were
8
Figure 3 EPA Region 2/CENAN Framework for Evaluating Bioaccumulation TestResults for the Federal Project No. 72, Arthur Kill to Raritan River CutoffChannel.
used in evaluating the potential impacts of the material. The determination is that the combined resultsof the toxicity and bioaccumulation tests indicated that the material meets the criteria of Sections227.6(c)(3) and 227.27(b) and 228.15(d)(6)(v)(A) of the Regulations, and that the material is suitable for placement at the HARS asRemediation Material.
a. Comparison of Bioaccumulation Test Results to Reference Sediment Test Results
Concentrations of contaminants in tissues of organisms exposed for 28 days to project sediments werecompared to concentrations in tissues of organisms exposed for 28 days to reference sediment.
9
Reference sediment serves as a point of comparison to identify potential effects of contaminants in thedredged material (USEPA/USACE, 1991). In essence, exposing test organisms to this sedimentallows for the prediction of contaminant levels that would result in the test organisms were they “in thewild” at the area from which the reference sediment was taken. The tissue concentrations in twospecies of appropriate sensitive benthic marine organisms resulting from 28-day exposure to projectsediments is compared to the tissue concentrations in the same species of organisms resulting from 28-day exposure to reference sediment. In order to make a statistically valid determination that the projectsediment does/does not cause greater bioaccumulation than the reference sediment, several sub-samples of the dredged material and reference are run; these separate sub-samples are calledreplicates. A mean can then be calculated with a standard deviation for each sediment (i.e., FederalProject No. 72, Arthur Kill to Raritan River Cutoff Channel sediments, and Reference sediment). Themeans and standard deviations are compared using a standard statistical approach, and a determinationis made, with 95 percent confidence, that there is or is not a true difference between the test andreference sediments. A statistical analysis is merely a quantification of the variability between the testand reference data, and a measure of the probability of the difference being real. Throughout thismemorandum, statements regarding project sediment having “greater” or “less” bioaccumulation arereferring to calculated differences which are statistically significant at the 95% confidence level. To beenvironmentally conservative, test values which were below detection levels were estimated at veryconservative levels for purposes of statistical comparisons (USEPA/CENAN, 1997)
The reference sediment used for this project was collected at the Reference Site, in an area of clean,sandy sediments located in the New York Bight near the HARS, where the sediments are unaffectedby prior dredged material disposal (see reference values in Table 1, Columns 2 and 3). Whenbioaccumulation in organisms exposed to project sediments is not greater than bioaccumulation inorganisms exposed to appropriate reference sediments, this means that placement of the material wouldnot result in bioaccumulation above that found to occur in the “clean” reference sediment. Accordingly,such material would not result in bioaccumulation that would cause unreasonable degradation of theenvironment or human health, or significant adverse effects. In cases where bioaccumulation levels arestatistically greater (at the 95% confidence limit) than in the reference, further evaluation for potentialeffects is warranted. A statistically significant difference between test and reference bioaccumulation isnot itself a quantitative prediction that an impact would occur in the field, nor is it related to any causeand effect. A key to understanding bioaccumulation and potential adverse impacts is thatbioaccumulation is a phenomenon and does not necessarily result in an effect. In addition, dependingupon the exposure (concentration and duration), bioaccumulation may cause no harm. On the otherhand, as exposure and subsequent bioaccumulation increases, the potential for adverse effectsincreases.
The following text summarizes the test results comparing bioaccumulation from the project sediments tothat in the reference sediments. (Contaminants for which bioaccumulation from the dredged materialwas statistically greater than the reference in the clam and/or the worm are indicated by a mark incolumns 5 and/or 7 for that compound in Table 1.)
10
MetalsC Of the nine metals tested, five in the clam were bioaccumulated greater in the project sediment
than the reference. No metals bioaccumulated in the worm tissue. Cadmium and mercury arethe only metals that are listed constituents in Section 227.6(a). Only mercury bioaccumulatedgreater in the project sediment than the reference in the clam tissue.
PesticidesC Of the 15 pesticides (including DDT congeners) tested, 15 in the clam and 11 in the worm were
bioaccumulated greater in the project sediment than the reference.
Industrial ChemicalsC Total PCBs bioaccumulated greater than reference in both the clam and the worm. 1,4-
Dichlorobenzene did not bioaccumulate greater than reference for either clam or worm.
DioxinsC Of dioxin congeners (including 2,3,7,8-TCDD and 16 other dioxin congeners), 11 in the clam
and 11 in the worm were bioaccumulated greater in the project sediment than the reference.
PAHsC Of the 16 PAHs tested, 15 in the clam and 14 in the worm were bioaccumulated greater in the
project sediment than the reference.
For all metals, the magnitude of exceedance is less than 10 times the reference. For the remainingcontaminants that bioaccumulated from project sediment to greater concentrations than the reference,eight PAHs, seven pesticides, and total PCBs exceeded the reference greater than ten times in the clamand/or the worm. Exceedance of the reference values is common when reference values are very lowor “non-detect,” as here. In such cases the potential for the actual tissue concentration to be related toan effect on the organism or the food chain (including human health) is further evaluated. b. Comparison to FDA Action levels, Regional Matrix Levels and Dioxin Values
i.) Comparison to FDA Action levels (b1)
There are FDA Action levels for seven compounds (aldrin, dieldrin, a-chlordane, heptachlor,heptachlor epoxide, PCBs, and mercury). None of the contaminants for which there are FDA Actionlevels exceed such thresholds in the tissues of organisms exposed to project sediments for 28 days (seealso Table 1). The source of FDA Action levels is described in USEPA/USACE (1991). Table 1,Column 18, identifies the relevant FDA Action levels.
11
Exceedance of an FDA Action level results in a conclusion that the placement of the dredged materialwould result in significant adverse effects. No contaminants for which there are FDA Action levelexceeded any such level in either the clam or the worm tissues.
ii) Comparison to Regional Matrix Levels (b2)
There are regional Matrix levels for four compounds (cadmium, mercury, PCBs and total DDT). Thesource of regional Matrix levels is described in USACE (1981). Table 1, Column 20, identifies therelevant regional Matrix levels. Bioaccumulation results that exceed the regional Matrix level indicatethat the sediment is not Category I under USEPA Region 2/CENAN guidance. Total DDT, total PCB,and mercury did not bioaccumulate in either clam or worm tissue at concentrations exceeding theMatrix level.
iii) Comparison to Regional Dioxin Values (b3)
Regional dioxin values are intended for comparison to the results of 28-day bioaccumulation testresults, and the source and use of the values are described in the USEPA (1997a). Table 1, Sheet B,Column 20, identifies the relevant regional dioxin values. Twenty-eight day bioaccumulation test resultsthat equal or exceed the regional Category I dioxin value of 1 pptr for 2,3,7,8-TCDD (or 4.5 pptr usingthe TEQ approach described in USEPA (1997a) for the non 2,3,7,8-TCDD congeners) indicate thatthe sediment is not Remediation Material under USEPA Region 2/CENAN guidance. Bioaccumulation test results were below the regional Category I dioxin values for both the worm or theclam.
iv) Steady State Considerations for Matrix Compounds
When the end point to which the test data is compared potentially represents a steady-state level, ratherthan a 28-day level, consideration may need to be given to whether the 28-day test results arerepresentative of bioaccumulation levels that could be expected to occur in the field after placement. The literature was reviewed to determine the degree to which the test results reached steady state, asappropriate. The relevance of adjusting project data to steady state for comparison to regional Matrixlevels is discussed below.
PCBs
To assess the rate of bioaccumulation of PCBs and other compounds, Rubinstein, et al. (1990) andPruell, et al. (1993) exposed three species of organisms, the grass shrimp Palaemonetes pugio; thesandworm Nereis virens; and the clam Macoma nasuta, to sediments collected from the PassaicRiver, N.J. Sub-samples of the exposed organisms were removed on various days into the studyincluding days 0, 10, 28, 42, 84, and 180. For the clam tissue, the variance in the concentrations onday 28 and day 84 (by which point the maximum concentration had been reached) overlap, thus
12
indicating that the two are not statistically different and the bioaccumulation on day 28 is at or veryclose to steady-state. Thus, the clam bioaccumulation for the project sediments using 28-dayexposures is acceptable for use as steady-state tissue levels, and was below the Matrix level for totalPCB. For the worm tissue, variances for days 28 and 180 do not overlap, thus indicating that steady-state was probably not reached in 28 days, although the variance in the data makes it difficult toquantify a real difference. However, if the means for days 28 and 180 from Rubinstein et al. (1990)are compared (approximately 1,750 ng/g (nanograms per gram or parts per billion, ppb) for 28 days,and 3,000 ng/g for 180 days) this indicates approximately 58% of steady-state would have beenreached in 28 days. If on this basis the worm project data are conservatively adjusted upward by evena factor of two to calculate a steady-state tissue concentration, the dredged material tissueconcentration is still below the Matrix level for PCBs in the worm.
Total DDT
With regard to DDT and its metabolites, the degree to which these compounds reached steady-statewas also evaluated. Table 1 contains the project test results for the total DDT, which is the sum of theresults for DDT and its metabolites (i.e., DDE and DDD). This level is compared to the Matrix levelfor total DDT. To assess the rate of bioaccumulation of the DDTs and their metabolites, Lee, et al.,(1994) exposed the clam Macoma nasuta, to sediments collected from the vicinity of the UnitedHeckathorn Superfund site in Richmond California. The study measured tissue residues and uptakekinetics from exposure to pesticide-contaminated sediments. Results of the study indicate that oneparent compound, 4,4-DDT, bioaccumulates much more slowly than 2,4-DDT and the DDTmetabolites. The results range from approximately 9 percent of steady state after 28 days for 4,4-DDT, to 55 percent of steady state after 28 days for 2,4-DDT. (Lee, et al., 1994) In the FederalProject No. 72, Arthur Kill to Raritan River Cutoff Channel project, the parent compounds (4,4-DDTand 2,4-DDT) and metabolites were detected and were statistically greater than the reference in thebioaccumulation test results for the clam tissue. In order to calculate a steady-state tissueconcentration, based on the above study a factor of 11 was applied to the project data for 4,4-DDT, afactor of three to the project data for 4,4-DDD, and a factor of two for 2,4-DDT and the remainingDDT metabolites. Using these conservative assumptions, the dredged material tissue concentration isstill below the Matrix level for total DDT in both the worm and the clam.
Cadmium and Mercury
Cadmium and mercury are not regulated in marine organisms as are essential metals, and, thus, noadjustment for steady state is applicable. The Matrix levels for cadmium and mercury, therefore, donot represent “steady state.” Bioaccumulation of these metals is affected by many complex factors, andis essentially linear (Dethlefsen, 1978; Giesy, et al., 1980; V-Balogh and Salanka, 1984). Therefore,there are no adjustments that can be made to reproduce “steady state,” and so 28-day test results areused to compare to the Matrix levels.
13
c. Risk-based evaluations
The potential for impacts due to compounds that produced greater bioaccumulation from projectsediments than the reference sediments and for which Matrix levels or Regional dioxin values did notexist, was determined using risk-based evaluations. As noted in Table 1 and the previous discussions,for this project PAHs, aldrin, chlordane, dieldrin, trans nonachlor, heptachlor, heptachlor epoxide,endosulfan I, endosulfan II, endosulfan sulfate, chromium, copper, lead, and nickel fall into that groupfor the worm and/or clam.
The toxicological significance of this bioaccumulation was evaluated by: i) consideration of steady-statebioaccumulation and food-chain transfer; ii) comparison to background tissue concentrations; iii)consideration of potential ecological effects; and, iv) consideration of potential carcinogenic and non-carcinogenic effects on human health.
i) Consideration of Steady-State Bioaccumulation and Food-Chain Transfer Bioaccumulation tests were conducted using 28-day exposure of appropriate sensitive benthic marineorganisms to sediment. As previously discussed, for bioaccumulation evaluations involving comparisonswith “steady-state” tissue concentrations (as opposed to evaluations using other 28-day tissueconcentrations such as the comparison to reference sediment), it may be necessary to understand theextent to which the organism tissue concentration has reached steady-state. Steady-state may bedefined operationally as the lack of any significant difference (ANOVA, alpha = 0.05) among tissueresidues taken at three consecutive sampling intervals (Lee, et al., 1989). The 28-day test exposureperiod was selected as appropriate because most chemicals of concern will reach at least 80% ofsteady-state in benthic marine organisms within that time frame (Boese and Lee, 1992). For the fewchemicals that may not meet steady-state tissue concentrations in 28 days, a factor may be used toadjust the data to steady-state when necessary. In order to better use the tissue concentration results of28-day bioaccumulation exposure tests to assess the risks posed to the environment from the chemicalsrequiring further evaluation (see discussion above for the identification of such chemicals), considerationwas given to the steady-state concentration of these compounds that could occur in the HARS afterextended periods of time. In addition, the potential movement of these compounds through the foodchain was considered and appropriate trophic transfer factors applied to adjust the data accordingly, asdescribed below.
Metals
In general, metals bioaccumulate more rapidly than organics and 28-day tests are sufficient to evaluatepotential effects (see USEPA/USACE, 1991), for example, arsenic (Naqvi, et al., 1990; Riedel, et al.,1987; Oladimeji, et al., 1984).
14
Trophic transfer of most metals is not sufficient to qualify as biomagnification (Brown and Neff, 1993). The lack of observed biomagnification for such metals as chromium, copper, lead, and nickel is theresult of incomplete absorption of metals across the gut, rapid excretion, and dilution in muscle, whichrepresents a large part of the total body weight of most marine animals (Fowler, 1982; Suedel et al.,1994). For purposes of conducting the human health and ecological evaluations below, a conservativetrophic transfer coefficient equal to one will be used for these non-biomagnifying metals (Suedel et al.,1994 and references cited therein).
Pesticides and Industrial Chemicals
Uptake of non-polar organic contaminants from food is highly dependent on its hydrophobicity, aproperty measured by the octanol/water partition coefficient, Kow. The higher the value of Kow, thelonger it takes to reach steady-state in benthic marine organisms. For the organochlorine compoundsaldrin, dieldrin, heptachlor, trans nonachlor, and alpha-chlordane that have log Kow > 6, it is possiblethat steady-state was not reached within 28 days. Information contained in Boese and Lee (1992)indicates that 28-day bioaccumulation tests for these chemicals achieve at least 50% of steady-state foraldrin, dieldrin, and a-chlordane. The remaining compounds, heptachlor and trans nonachlor, were notaddressed in Boese and Lee (1992), however estimates of the fraction of steady state achieved after28-days can be calculated using the equations contained in McFarland (1995). Results of suchcalculations indicate heptachlor and trans nonachlor reach approximately 50% of steady state after 28days. Comparison of the project data for these compounds with the effects data discussed below afterusing an appropriate factor (a factor of two) to adjust the project data to an appropriate steady-stateconcentration, indicates that project sediment results would be below conservative ecological andhuman effects levels. Calculating the fraction of steady state achieved for the remaining pesticides withlog Kow<6 (i.e., heptachlor epoxide, endosulfan I, endosulfan II, and endosulfan sulfate) and for 1,4-dichlorobenzene (Kow=3.44) indicates that these compounds reach steady state within 28 days, so noadjustment is necessary.
The potential for these chemicals to biomagnify was also evaluated. Although organic contaminantswith values of log Kow > 4 tend to biomagnify in the marine food chain, studies (USACE, 1995) haveshown that this is not true for higher molecular weight compounds such as the most highly chlorinatedPCBs or for easily metabolized compounds such as PAHs. Those organic compounds which are notefficiently excreted, such as certain pesticides (including aldrin, dieldrin, a-chlordane, trans nonachlor,heptachlor, and heptachlor epoxide), can biomagnify in the food chain. For the organic constituentswith a potential to biomagnify in the marine food chain, trophic transfer factors were calculated, usingthe approach described by Gobas (1993). The values are summarized in Attachment B. Thesefactors, which ranged from 1 to 2.7, were taken into account in assessing potential human health andecological risk effects of these compounds, as discussed below.
PAHs
15
The time required for a given PAH to attain a steady-state concentration following exposure to beddedsediments (tss) is determined primarily by the log Kow of the compound in question (McFarland, 1995;Meador, et al., 1995). Meador, et al., (1995) reviewed nine studies that investigated the attainment ofsteady-state tissue concentrations of PAHs by various marine invertebrates. In each case, tissueconcentrations approached steady-state within several days to two weeks after initiating exposure toboth low molecular weight PAHs and high molecular weight PAHs. McFarland (1995) estimated thetime to steady-state (tss) for 15 PAHs based on their hydrophobicity. The tss values ranged from 3.5 to326 days. The estimated steady-state concentration of the sum total of the 15 PAHs analyzed byMcFarland for sediments collected from typical harbor areas revealed that the mean concentrationattained after 28-day bioaccumulation tests was approximately 86% of steady-state. McFarland(1995) concluded that 28-day tests are likely to reflect steady-state. However, even using theconservative approach of adjusting the data to calculate steady-state for the individual PAHs in theproject based on McFarland (1995) (using a factor of one, two, or three, as indicated) and summingthe results, the project data would still fall below the effects levels as discussed below.
With regard to the potential for biomagnification of PAHs, feeding studies show that assimilation ratesfrom ingested food are extremely low, e.g., more than 98% of the target contaminant remained in anundigested form in fish gut 48 hours after feeding squid containing radio-labeled benzo[a]pyrene toyoung cod (Corner, et al., 1976) and juvenile Atlantic herring (Whittle, et al., 1977) . PAHmetabolites are also transferred through the marine food chain; however, they are absorbed even lessefficiently than their parent compounds (McElroy and Sisson, 1989; McElroy, et al., 1991). Up to99% of the PAH compounds taken up by fish are metabolized and excreted into bile, the usualelimination mode, within 24 hours of uptake (Varanasi, et al., 1989). Similar results are described inBrown and Neff (1993) who evaluated various studies describing trophic transfer. The studies cited inBrown and Neff (1993) indicate a trophic transfer rate for BaP from invertebrates to fish of between0.02 and 0.23 times the concentration in the ingested invertebrates (Corner, et al., 1976, O’Connor, etal., 1988, McElroy, et al., 1991). This was taken into account when assessing the ecological andhuman health effects of the project material as discussed below.
ii) Comparison of Test Results to Background Tissue Concentrations
Where data regarding tissue levels of organisms living in the general area of the HARS are available(“background levels”), it is useful to compare those levels with the test levels as part of the riskevaluation (Figure 1, Box c). However, this comparison is not, by itself, definitive. Whenbioaccumulation in organisms exposed to project sediments is not greater than tissue concentrations inorganisms from the vicinity of the remediation site (the background levels), this means that placement ofthe material would not result in bioaccumulation above existing ambient levels in the general area andthus does not have a potential to cause undesirable effects. When bioaccumulation in organismsexposed to project sediments is greater than these levels, it may or may not be predictive of adverseeffects (e.g., it may reflect extremely low “background” levels). Depending on the exposure
16
(concentration and duration), bioaccumulation may cause no harm. However, as exposure increases,the potential for adverse effects increases.
Organisms collected from a broad area of the sea floor in the vicinity of (but not inside) the HARS havebeen collected and analyzed for tissue concentration for bioaccumulative contaminants of concern(Charles and Muramoto, 1990; USACE, 1994; USEPA, 1996f; USEPA, 1997b). These field-generated bioaccumulation results provide a measure of the tissue residues for organisms living outsidethe HARS. Table 1, Columns 16 and 17 summarize the most recent background data. For clambackground, data were collected only for the following constituents: all PAHs, two DDT compounds,PCBs, and seven of the nine metals analyzed. Where background values exist, the followingconstituents exceeding background are identified: only six PAHs exceeded background levels in theworm, no PAHs exceed clam background values. Total PAHs did not exceed background levels foreither clam or worm tissue. Aldrin, 4,4-DDT, and 4,4-DDE, exceeded background levels in the clam. Aldrin, dieldrin, a-chlordane, trans nonachlor, heptachlor, endosulfan I, endosulfan II, endosulfansulfate, 4,4-DDD, 2,4-DDD, and 2,4-DDE, exceeded background levels for the worm.
iii) Consideration of Potential Ecological Effects
A review of scientific information was also done to further evaluate the test results with respect topotential ecological impacts for the chemicals requiring further evaluation (above reference and forwhich there is no Matrix level or dioxin value).
Metals, Pesticides, and Industrial Chemicals
The potential for ecological effects from the bioaccumulation over reference of aldrin, dieldrin, totalchlordane, total endosulfans, chromium, copper, lead, and nickel was evaluated by comparing to aWater Quality Criterion Tissue Level (WQCTL). The WQCTL is calculated by multiplying the CleanWater Act Section 304(a)(1) Federal water quality criterion chronic value (CV) for the chemical by theempirically determined bioconcentration factor (BCF) for the chemical for a representative marineorganism (Lee, et al., 1989). A BCF is the ratio of the concentration of a contaminant in an organismto the concentration of the contaminant in water. Thus, the WQCTL represents the tissue concentrationthat would be expected in an organism exposed to water containing the chemical at the CVconcentration. This level is set to protect 95% of all tested organisms included in the water qualitycriterion database, thus representing a conservative level of protection (USEPA, 1985b). Table 1 liststhe calculated WQCTLs. Sources of CVs and BCFs are USEPA ambient water quality criteriadocuments (USEPA 1980b, 1980c, 1980d, 1980e, 1980f, 1984a, 1984b, 1985a, 1985c, 1986,1987b and 1992a) and Calabrese (1984)(for silver). Calculations are shown in attachment A. Noneof the WQCTLs were exceeded. Therefore, these bioaccumulation test results do not indicate apotential for undesirable ecological effects.
17
PAHs
For PAHs, a more definitive method is available for evaluating the potential ecological effects. Thismethod makes use of a direct comparison of total PAH tissue residues and the Critical Body Residue(CBR). This approach is supported by a review of the scientific literature. The CBR approachdescribed by McCarty (1991) was used to evaluate the potential impacts of total PAHs accumulated inthe dredged material bioaccumulation test organisms. CBRs are concentrations of chemical residues inorganisms which elicit a deleterious biological response associated with narcosis, which is the primarynon-cancer effect of PAHs. Narcotic responses measured can be acute (e.g., immobilization or death)or chronic endpoints (e.g., reduced reproduction, fecundity or growth). CBRs are represented as theratio of the mass of toxicant to the mass of the organism, such as millimoles or micrograms of toxicantper kilogram (mmole or ug/kg) of organism. For the narcosis endpoint, each molecule of individualPAH congeners is generally equipotent, thus the total PAH concentration is compared to the CBR. For example, a 400 ppb dose of naphthalene would elicit a similar toxicity response as 400 ppb offluorene; if both chemicals are present together at these concentrations, then the dose would equal 800ppb (see Appendix for Table 1).
As shown in Table 1, total PAH levels in tissues from the dredged material bioaccumulation test werebelow levels at which chronic adverse effects might be expected from a narcotic mode of action insensitive aquatic organisms (i.e., fish) as estimated by the CBR.
Effects of Mutagenic, Carcinogenic and Teratogenic PAHs. Applying the uncertainty factor (UF) of10 and a trophic transfer factor of 0.1 described in the Appendix for Table 1, to the no-effects level forBaP calculated from Hannah, et al. (1982), as discussed in the Appendix for Table 1 (8,021 ppb)results in a no-effect level for BaP of approximately 8,000 ppb in benthic tissue, which is considerablygreater than the highest tissue concentration of BaP found in the project bioaccumulation test results(approx. 5 ppb). Even when applying the more conservative steady-state factors for BaP and the othercarcinogenic PAHs derived from McFarland (1995), as identified above, the calculated concentrations(11 ppb for BaP only and 15 ppb for total BaP equivalents) are still below the no-effects level; theproject tissue concentrations would still be below this no-effect level if the higher trophic transfer factor(0.23) reported by McElroy, et al. (1991) was used. Therefore, the most relevant aquatic effectsinformation reviewed indicates that the highest tissue levels accumulated in the dredged materialbioaccumulation tests are below the no-effect level.
Another study that was reviewed considered the carcinogenicity of BaP in rainbow trout resulting fromembryo microinjection (Black, et al., 1988). A statistically significant number of liver neoplasms wasfound at a concentration of approximately 200,000 ppb, with non-significant effects at up to one halfthat concentration. Therefore, using the above across-species UF of 10 and trophic transfer factor of0.1 results in an aquatic no-effect level of 100,000 ppb. Since this is several orders of magnitudeabove the highest tissue concentration of BaP for this project, as described above (and even the highestBaP-equivalent levels for human health, as discussed above), this provides additional support for a
18
finding that the test results do not indicate a potential for undesirable effects to the marine environmentdue to mutagenic, carcinogenic or teratogenic contaminants.
Hall and Oris (1991) reported on experiments that exposed fathead minnows to anthracene duringlong-term exposures and observed adverse effects on reproduction. The paper reported that aconcentration of anthracene in the tissue of the egg in the range of 3,750 to 8,000 ppb resulted in nosignificant effects on egg hatching or survivorship. Using the same approach for accounting for species-to-species uncertainty and food chain transfer described above and in the Appendix for Table 1, yieldsa conservative benthic tissue level of 3,750 ppb. Anthracene tissue concentrations from the projectbioaccumulation tests are well below this level.
iv) Consideration of Potential Carcinogenic and Non-carcinogenic Effects on Human Health
Human health effects screening levels were developed for those chemicals requiring further evaluationwith risk-based methods using conservative estimates of exposure to assess whether thesecontaminants would accumulate to levels in fish and shellfish that could lead to significant adverse effectsto humans. The approach assessed consumption of fish and shellfish to derive conservative estimates ofcontaminant concentrations in benthic tissue protective of human health using USEPA standard risk-assessment assumptions and the process described in the Appendix for Table 1. Table 1, Column 14lists conservative human cancer protection levels in benthic organisms for the chemicals which areknown or suspected carcinogens that would lead to a human cancer risk level of 10-4. When thebioaccumulation test results for those chemicals are adjusted for steady-state (as previously described),the results are below the human cancer protection levels in Table 1.
Since the analysis used conservative methods, the result represents conservative estimates of risk, orwhat are in effect plausible upper-bound estimates. Thus, the true risk is highly unlikely to be greaterthan estimated and could be much lower. None of the human health cancer protection levels wereexceeded in the bioaccumulation test results.
The potential for non-cancer impacts can be expressed as a hazard quotient (HQ), which is the ratio ofthe average daily intake divided by the toxicological reference dose for the chemical. If the HQ is lessthan unity (i.e., 1), an adverse noncarcinogenic effect is highly unlikely to occur. If the HQ exceedsunity, an adverse health impact may occur. The higher the HQ, the more likely that an adversenoncarcinogenic effect will occur as a result of exposure to the contaminant in the dredged material afterplacement. Table 1, Column 15 includes the noncancer protection levels in benthic organisms for thechemicals requiring further analysis that are known to cause, or suspected of causing, non-carcinogeniceffects, that would result in a human HQ equal to unity. Those numbers were derived using theconservative assumptions and source materials described in the Appendix for Table 1. Theconcentrations of the chemicals requiring further evaluation were below the non-cancer protectionlevel.
19
d. Evaluation of Solid Phase Bioaccumulation Results for Dredged Material as a Whole
The evaluation of the testing results performed above indicates that the material does not have apotential to cause undesirable effects to aquatic marine biota due to chronic adverse effects includingsuch effects due to mutagenic, carcinogenic, or teratogenic contaminants, or to human health due tocancer or non-cancer effects from the individual contaminants. That evaluation includes the informationrelevant to the eight factors identified in the Green Book for assessing bioaccumulation test results(USEPA/USACE, 1991). As a final and additional step in the evaluative process, however, it isappropriate to go beyond assessing the individual test results in order to look at the results as a wholeso as to provide an opportunity for an integrated assessment of the individual test results (Figure 1, Boxd). For example, if a number of the individual bioaccumulation test results were only marginally at orbelow the relevant levels of concern, it is appropriate to consider this and the other relevant factors toevaluate whether, taken as a whole, the material is unsuitable for placement at the HARS, even thoughno single individual test result would indicate that outcome.
As indicated above, the following chemicals of concern were bioaccumulated above reference for theclam and/or the worm: PAHs, aldrin, chlordane, dieldrin, trans nonachlor, endosulfan I, endosulfan II,endosulfan sulfate, DDTs, and total PCB bioaccumulated in both the clam and worm; heptachlor,heptachlor epoxide, chromium, copper, lead, mercury, and nickel bioaccumulated only in the clam; noconstituents bioaccumulated only in the worm. In the case of those contaminants with test resultsexceeding reference, and which have regional Matrix levels or dioxin values, none exceeded therelevant Category I value. For the non-Matrix or non-dioxin contaminants with test results thatexceeded reference levels, except for PAHs, only aldrin, chlordane, dieldrin, trans nonachlor,heptachlor, endosulfan I, endosulfan II, and endosulfan sulfate, bioaccumulated in the project sedimentsgreater than background levels. Total PAHs did not bioaccumulate to greater than background levels. Dieldrin bioaccumulated to about 13 times background and aldrin to about six times background in theworm, all others were less than four times background. Although some of the contaminants thatbioaccumulated in the tests can be toxicologically important, in no case did they accumulate totoxicologically important concentrations, even when conservative assumptions were used to evaluatethe test results exceeding reference, as described above. Aldrin, dieldrin, chlordane, trans nonachlor,heptachlor, heptachlor epoxide, endosulfan I, endosulfan II, endosulfan sulfate, PAHs, chromium,copper, lead, mercury, and nickel exhibited bioaccumulation test results above reference which were allbelow the acceptable human health risk range and acceptable aquatic effects range using conservativeapproaches and analyses as described above to evaluate those test results. Thus, an evaluation of thesolid phase bioaccumulation test results for the dredged material as a whole considering the factors inthe Green Book (Figure 1, Box d) would not indicate a different outcome than that shown by theindividual test results themselves; i.e., that the material does not have the potential to cause undesirableeffects due to bioaccumulation.
Taking into account all of the above information, it is determined that this material will not causeundesirable effects due to bioaccumulation as a result of the presence of individual chemicals or of the
20
solid phase of the dredged material as a whole. Therefore, it is concluded that the solid phase of thematerial proposed for HARS placement is classified as Category I under USEPA Region 2/CENANgeneral guidance and meets the requirements of 40 CFR §227.6(c)(3), 227.27(b), and 228.15(d)(6).
VI. OVERALL CONCLUSION ON THE PROPOSED PROJECT
Based upon this review of the results of testing of the sediments proposed for dredging and oceanplacement from Federal Project No. 72, Arthur Kill to Raritan River Cutoff Channel, the material meetsthe criteria for acceptability for ocean placement as described in Sections 227.6, and 227.27 of theRegulations, is Category 1 under USEPA Region 2/CENAN guidance, and is suitable for placement atthe HARS under Section 228.15(d)(6) as Remediation Material.
Placement of this material at the HARS will serve to reduce impacts to acceptable levels and improvebenthic conditions. Sediments in the HARS have been found to be acutely toxic to sensitive benthicmarine organisms in laboratory tests, whereas project sediments used in laboratory acute toxicity testswith the same species were determined not to be toxic. Placement of project material over existingtoxic sediments would serve to remediate those areas for toxicity. In addition, by covering the existingsediments in the site with this project material, surface dwelling organisms will be exposed to sedimentsexhibiting Category I qualities (e.g., 2,3,7,8-TCDD bioaccumulation less than 1 pptr) whereas theexisting sediments exceed these Category 1 levels. Thus, this material meets the requirements forplacement at the HARS as Remediation Material as described in 40 CFR Section 228.15 (d)(6).
TABLE 1 Template Version: 4/7/98
Bioaccumulation Table for NY/NJ Harbor Projects, ALL VALUES ARE IN WET WEIGHT
Project Name: Raritan River to Arthur Kill Cut-Off Channel
Sample I.D. Reference Reference Test Sed. [1] Test Sed. [1] Conv.Fac. Test Sed. Test Sed. Test Sed. Test Sed. Human Health Human Health Ecological Regional
clam/worm SS SS TEQ TEQ Cancer (10E-4) Non-Cancer Background Background FDA Non specific Dioxin
TEQs - non 2,3,7,8-TCDD 0.539421 1.217059 2.13 4.5 [14]
TEQs (all) 0.890421 1.810059 1.73 4.63 10 [13]
22
FOOTNOTES FOR TABLE 1:
*: Carcinogenic PAHs.
#: Levels represent the conservative level of protection for the sum of the related compounds and theirmetabolites.
na: Not Available
1. A “X” in this column indicates that the analyte concentration in the test sediment is statisticallygreater than that of the reference sediment. Means and statistical comparisons weredetermined using conservative estimates of concentrations for analytes that were below thedetection limit (USEPA/CENAN, 1997).
2. Conversion factors from 28-day bioaccumulation results to steady state are obtained from thefollowing sources: for PAH’s: from McFarland, 1995; for Aldrin, Dieldrin, Chlordane, DDT,DDD, and DDE: from Lee and Lincroft, et al, 1994; for PCBs: from Pruell, et al., 1993, andRubinstein, et al.; for 1,4-Dichlorobenzene: from de Bruijn, et al.; for Endosulfan I, EndosulfanII, Endosulfan Sulfate, Heptachlor and trans nonachlor: from Syracuse Research Corporation,1996, and McFarland, 1995; for Heptachlor Epoxide: from Veith, et al., 1979.
3. PAH TEFs taken from: USEPA. 1993; Dioxin TEFs taken from: USEPA. 1989.
4. Toxic equivalence for the carcinogenic PAHs are from USEPA (1993).
5. This value represents the 10-4 cancer risk level for the carcinogenic PAHs. The totalconcentration of carcinogenic PAHs is expressed in BaP equivalents (see discussion in the textof the memo).
6. Cancer risk factor or reference dose are not assigned by USEPA in IRIS (USEPA, 1995).
7. FDA limits are from the USEPA/USACE, 1991.
8. This value represents the benthic level expected to result in a no-effect level for possiblemutagenic and teratogenic effects in fish from exposure to BaP, which is the most toxic PAH.
9. This value represents the non-specific narcosis effects level (see discussion in Appendix). Thisvalue is compared to the sum of all PAHs measured.
23
10. Calculations are included in the appendix to Table 1.
11. Means of five tissue replicates calculated using conservative estimates where analytes were notdetected (USEPA/CENAN, 1992); “U” indicates that all five replicates were not detected.
12. Chemicals for which the bioaccumulation from the dredged material was greater than thereference but less than the Matrix level are indicated by bolding the Matrix level in Column 20.
13. Levels are based on the Regional Dioxin Values.
14. Level is the sum of all dioxin congeners other than 2,3,7,8-TCDD.
15. For this PAH, the no-effect level for possible mutagenic and teratogenic effects in fish isestimated from exposure to BaP, which is the most toxic PAH.
16. Cadmium and mercury do not obey steady state kinetics, therefore, no adjustment is made (seediscussion in the text of the memo).
17. Cancer and non-cancer protection levels, based on inorganic arsenic as contained in EPA’sIRIS database, are not appropriate for evaluating the potential human health impacts of arsenicbioaccumulation from dredged material, and therefore, are not included in Table 1 (seediscussion in Appendix to Table 1).
24
VII. REFERENCES
Abel, , P.D. and V. Axiak. 1991. Ecotoxicology and the marine environment. Ellis Horwood, NewYork, pp. 269.
Abernathy, C.O. and E.V. Ohanian. 1992. Non-carcinogenic effects of inorganic arsenic. Environ.Geochem. Health 14: 35.
Baumann, P.C., W.D. Smith, W.K. Parland. 1987. Tumor Frequencies and Contaminant Concentrationsin Brown Bullheads from an Industrialized River and a Recreational Lake. Transactions of theAmerican Fisheries Society 116:79-86.
Black, JB, A.E. Maccubbin, and C.J. Johnston. 1988. Carcinogenicity of benzo(a)pyrene in rainbow troutresulting from embryo micro injection. Aqua Tox. 13, 297-308.
Breteler, R. (ed.). 1984. Chemical Pollution of the Hudson-Raritan Estuary. NOAA TechnicalMemorandum NOS OMA 7. National Oceanic and Atmospheric Administration, National OceanService. Rockville, Md.
Brown B., J. Neff. 1993. Bioavailability of Sediment-Bound Contaminants to Marine Organisms. Report#PNL-8761 UC-000 by Battelle/Marine Sciences Laboratory prepared for the National Ocean PollutionProgram Office, NOAA.
Bryan, G.W. and W.J. Langston. 1992. Bioavailability, accumulation and effects of heavy metals insediments with special reference to United Kingdom estuaries: A review. Environmental Pollution 76:89-131.
Calabrese, A. 1984. “Effects of Long Term Exposure to Silver and Copper on Growth, Bioaccumulationand Histopathology in the Blue Mussel (Mytilus edulis).” Mar. Envir. Res. 1, 253-274.
Call, D.J., L.T. Brooke, M.L. Knuth, S.H. Poirler, and M.D. Hoglund. 1985. Fish subchronic toxicityprediction model from industrial organic chemicals that produce narcosis. Environ. Tox. Chem. 4, 335-341.
CENAN. 1998. Sampling/Testing Plan for Federal Project No. 72, Arthur Kill to Raritan River CutoffChannel, New York District Corps of Engineers.
CENAN. 1999. Memorandum from M. Greges: for Chief, Technical Support Section, Subject:ADDAMS Model Memo for the Record: Raritan River to Arthur Kill Cutoff Channel. Dated 11February 1999.
Charles, JB and J. Muramoto. 1990. Assessment of Contaminants in Sediment and Biota at the MudDump Site, New York Bight. Report No. SAIC-91/7608&256 by Science Applications International Corp.(SAIC) for USEPA - Region 2.
25
Corner, E.D.S., R.P. Harris, K.J. Whittle, and P.R. Mackie. (1976). Hydrocarbons in marine zooplanktonand fish. In: Effects of Pollutants on Aquatic Organisms, Lockwood APM (ed), pp. 71- 106. Cambridge University Press, Cambridge, England.
de Bruijn, J., Busser, F., Seinen, W., and Hermens, J. 1989. Determination of octanol/water partitioncoefficients for hydrophobic organic chemicals with the “slow stirring” method. Environ. Toxicol.Chem., 8:499-512.
Dethlefsen, V. 1978. Uptake, retention, and loss of cadmium by brown shrimp. 1978. Meeresforschung, 26:137 (reported in Giesy et al. 1980).
Feroz, M. And M.A.Q. Khan, 1979. Fate of 14C-cis-chlordane in goldfish, Casassius auratus (L.). Bulletin of Environmental Contamination and Toxicology 23:64-69.
Finger, E.F., E.F. Little, M.G. Henry, J.F. Fairchild and T.P. Boyle. 1985. Comparison of laboratory andfield assessment of fluorene - Part 1: effects of fluorene on survival, growth, reproduction, and behaviorof aquatic organisms in laboratory tests. In: Validation and Predictability of Laboratory Methods forAssessing the Fate and Effects of Contaminants in Aquatic Ecosystems. ASTM STP865, Philadelphia,pp. 120-133.
Fowler, S.W. 1982. Biological transfer and transport processes. In: Pollutant Transfer and Transport inthe Sea. Vol. II, ed. G. Kullengerg, pp. 1-65. CRC Press, Boca Raton, Florida.
Giesy, J.P., Bowling, J.W., and Kania, H.J. 1980. Cadmium and zinc accumulation and elimination byfreshwater crayfish. Arch. Environm. Contam. Toxicol., 9:683-697.
Gobas, F. 1993. A Model for predicting the bioaccumulation of hydrophobic organic chemicals in aquaticfood webs: application to Lake Ontario. Ecological Modeling. 69,1-17.
Hall, A.T. and J.T. Oris. 1991. Anthracene reduces reproductive potential and is maternally transferredduring long-term exposure in fathead minnows. Aquatic Toxicol. 19,249-264.
Hannah, JB, J.E. Hose, M.L. Landolt, B.S. Miller, S.P. Felton, and W.T. Iwaoka. 1982. Benzo(a)pyrene-induced morphologic and developmental abnormalities in rainbow trout. Arch. Environ.Contam. Toxicol. 11,167-171.
Holcombe, G.W., G.L. Phipps, and J.T. Fiandt. 1983. Toxicity of selected priority pollutants to variousaquatic organisms. Ecotoxicol. Environ. Safety . 7,400-409.
Hose, J.E., J.B. Hannah, M.L. Landolt, B.S. Miller, S.P. Felton, and W.T. Iwaoka. 1981. Uptake ofbenzo(a)pyrene by gonadal tissue of flatfish (family Pleuronectidae) and its effects on subsequent eggdevelopment. J. Toxicol. Environ. Health. 7:991-1000.
Hose, J.E., J.B. Hannah, D. Dijulio, M.L. Landolt, B.S. Miller, W.T. Iwaoka, and S.P. Felton. 1982. Effects of benzo(a)pyrene on early development of flatfish. Arch. Environ. Contam. Toxicol. 11:167-171.
26
Hrudey, S.E., W. Chen, and C.G. Rousseaux. 1996. Bioavailability in environmental risk assessment. CRC Press, Inc., Boca Raton, Florida, pp.294.
Jarman, W; K. Hobson, W. Sydeman, C. Bacon and E. McLaren. 1996. Influence of Trophic Positionand Feeding Location on Contaminant Levels in the Gulf of the Farallones Food Web Revealed by StableIsotope Analysis. Environmental Science & Tech. 30(2):654-660.
Landrum P.E., B.J. Eadie, and W.R. Faust. 1988. Toxicity and toxicokinetics for a mixture of sedimentassociated polycyclic aromatic hydrocarbons to the amphipod Pontoporeia hoyi. In: Poster Abstracts,SETAC Ninth Annual Meeting, Society of Environmental Toxicology and Chemistry, Washington D.C. p.29.
Lee, R.F., J. Stolzenbach, S. Singer, and K.R. Tenore. 1981. Effects of crude oil on growth and mixedfunction oxygenase activity in polychaetes, Nereis sp. In: Biological Monitoring of Marine Pollutants. Ed. Vernburg, F.A. Calabrese, F. Thurberg, and W. Vernberg. Academic Press. pp. 323-334.
Lee, H., II, Boese, B.L., Pelletier, J., Winsor, M., Specht, D.T., and Randall, R.C., 1989. GuidanceManual: Bedded Sediment Bioaccumulation Test. USEPA Pacific Ecosystem Branch BioaccumulationTeam, Newport, OR.
Lee, H., II, Lincroft, A, et al, 1994. Ecological Risk Assessment of the Marine Sediments at the UnitedHeckathorn Superfund Site. USEPA Pacific Ecosystem Branch Bioaccumulation Team, Newport, OR.,USEPA Region IX, San Francisco, CA.
Lunde, G. 1977. Occurrence and transformation of arsenic in the marine environment. EnvironmentalHealth Perspectives 19: 47-52.
McCarty, L.S. 1986. The relationship between aquatic toxicity QSARs and bioconcentration for someorganic chemicals. Environ. Toxicol. Chem. 8:1071-1080.
McCarty, L.S. 1991. Toxicant body residues: implications for aquatic bioassays with some organicchemicals. In: Aquatic Toxicology and Risk Assessment: Fourteenth Volume, ASTM STP 1124; M.A.Mayes and M.G. Barron, Eds., American Society for Testing and Materials, Philadelphia; pp. 183-192.
McCarty, L.S., D. MacKay, A.D. Smith, G.W. Ozburn, and D.G. Dixon. 1992. Residue-basedinterpretation of toxicology bioconcentration QSARs from aquatic bioassays: neutral narcotic organics. Environ. Tox. Chem. 11: 917-930. McElroy A.E., J.M. Cahill, J.D. Sisson, and K.M. Kleinow. 1991. Relative bioavailability and DNAadduct formation of Benzo[a]pyrene and metabolites in the diet of the winter flounder. J. Comp. Biochem. Physiol. 100, 12-29.
McElroy. A.E. and J.D. Sisson. 1989. Trophic transfer of Benzo[a]pyrene metabolites between benthicmarine organisms. Mar. Environ. Res. 28, 265-269.
27
McElroy, A.E., J.M. Cahill, J.D. Sisson, and K.M.Kleinow. 1991. Relative bioavailability and DNAadduct formation of Benzo[a]pyrene and metabolites in the diet of the winter flounder. J. Comp.Biochem. Physiol. 100C:1-2,29-33.
McFarland, V.A. 1995. Evaluation of Field-Generated Accumulation Factors for Predicting theBioaccumulation Potential of Sediment-Associated PAH Compounds. USACE - WES Technical ReportD-95-2. July 1995.
Meador J.P., J.E. Stein, W.L. Reichert, and U.Varanasi. 1995. Bioaccumulation of polycyclic aromatichydrocarbons by marine organisms. Rev. Environ. Contam. Toxicol. 143, 79-165.
Naqvi, S.M., Flagge, C.T., and Hawkins, R.L. 1990. Arsenic uptake and depuration by Red Crayfish,Procambarus clarkii, exposed to various concentrations of monosodium methanearsonate (MSMA)herbicide. Bull. Environ. Contam. Toxicol., 45:94-100.
O’Connor, J.M., A.R.Schnitz, and K.A. Squibb. 1988. In vivo kinetics of Benzo[a]pyrene and 7,12-dimethylbanz[a]anthracene assimilation and metabolism in rainbow trout. Mar. Environ. Res. 24:63-67.
Oladimeji, A.A., Qadri, S.U., and deFreitas, S.W. 1984. Long-term effects of arsenic in rainbow trout,Salmo gairdneri. Bull. Environ. Contam. Toxicol., 32:732-741.
Parrish, P.R., S.C.Schimmel, D.J. Hansen, J.M. Patrick, J. Forester. 1976. Chlordane: Effects on SeveralEstuarine Organisms. Journal of Toxicology and Environmental Health , 1:485-494.
Pruell, R.J., N.I. Rubinstein, B.K. Taplin, J.A. LiVolsi, R.D. Bowen. 1993. Accumulation ofpolychlorinated organic contaminants from sediment by three benthic marine species. Arch. Envir.Contam. Toxicol. 24, 290-297.
Rice, D.R., M.M. Babcock, C.C. Brodersen, J.A. Gharrett and S. Korn. 1987. Uptake and depuration ofaromatic hydrocarbons by reproductively ripe pacific herring and the subsequent effect of residues on egghatching and survival. In: Pollution Physiology of Estuarine Organisms. Ed. Vernberg, W., A.Calabrese, F. Thruberg, and F. Vernberg. University of South Carolina Press. pp. 139-154.
Riedel, G.F., Sanders, J.G., and Osman, R.W. 1987. The effect of biological and physical disturbanceson the transport of arsenic from contaminated estuarine sediments. Estuarine, Coastal and ShelfScience, 25:693-706.
Rubinstein, N.I., Lores, E., and Gregory, N.R. 1983. Accumulation of PCBs, mercury and cadmium byNereis virens, Mercenaria mercenaria and Palemonetes pugio from contaminated harbor sediments. Aquatic Toxicol., 3:249-260.
Rubinstein, N. I., R. J. Pruell, B. K. Taplin, J. A. LiVolsi, and C. B. Norwood. 1990. Bioavailability of2,3,7,8-TCDD, 2,3,7,8-TCDF, and PCBs to marine benthos from Passaic River sediments. Chemosphere, 20, 1097-1102.
28
Squibb, K.S., J.M. O’Connor, and Kneip, T.J. 1991. Toxics Characterization Report, Module 3.1. Report prepared by Institute of Environmental Medicine, NY Univ. Medical Center for the NY/NJHarbor Estuary Program.
Steimle, F.W., V.S. Zdanowicz, S.L. Cuneff and R. Terranova. 1994. Trace metal concentrations incommon benthic macrofaunal prey form the New York Bight. US National Marine Fisheries Service,NOAA. Marine Pollution Bulletin. 28, 12, pp. 760-765.
Suedel, B.C., J.A. Boraczek, R.K. Peddicord, P.A. Clifford, and T.M. Dillon. 1994. Trophic transfer andbiomagnification potential of contaminants in aquatic ecosystems. Reviews of EnvironmentalContamination and Toxicology 136: 21-89.
Sweeney, B., D. Funk and L. Standley. 1993. Use of the Stream Mayfly Cloeon Triangulifer as aBioassay Organism: Life History Response and Body Burden Following Exposure to TechnicalChlordane. Environ. Tox. and Chem. 12:115-125.
Thomas, L.M. 1987. Letter from Lee M. Thomas, Administrator, U.S. Environmental Protection Agencyto Honorable Henry A. Waxman, Chairman, Subcommittee on Heath and the Environment, Committee onEnergy and Commerce, House of Representatives. May 29, 1987.
USACE. 1981. Final Interpretive Guidance for Bioaccumulation of Petroleum Hydrocarbon, DDT,Cadmium, and Mercury in the New York Bight. Memorandum from North Atlantic Division Corps ofEngineers to G.R. Tobertson, Deputy Director of Civil Works, Dept. of Army.
USACE. 1994. Bioaccumulation Guidance Values for Selected Contaminants in Sediments and Biota ofthe Sandy Hook Reference Site for the New York Bight Apex Mud Dump Site. (draft) Report by Corpsof Engineers Waterways Experiment Station (WES) for the New York District Corps.
USACE. 1995. Trophic transfer and biomagnification potential of contaminants in aquatic ecosystems. In: Environmental Effects of Dredging Technical Notes. EEDP-01-33. USACE WaterwaysExperiment Station (WES).
USEPA/CENAN. 1992. Guidance for Performing Tests on Dredged Material Proposed for OceanDisposal. New York District Corps of Engineers, U.S. Environmental Protection Agency -Region 2.
USEPA/CENAN. 1997. (Joint Memorandum) Ocean Disposal of Dredged Material Clarification of TwoProcedural Elements of Interagency Coordination Between USEPA Region 2 and the New York District,USACE-Treatment of Non-Detects, Chemical Data, and Rules and Responsibilities in Preparation ofOcean Disposal Regulatory Compliance Memorandum.
USEPA/USACE. 1991. Evaluation of Dredged Material Proposed for Ocean Disposal - TestingManual. (Green Book). EPA - 503/8-91/001.
29
USEPA. 1980a. Water quality criteria documents: availability. Federal Register, Vol. 45, No. 231. November 28, 1980.
USEPA. 1980b. Ambient Water Quality Criteria for Aldrin/Dieldrin; EPA 440/5-80-019; December 1980.
USEPA. 1980c. Ambient Water Quality Criteria for Chlordane; EPA 440/5-80-027; October 1980.
USEPA. 1980d. Ambient Water Quality Criteria for Heptachlor; EPA 440/5-80-052; October 1980.
USEPA. 1980e. Ambient Water Quality Criteria for Endosulfan; EPA 440/5-80-046; October 1980.
USEPA. 1980f. Ambient Water Quality Criteria for Dichlorobenzenes; EPA 440/5-80-039; October 1980.
USEPA. 1984a. Ambient Water Quality Criteria for Lead - 1984; EPA 440/5-84-027; January 1985.
USEPA. 1984b. Ambient Water Quality Criteria for Copper - 1984; EPA 440/5-84-031; January 1985.
USEPA. 1985a. Ambient Water Quality Criteria for Chromium - 1984; EPA 440/5-84-029; January 1985.
USEPA. 1985b. Guidelines for Deriving Numerical National Water Quality Criteria for the Protection ofAquatic Organisms and Their Uses. NTIS # PB85-227049.
USEPA. 1985c. Ambient Water Quality Criteria for Arsenic - 1984; EPA 440/5-84-033; January 1985.
USEPA. 1986. Ambient Water Quality Criteria for Nickel - 1986; EPA 440/5-86-004; September 1986.
USEPA. 1987a. National primary drinking water regulations - synthetic organic chemicals; monitoring forunregulated contaminants; final rule. Federal Register, Vol. 52, No. 130, 25690. July 8, 1987.
USEPA. 1987b. Ambient Water Quality Criteria for Zinc - 1987; EPA 440/5-87-003.
USEPA. 1988. Guidance for state implementation of water quality standards for CWA section303(c)(2)(B). Federal Register, Vol. 54, No. 346. November 12, 1988.
USEPA. 1989. Interim Procedures for Estimating Risks Associated with Mixtures of ChlorinatedDibenzo-p-Dioxins and -Dibenzofurans (CDDs and CDFs) and 1989 Update. U.S. EnvironmentalProtection Agency, Risk Assessment Forum, Washington, DC. EPA/625/3-89/016. USEPA. 1991. National Primary Drinking Water Regulations; Final Rule. 40 CFR Part 141. January 30,1991.
USEPA. 1992a. Draft Ambient Water Quality Criteria for Silver.
USEPA. 1992b. Water quality standards; establishment of numeric criteria for priority toxic pollutants;states compliance. Federal Register, Vol. 57: 60848.
30
USEPA. 1993. Provisional Guidance for Qualitative Risk Assessment of Polycyclic AromaticHydrocarbons. EPA/600/R-93/089.
USEPA. 1994. Final clarification of suspended particulate phase bioaccumulation testing requirementsfor material dumped in ocean waters. Federal Register Vol. 59: 52650. October 18, 1994.
USEPA. 1995. On-Line. Integrated Risk Information System (IRIS). Cincinnati, OH: Office ofResearch and Development, Environmental Criteria and Assessment Office.
USEPA. 1996a. Ocean dumping testing requirements; final rule. Federal Register, Vol. 61, No. 190,51196. September 30, 1996.
USEPA. 1996c. Memo to File from A. Lechich. Subject: Issues Regarding Exposure and UptakeMechanisms for PAHs. (Discussion with V. McFarland). December 5, 1996.
USEPA. 1996d. Memo to File from A. Lechich. Subject: Discussion of PAHs With Regard to EastRiver Memo. (Discussion with D. Hansen). December 5, 1996.
USEPA. 1996e. Memo to File from C. Vogt. Subject: Acceptable Levels of Lead: East RiverBioaccumulation Tests. December 13, 1996.
USEPA. 1996f. Battelle Body Burden Study. Report prepared by Battelle Ocean Sciences, Duxbury,MA, for USEPA - Region II.
USEPA. 1997a. Memo to File from A. Lechich. Subject: Summary of Dioxin Risk Evaluation Approach.March 15, 1997.
USEPA. 1997b. Contaminants in Polychaetes from the Mud Dump Site and Environs. March 4, 1997.Report prepared by Battelle Ocean Sciences, Duxbury, MA, for USEPA - Region II.
USEPA. 1997c. Supplemental to the Environmental Impact Statement on the New York DredgedMaterial Disposal Site Designation for the Designation of the Historic Area Remediation Site (HARS) inthe New York Bight Apex. U.S. Environmental Protection, Region 2, New York, May 1997.
Varanasi U., J.E. Stein, and M. Nishimoto. 1989. Biotransformation and disposition of polycyclicaromatic hydrocarbons (PAH) in fish. In: Varanasi U. (ed) Metabolism of Polycyclic AromaticHydrocarbons in the Aquatic Environment. CRC Press, Boca Raton, Fl, pp 94-149.
V-Balogh, K., and Salanka, J. 1984. The dynamics of mercury and cadmium uptake into different organsof Anodonta cygnea L. Water res., 18(11):1381-1387.
Veith, G. D., DeFoe, D.L., and Bergstedt, B.V. 1979. Measuring and estimating the bioconcentrationfactor of chemicals in fish. J. Fish. Res. Board Can., 36(9):1040-1048.
Verschueren, K. 1983. Handbook of Environmental Data on Organic Chemicals, second edition. VanNostrand Reinhold Company.
31
Ward, G.S., P.R. Parrish, and R.A. Rigby. 1981. Early life stage toxicity tests with a saltwater fish:Effects of eight chemicals on survival, growth, and development of sheepshead minnows (Cyprinidonvariegatus). J. Toxicol. Environ. Health . 8:225-240.
Whittle K.J., J. Murray, P.R. Mackie, R. Hardy, and J. Farmer. 1977. Fate of hydrocarbons in fish. In:Petroleum Hydrocarbons in the Marine Environment. Cons. Intern. Explor. Mer. Vol. 171, McIntyreA.D. and Whittle K.J. (eds), pp 139-142. Charlottenlund Slot, Denmark.
WHO. 1993. Guidelines for Drinking Water Quality. World Health Organization. Geneva.
A-1
Appendix for Table 1
I. CONSIDERATION OF ECOLOGICAL EFFECTS A. Potential for ecological effects based on Water Quality Criteria (Column 19)
The potential for ecological impacts due to bioaccumulation of several compounds of concern wasevaluated by calculating a Water Quality Criterion Tissue Level (WQCTL). The WQCTL is calculatedby multiplying the Clean Water Act Section 304(a)(1) Federal water quality criterion chronic value(CV) for the chemical by the empirically determined bioconcentration factor (BCF) for the chemical fora representative marine organism (Lee, et al., 1989). A BCF is the ratio of the concentration of acontaminant in an organism to the concentration of the contaminant in water. Thus, the WQCTLrepresents the tissue concentration that would be expected in an organism exposed to water containingthe chemical at the CV concentration. This level is set to protect 95% of all tested organisms includedin the water quality criterion database, thus representing a conservative level of protection (USEPA,1985b). Table 1 lists the calculated WQCTLs. Sources of CVs and BCFs are from USEPA ambientwater quality criteria documents (USEPA 1980b, 1980c, 1980d, 1980e, 1980f, 1984a, 1984b,1985a, 1985c, 1986, 1987b and 1992a) and Calabrese (1984)(for silver). Calculations are shown inattachment A.
Several pesticides were evaluated based on the sum of their primary constituents and associatedmetabolites (e.g., total chlordane, total endosulfan, and total DDT). Alpha(trans)-chlordane, transnonachlor, heptachlor and heptachlor epoxide represent the primary components of technicalchlordane and its metabolites found in the tissue of aquatic organisms (Jarman, et. al., 1996;Verschueren, 1983; Sweeney, et. al., 1993). These constituents are summed as total chlordane as isconsistent with current practice for chlordane (Jarman, et. al., 1996) and total DDT. The WQCTL fortotal chlordane was calculated using the WQC for chlordane as a conservative level of protection. While water quality criteria exist, and WQCTLs can be calculated, for heptachlor (133 ppb) andchlordane (64 ppb), the sum total chlordane is compared to the WQCTL for chlordane in order to bemore environmentally conservative. The chlordane WQCTL provides a conservative level ofprotection as indicated by published residue effects levels (Sweeney, et. al., 1993; Bauman, et. al.,1987; Feroz, et. al., 1979; Parrish, et. al., 1976). Consistent with the above approach, the tissueconcentration for endosulfan I, endosulfan II and endosulfan sulfate were also summed as totalendosulfan and compared to the WQCTL for total endosulfan.
The WQCTLs were also calculated for all metals of concern which don’t have Matrix values. For totalchromium, the WQCTL was calculated based on chromium(VI), which is substantially more toxic thanchromium (III) and elemental chromium in order to provide a conservative level of environmentalprotection. B. Potential for ecological effects based on PAH toxicity (Column 19).
A-2
The Critical Body Residue (CBR) approach described by McCarty (1991) was used to derive valuesfor use in evaluating the potential impacts of PAHs accumulated in the dredged materialbioaccumulation test organisms. CBRs are concentrations of chemical residues in organisms whichelicit a deleterious biological response associated with narcosis, which is the primary non-cancer effectof PAHs. Narcotic responses measured can be acute (e.g., immobilization or death) or chronicendpoints (e.g., reduced reproduction, fecundity or growth). CBRs are represented as the ratio of themass of toxicant to the mass of the organism, such as millimoles or micrograms of toxicant per kilogram(mmole or ug/kg) of organism. For the narcosis endpoint, each molecule of individual PAH congenersare generally equipotent, thus the total PAH concentration is compared to the CBR. For example, a400 ppb dose of naphthalene would elicit a similar toxicity response as 400 ppb of fluorene; if bothchemicals are present together at these concentrations, then the dose would equal 800 ppb.
McCarty (1991) states that an average critical body residue of 400,000 - 1,200,000 ppb can be usedas an estimate for acute effects for a narcosis-producing chemical (e.g., PAHs) on fish populations. (Note: McCarty reports the CBR in units of millimoles per kilogram; this value has been converted toppb for PAHs using the average molecular weight of the PAHs analyzed in the bioaccumulation test). Chronic effect critical body residues can be estimated by applying an acute to chronic ratio of 10 to theacute CBR (McCarty, 1986; Call, et al., 1985). Therefore, the chronic critical body residue for PAHscan be estimated at 40,000 - 120,000 ppb of PAHs in organism tissue, and Table 1 thus uses the40,000 ppb level.
These CBRs were based on fish data. The use of CBRs based on fish toxicity represents aconservative estimate of potential toxicity due to exposure to dredged material because: (1) it isextremely unlikely that a fish would get its whole diet from the HARS; and (2) fish are generally moresensitive than the benthic organisms in direct contact with the dredged material placed at the HARS(e.g., Landrum, et al. (1988) estimated an acute CBR for crustaceans of 800,000 ppb - 42,000,000ppb).
C. Potential ecological impacts of mutagenic, carcinogenic and teratogenic PAHs (Column 19)
USEPA and the USACE reviewed eleven scientific journal articles to obtain information about thepotential for adverse effects to the marine environment due to the observed bioaccumulation of PAHs inthe marine worm, Nereis virens, and the clam, Macoma nasuta. These articles reported the results oflaboratory experiments that sought to relate the concentration of a contaminant(s) in water, as injecteddoses, or tissue concentrations, to mutagenic, carcinogenic, teratogenic and/or reproductive effects tofish. These studies all used fish species which are considered to be among the most sensitive organismsin the marine environment to exhibit the above effects (USEPA, 1996c). In addition, most of thesestudies focussed on the PAH most believed to cause such effects for which there is data,benzo(a)pyrene (BaP). One study (Breteler, 1984), discussed the possible sources and distribution ofPAHs in the Hudson/Raritan estuary, and ranked the threat of PAHs to aquatic biota and humans. Themain threat was believed to be carcinogenicity, with a greater threat ranking assigned to humans thanbiota. However, Breteler (1984) did not provide specific effects-based levels that could be used in the
A-3
following analysis. Two articles evaluated the effects of crude oil, and thus were not useful forevaluating the effects of specific PAHs measured in the bioaccumulation test (Rice, et al., 1987; Lee, etal., 1981). Three studies considered the effects of specific PAHs, but did not synoptically measuretissue concentrations in the organisms (Ward, et al., 1981; Holcombe, et al., 1983; Finger, et al.,1985) and were not used, because the lack of tissue data for these studies makes their utility inevaluating the tissue concentration resulting from the dredged material bioaccumulation tests highlyuncertain.
The remaining five papers reported measured tissue concentrations and observed reproductive effectsin organisms exposed to PAH-spiked water. One article reported the tissue concentrations of adultfish and the observed effect on survival and health of the fish’s offspring. Hose, et al. (1981) reportedthat adult English sole injected with benzo(a)pyrene (BaP) accumulated the chemical in the gonad andmature gametes. The amount of BaP taken up by the ovary ranged from 16,800 to 49,700 ppb. Twosamples of ripe eggs contained 51,200 and 263,000 ppb of BaP and its metabolites. No adverseeffects were reported for these concentrations. Hose, et al. (1981) also reported the results ofinjecting female flathead sole with BaP. Adverse effects to egg hatching success were reported foreach female. The paper does not report tissue concentrations in either the parent fish or the egg of theflathead sole. Effects on reproductive success were reported but could only be correlated with theexternal dose injected into the parent. Therefore, since concentrations and effects were not synoptic inthis report, it was not useful in the evaluation of the dredged material bioaccumulation results.
Three papers reported the results of experiments which measured fish egg or alevin concentrations ofBaP and associated reproductive or carcinogenic effects (Hose, et al., 1982; Hannah, et al., 1982;Black, et al., 1988). Hose, et al. (1982) exposed three species of sole, sand sole, English sole, andflathead sole, to BaP-spiked water. Tissue concentrations of 2,100 ppb were measured in sand soleon day 6 (24 hours after hatching) and were associated with reduced hatching success. However, wedid not consider the results to be appropriate for use in setting effects levels because they may havebeen compromised by the methods of replication used in the experimental design.
Hannah, et al. (1982) estimated a concentration of BaP in tissue that caused abnormalities indevelopment of rainbow trout eggs, using aqueous exposures and actual measured tissue concentrationsin alevin tissues. An exposure to a 2.4 ppb mean aqueous BaP concentration accumulated an averageof 12,340 ppb in alevins. This concentration was associated with an increase in percentage ofabnormalities from approximately 6% at lower water concentrations (0.08, 0.21, 0.37 and 1.48 ppb)to approximately 13% at higher concentrations. From 0.08 to 1.48 ppb in the water, there were noincreasing effects exhibited, therefore, the effects were apparently “real” (i.e., significantly greater thanthe threshold effect level of 6%) only at the aqueous 2.4 ppb concentration. The Hannah, et al.,(1982)study is considered the most reliable study for this evaluation since it used exposure series andmeasured tissue concentrations associated with observed effects, and therefore allows for thecalculation of a no-effects level directly from the measured results.
In applying these studies to evaluations of dredged material, consideration must be given to uncertaintiesin converting these kinds of results to concentrations protective of other biota. Three uncertainties
A-4
needing to be considered are: (1) those associated with converting effect to no-effect concentrations,(2) across-species uncertainties, and (3) uncertainties in estimating the dose of contaminants to whichthe organism is exposed. These uncertainties are discussed below.
With respect to uncertainty when converting effect to no-effect concentrations, an uncertainty factor ofone order of magnitude is often used when only an effect measure is reported. However, in Hannah, etal.(1982), the no-effect level can be estimated to be the next lowest concentration below the lowest-observed effect level, since the range of concentrations below this level did not exhibit significantlydifferent responses. In this case, the no-effect level occurred at the water exposure concentration of1.48 ppb. Although a tissue concentration was not measured at the 1.48 ppb water concentration, itcan be calculated from the concentration measured at the effect level (i.e., the no-effect waterconcentration (1.48 ppb) is close to 65 percent of the observed effect concentration (2.4 ppb) so theno-effect tissue concentration should be about 65 percent of the lowest-observable effect tissueconcentration (0.65 x 12,340 ppb = 8,021 ppb)). Thus, a factor to adjust these data from lowestobserved effect tissue concentration to the calculated no-observed effect tissue concentration isobtained directly from the data.
There can also be uncertainty as to the proximity to the site of toxic action in the organism that a doseor concentration is measured, and with respect to species-to-species variability. Hannah (1982)reported dose concentrations in the tissue and, therefore, there is no need to account for variabilityassociated with the large uncertainties encountered in typical water-only exposure studies where theactual concentration at the site of toxic action is unknown. When measured in the tissues, as was donefor this project, concentrations of narcotic chemicals causing effects (i.e., critical body residues, CBRs)in aquatic organisms are reported to range only from 1.4 to 21 umoles/g wet weight (a factor of aboutone order of magnitude) for organisms as diverse as insects, crustaceans, and fish (McCarty, et al.1992). Therefore, from a tissue concentration perspective, the species-to-species uncertainty factorappropriate for both total PAHs operating as narcotics and individual PAHs having teratogenic effectswould be one order of magnitude, or a value of 10 (USEPA, 1996d).
In summary, a factor of 10 (representing species to species uncertainty) is an appropriate UF to use inthese evaluations. Also, as described in memo SectionV, subsection C2(c)(i) above, Brown and Neff(1993) show that trophic transfer of PAHs up the food chain to fish decrease tissue levels by over anorder of magnitude. Given this data and the fact that these studies included fish that spent 100% of theirtime feeding in the test sediment, whereas this would be highly unlikely to occur at an ocean site, atrophic transfer factor of 0.1 is used in this analysis. Applying this UF of 10 and a trophic transferfactor of 0.1 to the no-effects level for BaP calculated from Hannah, et al. (1982), as discussed above(8,021 ppb) results in a no-effect level for BaP of approximately 8,000 ppb in benthic tissue.
II. CONSIDERATION OF POTENTIAL EFFECTS ON HUMAN HEALTH (Columns14 and 15)
A-5
Human effects screening levels were developed with risk-based methods using conservative estimatesof exposure to assess whether these contaminants would accumulate to levels in fish and shellfish thatcould lead to significant adverse effects to humans. The approach assessed consumption of fish andshellfish to derive conservative estimates of contaminant concentrations in benthic tissue protective ofhuman health using the following USEPA standard risk-assessment assumptions: a 70-kilogram adulteats 6.5 grams of fish and shellfish per day over a 70-year lifetime. This assessment consideredpotential for both cancer and non-cancer effects in humans. USEPA IRIS (USEPA, 1995) and effectsinformation from USEPA’s National Toxics Rule (USEPA, 1992b) were used in the human healthassessment to calculate acceptable levels in fish and shellfish to protect human health. Trophic transferfactors, as discussed earlier, were then used to convert these fish and shellfish levels into benthic tissueconcentrations.
For regulatory purposes, USEPA utilizes 10-4 to 10-6 (one in ten thousand to one in one million) as anacceptable incremental risk range for activities with potential for causing cancer in human beings(USEPA, 1980a; USEPA, 1988; USEPA, 1987a; Thomas, 1987; USEPA, 1991). USEPA considersa cancer risk within this range to be safe and protective of public health. This is supported by theWorld Health Organization Guidelines for Drinking Water Quality (WHO, 1993), where it selected a10-5 guideline value, and then explained that the application could vary by a factor of ten (e.g., 10-4 to10-6). Since this analysis uses conservative methods, the results represent conservative estimates ofrisk, or what are in effect plausible upper-bound estimates. Thus, the true risk is highly unlikely to begreater than estimated and could be much lower.
Table 1, Column 14 lists human cancer protection levels in benthic organisms for chemicals which areknown or suspected carcinogens that would lead to a human cancer risk level of 10-4. For PAHs, thisanalysis used BaP-equivalents derived from the toxic equivalence factor for each carcinogenic PAH(from USEPA (1993); note: these factors are listed in Column 11 of Table 1 for each of thecompounds).
The potential for non-cancer impacts can be expressed as a hazard quotient (HQ), which is the ratio ofthe average daily intake divided by the toxicological reference dose for the chemical. If the HQ is lessthan unity (e.g., 1), an adverse noncarcinogenic effect is highly unlikely to occur. If the HQ exceedsunity, an adverse health impact may occur. The higher the HQ, the more likely that an adversenoncarcinogenic effect will occur as a result of exposure to the contaminant in the dredged material afterplacement. Table 1, Column 15 lists noncancer protection levels in benthic organisms for the chemicalsthat are known to cause, or suspected of causing, non-carcinogenic effects, that would result in ahuman HQ equal to unity. Those numbers were derived using the conservative assumptions and sourcematerials described in the introductory paragraph to this section.
For the following compounds, the following special considerations were used in evaluating the results inTable 1.
Metals
A-6
No reference dose has been established for lead. EPA has adopted a blood lead level of 10ug/dl asthe level of concern and EPA policies are that regulatory programs should seek to minimize the numberof children with blood lead levels above a target of 10 ug/dl (Final Rule for Lead and CopperNPDWR, 56FR26468, June 7, 1991), and this value was used to calculate the effects level in Table 1(see USEPA 1996e).
When interpreting the importance of arsenic tissue concentrations for human health, consideration wasgiven to the arsenic form present ( i.e., inorganic vs. organic). Arsenic is found in marine organisms asan organic complex which includes such compounds as arsenobetaine and arsenocholine (Abel andAxiak, 1991). Organic arsenic in the tissues of aquatic organisms is not metabolized by predators orhumans and is readily eliminated from the body through excretion (Hrudey et al., 1995). As a result,the toxicity of organic arsenic ingested from seafood is low and appears to pose no significant hazard(Abernathy and Ohanian, 1992). For this reason, cancer and non-cancer protection levels, based oninorganic arsenic as contained in EPA’s IRIS database, are not appropriate for evaluating the potentialhuman health impacts of arsenic bioaccumulation from dredged material, and therefore, are not includedin Table 1.
Pesticides
Alpha(trans)-chlordane, trans nonachlor, heptachlor and heptachlor epoxide represent the primary components of technical chlordane and its metabolites found in the tissue of aquatic organisms (Jarman,et. al., 1996; Verschueren, 1983; Sweeney, et. al., 1993). These constituents are summed as totalchlordane as is consistent with current practice for chlordane (Jarman, et. al., 1996) and otherpesticides (e.g., total DDT). Total chlordane is evaluated using the 10-4 cancer risk level and non-cancer level for heptachlor epoxide, which has the greatest potency of the chlordane constituents ormetabolites. Similarly, endosulfan I, endosulfan II, and endosulfan sulfate are summed and the total iscompared to the conservative non-cancer protection level for endosulfan.
PAHs
For PAHs, this analysis used BaP-equivalents derived from the toxic equivalence factor for eachcarcinogenic PAH (from USEPA (1993); note: these factors are listed in column 11 of Table 1 for eachof the compounds).
A-7
Attachment A:Tissue concentration is calculated using BCF * Water Quality Criteria (WQC) ambient aqueous concentration, and assuming the conversion factorof 1 kg=1L.
Compound AmbientConc.(ug/L)1
BCF TissueConc.
(ug/Kg)
Remarks
Aldrin 0.13 2,300 299 WQC was reduced by a factor of 10 to account for chronic effects; BCF estimateis based on Dieldrin since Aldrin rapidly transformed to Dieldrin in the environment;BCF is based on 1.1% lipid level for marine fish, Spot (Leiostomus xanthurus).
Dieldrin 0.0019 2,300 4.37 BCF is based on 1.1% lipid level for marine fish, Spot (Leiostomus xanthurus).
Total Chlordane 0.004 16,000 64 Total Chlordane includes alpha-chlordane, trans nonachlor, heptachlor, heptachlorepoxide; WQC for Chlordane is used for Total Chlordane; BCF is based on 3.6%lipid level for sheepshead minnow (Cyprinodon variegatus).
Total Endosulfan 0.0087 328 2.85 Total Endosulfan includes endosulfan I, endosulfan II and endosulfan sulfate; WQCfor Endosulfan is used for Total Endosulfan; BCF is based on 3.6% lipid level forsheepshead minnow (Cyprinodon variegatus).
1,4-Dichlorobenzene
197 60 11820 Ambient conc. is based on lowest observed effect level (LOEL) for saltwaterspecies from WQC, and reduced by a factor of 10 to account for chronic effects;BCF is based on the whole body for bluegill (Lepomis macrochirus).
Arsenic 36 350 12600 Ambient conc. is based on the saltwater criteria continuous conc. for arsenic (III);BCF is based on the Eastern Oyster (Crassostrea virginica).
Chromium 50 236 11800 Ambient conc. is based on Chromium (VI) since it is substantially more toxic thanChromium (III); BCF is based on polychaete worm.
Copper 2.9 3,300 9570 WQC is based on a hardness value of 100; BCF is based on soft shell clam.
Lead 8.5 1,400 11900 Ambient conc. is based on saltwater criteria continuous conc.; BCF is based on theEastern Oyster (Crassostrea virginica).
Nickel 8.3 458 3802 Ambient conc. is based on saltwater criteria continuous conc.; BCF is based on theEastern Oyster (Crassostrea virginica).
Silver 0.23 6,500 1495 Water Quality Criterion (WQC) was reduced by a factor of 10 to account forchronic effects; BCF is based on the Blue Mussel (Mytilus edulis).
Zinc 86 17,640 1517040 Ambient conc. is based on saltwater criteria continuous conc.; BCF is based onEastern Oyster (Crassostrea virginica).
A-8
1.The following documents were used to obtain the water quality criteria values.Calabrese, A. 1984. “Effects of Long Term Exposure to Silver and Copper on Growth,Bioaccumulation and Histopathology in the Blue Mussel (Mytilus edulis).” Mar. Envir. Res. 1, 253-274.USEPA. 1980b. Ambient Water Quality Criteria for Aldrin/Dieldrin; EPA 440/5-80-019; December1980.USEPA. 1980c. Ambient Water Quality Criteria for Chlordane; EPA 440/5-80-027; October 1980.USEPA. 1980d. Ambient Water Quality Criteria for Heptachlor; EPA 440/5-80-052; October 1980.USEPA. 1980e. Ambient Water Quality Criteria for Endosulfan; EPA 440/5-80-046; October 1980.USEPA. 1980f. Ambient Water Quality Criteria for Dichlorobenzenes; EPA 440/5-80-039; October1980.USEPA. 1984a. Ambient Water Quality Criteria for Lead - 1984; EPA 440/5-84-027; January 1985.USEPA. 1984b. Ambient Water Quality Criteria for Copper - 1984; EPA 440/5-84-031; January1985.USEPA. 1985a. Ambient Water Quality Criteria for Chromium - 1984; EPA 440/5-84-029; January1985.USEPA. 1985c. Ambient Water Quality Criteria for Arsenic - 1984; EPA 440/5-84-033; January1985.USEPA. 1986. Ambient Water Quality Criteria for Nickel - 1986; EPA 440/5-86-004; September1986.USEPA. 1987b. Ambient Water Quality Criteria for Zinc - 1987; EPA 440/5-87-003.USEPA. 1992a. Draft Ambient Water Quality Criteria for Silver.
A-9
ATTACHMENT BBenthic Cancer Protection Level Calculations for the Protection of Human Health
from the Consumption of Fish Exposed to Dredged Material at the Historic Area RemediationSite
Basisfn1:
10-4 Benthic Tissue Level (ug/kg) = [10-4 Conc. in Fish ] x [Whole Body/fillet Factor (1.35)]fn5
= Trophic Transfer Factorfn2
10-4 Conc. in Fish (ug/kg) = Toxicological Dose (ug/day) [Seafood Consumption (6.5 g/day)fn3] x [10-3kg/g]
Toxicological Dose (ug/day) = [Risk Level (10-4)] x [Body Weight (70 kg)fn3] x [103 ug/mg] Potency Factor, q1
* (kg-day/mg)fn4
Cancer PotencyFactor
q1*
(kg-day/mg)
AcceptableConcentration in
Fish(ug/kg)
TrophicTransferFactor
BenthicProtection
Level(ug/kg)
Pesticides
Aldrin 17 63 2.6 33
Chlordane 1.3 828 2.3 486
Dieldrin 16 67 1.4 65
Heptachlor 4.5 239 2.7 120
Heptachlor epoxide
9.1 118 1.4 114
IndustrialOrganics
1.4-Dichlorobenzene
0.024 44,872 1 60,577
PAHs
Benzo(a)pyrene 7.3 147 0.1 2,000
METALS
Arsenic 1.5 718 3 323
A-10
ATTACHMENT CBenthic Non-Cancer Protection Level Calculations for the Protection
of Human Health from the Consumption of Fish Exposed to Dredged Materialat the Historic Area Remediation Site
Basis fn1:
Benthic Tissue Level (ug/kg) = [Conc. in Fish ] x [Whole Body/fillet Factor (1.35)]fn5
Trophic Transfer Factorfn2
Conc. in Fish (ug/kg) = Toxicological Dose (ug/day) [Seafood Consumption (6.5 g/day)fn3] x [10-3kg/g]
fn1 Human health cancer and non-cancer assessments adapted from Guidance for Assessing ChemicalContaminant Data for use in Fish Advisories: Volume II: Risk Assessment and Fish ConsumptionLimits. U.S. Environmental Protection Agency, EPA823-B-94-004, Office of Science andTechnology, Washington, DC, June 1994.
fn2 Trophic transfer factors were calculated by Mr. Lawrence Burkhard, EPA Duluth, using the foodchain transfer model developed by Gobas (1993).
fn3 Default values were taken from EPA’s national toxics rule for setting water quality criteria, USEPA(1992b).
fn4 Cancer potency factors and non-cancer reference doses are taken from USEPA (1995).
fn5 The acceptable concentration in seafood is defined on the basis of the fillet or edible portion forhumans. Trophic transfer, however, was defined on the basis of whole body characteristics, includinglipid concentrations. Experience in New York State indicates a whole body to fillet ration ranging from1.2 to 1.5 is applicable to lipophilic substances. The mid range value of 1.35 is used in this analysis.