The University of Texas at Austin MEMO: Comparison of Annual Naturalized Flows for the Rio Grande/Rio Bravo Basin TCEQ CONAGUA by Samuel Sandoval‐Solis, M. S. Daene C. McKinney, Ph.D., PE Rebecca L. Teasley, Ph.D. and Jesus Schuldes, PE. February 2010 CENTER FOR RESEARCH IN WATER RESOURCES Bureau of Engineering Research • The University of Texas at Austin J.J. Pickle Research Campus. • Austin, TX 78712‐4497 This document is available online via World Wide Web at ftp://ftp.crwr.utexas.edu/pub/outgoing/Sandoval/Memo_Nat_Flows
Transcript
The University of Texas at Austin
MEMO:
Comparison of Annual Naturalized Flows for the Rio Grande/Rio Bravo Basin
TCEQ CONAGUA
by
Samuel Sandoval‐Solis, M. S.
Daene C. McKinney, Ph.D., PE
Rebecca L. Teasley, Ph.D.
and
Jesus Schuldes, PE.
February 2010
CENTER FOR RESEARCH IN WATER RESOURCES
Bureau of Engineering Research • The University of Texas at Austin J.J. Pickle Research Campus. • Austin, TX 78712‐4497
This document is available online via World Wide Web at ftp://ftp.crwr.utexas.edu/pub/outgoing/Sandoval/Memo_Nat_Flows
ABSTRACT
Naturalized flows are estimations that represent the streamflow in a river basin in the absence of human development and water use. For the Rio Grande/Rio Bravo, two sets of naturalized flows are available, one from the Texas Commission on Environmental Quality (TCEQ) and other from the National Water Commission of Mexico (CONAGUA). The TCEQ naturalized flows are calculated in monthly time steps and they include data for U.S. and Mexican tributaries. CONAGUA naturalized flows are calculated in yearly time steps and they include data for the mainstream of the Rio Grande and for the Mexican tributaries, naturalized flows for U.S. tributaries are not calculated. The objective of this report is to describe and compare both naturalized flows datasets. Comparison between both datasets is performed by the Wilcoxon Rank Sum statistical test. This statistical test is selected because it can be applied to non‐normal distributed samples, which is the case of both datasets. The objective of this test is to determine if both samples have the same probability distribution function and thus, both data are similar enough to conclude they come from the same population. In addition, the Hodges‐Lehmann estimator is used to quantify the magnitude of the difference between two groups. In 27 control points was possible the comparison between both datasets. Results from the statistical test show that in most of the basin, 21 control points, the distribution of the values in both dataset are similar enough to conclude both come from the same population (they are similar!). Thus the differences in the data used and the assumption considered are not significant enough to make both dataset different. In four of the six control points, where the statistical similarity cannot be proven, the reasons of non similarity can be attributed to differences in the naturalization process: plant uptake and conveyance losses considerations as well as difference in the historical diversion data. For two control points, Rio Nadadores at Progreso and Rio Pesqueria at Los Herrera, both distributions seem very different and further analysis is necessary to determine which dataset is correct, but for most of the naturalized flows in the basin, the statistical similarity has been proven. Both datasets are already loaded and ready to use in the Rio Grande/Bravo WEAP model.
TABLE OF CONTENTS
Section page Abstract ............................................................................................................................ ii
Table of Contents ........................................................................................................................... i
A.2. Rio Conchos Basin ......................................................................................................................................... 22
A.3. Four Tributaries ............................................................................................................................................ 25
A.3.1. Arroyo Las Vacas ............................................................................................................................. 25
A.3.2.San Diego ............................................................................................................................................. 26
A.3.3. San Rodrigo ....................................................................................................................................... 26
A.3.4. Rio Escondido ................................................................................................................................... 27
A.4. Rio Salado Basin ............................................................................................................................................ 27
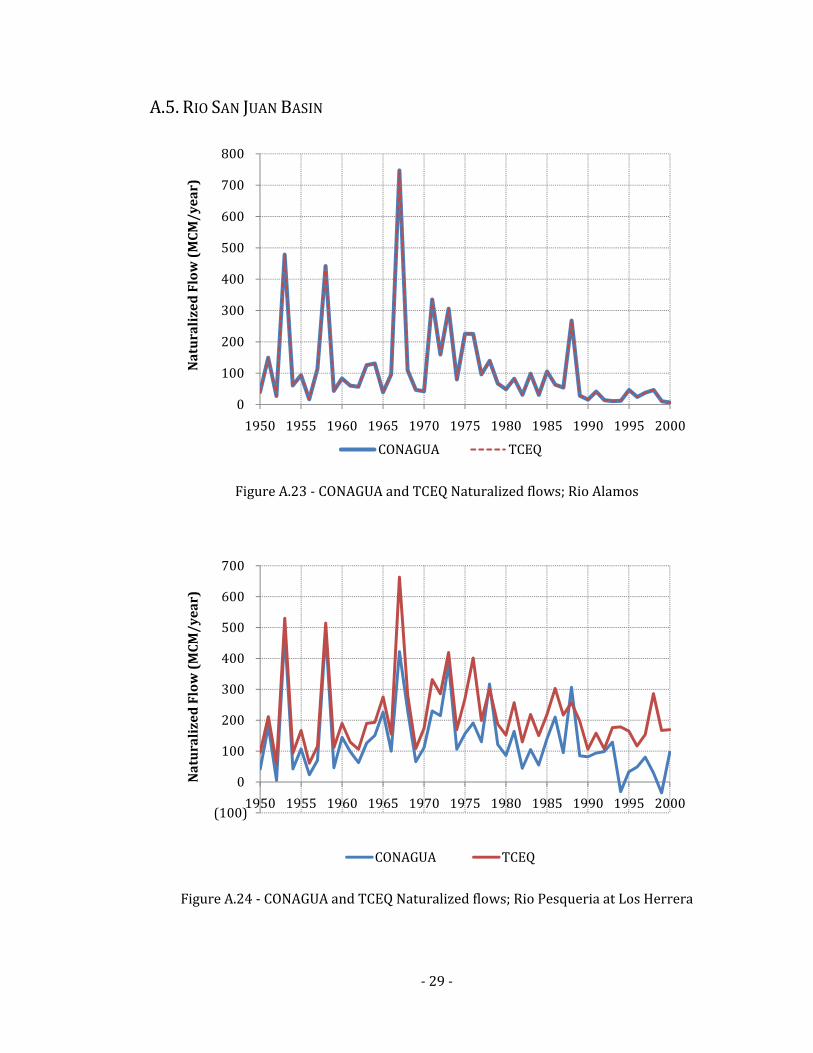
A.5. Rio San Juan Basin ........................................................................................................................................ 29
Appendix B. TCEQ and CONAGUA Annual Naturalized flows ......................................32
Appendix C. Wilcoxon Rank Sum Test Example: Rio San Juan at Camargo .................49
‐ 1 ‐
1. INTRODUCTION Naturalized flows are calculated to represent historical streamflow in a river basin in the
absence of human development and water use (Danner et al, 2006). The process of flow naturalization includes gathering historical records of gage streamflow, diversions, reservoir storages, evaporation and operation, evaporation along the streams, evapotranspiration, and plant uptake, among others. Calculated naturalized flows may vary for the same control point depending on: (1) the time step considered (daily, monthly or yearly time steps); (2) the data available during the naturalization process (historical records of: streamflow gages, diversions, reservoir operations), and (3) the assumptions considered (including conveyance losses and/or plant uptake, etc.).
For the Rio Grande/Rio Bravo basin, two sets of naturalized flows are available, one from the Texas Commission on Environmental Quality (Brandes et al., 2003) and other from the National Water Commission of Mexico (CONAGUA, 2008). The TCEQ naturalized flows have been available since 2003 and they are used as inputs for the Water Availability Model (WAM) of the Rio Grande (Brandes 2003). This data set was calculated in monthly time steps and it includes data for U.S. and Mexican tributaries. Recently, in November 2008, CONAGUA made public the annual naturalized flows calculated for mean annual conditions in the Rio Bravo basin (CONAGUA, 2008). This data set was calculated in yearly time steps and it includes data for the mainstream of the Rio Grande and for the Mexican tributaries, naturalized flows for U.S. tributaries were not calculated. The objective of this report is to objectively describe and compare both naturalized flows datasets.
In the first part of this report, brief descriptions of the naturalized flows data sets of both TCEQ and CONAGUA are presented, along with the principles used and the assumptions made. In the second part a statistical test is described that was used to compare both data sets (for the annual flow in the Mexican tributaries): the Wilcoxon Rank Sum test. This statistical test was selected because it can be applied to non‐normally distributed samples. Also the Hodges‐Lehmann estimator is used to estimate the magnitude of the differences between the data sets. In the third part, the results for the statistical test are presented and conclusions are derived from the results. Appendix A show the plots of the annual naturalized flows of both datasets, Appendix B and C contains the TCEQ and CONAGUA annual naturalized flows, respectively, used in this analysis. In Appendix D one example of the Wilcoxon Rank Sum Test for the Rio San Juan is presented.
‐ 2 ‐
2. NATURALIZED FLOWS
2.1. TCEQ NATURALIZED FLOWS
A series of monthly, naturalized flows were calculated for the Rio Grande/Rio Bravo basin from El Paso to the Gulf of Mexico and along the major tributaries of the Pecos River and the Rio Conchos as part of the Texas Commission on Environmental Quality (TCEQ) Water Availability Modeling (WAM) project (Brandes, 2003). The WAM project utilizes naturalized streamflow in its simulations of water availability for water rights permits. The process of data collection and the methodology used to calculate the naturalized flow are detailed in the report by Brandes (2003). Naturalized flows were calculated for 43 points in the basin (Figure 1). These naturalized flows were calculated monthly for 61 years, over the period of January 1940 to December 2000. The 43 naturalized flow (called “control”) points for the U.S. and Mexico are listed in Table 1 and Table 2, respectively.
Figure 1: Location of TCEQ control points with naturalized flows
‐ 3 ‐
The TCEQ naturalized flow for various locations j = 1,..,43 in the basin, over period t = 1,…,732, with a variable number of upstream locations i, are calculated using the following equation (adapted from Wurbs, 2006)
)1.(732,,1,43,,1
;?1?1?1?1?1
Eqtj
MiscSEPRFDGFNFi
tij
i
tij
i
tij
i
tij
i
tij
tj
tj
LL
LLLLL
==
∑−∑ Δ+∑+∑−∑+======
where:
tjNF = Naturalized flow in month t at station j tjGF = Historical gaged flow in month t at station j
tijD = Historical water diversions at site i upstream of station j and downstream of
station j1 in month t tijRF = Historical return flows at site i upstream of station j and downstream of
station j1 in month t tijEP = Historical reservoir evaporation at site i upstream of station j and
downstream of station j1 in month t tijSΔ = Historical changes in reservoir storage at site i upstream of station j and
downstream of station j1 in month t tijMisc = Historical miscellaneous adjustments at site i upstream of station j and
downstream of station j1 in month t
‐ 4 ‐
Table 1: TCEQ Control Points With Naturalized Flows for the U.S.
CRWR_ID HydroID Name AT1000PCP110 1040100174 Rio Grande at Fort Quitman, TX AT2000PCP120 1030100007 Rio Grande at El Paso, TX BT1000PCP130 1040100175 Rio Grande abv Rio Conchos, TX CT1000PCP140 1080100377 Rio Grande at Del Rio CT2000PCP150 1040100182 Devils R at Pafford Crossing nr Comstock, TX CT2100PCP160 1040100181 Devils R nr Juno, TX CT3000PCP170 1040100180 Rio Grande at Foster Ranch nr Langtry, TX CT4000PCP180 1040100179 Rio Grande at Johnson Ranch nr Castolon, TX CT5000PCP190 1040100178 Terlingua Ck nr Terlingua, TX CT6000PCP200 1040100177 Rio Grande blw Rio Conchos, TX CT7000PCP210 1040100176 Alamito Creek nr Presidio, TX DT1000PCP220 1080100382 Rio Grande blw Falcon Dam DT3000PCP230 1080100381 Rio Grande at Laredo DT5000PCP240 1080100380 Rio Grande at Piedras Negras DT8000PCP250 1080100379 Pinto Creek near Del Rio DT9000PCP260 1080100378 San Felipe Ck near Del Rio,TX ET1000PCP270 1090100422 Rio Grande blw Anzalduas Dam ET2000PCP280 1090100423 Rio Grande at Rio Grande City GT1000PCP290 1070100119 Pecos R nr Langtry, TX GT2000PCP300 1070100118 Pecos R nr Girvin, TX GT3000PCP310 1070100117 Pecos River Nr Orla Tx GT4000PCP320 1070100115 Delaware R nr Red Bluff, NM GT5000PCP330 1070100116 Pecos R. at Red Bluff, NM
‐ 5 ‐
Table 2: TCEQ Control Points With Naturalized Flows for Mexico
CRWR_ID HydroID NAME EM4000PCP360 2060100002 Rio Alamo at Cd. Mier EM3300PCP340 2060100003 Rio Salinas at Cienega de Flores EM3200PCP330 2060100004 Rio Pesqueria at Los Herrera EM3400PCP350 2060100005 Rio San Juan at El Cuchillo EM3100PCP320 2060100006 Rio San Juan at Los Aldamas EM3000PCP310 2060100007 Rio San Juan at Camargo DM9500PCP280 2050100015 Arroyo de la Vacas at Cd. Acuna DM7000PCP270 2050100016 Rio San Diego nr Jimenez DM6000PCP260 2050100017 Rio San Rodrigo at El Moral DM4000PCP240 2050100018 Rio Escondido at Villa de Fuente DM2300PCP220 2040100009 Rio Sabinas at Sabinas DM2200PCP210 2040100010 Rio Nadadores at Progreso DM2100PCP200 2040100011 Rio Salado at Rodriguez DM2000PCP190 2040100012 Rio Salado nr Las Tortillas FM4000PCP400 2020100001 Rio San Pedro at Villalba FM5000PCP410 2020100002 Rio Florido at Cd. Jimenez FM3000PCP390 2020100003 Rio Conchos at Las Burras FM2000PCP380 2020100004 Rio Conchos at El Granero FM6000PCP420 2020100005 Rio Conchos at Presa La Boquilla FM1000PCP370 2020100051 Rio Conchos at Ojinaga
When and where available, historical data were collected from both Texas and Mexican agencies for the calculation of naturalized flows. Historical streamflows were collected from multiple U.S. and Mexican agencies including the U.S. Geologic Survey (USGS), International Boundary Water Commission (IBWC) and Comisión Nacional de Agua (CONAGUA). Daily average historical streamflow were summed to create total monthly streamflows. Data on historical diversions include diversions for municipal, industrial, and irrigation uses, as well as the historical return flows, including returns from irrigation, industrial wastewater and municipal wastewater sources. Detailed descriptions of the data sources for these historical flows used in the TECQ calculations are contained in Sections 2.1, 2.6, 2.7, and 2.8 of Brandes (2003). For Mexico, the streamflow data used for the naturalization process was primarily obtained from the BANDAS (Banco Nacional de Datos de Aguas Superficiales) database (IMTA 2004). Water management data were provided for the TCEQ calculations by the regional CONAGUA office in Monterrey (Brandes, 2003). Sections 3.3 and 3.4 contain information about data use and assumptions for the naturalized flow calculations.
Changes in reservoir storage were calculated for major reservoirs, those having a storage capacity of 6.2 million m3 (5,000 acre‐ft) or greater. The changes in storage were calculated from historical records of reservoir storage volumes. The historical reservoir evaporation losses in Equation 1 are defined as the difference between evaporation and precipitation and they are adjusted to include the runoff that would have occurred in the absence of the reservoir.
‐ 6 ‐
Evaporation and precipitation rates in Texas were derived from the Texas Water Development Board (TWDB) one‐degree quadrangle maps, which were developed using available data for precipitation and evaporation from the National Weather Service and the TWDB. Evaporation rates in Mexico were derived from historical pan evaporation rates and precipitation rates were collected from historical gaged rates. Runoff in the absence of the reservoir was estimated from a regression of historical streamflow and historical precipitation to create a runoff coefficient. Section 1.2 of Brandes (2003) details the methodology for calculating the reservoir evaporative losses, Section 2.5 describes the evaporation data, and Section 2.3 describes the reservoir storage data.
The miscellaneous adjustment term shown in Equation 1 refers to streamflow additions such as spring flow. Spring flows with significant contributions to streamflow were removed from the naturalized flows and accounted for as separate sources in the WAM process. Spring flow adjustments are discussed in Sections 2.2 and 3.1 (Brandes 2003).
2.1.1. CONVEYANCE LOSSES
Channel loss factors were calculated to represent losses due to channel seepage, evaporation, evapotranspiration and other unaccounted for losses. Channel loss factors were used to translate upstream flow adjustments, such as diversions or return flows, to the downstream end of a reach during the calculation of naturalized flows.
Channel seepage was determined by the analysis of previous studies of the geology and hydrogeology for the Rio Grande/Bravo basin (Brandes 2003). However, when previous studies on channel losses were not available, new channel losses were estimated. An analysis of the historical gaged streamflows, taking into account losses due to evaporation and plant uptake, was completed by subtracting upstream gaged streamflow values from downstream gaged streamflow values for a reach. This analysis was completed with streamflows that occurred during the non‐irrigation season (October through March). This time period was selected because it minimized diversions and irrigation return flow related, minimized evapotranspiration and evaporation. During the non‐irrigation season, temperatures are lower leading to lower evaporation and evapotranspiration rates than at other times of the year when temperatures are higher. With these three factors at their minimum values, the loss calculated between gages is assumed to reflect channel losses due to seepage.
The total streamflow losses were adjusted to include evaporation and evapotranspiration. Evaporation rates in Texas were derived from the Texas Water Development Board (TWDB) one‐degree quadrangle maps. Evaporation rates in Mexico were derived from historical pan evaporation rates. Evapotranspiration rates were calculated from estimates of salt cedar coverage and an annual consumption rate. The consumption rate was applied to either known area of salt cedar or an estimated area based on an assumed width of salt cedar growth along a specific reach. Section 3.6 of Brandes (2003) contains a detailed description of the channel loss calculations and data.
‐ 7 ‐
2.2. CONAGUA NATURALIZED FLOWS
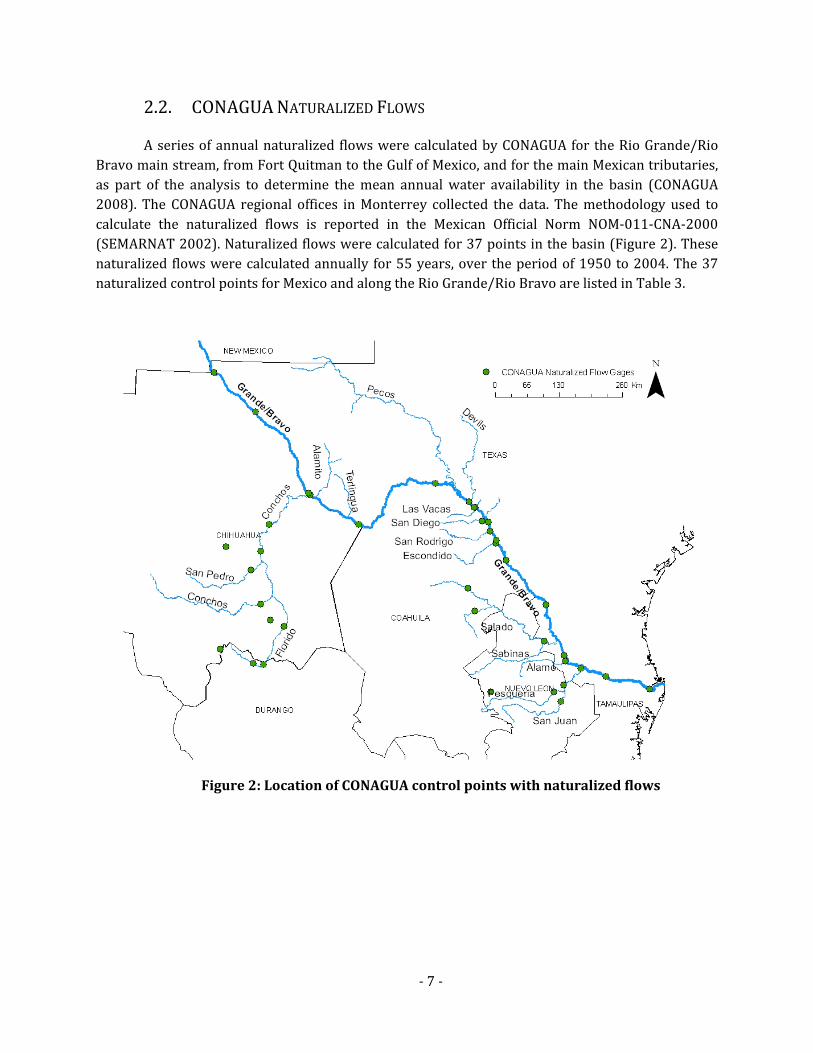
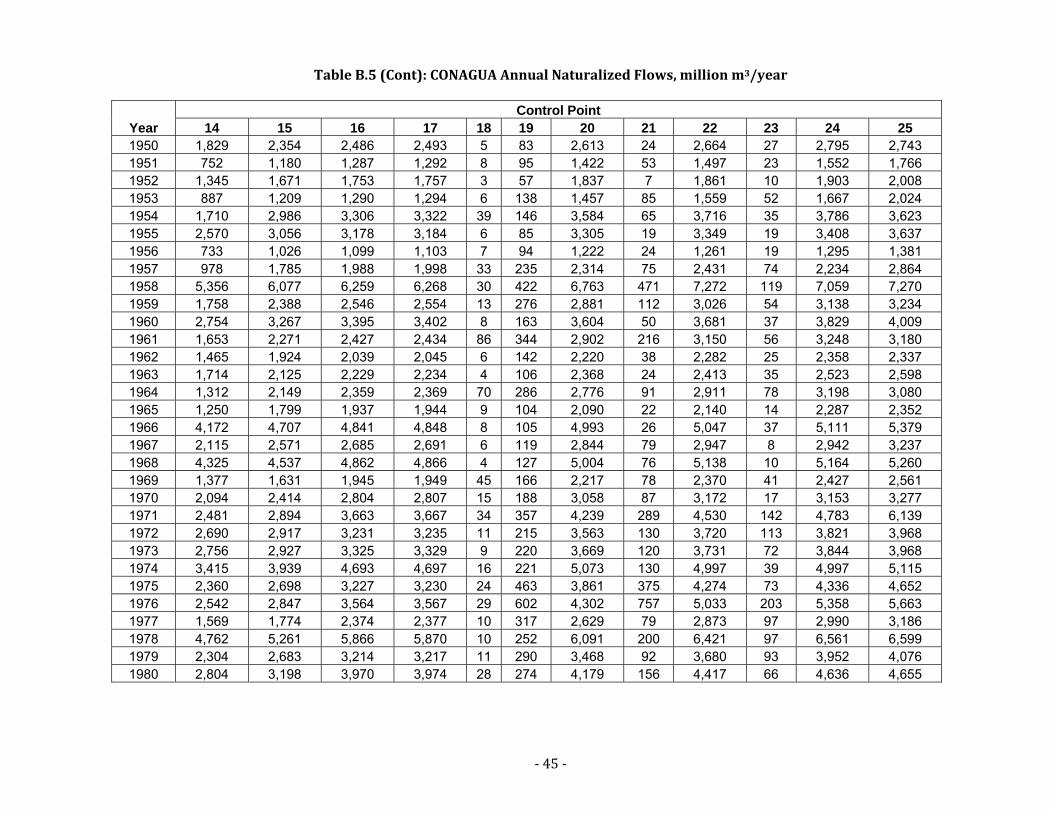
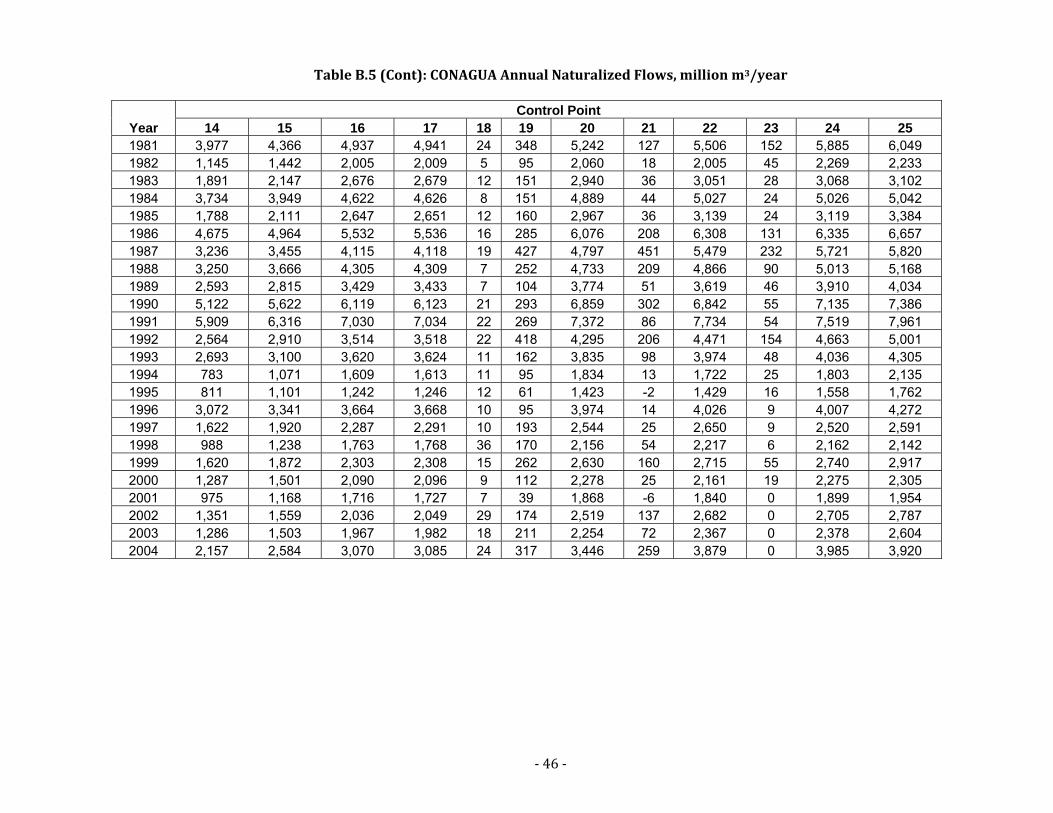
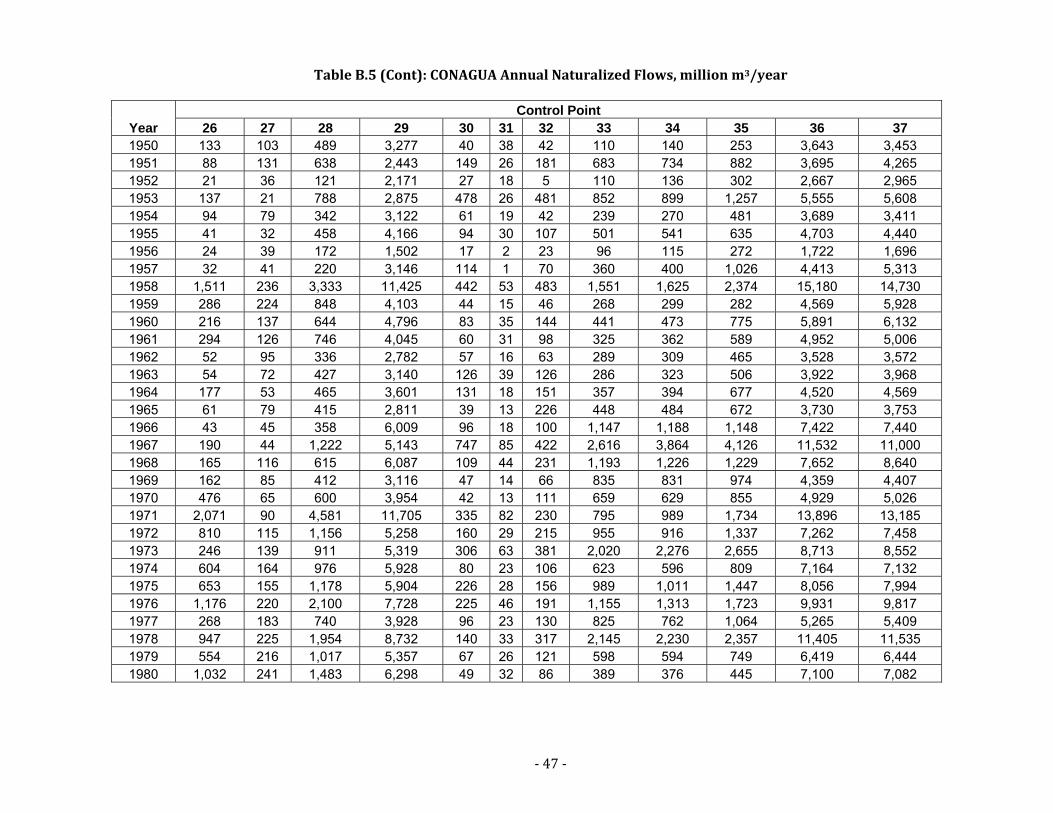
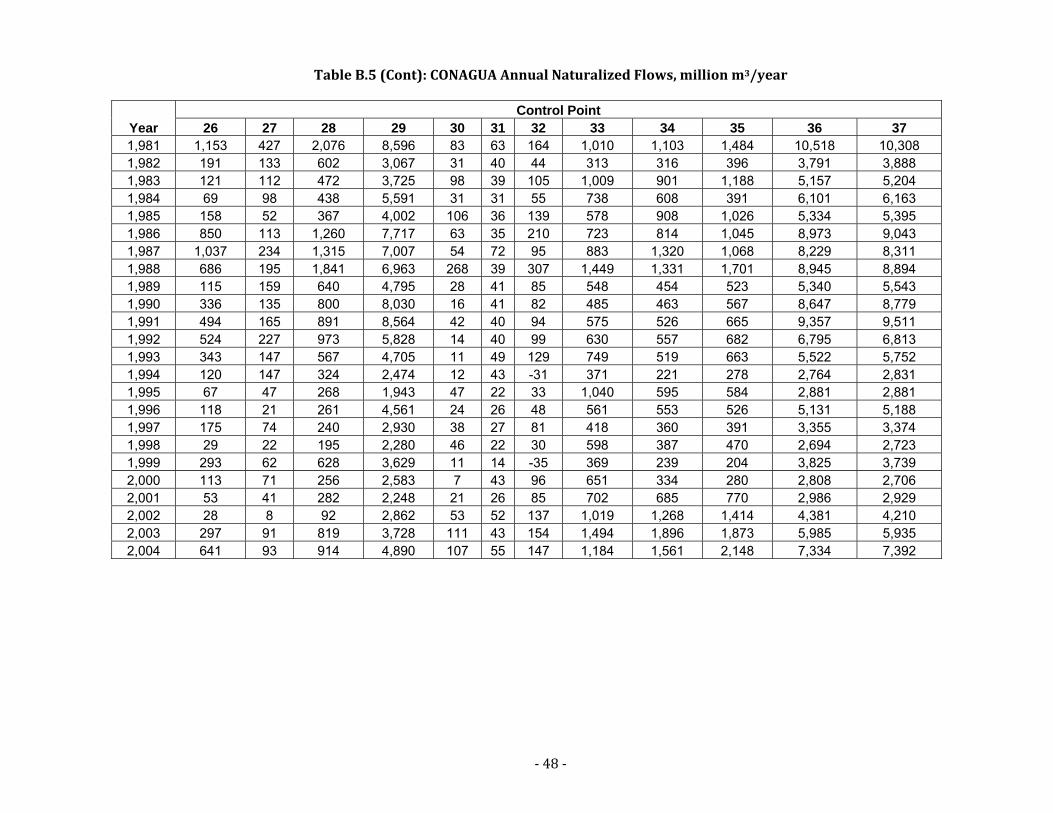
A series of annual naturalized flows were calculated by CONAGUA for the Rio Grande/Rio Bravo main stream, from Fort Quitman to the Gulf of Mexico, and for the main Mexican tributaries, as part of the analysis to determine the mean annual water availability in the basin (CONAGUA 2008). The CONAGUA regional offices in Monterrey collected the data. The methodology used to calculate the naturalized flows is reported in the Mexican Official Norm NOM‐011‐CNA‐2000 (SEMARNAT 2002). Naturalized flows were calculated for 37 points in the basin (Figure 2). These naturalized flows were calculated annually for 55 years, over the period of 1950 to 2004. The 37 naturalized control points for Mexico and along the Rio Grande/Rio Bravo are listed in Table 3.
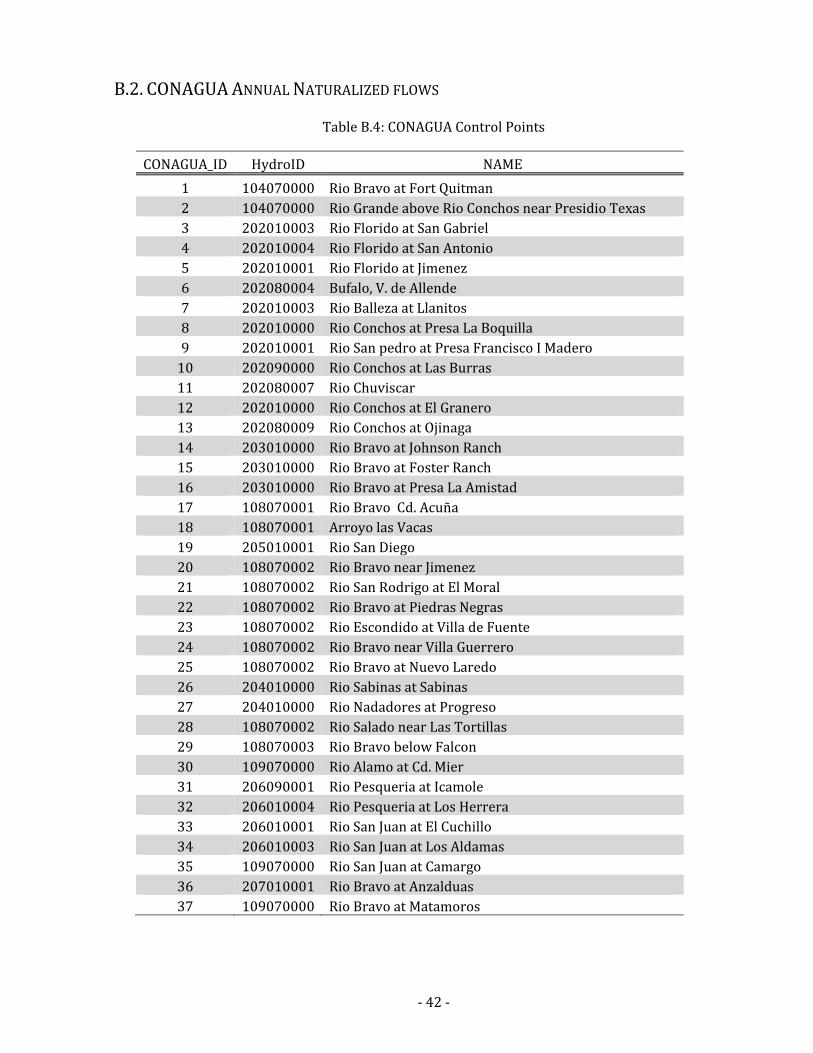
Figure 2: Location of CONAGUA control points with naturalized flows
‐ 8 ‐
Table 3: CONAGUA Control Points With Naturalized Flows
CONAGUA_ID HydroID NAME 1 104070000 Rio Bravo at Fort Quitman 2 104070000 Rio Grande above Rio Conchos near Presidio Texas 3 202010003 Rio Florido at San Gabriel 4 202010004 Rio Florido at San Antonio 5 202010001 Rio Florido at Jimenez 6 202080004 Bufalo, V. de Allende 7 202010003 Rio Balleza at Llanitos 8 202010000 Rio Conchos at Presa La Boquilla 9 202010001 Rio San Pedro at Presa Francisco I Madero 10 202090000 Rio Conchos at Las Burras 11 202080007 Rio Chuviscar 12 202010000 Rio Conchos at El Granero 13 202080009 Rio Conchos at Ojinaga 14 203010000 Rio Bravo at Johnson Ranch 15 203010000 Rio Bravo at Foster Ranch 16 203010000 Rio Bravo at Presa La Amistad 17 108070001 Rio Bravo Cd. Acuña 18 108070001 Arroyo las Vacas 19 205010001 Rio San Diego 20 108070002 Rio Bravo near Jimenez 21 108070002 Rio San Rodrigo at El Moral 22 108070002 Rio Bravo at Piedras Negras 23 108070002 Rio Escondido at Villa de Fuente 24 108070002 Rio Bravo near Villa Guerrero 25 108070002 Rio Bravo at Nuevo Laredo 26 204010000 Rio Sabinas at Sabinas 27 204010000 Rio Nadadores at Progreso 28 108070002 Rio Salado near Las Tortillas 29 108070003 Rio Bravo below Falcon 30 109070000 Rio Alamo at Cd. Mier 31 206090001 Rio Pesqueria at Icamole 32 206010004 Rio Pesqueria at Los Herrera 33 206010001 Rio San Juan at El Cuchillo 34 206010003 Rio San Juan at Los Aldamas 35 109070000 Rio San Juan at Camargo 36 207010001 Rio Bravo at Anzalduas 37 109070000 Rio Bravo at Matamoros
‐ 9 ‐
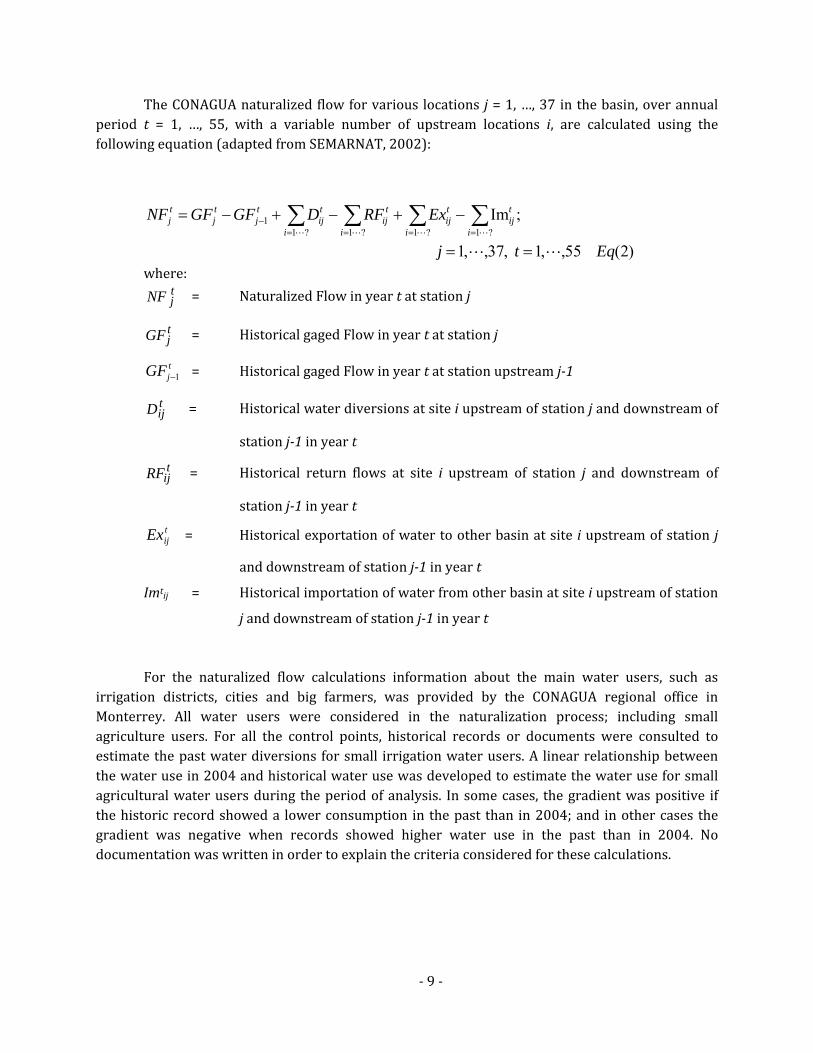
The CONAGUA naturalized flow for various locations j = 1, …, 37 in the basin, over annual period t = 1, …, 55, with a variable number of upstream locations i, are calculated using the following equation (adapted from SEMARNAT, 2002):
)2(55,,1,37,,1
;Im?1?1?1?1
1
Eqtj
ExRFDGFGFNFi
tij
i
tij
i
tij
i
tij
tj
tj
tj
LL
LLLL
==
−+−+−= ∑∑∑∑====
−
where: tjNF = Naturalized Flow in year t at station j
tjGF = Historical gaged Flow in year t at station j
tjGF 1− = Historical gaged Flow in year t at station upstream j1
tijD = Historical water diversions at site i upstream of station j and downstream of
station j1 in year t
tijRF = Historical return flows at site i upstream of station j and downstream of
station j1 in year t tijEx = Historical exportation of water to other basin at site i upstream of station j
and downstream of station j1 in year t
Imtij = Historical importation of water from other basin at site i upstream of station
j and downstream of station j1 in year t
For the naturalized flow calculations information about the main water users, such as irrigation districts, cities and big farmers, was provided by the CONAGUA regional office in Monterrey. All water users were considered in the naturalization process; including small agriculture users. For all the control points, historical records or documents were consulted to estimate the past water diversions for small irrigation water users. A linear relationship between the water use in 2004 and historical water use was developed to estimate the water use for small agricultural water users during the period of analysis. In some cases, the gradient was positive if the historic record showed a lower consumption in the past than in 2004; and in other cases the gradient was negative when records showed higher water use in the past than in 2004. No documentation was written in order to explain the criteria considered for these calculations.
‐ 10 ‐
3. STATISTICAL TESTING
3.1. WILCOXON RANK SUM TEST
In order to compare the differences or similarities in the two sets of annual naturalized flows, the Wilcoxon Rank Sum statistical test will be used. This statistical test was selected because it is a non‐parametric test that can be applied to non‐normally distributed samples, which is the case for both annual naturalized flows samples. The objective of this test is to identify if both samples are similar enough to say that they come from the same population. Statistical parametric characteristics such as the mean and the standard deviation may vary between the two samples, but with this test it is possible to identify if both samples come from the same source, or in our case, if both samples represent the same phenomena: Naturalized Flows.
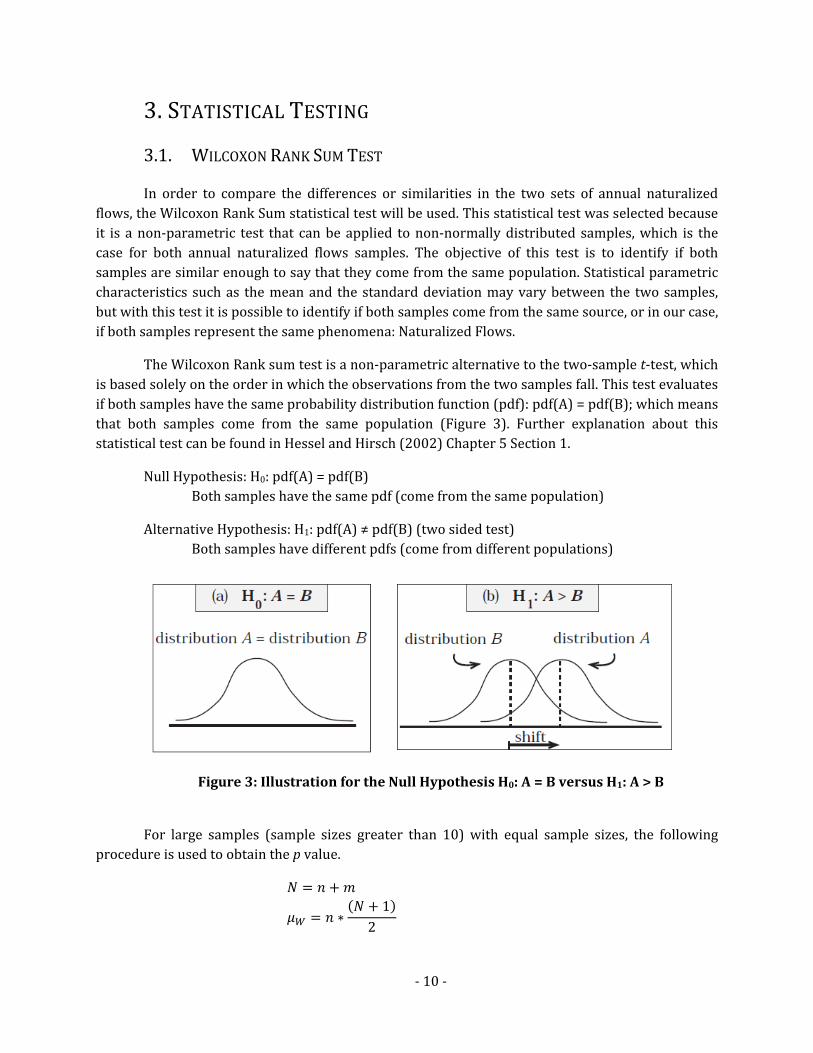
The Wilcoxon Rank sum test is a non‐parametric alternative to the two‐sample t‐test, which is based solely on the order in which the observations from the two samples fall. This test evaluates if both samples have the same probability distribution function (pdf): pdf(A) = pdf(B); which means that both samples come from the same population (Figure 3). Further explanation about this statistical test can be found in Hessel and Hirsch (2002) Chapter 5 Section 1.
Null Hypothesis: H0: pdf(A) = pdf(B) Both samples have the same pdf (come from the same population)
Alternative Hypothesis: H1: pdf(A) ≠ pdf(B) (two sided test) Both samples have different pdfs (come from different populations)
Figure 3: Illustration for the Null Hypothesis H0: A = B versus H1: A > B
For large samples (sample sizes greater than 10) with equal sample sizes, the following procedure is used to obtain the p value.
1
2
‐ 11 ‐
112
2
0
2
Φ
Where: n = sample size of data set A m = sample size of data set B Wrs = sum of the ranks for sample A d = width of time step, d=1 year
= mean of the ranks’ sum (Wrs) = standard deviation of the ranks’ sum (Wrs)
Φ = standard normal probability distribution P value = measure how unlikely is the test is when H0 is true
The Wilcoxon Rank Sum statistical test was performed for the TCEQ and CONAGUA naturalized flows dataset on an annual basis. The period of analysis selected was from 1950 to 2000, when data are available for both datasets. Appendix D shows an example of the calculations for the San Juan River at Camargo.
3.2. HODGES‐LEHMANN ESTIMATOR ‐ MEDIAN OF THE DIFFERENCES
One non‐parametric estimate of the difference between two independent groups is a Hodges‐Lehmann estimator ∆. The estimator is the median of all possible pairwise differences between two groups, in our case the TCEQ and CONAGUA naturalized flow groups. This estimator measures the magnitude of the differences between the two groups (Hessel and Hirsch 2002, Chapter 5 Section 5.4.1).
∆ ;
where
TCEQt = TCEQ annual naturalized flow for year t, CONAGUAt = CONAGUA annual naturalized flow for year t,
‐ 12 ‐
A positive value in the Hodges‐Lehmann estimator suggests that the TCEQ flow values are larger than the CONAGUA flow values; on the contrary, a negative value of the estimator suggests that CONAGUA’s flow values are larger than TCEQ’s values.
‐ 13 ‐
4. STATISTICAL RESULTS In this section the results of the Wilcoxon Ran Sum statistical test and the Hodges‐Lehmann
estimators are presented for the 27 control points where the comparison was possible. These control points were selected because the CONAGUA and TCEQ control points are at the same location, or the control points among datasets are close from each other.
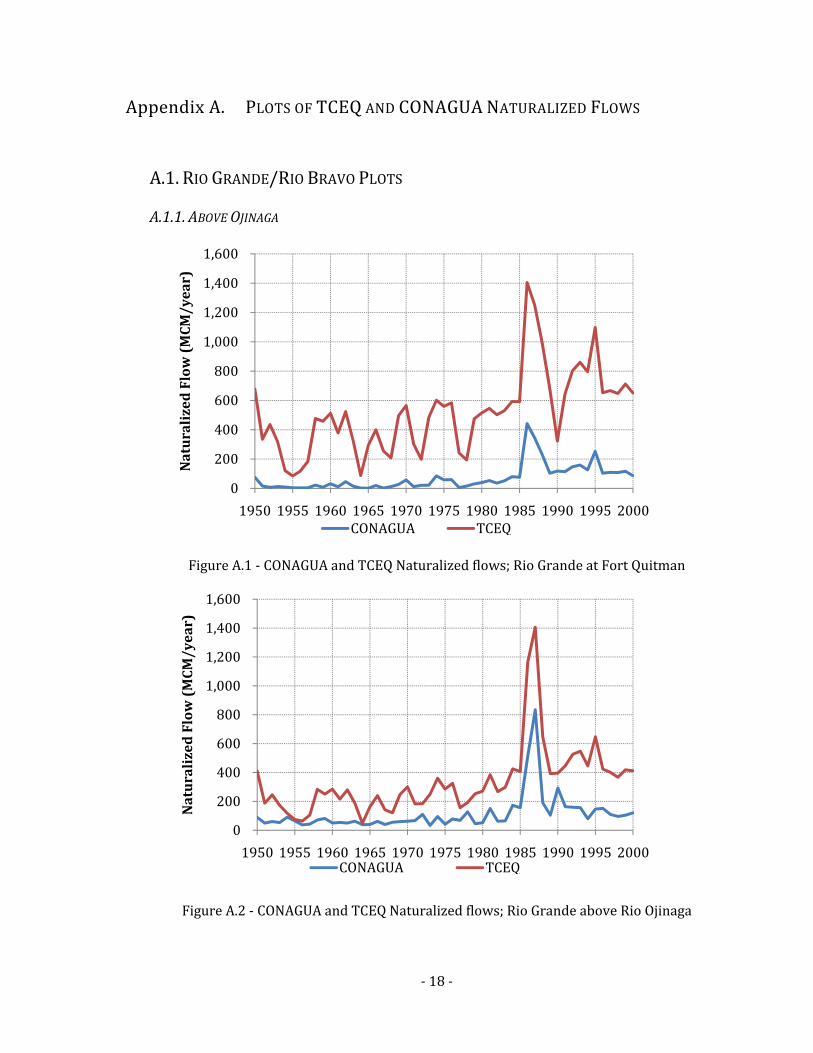
Table 4 shows the results for the Rio Grande/Bravo streamflow. Results from the statistical test show that in all the cases, except of two stations above Ojinaga, the TCEQ and CONAGUA annual naturalized flows come from the same population, which means, they can vary in their specific values, or in the mean and variance of the sample, but the population probability distribution function is the same for both sets of flows. A positive value in the median difference column suggests that the TCEQ Naturalized flows values are larger than the CONAGUA naturalized flow values; on the contrary, a negative value in the median difference column represents that CONAGUA’s naturalized flow values are larger than TCEQ’s naturalized flows values.
Table 4: Rank Sum Test and HodgesLehmann Estimator Results for the Rio Grande/Rio Bravo Streamflow
Location p‐Value α=0.05 Comment Median Difference (MCM/year)
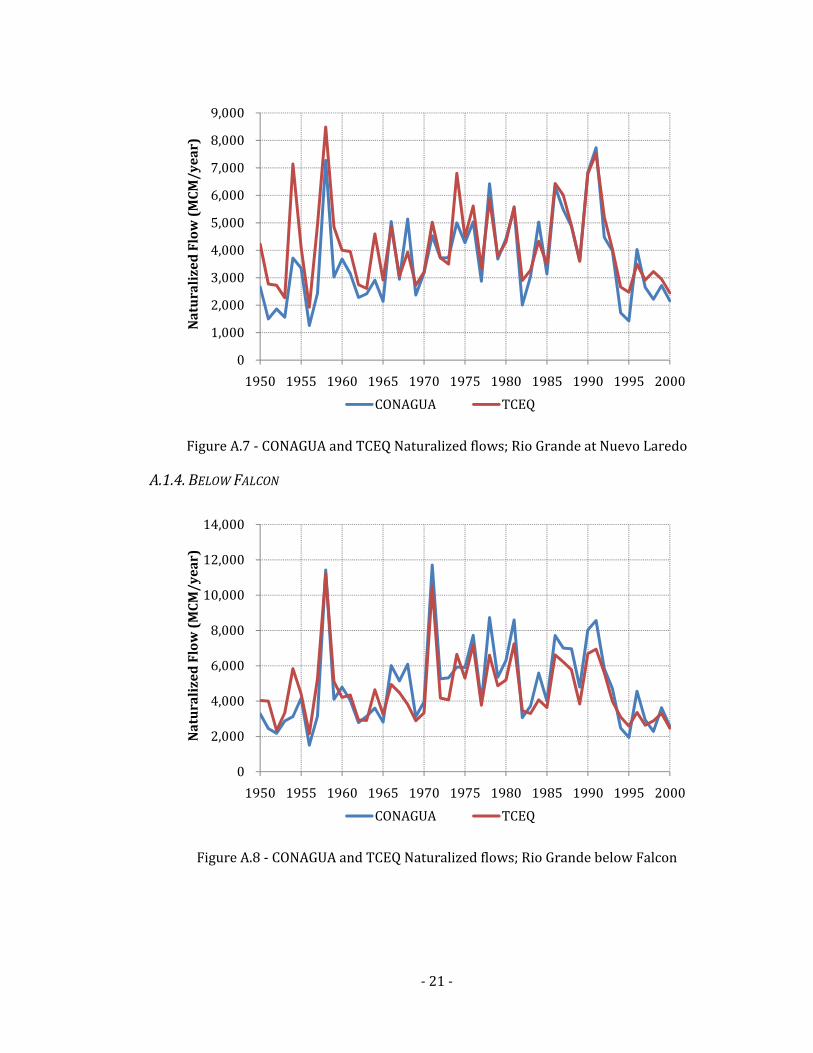
Between Fort Quitman and Ojinaga Rio Grande at Fort Quitman 0.000 <0.05 Reject H0 475 Rio Grande above Rio Conchos 0.000 <0.05 Reject H0 219 Between Ojinaga and Amistad Rio Grande at Johnson Ranch 0.534 >0.05 Do not Reject H0 ‐132 Rio Grande at Foster Ranch 0.154 >0.05 Do not Reject H0 ‐299 Between Amistad and Falcon Rio Grande at Del Rio 0.120 >0.05 Do not Reject H0 269 Rio Grande at Piedras Negras 0.076 >0.05 Do not Reject H0 338 Rio Grande at Laredo 0.211 >0.05 Do not Reject H0 163 Below Falcon Rio Grande below Falcon Dam 0.820 >0.05 Do not Reject H0 ‐328 Rio Grande below Anzalduas Dam 0.170 >0.05 Do not Reject H0 ‐860
‐ 14 ‐
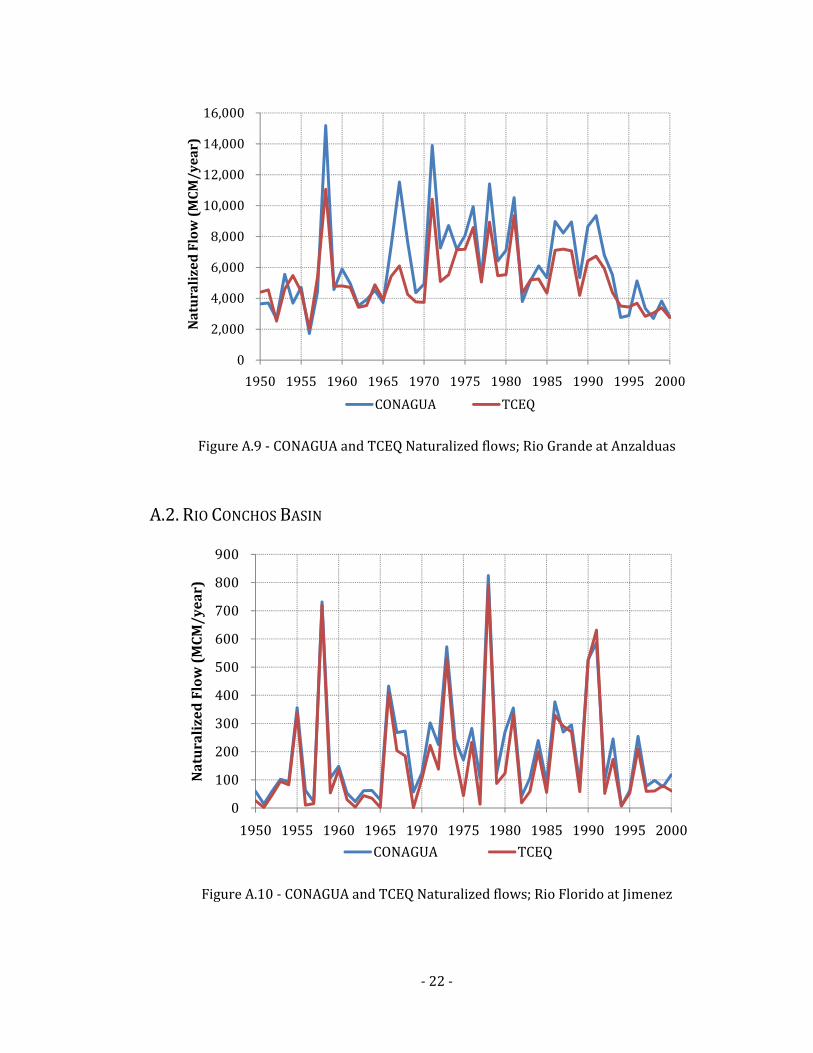
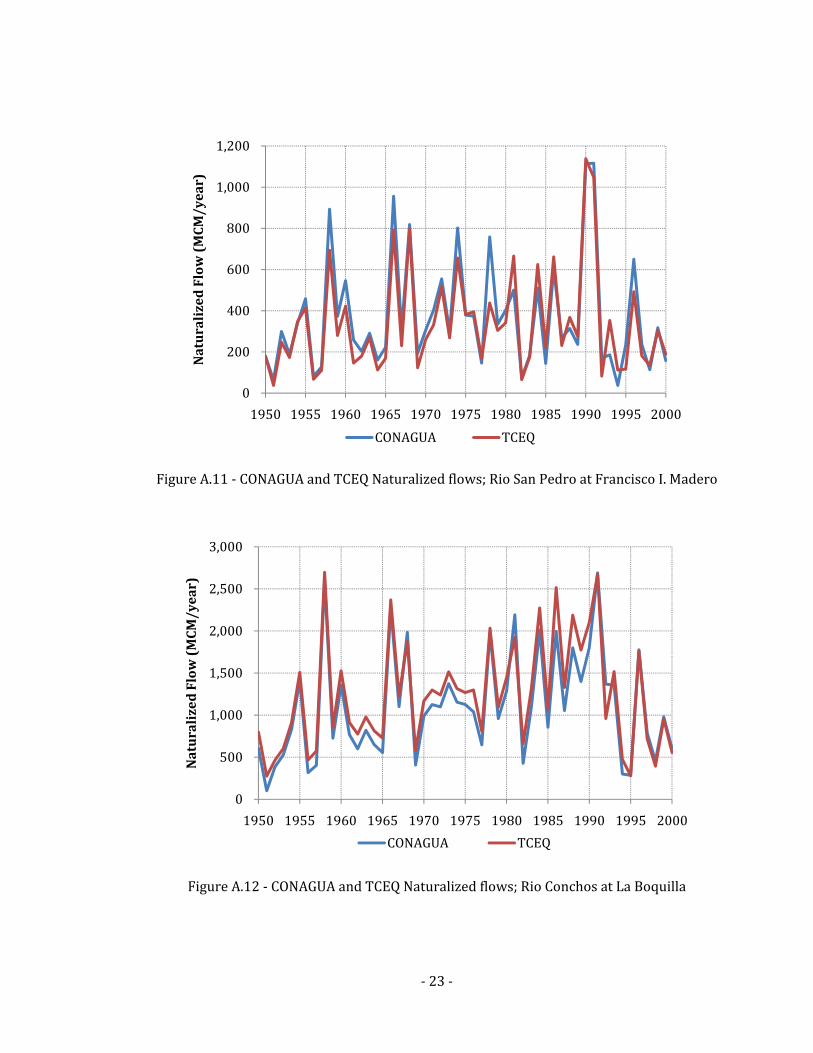
Table 5 shows the results for rivers in the Rio Conchos basin. In this sub‐basin results show that both data sets are very similar, in fact for all the control points compared, the data from both samples comes from the same population.
Table 5: Rank Sum Test and HodgesLehmann Estimator Results for the Rio Conchos Basin
Location p‐Value α=0.05 Comment Median Difference (MCM/year)
Rio Florido at Jimenez 0.056 >0.05 Do not Reject H0 ‐28 Rio Conchos at Presa La Boquilla 0.332 >0.05 Do not Reject H0 157 Rio San Pedro at Villalba 0.516 >0.05 Do not Reject H0 ‐26 Rio Conchos at Las Burras 0.952 >0.05 Do not Reject H0 18 Rio Conchos at El Granero 0.639 >0.05 Do not Reject H0 ‐114 Rio Conchos nr Ojinaga 0.134 >0.05 Do not Reject H0 ‐359
Table 6 shows the results for Arroyo Las Vacas creek, and San Diego, San Rodrigo and Escondido rivers. For Arroyo Las Vacas, San Diego and San Rodrigo, both dataset can be considered to come from the same distribution; the exception is Rio Escondido, where the test shows that the samples are different.
Table 6: Rank Sum Test and HodgesLehmann Estimator Results for Arroyo Las Vacas, San Diego, San Rodrigo and Escondido
Location p‐Value α=0.05 Comment Median Difference (MCM/year)
Arroyo Las Vacas 0.068 >0.05 Do not Reject H0 4 Rio San Diego at Jimenez 0.065 >0.05 Do not Reject H0 37 Rio San Rodrigo at El Moral 0.082 >0.05 Do not Reject H0 23 Rio Escondido at Villa de Fuente 0.006 <0.05 Reject H0 35
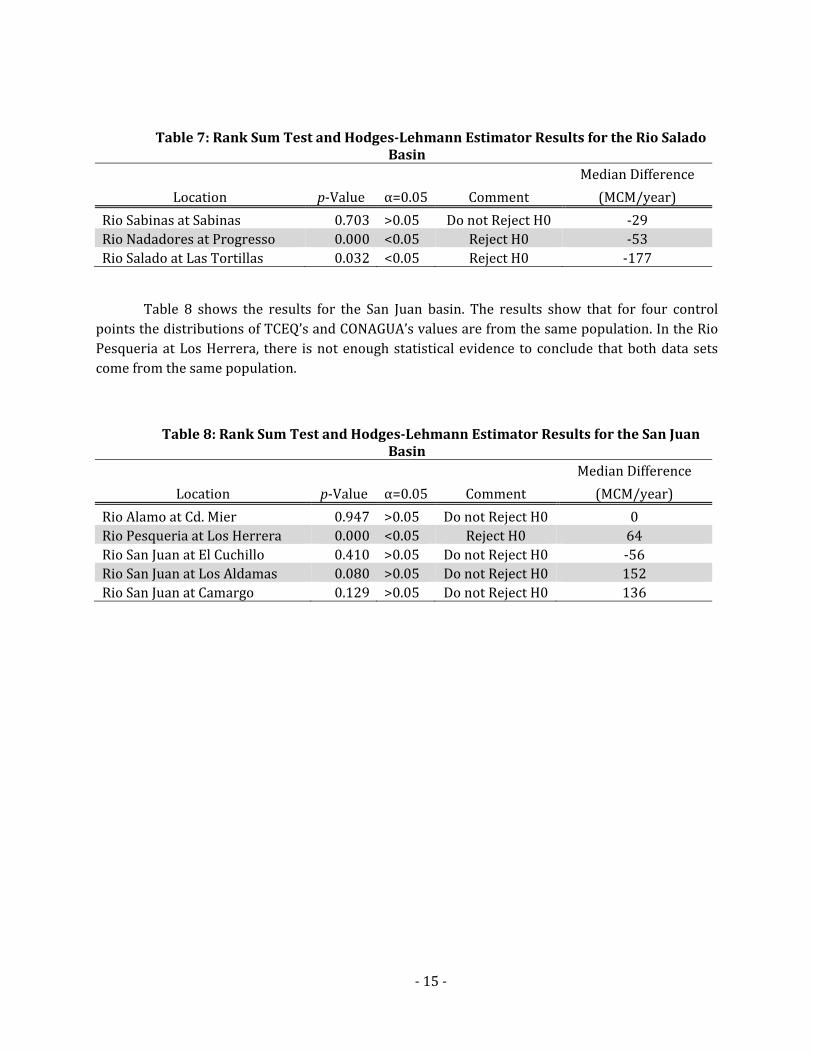
Table 7 shows the results for the Salado Basin. For this sub‐basin the control points located along Rio Nadadores and Rio Salado at Tortillas showed there is not enough statistical evidence to conclude that they come from the same distribution. Specifically, for the Rio Salado at Tortillas, both data sets follow the same trend along time, but CONAGUA’s values are offset above TCEQ’s values, which mean CONAGUA’s values were systematically bigger than TCEQ’s values. This can be explained by the naturalization process followed by the two agencies, meanwhile TCEQ added the diversion for the most important water users in the basin (Irrigation districts and Municipal water users), CONAGUA included all water users (TCEQ users + Small Agriculture). This may explain the systematic offset of the CONAGUA’s values compared to TCEQ’s values.
‐ 15 ‐
Table 7: Rank Sum Test and HodgesLehmann Estimator Results for the Rio Salado Basin
Location p‐Value α=0.05 Comment Median Difference (MCM/year)
Rio Sabinas at Sabinas 0.703 >0.05 Do not Reject H0 ‐29 Rio Nadadores at Progresso 0.000 <0.05 Reject H0 ‐53 Rio Salado at Las Tortillas 0.032 <0.05 Reject H0 ‐177
Table 8 shows the results for the San Juan basin. The results show that for four control points the distributions of TCEQ’s and CONAGUA’s values are from the same population. In the Rio Pesqueria at Los Herrera, there is not enough statistical evidence to conclude that both data sets come from the same population.
Table 8: Rank Sum Test and HodgesLehmann Estimator Results for the San Juan Basin
Location p‐Value α=0.05 Comment Median Difference (MCM/year)
Rio Alamo at Cd. Mier 0.947 >0.05 Do not Reject H0 0 Rio Pesqueria at Los Herrera 0.000 <0.05 Reject H0 64 Rio San Juan at El Cuchillo 0.410 >0.05 Do not Reject H0 ‐56 Rio San Juan at Los Aldamas 0.080 >0.05 Do not Reject H0 152 Rio San Juan at Camargo 0.129 >0.05 Do not Reject H0 136
‐ 16 ‐
5. CONCLUSIONS AND RECOMMENDATIONS This report presents an analysis of two naturalized flows datasets for the Rio Grande/Rio
Bravo basin: TCEQ and CONAGUA for 27 control points. Results from the Wilcoxon Rank Sum statistical test showed that for 21 control points the distribution of the values is similar enough to conclude that both dataset come from the same population. These control points include stations along the Rio Grande/Rio Bravo main stream, the Rio Conchos, the Salado and San Juan basins, and along the rest of the tributaries. Both datasets are very similar for most of the basin and the differences in the data used and the assumptions made are not significant enough to make the datasets different. In fact, both datasets represent the naturalized flows in the basin.
Two control points are not similar: Fort Quitman and Above Ojinaga. In these cases the naturalization processes were different between the two agencies; TCEQ considered the plant uptake of salt cedar in this area, which is significant; CONAGUA did not consider this, which might be one of the reasons for the discrepancy. Also, the values for Rio Salado at Tortillas and for Rio Escondido at Villa Fuente are not statistically similar. Specifically for Rio Salado at Tortillas the CONAGUA values seem to be greater than TCEQ’s values. This might be explained by the naturalization processes used by the agencies. Finally, for Rio Nadadores at Progreso and Rio Pesqueria at Los Herrera, both distributions seem to be completely different, further analysis is necessary at these locations.
For the TCEQ Dataset, the monthly data values used in the naturalization process for each of the control points should be studied to obtain a better understand of some of the considerations used in the process, such as the conveyance losses and the plant uptake in certain reaches. For the CONAGUA dataset, further refinement is necessary to estimate monthly flow values. Annual naturalized flows provide a rough idea of the volume, but do not properly represent the seasonal variation that the monthly values provide, which is important for the planning and management of the basin. Also, it is necessary to document the naturalization process and the assumptions used in estimating the CONAGUA naturalized flows. A bi‐national, homogeneous set of naturalized flows should be developed for all US and Mexican tributaries in the basin. Monthly naturalized flows, important for water planning and management, are available only up to 2000; it is important to obtain monthly naturalized flows for more recent years.
‐ 17 ‐
6. REFERENCES
Brandes Company, R. J. (2003). “Water Availability Modeling for the Rio Grande Basin: Naturalized Streamflow Data. Final Report.” Texas Commission on Environmental Quality, Austin, Texas
CONAGUA – Comisión Nacional del Agua (2008). “Acuerdo por el que se da a conocer el resultado de los estudios de disponibilidad media anual de las aguas superficiales en la cuenca del Rio Bravo” Diario Oficial de la Federación. 29 de Septiembre de 2008. México D.F. http://dof.gob.mx/nota_detalle.php?codigo=5060723&fecha=22/09/2008
Danner, C. L., McKinney, D.C., Teasley, R.L., and S. Sandoval‐Solis (2006). “Documentation and Testing of the WEAP Model for the Rio Grande/Bravo Basin.” CRWR Online Report 06‐ 08. Center for Research in Water Resources. University of Texas, Austin.
Helsel, D.R., and Hirsch, R.M. (2002). Statistical Methods for Water Resources. United States Geological Service USGS. http://pubs.usgs.gov/twri/twri4a3/html/pdf_new.html
IMTA – Instituto Mexicano de Tecnología del Agua (2004). Banco Nacional de Datos de Aguas Superfiales (Bandas). Jiutepec Morelos.
SEMARNAT – Secretaria de Medio Ambiente y Recursos Naturales (2002). “Norma Oficial Mexicana NOM‐011‐CNA‐2000, Conservación del recurso agua que establece las especificaciones y método para determinar la disponibilidad media anual de las aguas nacionales”. Diario Oficial de la Federacion, Miercoles 17 de Abril de 2002.
Wurbs, R.A. (2006) Methods for Developing Naturalized Flows at Gaged and Ungaged Sites. Journal of Hydrologic Engineering 11 (1) pp 55‐64.
‐ 18 ‐
Appendix A. PLOTS OF TCEQ AND CONAGUA NATURALIZED FLOWS
A.1. RIO GRANDE/RIO BRAVO PLOTS
A.1.1. ABOVE OJINAGA
Figure A.1 ‐ CONAGUA and TCEQ Naturalized flows; Rio Grande at Fort Quitman
Figure A.2 ‐ CONAGUA and TCEQ Naturalized flows; Rio Grande above Rio Ojinaga
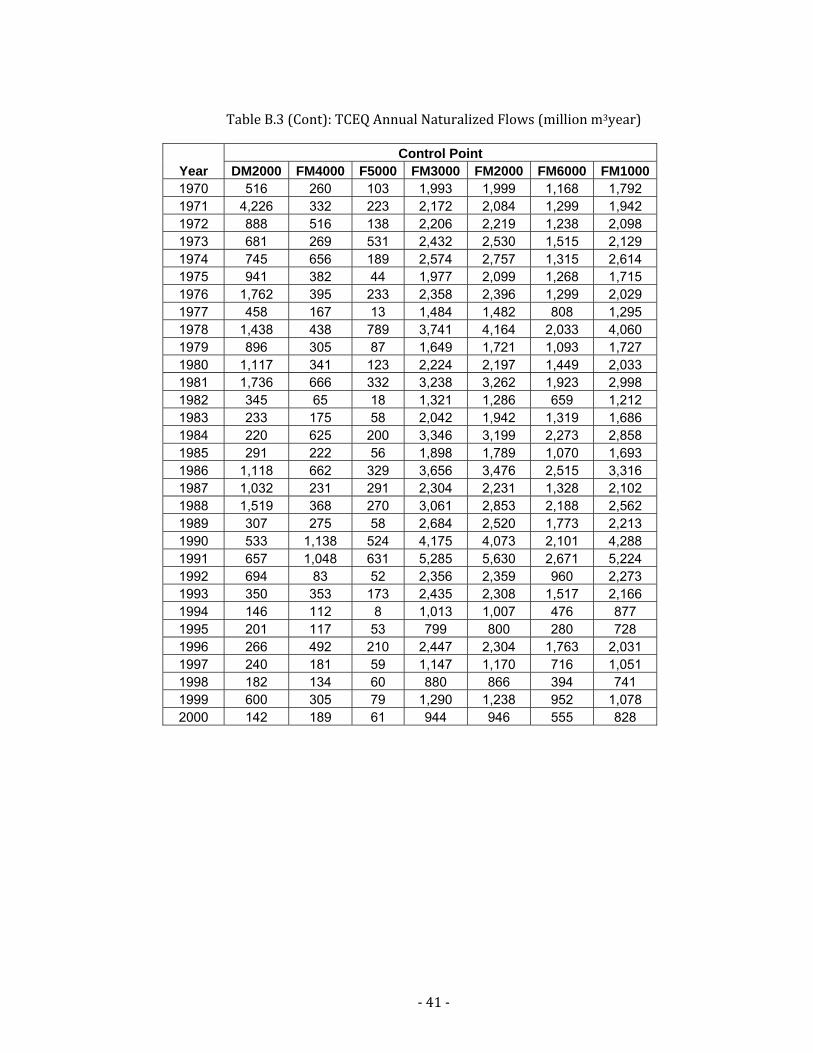
Appendix B. TCEQ AND CONAGUA ANNUAL NATURALIZED FLOWS
B.1. TCEQ ANNUAL NATURALIZED FLOWS
Table B.1: TCEQ Control Points in the U.S. and along the Rio Grande/Rio Bravo
CRWR_ID HydroID Name AT1000PCP110 1040100174 Rio Grande at Fort Quitman, TX AT2000PCP120 1030100007 Rio Grande at El Paso, TX BT1000PCP130 1040100175 Rio Grande abv Rio Conchos, TX CT1000PCP140 1080100377 Rio Grande at Del Rio CT2000PCP150 1040100182 Devils R at Pafford Crossing nr Comstock, TX CT2100PCP160 1040100181 Devils R nr Juno, TX CT3000PCP170 1040100180 Rio Grande at Foster Ranch nr Langtry, TX CT4000PCP180 1040100179 Rio Grande at Johnson Ranch nr Castolon, TX CT5000PCP190 1040100178 Terlingua Ck nr Terlingua, TX CT6000PCP200 1040100177 Rio Grande blw Rio Conchos, TX CT7000PCP210 1040100176 Alamito Creek nr Presidio, TX DT1000PCP220 1080100382 Rio Grande blw Falcon Dam DT3000PCP230 1080100381 Rio Grande at Laredo DT5000PCP240 1080100380 Rio Grande at Piedras Negras DT8000PCP250 1080100379 Pinto Creek near Del Rio DT9000PCP260 1080100378 San Felipe Ck near Del Rio,TX ET1000PCP270 1090100422 Rio Grande blw Anzalduas Dam ET2000PCP280 1090100423 Rio Grande at Rio Grande City GT1000PCP290 1070100119 Pecos R nr Langtry, TX GT2000PCP300 1070100118 Pecos R nr Girvin, TX GT3000PCP310 1070100117 Pecos River Nr Orla Tx GT4000PCP320 1070100115 Delaware R nr Red Bluff, NM GT5000PCP330 1070100116 Pecos R. at Red Bluff, NM
‐ 33 ‐
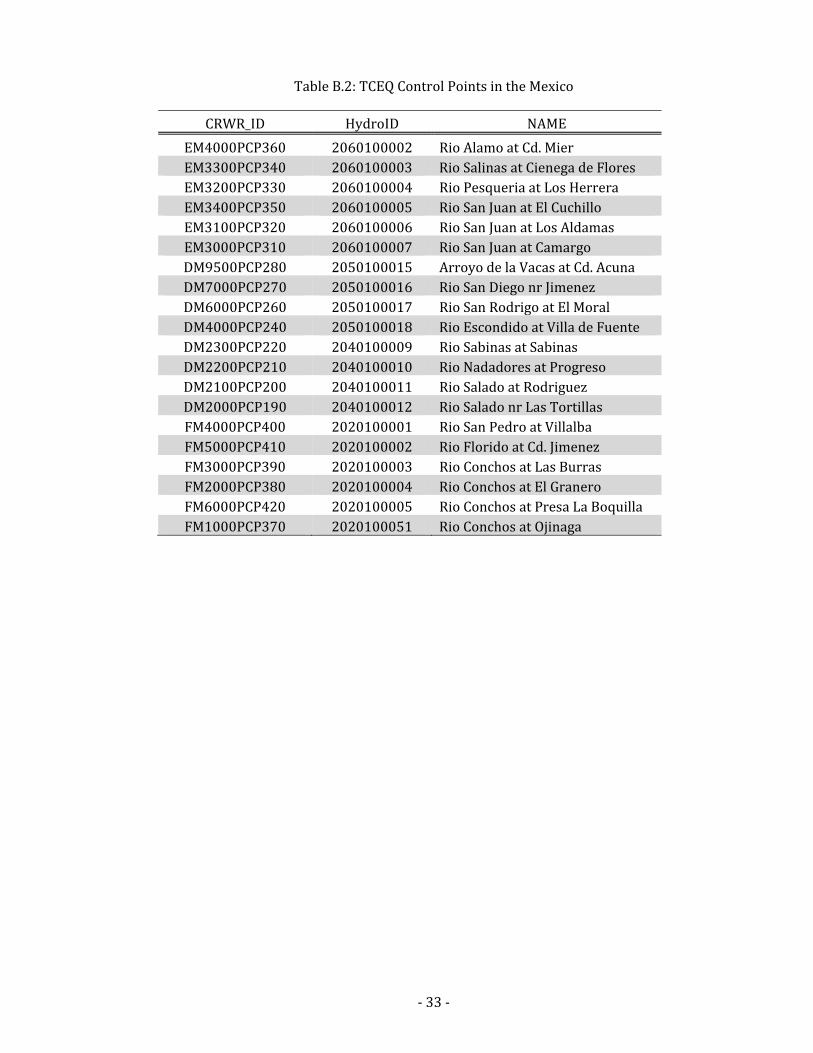
Table B.2: TCEQ Control Points in the Mexico
CRWR_ID HydroID NAME EM4000PCP360 2060100002 Rio Alamo at Cd. Mier EM3300PCP340 2060100003 Rio Salinas at Cienega de Flores EM3200PCP330 2060100004 Rio Pesqueria at Los Herrera EM3400PCP350 2060100005 Rio San Juan at El Cuchillo EM3100PCP320 2060100006 Rio San Juan at Los Aldamas EM3000PCP310 2060100007 Rio San Juan at Camargo DM9500PCP280 2050100015 Arroyo de la Vacas at Cd. Acuna DM7000PCP270 2050100016 Rio San Diego nr Jimenez DM6000PCP260 2050100017 Rio San Rodrigo at El Moral DM4000PCP240 2050100018 Rio Escondido at Villa de Fuente DM2300PCP220 2040100009 Rio Sabinas at Sabinas DM2200PCP210 2040100010 Rio Nadadores at Progreso DM2100PCP200 2040100011 Rio Salado at Rodriguez DM2000PCP190 2040100012 Rio Salado nr Las Tortillas FM4000PCP400 2020100001 Rio San Pedro at Villalba FM5000PCP410 2020100002 Rio Florido at Cd. Jimenez FM3000PCP390 2020100003 Rio Conchos at Las Burras FM2000PCP380 2020100004 Rio Conchos at El Granero FM6000PCP420 2020100005 Rio Conchos at Presa La Boquilla FM1000PCP370 2020100051 Rio Conchos at Ojinaga
CONAGUA_ID HydroID NAME 1 104070000 Rio Bravo at Fort Quitman 2 104070000 Rio Grande above Rio Conchos near Presidio Texas 3 202010003 Rio Florido at San Gabriel 4 202010004 Rio Florido at San Antonio 5 202010001 Rio Florido at Jimenez 6 202080004 Bufalo, V. de Allende 7 202010003 Rio Balleza at Llanitos 8 202010000 Rio Conchos at Presa La Boquilla 9 202010001 Rio San pedro at Presa Francisco I Madero 10 202090000 Rio Conchos at Las Burras 11 202080007 Rio Chuviscar 12 202010000 Rio Conchos at El Granero 13 202080009 Rio Conchos at Ojinaga 14 203010000 Rio Bravo at Johnson Ranch 15 203010000 Rio Bravo at Foster Ranch 16 203010000 Rio Bravo at Presa La Amistad 17 108070001 Rio Bravo Cd. Acuña 18 108070001 Arroyo las Vacas 19 205010001 Rio San Diego 20 108070002 Rio Bravo near Jimenez 21 108070002 Rio San Rodrigo at El Moral 22 108070002 Rio Bravo at Piedras Negras 23 108070002 Rio Escondido at Villa de Fuente 24 108070002 Rio Bravo near Villa Guerrero 25 108070002 Rio Bravo at Nuevo Laredo 26 204010000 Rio Sabinas at Sabinas 27 204010000 Rio Nadadores at Progreso 28 108070002 Rio Salado near Las Tortillas 29 108070003 Rio Bravo below Falcon 30 109070000 Rio Alamo at Cd. Mier 31 206090001 Rio Pesqueria at Icamole 32 206010004 Rio Pesqueria at Los Herrera 33 206010001 Rio San Juan at El Cuchillo 34 206010003 Rio San Juan at Los Aldamas 35 109070000 Rio San Juan at Camargo 36 207010001 Rio Bravo at Anzalduas 37 109070000 Rio Bravo at Matamoros
‐ 43 ‐
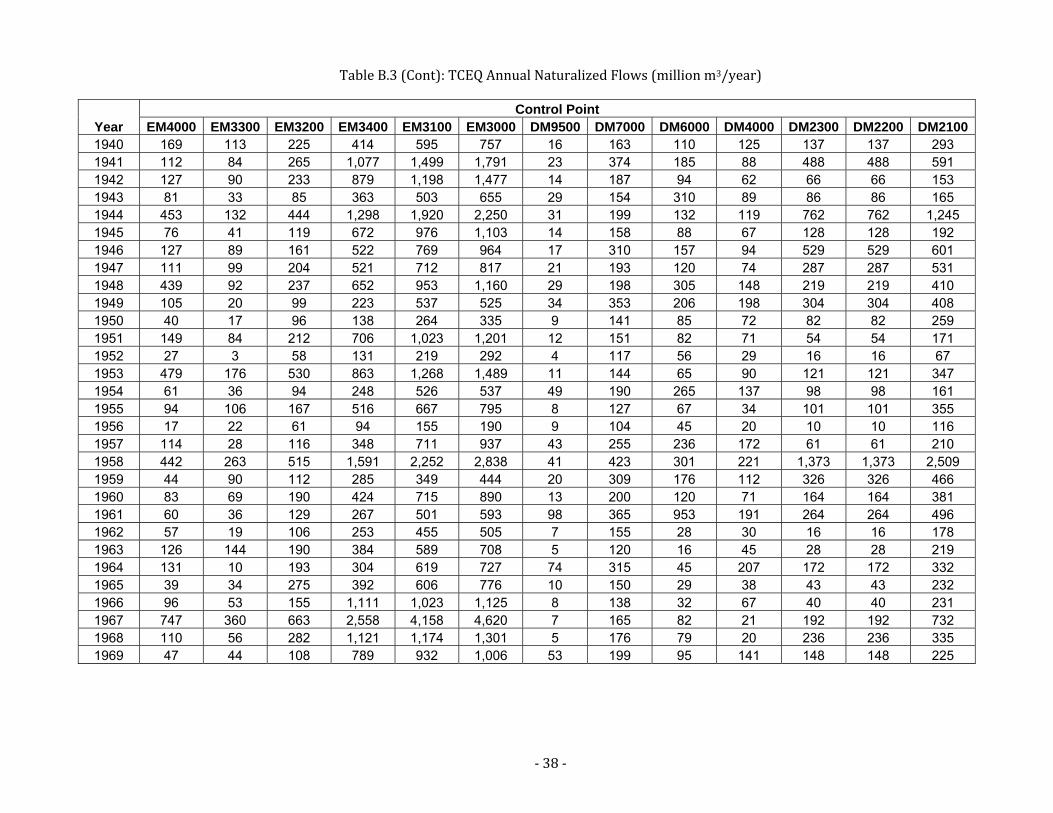
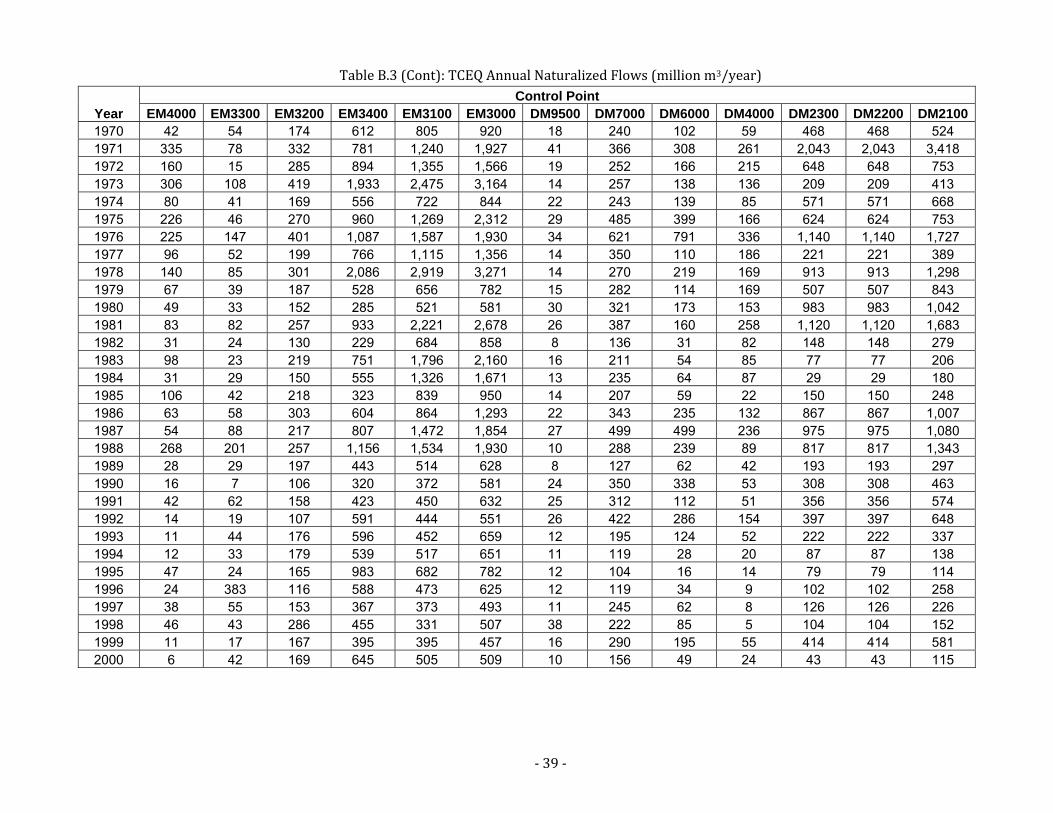
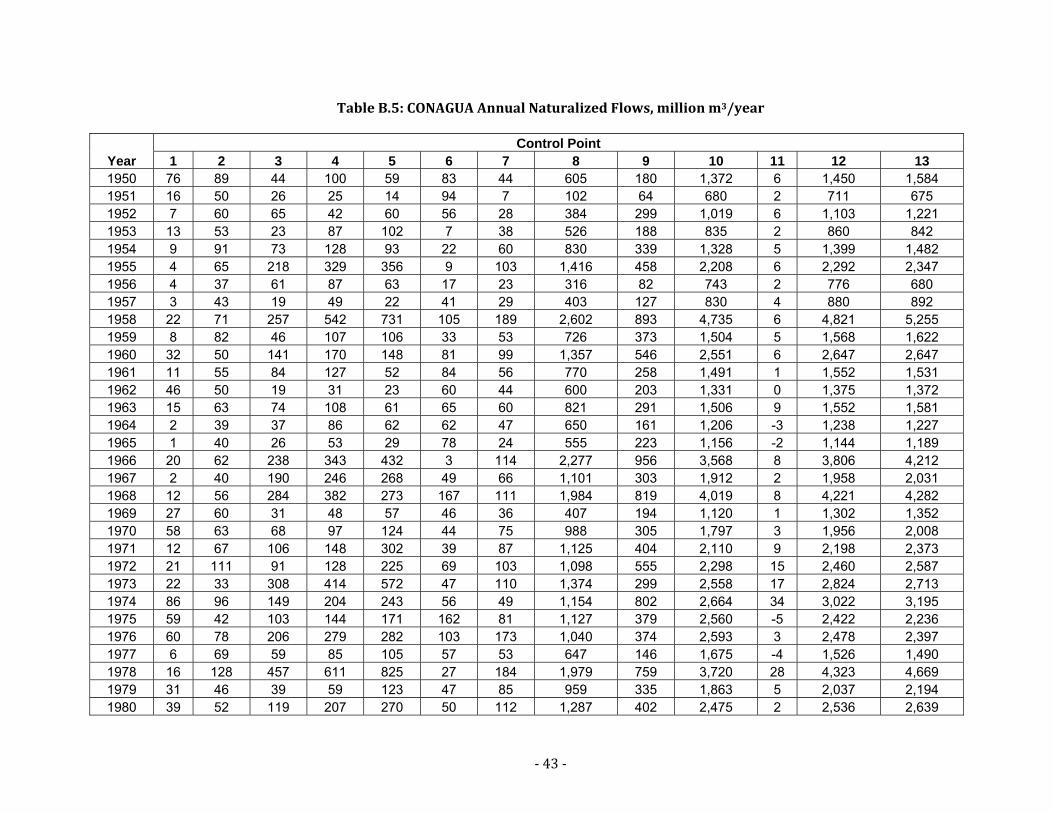
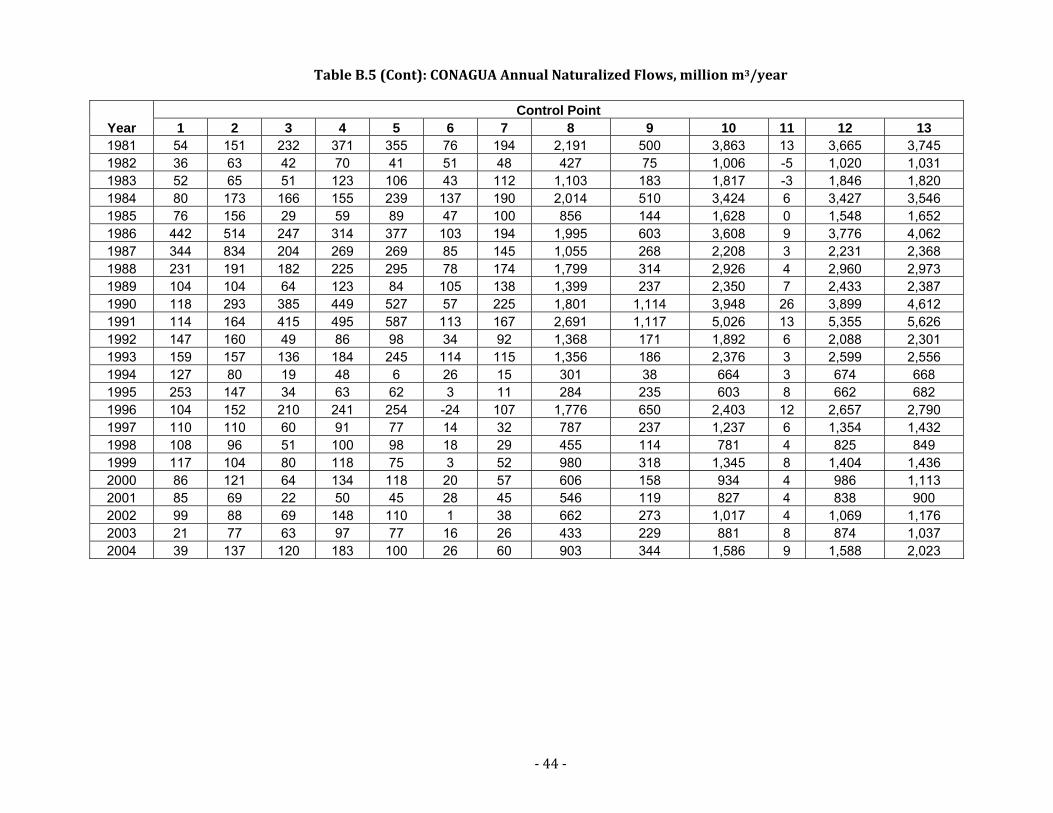
Table B.5: CONAGUA Annual Naturalized Flows, million m3/year