MEMORANDUM At our next RWPG meeting on July 18, 2013, we will be requesting approval of the draft water demand revisions for all water demand categories, including non-municipal water demands. We recognize that non-municipal water demands have been presented and discussed at previous RWPG meetings. A brief recap of the previous discussion and submittals is summarized below: The Region F Water Planning Group (RWPG) previously reviewed and approved irrigation, manufacturing, and steam-electric power water demands on May 17, 2012. At a subsequent RWPG meeting on August 16, 2012, demand revisions to livestock water use were accepted. The Region F non-municipal demands, excluding mining, were submitted to the Texas Water Development Board (TWDB) on September 5, 2012. TWDB approved the proposed irrigation, manufacturing, and steam electric power demands. However, the increase to county livestock demands for exotics and wildlife was not accepted by TWDB. Mining demands for Region F were discussed at the August 16, 2012 RWPG meeting but no action was taken. It was the consensus of the RWPG to wait until the updated Bureau of Economic Geology (BEG) report was available. The updated BEG report was released in September of 2012 and a detailed breakdown of the projections was sent to the planning group members in April of 2013 for consideration. The updated BEG report was also posted on the website in March of 2013. To date, one comment has been received on the updated BEG mining projections for Region F. In preparation for the July 18, 2013 RWPG meeting, the non-municipal demands (irrigation, livestock, manufacturing, steam-electric power, and mining) will be re-considered by the RWPG as a complete package. To aid in your review the following supporting documents are enclosed: 1. Non-Municipal Demands Submittal to TWDB September 5, 2012 2. Rejection of Livestock Demand Documentation 3. Approved Demands Summary Tables 4. Demands for Consideration Summary Tables 5. BEG Updated Mining Demands Detailed Breakdown TO: Region F Water Planning Group FROM: Simone Kiel, Lissa Petry SUBJECT: DRAFT Region F Non-Municipal Demands DATE: 7/2/13 PROJECT: SAN11472 – 2016 Update to the Region F Water Plan
Transcript
MEMORANDUM
At our next RWPG meeting on July 18, 2013, we will be requesting approval of the draft water demand revisions for all water demand categories, including non-municipal water demands. We recognize that non-municipal water demands have been presented and discussed at previous RWPG meetings. A brief recap of the previous discussion and submittals is summarized below:
The Region F Water Planning Group (RWPG) previously reviewed and approved irrigation, manufacturing, and steam-electric power water demands on May 17, 2012.
At a subsequent RWPG meeting on August 16, 2012, demand revisions to livestock water use were accepted. The Region F non-municipal demands, excluding mining, were submitted to the Texas Water Development Board (TWDB) on September 5, 2012.
TWDB approved the proposed irrigation, manufacturing, and steam electric power demands. However, the increase to county livestock demands for exotics and wildlife was not accepted by TWDB.
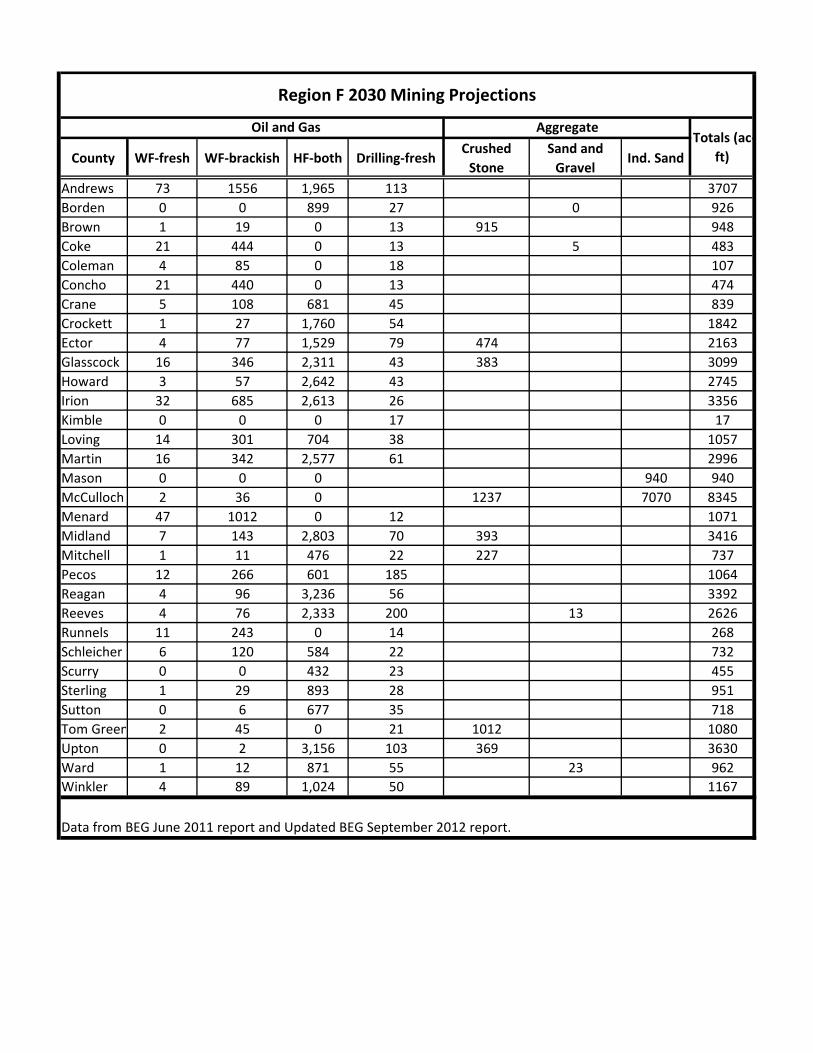
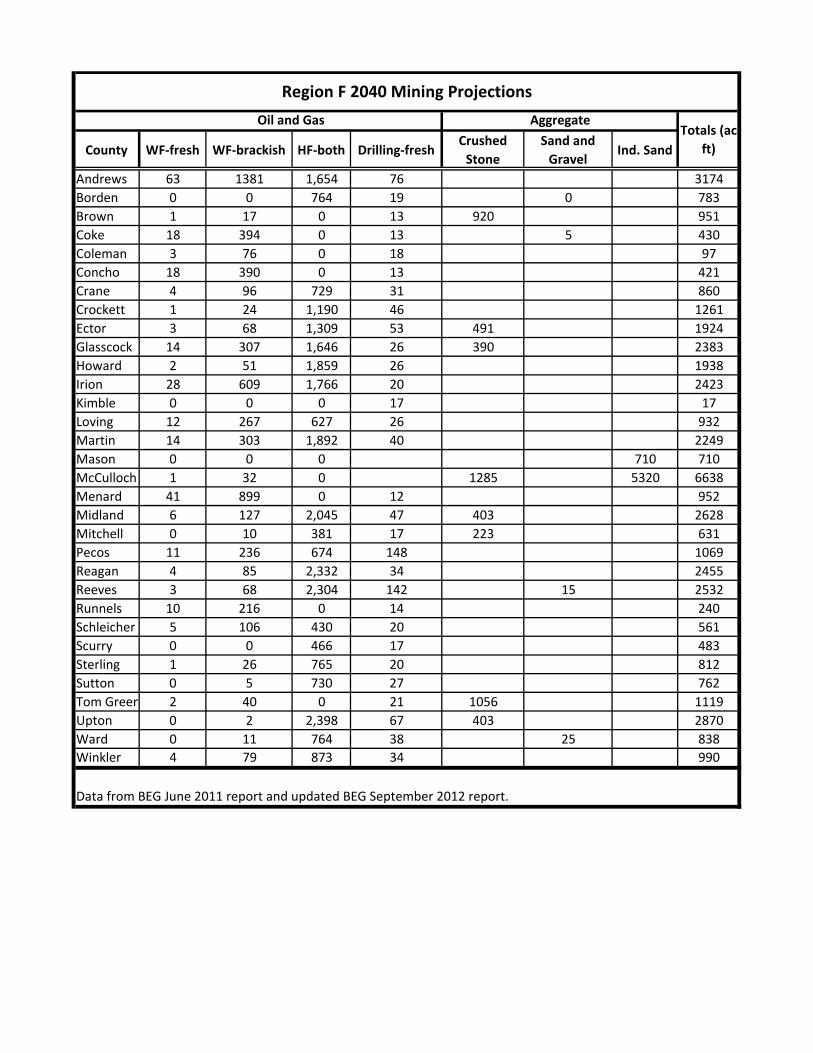
Mining demands for Region F were discussed at the August 16, 2012 RWPG meeting but no action was taken. It was the consensus of the RWPG to wait until the updated Bureau of Economic Geology (BEG) report was available. The updated BEG report was released in September of 2012 and a detailed breakdown of the projections was sent to the planning group members in April of 2013 for consideration. The updated BEG report was also posted on the website in March of 2013. To date, one comment has been received on the updated BEG mining projections for Region F.
In preparation for the July 18, 2013 RWPG meeting, the non-municipal demands (irrigation, livestock, manufacturing, steam-electric power, and mining) will be re-considered by the RWPG as a complete package. To aid in your review the following supporting documents are enclosed:
1. Non-Municipal Demands Submittal to TWDB September 5, 2012 2. Rejection of Livestock Demand Documentation 3. Approved Demands Summary Tables 4. Demands for Consideration Summary Tables 5. BEG Updated Mining Demands Detailed Breakdown
TO: Region F Water Planning Group
FROM: Simone Kiel, Lissa Petry
SUBJECT: DRAFT Region F Non-Municipal Demands
DATE: 7/2/13
PROJECT: SAN11472 – 2016 Update to the Region F Water Plan
DRAFT
THIS DOCUMENT IS RELEASED FOR THE PURPOSE OF INTERIM REVIEW UNDER THE AUTHORITY OF ENGINEER, P.E., TEXAS NO. 12345 ON DATE. IT IS NOT TO BE USED FOR CONSTRUCTION, BIDDING OR PERMIT PURPOSES. FREESE AND NICHOLS, INC. TEXAS REGISTERED ENGINEERING FIRM F- 2144
DRAFT
THIS DOCUMENT IS RELEASED FOR THE PURPOSE OF INTERIM REVIEW UNDER THE AUTHORITY OF ENGINEER, P.E., TEXAS NO. 12345 ON DATE. IT IS NOT TO BE USED FOR CONSTRUCTION, BIDDING OR PERMIT PURPOSES. FREESE AND NICHOLS, INC. TEXAS REGISTERED ENGINEERING FIRM F- 2144
Texas Water Development Board Regional Water Planning
Region F Regional Water Planning Group
Voting Members: Len Wilson, Public, Andrews Wendell Moody, Secretary Public, Concho Jerry Bearden, Counties, Mason Robert Moore, Counties, Runnels Will Wilde, Vice Chair Municipalities, Tom Green Merle Taylor, Municipalities, Scurry John Shepard, Municipalities, Winkler Ben Shepperd, Industrial, Midland Kenneth Dierschke, Agricultural, Tom Green Woody Anderson, Agricultural, Mitchell Terry Scott, Agricultural, Coleman Caroline Runge, Environmental, Menard Gilbert Van Deventer Environmental, Odessa Charles Haygood, Small Business Tim Warren, Elect. Gen. Utilities, Mitchell Stephen Brown, At– Large, River Authority, Tom Green Scott Holland, GMA 7, Irion Paul Weatherby, GMA 3, Pecos Raymond Straub GMA 2, Martin Larry Turnbough, Water District, Reeves John Grant, Chair, Water District, Howard
c/o City of San Angelo - P.O. Box 1751, San Angelo, Texas 76902 Phone: 325-657-4241 - Fax: 325-657-4335
SCHLEICHER • SCURRY • STERLING • SUTTON • TOM GREEN • UPTON • WARD • WINKLER
September 5, 2012
Doug Shaw
Project Manager
Texas Water Development Board
P.O. Box 13231
Austin, TX 78711-3231
Re: Non-Municipal Demands for Region F
Doug,
At the Region F planning group meeting on May 17, 2012, the RWPG approved revisions to the draft de-
mand projections for irrigated agriculture, manufacturing and steam electric power. At a subsequent Region F
meeting on August 16, 2012, the RWPG approved the demand revisions to livestock water use. Technical
memoranda describing the requested changes to these draft non-municipal demands are included in Attach-
ment 1.
Region F decided not to take action on the mining demands at this time. There is considerable variability in
the mining water use throughout the Permian Basin. It was the consensus of the RWPG to delay commenting
on mining water demands until the updated Bureau of Economic Geology study is released in the next couple
of months. It is anticipated that this study will provide a more accurate assessment of the current water use
for mining in Region F.
As requested by the TWDB, an electronic copy of the projected non-municipal water demands and the re-
quested revisions will be emailed to Thomas Barnett at the TWDB with a copy to you.
If you have any questions or need additional information related to the non-municipal demands, please con-
tact Simone Kiel at 817-735-7446.
Sincerely,
John Grant, Region F Chairman
cc: Will Wilde, City of San Angelo
ATTACHMENT 1
MEMORANDUM
1. Introduction As part of Task 2 efforts for the 2016 regional plans, the Texas Water Development Board (TWDB) developed draft non‐municipal water demand projections which were provided to each planning group in October 2011. These draft demand projections were reviewed by the consultant team in conjunction with the Region F Regional Water Planning Group (RWPG). This memorandum discusses the development of recommended revisions to the irrigation and livestock projections. These revisions were approved by the RWPG. 2. Irrigation
a. TWDB Methodology – TWDB estimates irrigation demands by applying an evapotranspiration‐based estimated crop water need to Farm Service Agency (FSA) acreage to generate water need estimates by county, crop, and year. The TWDB also reviews surface water diversions for agricultural purpose. The irrigation estimates are provided each year to agricultural representatives and local groundwater conservation districts for review and input. The adjusted values are then reported as historical irrigation use by county. Table 2‐1 shows the TWDB historic irrigation water use estimates for the counties in Region F.
One concern expressed by the Region F RWPG is that some crops are not tracked by FSA. Water used by these crops is not included in the water use estimates unless corrected by local groundwater districts or agricultural representatives. Counties that do not have such representation may not have accurate irrigation estimates.
The TWDB estimated the base 2010 draft irrigation demands by averaging the historical values for years 2005‐2009. Decadal rates of change from the 2011 Regional Water Plan were then applied to the base projection by county.
b. Assessment Approach – The TWDB draft projections were compared to the historic TWDB irrigation water use estimates (1974‐2010) and projections from the 2011 Region F Regional Water Plan (RWP) on a county‐by‐county basis. Graphical comparisons were presented to the Region F RWPG for input along with a request for additional data to support revisions. The consultants received input from the Middle Pecos Groundwater District and the Region F non‐voting representative from Upton County.
TO: Region F RWPG
CC: File
FROM: Simone Kiel, Jeremy Rice
SUBJECT: Recommended Revisions to TWDB Draft Agricultural Water Demand Projections for the 2016 Region F Regional Water Plan
DATE: Updated, August 29, 2012
August 29, 2012 Page 2 of 10 Recommended Revisions to TWDB Draft Agricultural Projections
c. Results ‐ The TWDB methodology tends to underestimate potential dry year irrigation use for many counties. On a regional scale, the TWDB draft irrigation water demand projections were approximately 71 percent of the 2011 RWP projections and were more than 150,000 ac‐ft below the demand estimated for year 2060. This is primarily due to the TWDB’s reduced base year demands for five counties: Glasscock, Midland, Pecos, Reeves, and Tom Green. The counties showing an increased demand projection in comparison to 2011 RWP values were Borden, Concho, Kimble, Martin, Mitchell, Scurry and Sterling Counties. Based on the maximum historical use from 2005‐2010, fourteen counties had higher water use than 2011 RWP projections for 2010.
d. Recommendations – It is recommended that the maximum irrigation use from 2005‐2010 be used as the 2010 baseline with decadal rates of change from the 2011 Regional Water Plan unless county‐specific data were provided.
Due to a variety of factors (including commodity prices, energy needs and rainfall) irrigation water needs vary from year to year. It is likely that irrigation demands would be higher under drought conditions. Historic data show higher irrigation water use in Region F during dry years. These factors support the requested change to use the highest reported historic water use as the baseline for regional water planning. The data received from the TWDB for 2010 historic water use are draft and the TWDB has not completed their review process. The Middle Pecos Groundwater District provided to Region F the estimated 2010 groundwater use for irrigated agriculture for Pecos County. The TWDB data was updated with the new values.
A summary of the recommendations and additional discussion for specific counties are described below, with recommended values shown in Table 2‐2. Figure 2‐1 shows the recommended irrigation demands for Region F.
o Pecos County – The Middle Pecos Groundwater Conservation District provided 2010 irrigated acreages and application rates for those acres. The 2010 irrigation water use of 126,023 acre‐feet was used as the 2010 base. Due to the increasing trend in water use in Pecos County and the groundwater district’s knowledge of additional acreage that will be irrigated in the near future, the irrigation demand for Pecos County was held constant for 2020‐2070 rather than declining as previously estimated in the 2011 Region F RWP.
o All other counties – It is recommended that the maximum estimated water demand for years 2005‐2010 for each county be used as a base level projected water demand for that county with decadal rates of decline based on the 2011 Region F RWP.
August 29, 2012 Page 3 of 10 Recommended Revisions to TWDB Draft Agricultural Projections
Total 578,606 597,821 593,674 589,525 585,374 581,230 577,147 573,123
August 29, 2012 Page 5 of 10 Recommended Revisions to TWDB Draft Agricultural Projections
Figure 2‐1 Historical and Projected Irrigation Demands for Region F
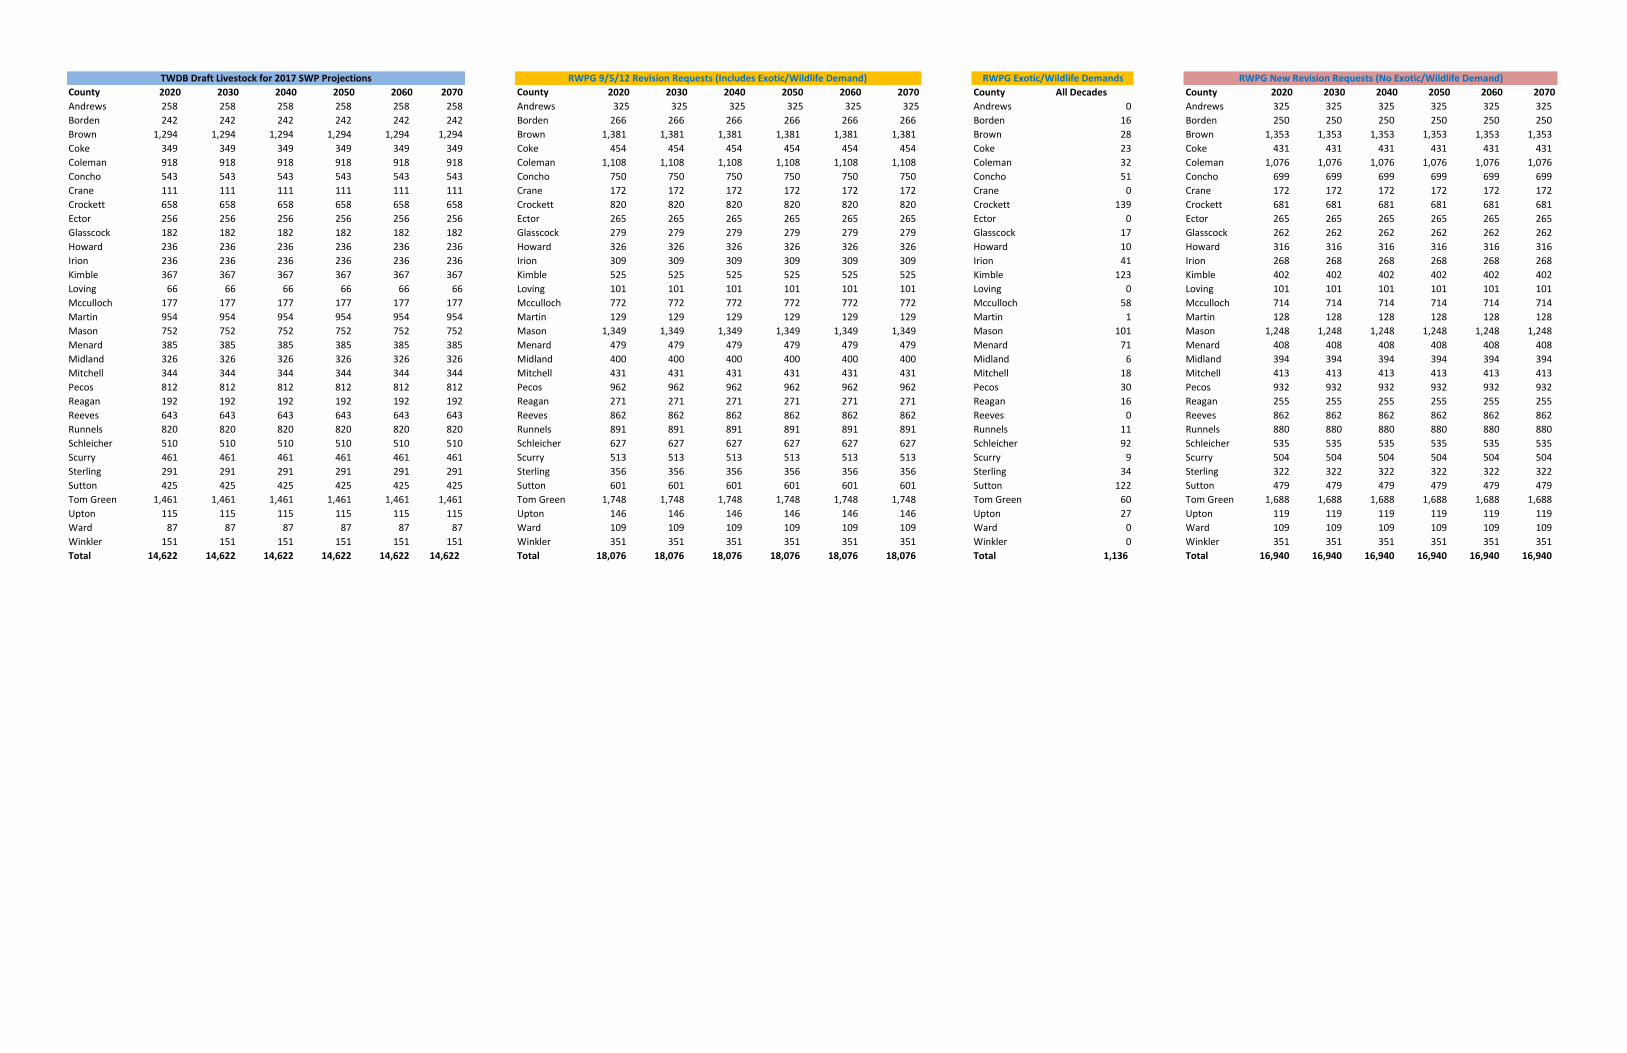
3. Livestock
a. TWDB Methodology – Draft livestock water demands were developed by TWDB by applying per‐head water use estimates by species or category to livestock count estimates from the Texas Agricultural Statistics Service. Water demands were not estimated for wildlife or exotic species.
b. Assessment Approach – The Draft TWDB projections were compared to the historic TWDB livestock water use estimates (1974‐2009) and projections from the 2011 Region F RWP on a county‐by‐county basis. Graphical comparisons were presented to the Region F RWPG for input along with a request for additional data to support revisions. The Region F RWPG questioned the lack of water demand for wildlife and exotic species. In previous planning cycles, the region had included a 10 percent increase in livestock demands to account for wildlife and exotic species. To address wildlife demands for the 2016 Region F RWP, estimates of exotic species and wildlife use were calculated based on animal counts and water use per animal. Data for wildlife counts were obtained from TPWD and water use estimates were obtained from previous studies for Region J. TPWD only keeps animal counts for white‐tail deer and selected exotic species, so only these species were considered.
c. Results–On a regional scale, draft demand projections for livestock (14,622 ac‐ft/yr) are approximately 8,500 ac‐ft/yr lower than the estimates used in the 2011 RWP (23,060 ac‐ft/yr)
TWDB Historic 2011 Region F Plan Irrigation Water Demands Draft Projections for 2017 SWP RWPG Revisions
August 29, 2012 Page 6 of 10 Recommended Revisions to TWDB Draft Agricultural Projections
and approximately 2,300 ac‐ft/yr lower than the TWDB reported maximum historic livestock water use from 2005‐2009 (16,942 ac‐ft/yr). The difference between the TWDB draft projections and the maximum historic use is about 16% for the region. Exotic species and wildlife demand accounts for an additional 1,134 acre‐feet or 6% of demand for a total regional livestock demand of 18,076 ac‐ft/yr.
d. Recommendations – The TWDB historic water use is based on actual livestock counts, but do not include species that are not counted by the TASS. For some counties, such as Kimble and Crockett, wildlife water needs represent a significant portion of the total livestock demand. Including wildlife estimates, the revised livestock demand values are slightly less than projections used in the 2011 Region F RWP but seem reasonable considering the variability of livestock counts over time. It is recommended that the maximum water use for each county plus wildlife water needs be used as the baseline for livestock water demands for the 2016 Region F RWP. These values are held constant through the planning cycle, which is consistent with the previous RWP.
Table 3‐1 shows the TWDB historic livestock water use from 2005‐2009 for the counties in Region F. Table 3‐2 shows the estimated exotic species and wildlife demand by county. The recommended livestock water demands for the 2016 RWP and the 2010 livestock demand from the 2011 Region F RWP are shown in Table 3‐3. Figure 3‐1 shows the recommended livestock demands for Region F.
August 29, 2012 Page 7 of 10 Recommended Revisions to TWDB Draft Agricultural Projections
Tom Green 1,461 1,748 1,748 1,748 1,748 1,748 1,748 1,748
Upton 115 146 146 146 146 146 146 146
Ward 87 109 109 109 109 109 109 109
Winkler 151 351 351 351 351 351 351 351
Total 14,622 18,076 18,076 18,076 18,076 18,076 18,076 18,076
August 29, 2012 Page 10 of 10 Recommended Revisions to TWDB Draft Agricultural Projections
Figure 3‐1 Historical and Projected Livestock Demands for Region F
LBG‐GUYTON ASSOCIATES MEMORANDUM
TO: Region F RWPG
FROM: LBG‐GUYTON ASSOCIATES
SUBJECT: Recommended Revisions to TWDB Draft Water Demand Projections for Power and Manufacturing for the 2016 Region F Regional Water Plan
DATE: August 29, 2012
CC: Project File
1. Introduction
As part of Task 2 efforts for the 2016 regional plans, the Texas Water Development Board (TWDB) developed draft non‐municipal water demand projections which were provided to each planning group in October 2011. These draft demand projections were reviewed by the consultant team in conjunction with the Region F Regional Water Planning Group (RWPG). The RWPG approved these revisions at the May 17, 2012 meeting. This memorandum discusses the review process and recommended revisions to the power and manufacturing projections.
2. Manufacturing
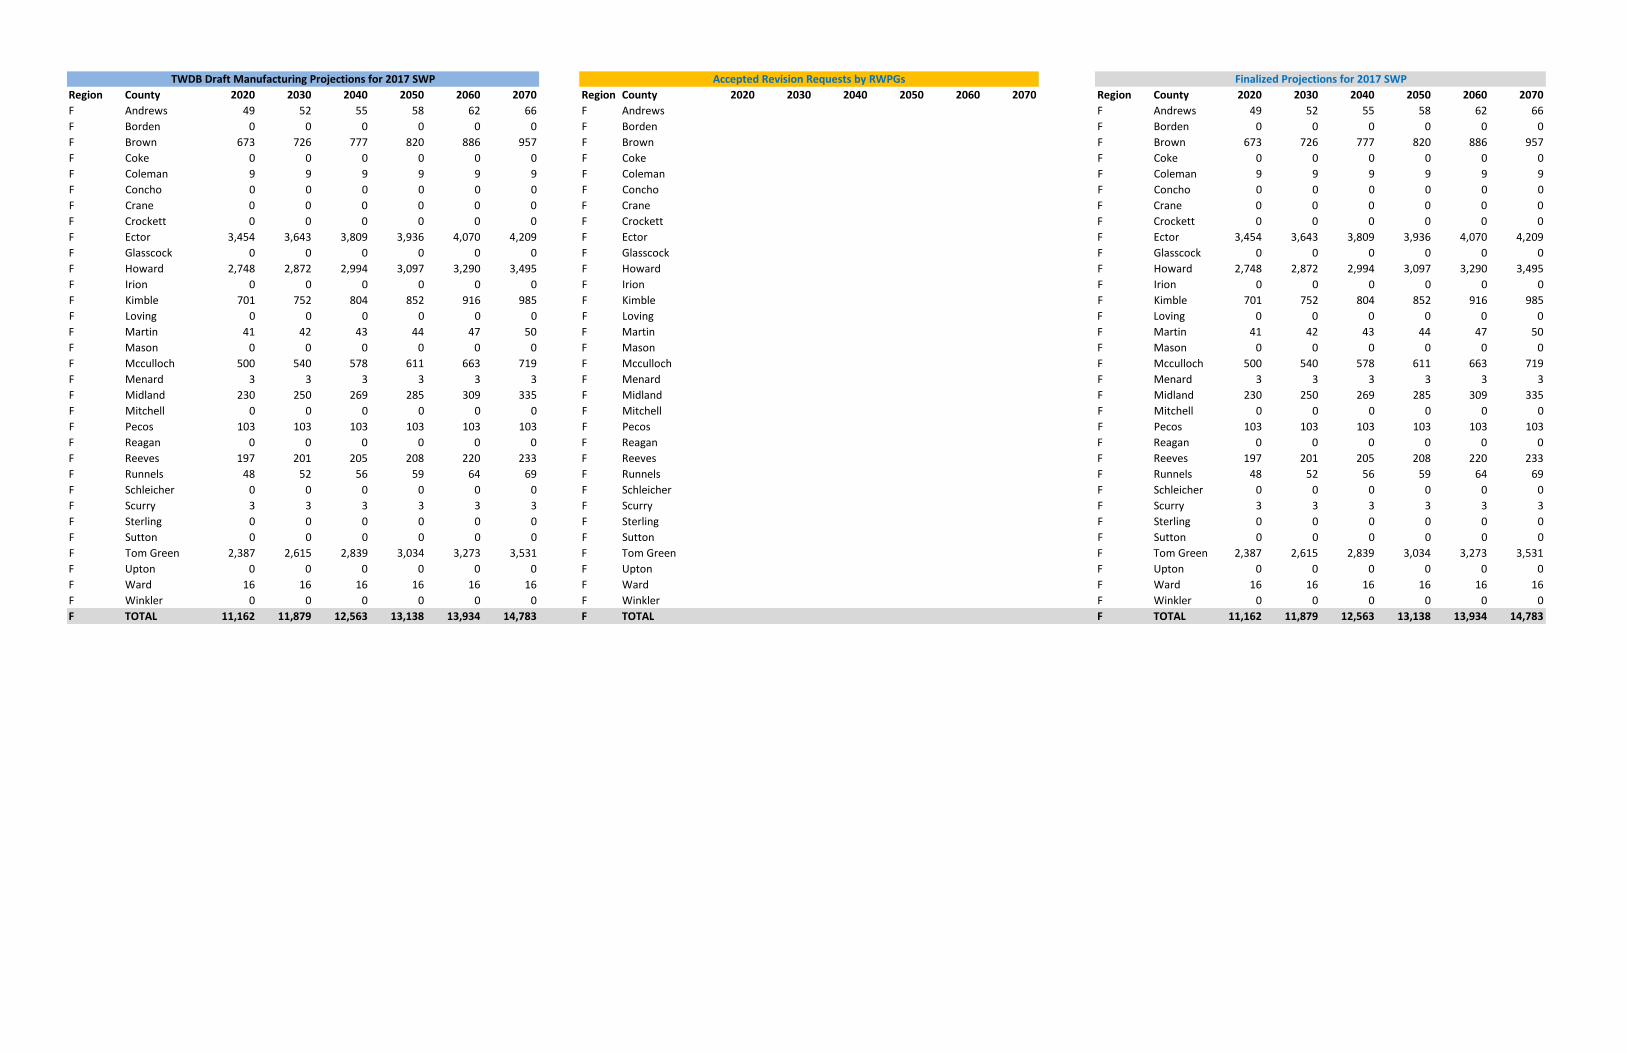
a. TWDB Methodology – Draft manufacturing water demand projections utilized 2004‐2008 data from TWDB’s Water Use Survey (WUS). In counties where reported employment from the companies returning surveys was low compared to manufacturing employment data reported by the Bureau of Economic Analysis (BEA), surveyed water use was adjusted to account for non‐responses. The rate of change for projections from the 2011 Regional Water Plans was then applied to the new base year estimate.
b. Assessment Approach – The TWDB draft projections were compared to projections from the 2012 SWP on a regional and county‐by‐county basis. Graphical comparisons were presented to the Region F RWPG for input along with a request for additional data to support revisions.
c. Results – Manufacturing demand estimates are very similar to 2012 SWP projections and increase slightly over the planning period.
d. Recommendation – Use TWDB estimates.
Recommended Revisions to TWDB Projected Water Demands for
Mining, Manufacturing, and Steam Electric Power
LBG-Guyton Associates 2
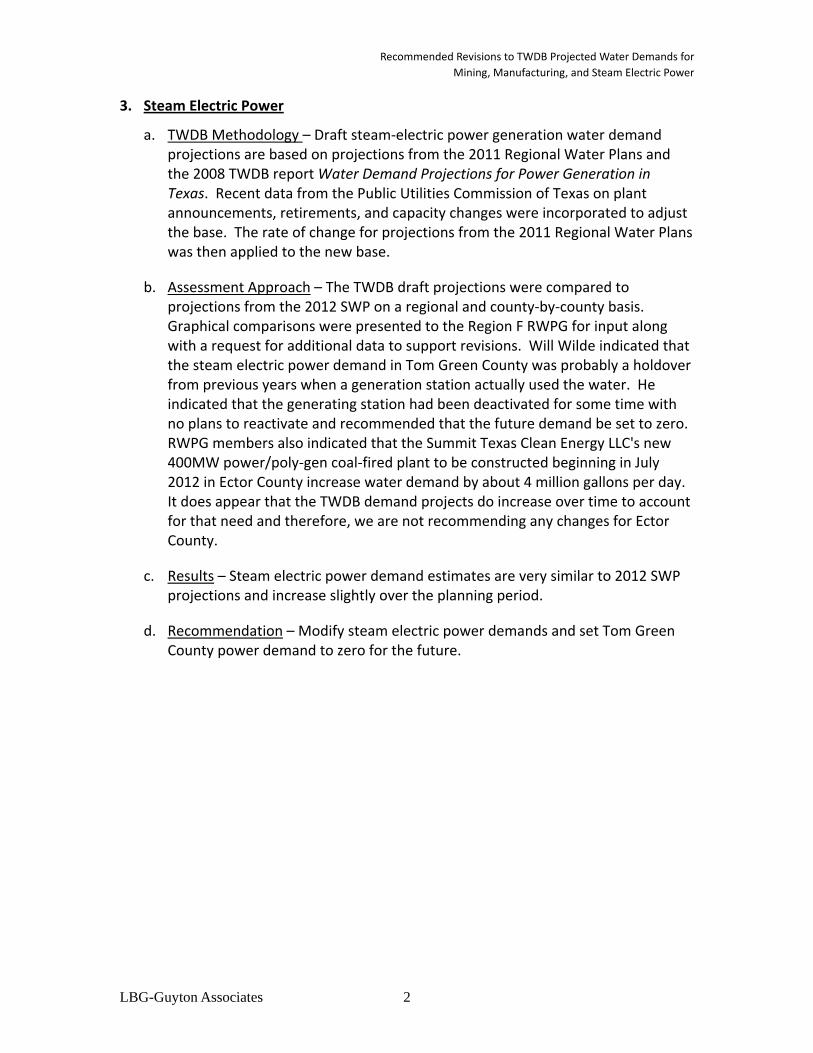
3. Steam Electric Power
a. TWDB Methodology – Draft steam‐electric power generation water demand projections are based on projections from the 2011 Regional Water Plans and the 2008 TWDB report Water Demand Projections for Power Generation in Texas. Recent data from the Public Utilities Commission of Texas on plant announcements, retirements, and capacity changes were incorporated to adjust the base. The rate of change for projections from the 2011 Regional Water Plans was then applied to the new base.
b. Assessment Approach – The TWDB draft projections were compared to projections from the 2012 SWP on a regional and county‐by‐county basis. Graphical comparisons were presented to the Region F RWPG for input along with a request for additional data to support revisions. Will Wilde indicated that the steam electric power demand in Tom Green County was probably a holdover from previous years when a generation station actually used the water. He indicated that the generating station had been deactivated for some time with no plans to reactivate and recommended that the future demand be set to zero. RWPG members also indicated that the Summit Texas Clean Energy LLC's new 400MW power/poly‐gen coal‐fired plant to be constructed beginning in July 2012 in Ector County increase water demand by about 4 million gallons per day. It does appear that the TWDB demand projects do increase over time to account for that need and therefore, we are not recommending any changes for Ector County.
c. Results – Steam electric power demand estimates are very similar to 2012 SWP projections and increase slightly over the planning period.
d. Recommendation – Modify steam electric power demands and set Tom Green County power demand to zero for the future.
E-mail from the TWDB regarding requested changes to livestock demands From: Doug Shaw [mailto:[email protected]] Sent: Monday, February 11, 2013 1:32 PM To: [email protected] Cc: Simone Kiel Subject: Region F livestock I just wanted to let y’all know that I was just informed that the TWDB would not approve the 10% increase to county livestock demands for exotics/wildlife. I have mentioned that an increase for wildlife was factored into livestock demands for the last two rounds of planning, however the response I received was that the TWDB would be receptive to a more current count of “confined” animals and would be willing to consider approving demands related to those estimates (the current data used is from 1995 and I believe includes all animals in a county not just those behind a game fence). Doug (512) 463-1711
Region County 2020 2030 2040 2050 2060 2070 Region County 2020 2030 2040 2050 2060 2070 Region County 2020 2030 2040 2050 2060 2070F Andrews 30,485 30,229 29,971 29,715 29,459 29,213 F Andrews 37,898 37,579 37,258 36,939 36,621 36,306 F Andrews 37,898 37,579 37,258 36,939 36,621 36,306F Borden 2,740 2,735 2,733 2,728 2,726 2,723 F Borden 4,000 3,993 3,990 3,983 3,980 3,977 F Borden 4,000 3,993 3,990 3,983 3,980 3,977F Brown 7,782 7,755 7,729 7,702 7,676 7,650 F Brown 9,435 9,403 9,371 9,338 9,306 9,275 F Brown 9,435 9,403 9,371 9,338 9,306 9,275F Coke 691 690 689 689 689 689 F Coke 965 963 962 962 962 962 F Coke 965 963 962 962 962 962F Coleman 597 597 597 597 597 597 F Coleman 770 770 770 770 770 770 F Coleman 770 770 770 770 770 770F Concho 5,756 5,732 5,709 5,687 5,665 5,643 F Concho 9,734 9,693 9,654 9,618 9,582 9,546 F Concho 9,734 9,693 9,654 9,618 9,582 9,546F Crane 0 0 0 0 0 0 F Crane 0 0 0 0 0 0 F Crane 0 0 0 0 0 0F Crockett 327 321 315 311 305 0 F Crockett 479 470 461 455 446 437 F Crockett 479 470 461 455 446 437F Ector 1,015 1,003 991 979 967 956 F Ector 1,432 1,415 1,397 1,380 1,362 1,345 F Ector 1,432 1,415 1,397 1,380 1,362 1,345F Glasscock 43,123 42,777 42,430 42,082 41,739 41,406 F Glasscock 56,707 56,252 55,796 55,339 54,887 54,439 F Glasscock 56,707 56,252 55,796 55,339 54,887 54,439F Howard 4,712 4,658 4,603 4,549 4,495 4,444 F Howard 6,722 6,645 6,567 6,490 6,413 6,337 F Howard 6,722 6,645 6,567 6,490 6,413 6,337F Irion 930 910 889 869 849 831 F Irion 1,467 1,435 1,402 1,370 1,338 1,307 F Irion 1,467 1,435 1,402 1,370 1,338 1,307F Kimble 2,516 2,423 2,327 2,231 2,141 2,064 F Kimble 2,939 2,830 2,718 2,606 2,501 2,400 F Kimble 2,939 2,830 2,718 2,606 2,501 2,400F Loving 0 0 0 0 0 0 F Loving 0 0 0 0 0 0 F Loving 0 0 0 0 0 0F Martin 24,287 23,854 23,421 22,990 22,565 22,172 F Martin 36,322 35,674 35,026 34,381 33,746 33,123 F Martin 36,322 35,674 35,026 34,381 33,746 33,123F Mason 6,085 5,997 5,909 5,821 5,734 5,652 F Mason 8,294 8,174 8,054 7,935 7,816 7,699 F Mason 8,294 8,174 8,054 7,935 7,816 7,699F Mcculloch 2,634 2,601 2,567 2,534 2,502 2,471 F Mcculloch 3,584 3,539 3,493 3,448 3,404 3,361 F Mcculloch 3,584 3,539 3,493 3,448 3,404 3,361F Menard 1,810 1,804 1,798 1,791 1,785 1,779 F Menard 2,530 2,522 2,514 2,505 2,497 2,489 F Menard 2,530 2,522 2,514 2,505 2,497 2,489F Midland 24,681 24,488 24,295 24,101 23,910 23,724 F Midland 33,276 33,016 32,756 32,495 32,237 31,981 F Midland 33,276 33,016 32,756 32,495 32,237 31,981F Mitchell 8,513 8,470 8,428 8,386 8,344 8,303 F Mitchell 11,519 11,460 11,404 11,348 11,292 11,236 F Mitchell 11,519 11,460 11,404 11,348 11,292 11,236F Pecos 64,619 63,593 62,566 61,540 60,531 59,588 F Pecos 126,023 126,023 126,023 126,023 126,023 126,023 F Pecos 126,023 126,023 126,023 126,023 126,023 126,023F Reagan 16,550 16,272 15,993 15,715 15,441 15,186 F Reagan 19,130 18,808 18,486 18,164 17,848 17,537 F Reagan 19,130 18,808 18,486 18,164 17,848 17,537F Reeves 65,500 64,940 64,379 63,819 63,265 62,730 F Reeves 91,357 90,577 89,795 89,015 88,242 87,475 F Reeves 91,357 90,577 89,795 89,015 88,242 87,475F Runnels 3,259 3,245 3,231 3,217 3,203 3,190 F Runnels 4,009 3,991 3,973 3,955 3,937 3,919 F Runnels 4,009 3,991 3,973 3,955 3,937 3,919F Schleicher 940 920 901 881 862 845 F Schleicher 1,414 1,385 1,356 1,327 1,298 1,270 F Schleicher 1,414 1,385 1,356 1,327 1,298 1,270F Scurry 5,188 5,011 4,834 4,657 4,487 4,340 F Scurry 7,305 7,056 6,806 6,557 6,318 6,088 F Scurry 7,305 7,056 6,806 6,557 6,318 6,088F Sterling 683 654 625 596 569 546 F Sterling 983 942 901 860 820 782 F Sterling 983 942 901 860 820 782F Sutton 1,195 1,171 1,148 1,124 1,101 1,080 F Sutton 1,803 1,767 1,733 1,697 1,663 1,629 F Sutton 1,803 1,767 1,733 1,697 1,663 1,629F Tom Green 68,892 68,724 68,556 68,385 68,217 68,050 F Tom Green 93,579 93,350 93,121 92,889 92,660 92,432 F Tom Green 93,579 93,350 93,121 92,889 92,660 92,432F Upton 7,350 7,245 7,139 7,033 6,929 6,831 F Upton 9,473 9,338 9,202 9,066 8,932 8,800 F Upton 9,473 9,338 9,202 9,066 8,932 8,800F Ward 4,052 4,001 3,950 3,900 3,850 3,803 F Ward 5,613 5,543 5,473 5,403 5,334 5,266 F Ward 5,613 5,543 5,473 5,403 5,334 5,266F Winkler 3,435 3,435 3,435 3,435 3,435 3,435 F Winkler 4,912 4,912 4,912 4,912 4,912 4,912 F Winkler 4,912 4,912 4,912 4,912 4,912 4,912F TOTAL 410,347 406,255 402,158 398,064 394,038 389,941 F TOTAL 593,674 589,525 585,374 581,230 577,147 573,123 F TOTAL 593,674 589,525 585,374 581,230 577,147 573,123
TWDB Draft Irrigation Projections for 2017 SWP Accepted Revision Requests by RWPGs Finalized Projections for 2017 SWP
Region County 2020 2030 2040 2050 2060 2070 Region County 2020 2030 2040 2050 2060 2070 Region County 2020 2030 2040 2050 2060 2070F Andrews 49 52 55 58 62 66 F Andrews F Andrews 49 52 55 58 62 66F Borden 0 0 0 0 0 0 F Borden F Borden 0 0 0 0 0 0F Brown 673 726 777 820 886 957 F Brown F Brown 673 726 777 820 886 957F Coke 0 0 0 0 0 0 F Coke F Coke 0 0 0 0 0 0F Coleman 9 9 9 9 9 9 F Coleman F Coleman 9 9 9 9 9 9F Concho 0 0 0 0 0 0 F Concho F Concho 0 0 0 0 0 0F Crane 0 0 0 0 0 0 F Crane F Crane 0 0 0 0 0 0F Crockett 0 0 0 0 0 0 F Crockett F Crockett 0 0 0 0 0 0F Ector 3,454 3,643 3,809 3,936 4,070 4,209 F Ector F Ector 3,454 3,643 3,809 3,936 4,070 4,209F Glasscock 0 0 0 0 0 0 F Glasscock F Glasscock 0 0 0 0 0 0F Howard 2,748 2,872 2,994 3,097 3,290 3,495 F Howard F Howard 2,748 2,872 2,994 3,097 3,290 3,495F Irion 0 0 0 0 0 0 F Irion F Irion 0 0 0 0 0 0F Kimble 701 752 804 852 916 985 F Kimble F Kimble 701 752 804 852 916 985F Loving 0 0 0 0 0 0 F Loving F Loving 0 0 0 0 0 0F Martin 41 42 43 44 47 50 F Martin F Martin 41 42 43 44 47 50F Mason 0 0 0 0 0 0 F Mason F Mason 0 0 0 0 0 0F Mcculloch 500 540 578 611 663 719 F Mcculloch F Mcculloch 500 540 578 611 663 719F Menard 3 3 3 3 3 3 F Menard F Menard 3 3 3 3 3 3F Midland 230 250 269 285 309 335 F Midland F Midland 230 250 269 285 309 335F Mitchell 0 0 0 0 0 0 F Mitchell F Mitchell 0 0 0 0 0 0F Pecos 103 103 103 103 103 103 F Pecos F Pecos 103 103 103 103 103 103F Reagan 0 0 0 0 0 0 F Reagan F Reagan 0 0 0 0 0 0F Reeves 197 201 205 208 220 233 F Reeves F Reeves 197 201 205 208 220 233F Runnels 48 52 56 59 64 69 F Runnels F Runnels 48 52 56 59 64 69F Schleicher 0 0 0 0 0 0 F Schleicher F Schleicher 0 0 0 0 0 0F Scurry 3 3 3 3 3 3 F Scurry F Scurry 3 3 3 3 3 3F Sterling 0 0 0 0 0 0 F Sterling F Sterling 0 0 0 0 0 0F Sutton 0 0 0 0 0 0 F Sutton F Sutton 0 0 0 0 0 0F Tom Green 2,387 2,615 2,839 3,034 3,273 3,531 F Tom Green F Tom Green 2,387 2,615 2,839 3,034 3,273 3,531F Upton 0 0 0 0 0 0 F Upton F Upton 0 0 0 0 0 0F Ward 16 16 16 16 16 16 F Ward F Ward 16 16 16 16 16 16F Winkler 0 0 0 0 0 0 F Winkler F Winkler 0 0 0 0 0 0F TOTAL 11,162 11,879 12,563 13,138 13,934 14,783 F TOTAL F TOTAL 11,162 11,879 12,563 13,138 13,934 14,783
TWDB Draft Manufacturing Projections for 2017 SWP Accepted Revision Requests by RWPGs Finalized Projections for 2017 SWP
Region County 2020 2030 2040 2050 2060 2070 Region County 2020 2030 2040 2050 2060 2070 Region County 2020 2030 2040 2050 2060 2070F Andrews 0 0 0 0 0 0 F Andrews F Andrews 0 0 0 0 0 0F Borden 0 0 0 0 0 0 F Borden F Borden 0 0 0 0 0 0F Brown 0 0 0 0 0 0 F Brown F Brown 0 0 0 0 0 0F Coke 247 289 339 401 477 528 F Coke F Coke 247 289 339 401 477 528F Coleman 0 0 0 0 0 0 F Coleman F Coleman 0 0 0 0 0 0F Concho 0 0 0 0 0 0 F Concho F Concho 0 0 0 0 0 0F Crane 0 0 0 0 0 0 F Crane F Crane 0 0 0 0 0 0F Crockett 776 907 1,067 1,262 1,500 1,662 F Crockett F Crockett 776 907 1,067 1,262 1,500 1,662F Ector 9,436 11,031 12,976 15,347 18,237 21,672 F Ector F Ector 9,436 11,031 12,976 15,347 18,237 21,672F Glasscock 0 0 0 0 0 0 F Glasscock F Glasscock 0 0 0 0 0 0F Howard 0 0 0 0 0 0 F Howard F Howard 0 0 0 0 0 0F Irion 0 0 0 0 0 0 F Irion F Irion 0 0 0 0 0 0F Kimble 0 0 0 0 0 0 F Kimble F Kimble 0 0 0 0 0 0F Loving 0 0 0 0 0 0 F Loving F Loving 0 0 0 0 0 0F Martin 0 0 0 0 0 0 F Martin F Martin 0 0 0 0 0 0F Mason 0 0 0 0 0 0 F Mason F Mason 0 0 0 0 0 0F McCulloch 0 0 0 0 0 0 F Mcculloch F McCulloch 0 0 0 0 0 0F Menard 0 0 0 0 0 0 F Menard F Menard 0 0 0 0 0 0F Midland 0 0 0 0 0 0 F Midland F Midland 0 0 0 0 0 0F Mitchell 4,847 4,670 4,493 4,317 4,140 3,994 F Mitchell F Mitchell 4,847 4,670 4,493 4,317 4,140 3,994F Pecos 0 0 0 0 0 0 F Pecos F Pecos 0 0 0 0 0 0F Reagan 0 0 0 0 0 0 F Reagan F Reagan 0 0 0 0 0 0F Reeves 0 0 0 0 0 0 F Reeves F Reeves 0 0 0 0 0 0F Runnels 0 0 0 0 0 0 F Runnels F Runnels 0 0 0 0 0 0F Schleicher 0 0 0 0 0 0 F Schleicher F Schleicher 0 0 0 0 0 0F Scurry 0 0 0 0 0 0 F Scurry F Scurry 0 0 0 0 0 0F Sterling 0 0 0 0 0 0 F Sterling F Sterling 0 0 0 0 0 0F Sutton 0 0 0 0 0 0 F Sutton F Sutton 0 0 0 0 0 0F Tom Green 737 862 1,014 1,199 1,425 1,693 F Tom Green 0 0 0 0 0 0 F Tom Green 0 0 0 0 0 0F Upton 0 0 0 0 0 0 F Upton F Upton 0 0 0 0 0 0F Ward 3,779 4,418 5,196 6,145 7,303 8,269 F Ward F Ward 3,779 4,418 5,196 6,145 7,303 8,269F Winkler 0 0 0 0 0 0 F Winkler F Winkler 0 0 0 0 0 0F TOTAL 19,822 22,177 25,085 28,671 33,082 37,818 F TOTAL F 19,085 21,315 24,071 27,472 31,657 36,125
TWDB Draft Steam Electric Projections for 2017 SWP Accepted Revision Requests by RWPGs Finalized Projections for 2017 SWP