MEMORANDUM TO: VSC Finance & Facilities Committee M. Jerome Diamond J. Churchill Hindes, Chair Tim Jerman Bill Lippert Christopher Macfarlane, Vice Chair Linda Milne Martha O’Connor Aly Richards FROM: Steve Wisloski, Chief Financial Officer DATE: February 16, 2017 SUBJ: Finance & Facilities Committee Meeting on February 22, 2017 The Finance and Facilities Committee of the Board of Trustees will meet from 1:00 p.m. to 3:00 p.m. in Room 101 of the Chancellor’s Office. Please find the agenda and materials attached. The primary purpose of this meeting will be to review 2 nd quarter FY2017 operating results, discuss the outlook for the remainder of this fiscal year, and then to have the Chancellor and Presidents review their initial thinking with respect to FY2018 budgets, both at the level of individual institutions and from a System level. Similar to the process the Committee followed last year, this meeting will be the first in a three- meeting budget development process. Because 2 nd quarter results provide fairly robust year-end projections, and since year-end projections are the starting point for next year’s budgets, this is an appropriate time to discuss in general terms what known factors, as well as not-yet-knowns— for example, the State appropriation, estimated health care costs, admissions and enrollments, and so forth—will or could influence FY2018 budget development. Preliminary FY2018 budgets will be presented and discussed at the April 10 meeting, and final budgets will be submitted for the Committee’s approval and recommendation at the May 31 meeting.
Transcript
MEMORANDUM TO: VSC Finance & Facilities Committee
M. Jerome Diamond J. Churchill Hindes, Chair
Tim Jerman Bill Lippert
Christopher Macfarlane, Vice Chair Linda Milne Martha O’Connor Aly Richards
FROM: Steve Wisloski, Chief Financial Officer
DATE: February 16, 2017
SUBJ: Finance & Facilities Committee Meeting on February 22, 2017 The Finance and Facilities Committee of the Board of Trustees will meet from 1:00 p.m. to 3:00 p.m. in Room 101 of the Chancellor’s Office. Please find the agenda and materials attached. The primary purpose of this meeting will be to review 2nd quarter FY2017 operating results, discuss the outlook for the remainder of this fiscal year, and then to have the Chancellor and Presidents review their initial thinking with respect to FY2018 budgets, both at the level of individual institutions and from a System level. Similar to the process the Committee followed last year, this meeting will be the first in a three-meeting budget development process. Because 2nd quarter results provide fairly robust year-end projections, and since year-end projections are the starting point for next year’s budgets, this is an appropriate time to discuss in general terms what known factors, as well as not-yet-knowns—for example, the State appropriation, estimated health care costs, admissions and enrollments, and so forth—will or could influence FY2018 budget development. Preliminary FY2018 budgets will be presented and discussed at the April 10 meeting, and final budgets will be submitted for the Committee’s approval and recommendation at the May 31 meeting.
The meeting agenda also includes an update on the planned debt restructuring, and a review and approval of the debt management policy introduced at the November 30 meeting. The meeting will conclude with a quarterly cash and investments review, and an updated schedule of meetings and major topics covered for the balance of the fiscal year. Should you have any questions regarding the upcoming meeting or any other matter, or any requested additions to the agenda, please contact me at [email protected] or (802) 224-3022. Thank you. Attachments:
1. Agenda 2. Meeting Materials
cc: VSC Board of Trustees, Council of Presidents and Business Affairs Council
David Beatty, Vermont Department of Finance & Management The Honorable Douglas Hoffer, Vermont State Auditor
Vermont State Colleges Board of Trustees Finance and Facilities Committee Meeting
February 22, 2017
AGENDA
1. Call to Order
2. Consent agenda a. Approve minutes of January 9, 2017 meeting b. Grants and Endowments
3. Legislative Update
4. Discussion of first half results and outlook for balance of FY2017
Vermont State Colleges Board of Trustees Finance & Facilities Committee Meeting Materials 4 February 22, 2017
UNAPPROVED Minutes of the VSC Board of Trustees Finance and Facilities Committee held Monday, January 9, 2017 at the Office of the Chancellor, Montpelier, VT Note: These are unapproved minutes, subject to amendment and/or approval at the subsequent meeting. The Vermont State Colleges Board of Trustees Finance and Facilities Committee met on Monday, January 9, 2017 at the Office of the Chancellor, Montpelier, VT. Committee members present: Jerry Diamond, Church Hindes (Chair), Tim Jerman, Chris Macfarlane (Vice Chair), Linda Milne, Martha O’Connor (by phone) Absent: Bill Lippert, Aly Richards Other Trustees: Lynn Dickinson (by phone), Karen Luneau Presidents: Nolan Atkins, Elaine Collins, Joyce Judy, Pat Moulton, Dave Wolk Chancellor’s Office Staff: Tricia Coates, Director of Governmental & External Affairs
Todd Daloz, Associate General Counsel Sheilah Evans, System Controller/Senior Director of Business Operations Elaine Sopchak, Administrative Director, Office of the Chancellor Jeb Spaulding, Chancellor Steve Wisloski, Chief Financial Officer Yasmine Ziesler, Chief Academic Officer
From the Colleges: Chris Beattie, Associate Dean of Administration, Vermont Technical
College Scott Dikeman, Dean of Administration, Castleton University Barb Flathers, Assistant to the Dean of Students, Johnson State College
Loren Loomis Hubbell, Dean of Administration, Lyndon State College Barbara Martin, Dean of Administration, Community College of Vermont Sharron Scott, Dean of Administration, Johnson State College
Lit Tyler, Dean of Administration, Vermont Technical College 1. Chair Hindes called the meeting to order at 1:05 p.m.
Vermont State Colleges Board of Trustees Finance & Facilities Committee Meeting Materials 5 February 22, 2017
2. Consent agenda a. Approve minutes of November 30, 2016 meeting b. Grants and Endowments
Trustee Milne requested the grant form be removed from the consent agenda for discussion. Trustee Macfarlane moved and Trustee Jerman seconded the approval of the minutes. Trustee Diamond requested that his name be added to the list of members in attendance for the November 30th meeting. The amended minutes were approved unanimously. Trustee Macfarlane moved and Trustee Jerman seconded the discussion of the SBDC Cooperative Agreement grant. Trustee Milne observed that there is a cash match of $388,857.25 but no sources are mentioned. Vermont Tech Interim President Pat Moulton replied that the form was completed incorrectly. There is an in-kind contribution obligation from the college, and the State of Vermont also provides grant funding. Associate Dean of Administration Chris Beattie stated that the form will be changed to show a college match of a faculty member’s salary of $20K to be listed as a continuing cost obligation on the form. President Moulton restated this is an in-kind contribution and not cash. Chair Hindes stated the Committee will consider approving the grant with the understanding that the corrected form will be in the Board materials. President Moulton agreed. The Committee voted 4-1 to recommend approval of the grant to the Board. Trustees Diamond, Hindes, Jerman, and Macfarlane voted yes; Trustee Milne voted no. The grant will be sent to the full Board for its consideration. 3. Discussion of debt restructuring alternatives Chair Hindes introduced the topic and asked CFO Wisloski to start the discussion. Mr. Wisloski reminded the Committee that the VSC was recently reviewed by S&P in December. He reviewed the current status of the two most recent ratings S&P assigned the VSC. He announced that after the December review, S&P reaffirmed our rating as A- stable. This favorable rating indicates that a perceived downward trajectory has leveled off, pending the many initiatives underway are completed successfully. Public report will be released shortly. Chancellor Spaulding congratulated Mr. Wisloski on the accomplishment. He reminded the Committee of the recent review of financial advisor proposals, and complimented Mr. Wisloski on his expertise in interviewing the candidates. Mr. Wisloski reviewed the six different scenarios regarding debt restructuring. He reminded the Committee of the revised resolution approved at its October 2016 meeting regarding the balloon payment. The information presented adds 2005 and 2009 smaller loans with covenants to the mix. Also, general debt savings are realized in the scenarios presented. The VSC has hired PFM Financial Advisors LLC, which created the scenarios in the materials. He reviewed the current debt obligations and then each of the options provided by PFM.
Vermont State Colleges Board of Trustees Finance & Facilities Committee Meeting Materials 6 February 22, 2017
Option 1: The VSC sells bonds on its own. Option 2: The VSC sells bonds using the state bond bank. Option 3: A hybrid option in which the VSC sells most of the bonds on its own and about $34M in funding comes from the state obligation. The Committee discussed the options at length. Regarding timing, Chancellor’s Office staff could move ahead with a more accelerated schedule based on what the bond bank is doing. There could be an informational phone call for the Board before the Feb 22, 2017 Finance and Facilities Committee meeting. 4. Discussion of strategic capital and facilities planning Chair Hindes reminded the Committee that a VSC capital spending report is due to the General Assembly next week. Mr. Wisloski clarified the report is to be a long term strategic plan as to the most efficient use of capital funds. The VSC has $550M of insured property, owns 154 buildings, 1700 acres, 2.5M square feet and approximately $10M annual depreciation. A $1.4M base capital appropriation, while essential, is not providing for capital planning in any meaningful way. There has been a buildup of $60M in deferred maintenance. Current resources for maintaining and improving capital assets are
• Operating funds, which are limited due to deficits. • Debt; the system has not borrowed for projects since 2010. • State funds; the base appropriation is not enough to address needs. • Gifts, grants, and other external resources; these are minimal.
A strategic capital plan of 5-10 years looking ahead at large investments is not useful at this point. Mr. Wisloski proposed requesting from the State consistent appropriations without contingencies going forward. He reviewed the system’s current capital appropriation request: $4M towards prioritized deferred maintenance and an additional $3M for enterprise resource planning software replacement. In light of the debt restructuring underway, the next step should be to develop an assessment of what capital needs are. Currently there is no system-wide prioritized process for assessment of capital needs. Mr. Wisloski asked the presidents to send their capital needs to include in the report to the legislature. Mr. Wisloski reviewed an example of a report from a university system on its physical infrastructure as a possible framework for future infrastructure analysis the VSC could use.
Vermont State Colleges Board of Trustees Finance & Facilities Committee Meeting Materials 7 February 22, 2017
5. Discussion of financial metrics Mr. Wisloski reviewed the Trusteeship Magazine article on composite financial index and how certain measures can be applied to VSC finances for analysis purposes. 6. Review of schedule for the remainder of FY2017 Mr. Wisloski proposed rescheduling the February 6th Committee meeting to February 22nd, and cancelling the March 13th meeting. 7. Other business There was no other business. 8. Public comment There was no public comment. Chair Hindes adjourned the meeting at 2:55 p.m.
Vermont State Colleges Board of Trustees Finance & Facilities Committee Meeting Materials 8 February 22, 2017
Vermont State Colleges Board of Trustees Finance & Facilities Committee Meeting Materials 9 February 22, 2017
8b) √ One-time - OR Ongoing funding (indicate timeframe:)
9a) Is principal use allowed: (w/Board OK?)
NO
9b) If yes, is replenishment of principal allowed or required:
10) If investment proceeds generated, indicate intended disposition: Per Board Approved Spending Procedure √ Fully expend for program as prescribed Increase principal for inflation and expend remainder All Investment earnings added for years before expending for endowment purposes begins Other (describe:)
11) President: 12) Date to Ch’s Ofc: 13) Date Board Approved:
Vermont State Colleges Board of Trustees Finance & Facilities Committee Meeting Materials 13 February 22, 2017
Full required documentation is being submitted, including all appropriate assurances regarding Civil Rights, People with Disabilities, Sex Discrimination, Human Subjects, Laboratory Animals, etc.
Version 4/17/2008
Form A & B
College: Lyndon State College
Grant Title: Rural Development Grant
Grant Agency: USDA
Project Director: Ann Nygard
Purpose of Grant:
Grant Period: 10/1/17 to 9/30/18
Review Period: Multi-Yr** / Cumulative Grant Amt:**(please enter number of years covered)
Total Direct 47,000.00$ 91,000.00$ -$ -$ -$ -$ Indirect Costs* 104,000.00$ Total Budget 47,000.00$ 195,000.00$ -$ -$ -$ -$ *(In-Kind & Other costs for space, utilities, maintenance, administrative support, etc.)What is(are) the sources of College Funding?
What continuing cost obligations does Granting Agency require/expect?
What Continuing cost obligations does the College intend/see likely?
Business Officer Review by: Date:
Programmatic Review by: Date:
Presidential Review by: Date:
$47,000
none
none
Proposed Funding1st Yr 2nd Yr 3rd Yr
Vermont State CollegesGrant Proposal Budget Analysis
Center for Professional Studies Branding and Marketing Initiative
Vermont State Colleges Board of Trustees Finance & Facilities Committee Meeting Materials 14 February 22, 2017
VERMONT STATE COLLEGES
BOARD OF TRUSTEES
RESOLUTION
Endorsement of 2017 USDA RBDG Grant Proposal
WHEREAS, The VSC Finance & Facilities Committee has appropriately reviewed the
current grant proposal for $47,000 and recommends it to the full Board; and WHEREAS, This resolution authorizes Lyndon State College to apply for and administer
the RBDG, and it recognizes that Interim President Nolan Atkins is authorized to sign grant documents; therefore, be it
RESOLVED, That the Vermont State Colleges Board of Trustees hereby endorses the
following grant proposals titled, in the amount, and from the specific granting entity as indicated:
• Lyndon State College - USDA Rural Business Development Grant (RBDG) to support a marketing and branding initiative for the Center for Professional Studies.
March 25, 2017
Vermont State Colleges Board of Trustees Finance & Facilities Committee Meeting Materials 15 February 22, 2017
VERMONT STATE COLLEGES
BOARD OF TRUSTEES
RESOLUTION
VSC Finance and Facilities Committee Business: Consent Agenda WHEREAS, At its February 22, 2017 meeting the VSC Finance and Facilities
Committee discussed the business items outlined below; therefore, be it
RESOLVED, The Committee has voted to approve the items outlined below and
recommends them to the full Board: • Approval of the minutes of the January 9, 2017 meeting • Approval of the U.S. Small Business Development Center
grant in the amount of $1,321,111.19 • Approval of the CCV Urban and Pauline Bergeron Memorial
Scholarship Fund • Approval for the LSC Center for Professional Studies to apply
for a USDA Rural Business Development Grant. February 22, 2017
Vermont State Colleges Board of Trustees Finance & Facilities Committee Meeting Materials 16 February 22, 2017
Item 2: 2nd Quarter FY2017 Financial Report
Back to Agenda
Vermont State Colleges Board of Trustees Finance & Facilities Committee Meeting Materials 17 February 22, 2017
Vermont State Colleges
Consolidated Financial Reports
Period ended December 31, 2016
Vermont State Colleges Board of Trustees Finance & Facilities Committee Meeting Materials 18 February 22, 2017
Vermont State Colleges Executive Summary
For the Period Ending December 31, 2016 Total Operating Revenues (Dollars in 1,000s): Second quarter results and projections present enrollments slightly below budget overall; however, student fees are significantly over budget. Waivers are nearly on target with budget, so the overall impact to Net Tuition and Fees revenue is a positive variance to budget of $193k. Auxiliary revenues are greater than budget by approximately $205k, which equates to a positive student based revenue variance of $398k. All other categories of operating revenues are also expected to produce a positive variance to budget, resulting in a total operating revenue positive variance of $621k.
Enrollment summary:
Budgeted Projected Actual Variance-Enrollment
Variance Net Tuition
FPE FPE FPE
CCV 3,979 3,994 15 $ 47
CU 1,963 1,978 15 $ 140
JSC 1,376 1,314 -62 $ (480)
LSC 1,179 1,139 -40 $ (645)
VTC 1,413 1,458 45 $ 658
TOTALS: 9,910 9,883 -27 $ (280)
FEES: $ 490
WAIVERS: $ (17)
AUXILIARY: $ 205
STUDENT BASED REVENUE VARIANCE $ 398
NON-STUDENT BASED REVENUE VARIANCE $ 223
TOTAL OPERATING REVENUE VARIANCE $ 621
Total Operating Expenses (Dollars in 1,000s): Overall, operating expenses are projected to come in over budget; although the amounts per college vary considerably. The majority of the colleges are within 1% of their expense budgets. The two outliers are attributable to greater than expected scholarship expenses for CU and a formalized cost cutting measure for LSC. See college narratives for greater detail.
Budgeted Projected Actual Variance
CCV 27,477 27,627 ($150)
CU 49,578 50,605 ($1,027)
JSC 29,699 29,622 $77
LSC 30,603 29,554 $1,049
VTC 35,103 35,226 ($123)
WFD 1,337 1,337 $0
OC - 193 ($193)
TOTAL EXPENSE VARIANCE ($367)
Vermont State Colleges Board of Trustees Finance & Facilities Committee Meeting Materials 19 February 22, 2017
Projected Change to Net Assets (Dollars in 1,000s): Projected financial results vary considerably across the system; however, all colleges/universities are within 1% of their total board approved budgets. The notable exception is a 2.4% positive variance for LSC.
Total Board Projection vs
Projected Total Year
Approved Budget
Budget Variance
CCV
115
243 ($128)
CU
(965)
(400) ($565)
JSC
(1,293)
(1,180) ($113)
LSC
(1,165)
(1,913) $748
VTC
(279)
(784) $505
WFD
-
- $0
OC
(193)
- ($193)
TOTAL PROJECTED BOT VARIANCE $254
Statement of Net Assets (Dollars in 1,000s): The Net Asset position of the system presents no unexpected fluctuations at December 31, 2016. The contribution of prior year operating deficits, depreciation expense, the OPEB accrual and an increase in deferred revenue represent the largest changes year over year.
TOTAL LIABILITIES 145,155,435 3,544,976 0 118,329,518 6,037,793 273,067,722 264,909,148 8,158,574
NET ASSETS Invested in Capital Assets 54,815,652 54,815,652 55,859,082 Restricted Non-Expendable 18,224,453 18,224,453 17,508,053 Restricted Expendable Loans (670,253) (670,253) (716,446) Restricted Expendable: Other 10,279,725 10,279,725 9,715,873 Unrestricted (38,717,482) (38,717,482) (30,563,709)TOTAL NET ASSETS (38,717,482) 10,279,725 18,224,453 54,815,652 (670,253) 43,932,095 51,802,854 (7,870,759)
TOTAL LIABILITIES AND NET ASSETS 106,437,953 13,824,701 18,224,453 173,145,170 5,367,540 316,999,817 316,712,002 287,816
VARIANCES to NOTE:
1&3) Timing of Liabilities and Cash on Hand2) Depreciation and low/no investment in capital4) Spring revenue deferrals/restricted grant $$s5) OPEB 6) Pay down debt service
Vermont State Colleges Board of Trustees Finance & Facilities Committee Meeting Materials 23 February 22, 2017
Vermont State Colleges
Detailed College Financial Reports
Period ended December 31, 2016
Vermont State Colleges Board of Trustees Finance & Facilities Committee Meeting Materials 24 February 22, 2017
Total Board Projection Variance
Actual thru Projected Projected Approved vs Budget Var Total Year FY16 Actual to
Dec 2016 Balance of Total Year Budget Variance > 3% 2016 Actual Projected FY17
2017 2017 2017 Fav/(Unfav) Fav/(Unfav)
REVENUES
Tuition and Fees 11,855 10,722 22,577 22,555 22 23,972 (1,395)
State Appropriations 2,457 2,458 4,915 4,915 - 4,775 140
Room & Board - - - - - -
Sales and Services 5 95 100 100 - 77 23
Gifts 9 41 50 50 - 62 (12)
Other Revenue 53 47 100 100 - 125 (25)
TOTAL REVENUES 14,379 13,363 27,742 27,720 22 29,011 (1,269)
Total Student Tuition 1,963 $28,531,000 1,978 $28,671,379 14 $140,379
Student Fees 3,285,000 3,285,000 0
Total Tution and Fees $31,816,000 $31,956,379 $140,379
Less: Waivers (678,000) (678,000) 0
Total Net Tuition & Fees $31,138,000 $31,278,379 $140,379
Auxiliary:
Room & Board Fall 5,313,500 5,430,740 117,240
Room & Board Spring 5,313,500 5,100,260 (213,240)
Bookstore/Arena 10,000 0 (10,000)
Total Auxiliary 10,637,000 10,531,000 (106,000)
* FPE: Full Paying Equivalent, i.e. # students at full tuition value
** Summer Sessions charge rates utilized in preceeding Academic Year
VARIANCE
VERMONT STATE COLLEGES
FY17 TUITION & FEES REVENUE MONITORING REPORT -
Castleton University12/31/2016
Vermont State Colleges Board of Trustees Finance & Facilities Committee Meeting Materials 29 February 22, 2017
Castleton University
December 31, 2016 Narrative Highlights
Tuition and Fees- Enrollment is up from last year and is reflected in the revenue totals. Projected tuition/fee revenue is expected to be slightly better than budgeted for the year. It should be noted however that that the tuition freeze has created significant pressure on this and other areas. Sales and Services – The Polling Institute, Conference and Events, and Center for Schools continue to be revenue generators. Based on Q2 results and work in process, we are optimistic that these areas will meet their respective adjusted budgets. We also expect that gift revenue will increase as a result of enhanced development efforts.
Operating Expenses- Salary and benefits are estimated to be over budget due to an increase in P/T faculty during the first semester and a few filled vacancies. Our scholarships have once again exceeded budget as the percentage of qualifying students continues to rise. Chancellor’s office transfers have also increased slightly. To offset this, we will monitor operational budgets to look for additional savings and have made an adjustment as a result. In addition, we will rely on usage of last year’s carry forward designated for scholarships as authorized by the Board to compensate for at least a portion of the very large increase in scholarship assistance. With diligent management, overall spending in most areas will decline and we will continue to monitor closely.
Vermont State Colleges Board of Trustees Finance & Facilities Committee Meeting Materials 30 February 22, 2017
Total Board Projection Variance
Actual thru Projected Projected Approved vs Budget Var Total Year FY16 Actual to
Dec 2016 Balance of Total Year Budget Variance > 3% 2016 Actual Projected FY17
2017 2017 2017 Fav/(Unfav) Fav/(Unfav)
REVENUES
Tuition and Fees 9,130 8,358 17,488 17,545 (57) 16,771 717
State Appropriations 2,457 2,458 4,915 4,915 - 4,775 140
Vermont State Colleges Board of Trustees Finance & Facilities Committee Meeting Materials 41 February 22, 2017
Vermont State Colleges Office of the Chancellor
Period Ending Date 12/31/16 Narrative Highlights for Budget vs. Actual
The Office of the Chancellor expects to be over budget by $192k. This is the net of a projected salaries/benefits overage and an increase in the services, supplies and travel line as it relates to IT and legal services. The utilities line was under budgeted. Salaries and benefits represent positions coming to the Office of the Chancellor as part of the consolidation efforts, as well as some unbudgeted changes in IT personnel.
Vermont State Colleges Board of Trustees Finance & Facilities Committee Meeting Materials 42 February 22, 2017
Total Board Projection Variance
Actual thru Projected Projected Approved vs Budget Var Total Year FY16 Actual to
Dec 2016 Balance of Total Year Budget Variance > 3% 2016 Actual Projected FY17
2017 2017 2017 Fav/(Unfav) Fav/(Unfav)
REVENUES
Tuition and Fees 18,020 16,058 34,078 34,782 (704) 33,621 457
State Appropriations 4,914 4,916 9,830 9,830 - 9,550 280
Other Transfers (237) 138 (99) (253) (154) * 755 854
TOTAL EXPENSES 28,999 30,177 59,176 60,302 1,126 58,432 (744)
NET REVENUES 780 (3,238) (2,458) (3,093) 635 (2,431) (27)
NON-RECURRING ITEMS
Carry-Forward - - - - 1,271
Strategic Reserve (804) 2,354 1,550 1,885
All Other 24 884 908 1,208 1,160
TOTAL (must equal zero) - - - - -
Vermont State Colleges
JSC & LSC (Informational Only)
For the Quarter Ending December 31, 2016
Budget vs Actual Report
(Amounts rounded to 1,000's)
Vermont State Colleges Board of Trustees Finance & Facilities Committee Meeting Materials 43 February 22, 2017
Item 3: Debt Management Policy
Back to Agenda
Vermont State Colleges Board of Trustees Finance & Facilities Committee Meeting Materials 44 February 22, 2017
VERMONT STATE COLLEGES SYSTEM MANUAL OF POLICIES AND PROCEDURES
Title: REVISED DRAFT DEBT MANAGEMENT POLICY POLICY STATEMENT: The Vermont State Colleges System (hereinafter, the “System”) may incur debt when necessary to fulfill the System’s strategic mission. The System’s debt management objectives are to: 1) Maintain access to capital; 2) Maintain a credit rating that minimizes the risk-adjusted cost of capital and maximizes
favorable business terms; and
3) Limit financial risk. This policy assigns debt management responsibilities, and sets forth guidelines with respect to debt limits, structuring, issuance, management and use of derivatives. As used in this policy, “debt” is understood to mean any external borrowing by the System including but not limited to public sales of bonds, loans from banks or other lending institutions, loans from the State of Vermont or other governmental entity, or any other financing originated outside of the System that the System is obligated to repay. PROCEDURES: 1) Prior Aapproval from the Finance and Facilities Committee and the Board of Trustees is
required for all debt transactions.
2) The Officer of the Chancellor will initiate and manage all debt transactions.
3) The Chief Financial Officer is responsible for debt portfolio management and compliance with this policy.
DEBT LIMIT: 1) The System’s debt limit will target medians and ratios appropriate to a rating of in the A
category or the equivalent from Standard & Poor’s Ratings Group. , Moody’s Investors Service or Fitch Ratings.
2) The System will maintain a debt service ratio (annual principal plus interest, divided by total expenses) of not more than 6%.
STRUCTURING: 1) Any System debt with a term longer than three (3) years shall be fixed rate.
Vermont State Colleges Board of Trustees Finance & Facilities Committee Meeting Materials 45 February 22, 2017
2) The maximum maturity of any debt issue shall be the shorter of 30 years, or the useful life of
the asset being financed.
3) Debt principal shall amortize such that annual debt service on a total portfolio basis is either level or declining over time, and not increasing.
ISSUANCE: 1) The System shall engage a qualified, nationally-recognizednationally recognized independent
financial advisor to assist with any debt transaction in excess of $10 million.
2) Debt generally should be tax-exempt, however taxable debt may be used to take advantage of special programs (e.g., Build America Bonds) or for economic savings (e.g., refunding tax-exempt debt that is ineligible for tax-exempt refunding), or to comply with Federal federal tax law.
3) Debt may be publicly sold or privately placed, however privately placed debt may not
include business terms less favorable to the System than for public debt (e.g., additional financial covenants beyond those contained in the System’s bond resolution).
4) Public debt should generally be sold competitively. If a sale is negotiated, the underwriter
must provide an estimate of interest rates for each maturity expressed as a spread to AAA-MMDTM or another widely-recognized and readily available independent index (for tax-exempt debt) or U.S. Treasury yields (for taxable debt) prior to the sale, and the System’s independent financial advisor, if engaging one is required under (1), above, must concur with these rates prior to award.
MANAGEMENT AND COMPLIANCE: The Chief Financial OfficerOffice of the Chancellor shall create adopt procedures regarding the investment of bond proceeds, ensuring compliance with all necessary Federal, State of Vermont and applicable regulations, primary and secondary market disclosure practices, and arbitrage rebate monitoring and filing., and report to tThe Chancellor and shall report to the Finance and Facilities Committee at least annually on the status of the System’s debt, and also immediately following any material event (e.g., a credit rating change). The Finance and Facilities Committee will review this policy on annual basis or in the interim whenever substantive changes to the guidelines are proposed by the Chancellor. DERIVATIVES: Derivatives (e.g., interest rate swaps) are not permitted. Any derivatives in place prior to the approval of this policy shall be valued no less frequently than annually, and may be held to maturity or terminated with the approval of the Board of Trustees. The System must engage a
Vermont State Colleges Board of Trustees Finance & Facilities Committee Meeting Materials 46 February 22, 2017
qualified independent derivative advisor to manage any such termination, and to provide a fairness opinion documenting that the derivative was terminated at fair market value. OTHER PROVISIONSDEBT RELATED TO FEDERAL GRANTS: Any activity or expense related to federal grants or contracts must comply with 2 CFR 200 –Uniform Administrative Requirements, Cost Principles, and Audit Requirements for Federal Awards, in addition to the provisions above.
Vermont State Colleges Board of Trustees Finance & Facilities Committee Meeting Materials 47 February 22, 2017
VERMONT STATE COLLEGES SYSTEM MANUAL OF POLICIES AND PROCEDURES
Title: REVISED DRAFT POLICY 432: DEBT MANAGEMENT POLICY POLICY STATEMENT: The Vermont State Colleges System (hereinafter, the “System”) may incur debt when necessary to fulfill the System’s strategic mission. The System’s debt management objectives are to: 1) Maintain access to capital; 2) Maintain a credit rating that minimizes the risk-adjusted cost of capital and maximizes
favorable business terms; and
3) Limit financial risk. This policy assigns debt management responsibilities, and sets forth guidelines with respect to debt limits, structuring, issuance, management and use of derivatives. As used in this policy, “debt” is understood to mean any external borrowing by the System including but not limited to public sales of bonds, loans from banks or other lending institutions, loans from the State of Vermont or other governmental entity, or any other financing originated outside of the System that the System is obligated to repay. PROCEDURES: 1) Prior approval from the Board of Trustees is required for all debt transactions.
2) The Office of the Chancellor will initiate and manage all debt transactions.
3) The Chief Financial Officer is responsible for debt portfolio management and compliance
with this policy. DEBT LIMIT: 1) The System’s debt limit will target medians and ratios appropriate to a rating in the A
category or the equivalent from Standard & Poor’s Ratings Group, Moody’s Investors Service or Fitch Ratings.
STRUCTURING: 1) Any System debt with a term longer than three (3) years shall be fixed rate.
2) The maximum maturity of any debt issue shall be the shorter of 30 years, or the useful life of
the asset being financed.
Vermont State Colleges Board of Trustees Finance & Facilities Committee Meeting Materials 48 February 22, 2017
3) Debt principal shall amortize such that annual debt service on a total portfolio basis is either
level or declining over time, and not increasing.
ISSUANCE: 1) The System shall engage a qualified, nationally recognized independent financial advisor to
assist with any debt transaction in excess of $10 million.
2) Debt generally should be tax-exempt, however taxable debt may be used to take advantage of special programs (e.g., Build America Bonds) or for economic savings (e.g., refunding tax-exempt debt that is ineligible for tax-exempt refunding), or to comply with federal tax law.
3) Debt may be publicly sold or privately placed, however privately placed debt may not
include business terms less favorable to the System than for public debt (e.g., additional financial covenants beyond those contained in the System’s bond resolution).
4) Public debt should generally be sold competitively. If a sale is negotiated, the underwriter
must provide an estimate of interest rates for each maturity expressed as a spread to AAA-MMDTM or another widely-recognized and readily available independent index (for tax-exempt debt) or U.S. Treasury yields (for taxable debt) prior to the sale, and the System’s independent financial advisor, if engaging one is required under (1), above, must concur with these rates prior to award.
MANAGEMENT AND COMPLIANCE: The Office of the Chancellor shall adopt procedures regarding the investment of bond proceeds, ensuring compliance with all necessary Federal, State of Vermont and applicable regulations, primary and secondary market disclosure practices, and arbitrage rebate monitoring and filing. The Chancellor shall report to the Finance and Facilities Committee at least annually on the status of the System’s debt, and also immediately following any material event (e.g., a credit rating change). The Finance and Facilities Committee will review this policy on annual basis or in the interim whenever substantive changes to the guidelines are proposed by the Chancellor. DERIVATIVES: Derivatives (e.g., interest rate swaps) are not permitted. Any derivatives in place prior to the approval of this policy shall be valued no less frequently than annually, and may be held to maturity or terminated with the approval of the Board of Trustees. The System must engage a qualified independent derivative advisor to manage any such termination, and to provide a fairness opinion documenting that the derivative was terminated at fair market value.
Vermont State Colleges Board of Trustees Finance & Facilities Committee Meeting Materials 49 February 22, 2017
DEBT RELATED TO FEDERAL GRANTS: Any activity or expense related to federal grants or contracts must comply with 2 CFR 200 –Uniform Administrative Requirements, Cost Principles, and Audit Requirements for Federal Awards, in addition to the provisions above.
Vermont State Colleges Board of Trustees Finance & Facilities Committee Meeting Materials 50 February 22, 2017
Your Branch:105 WEST VIEW RD, 5TH FLCOLCHESTER, VT 05446
Please review the disclosures and definitions throughout this Document.
Page 1 of 29
Vermont State Colleges Board of Trustees Finance & Facilities Committee Meeting Materials 55 February 22, 2017
Reporting Currency: USDPrepared on January 26, 2017VSC All Accounts
TABLE OF CONTENTS
Please review the disclosures and definitions throughout this Document.Various sub-sections of this Document may not contain information on all accounts/positions covered in this Document.
CONTENTS
Account(s) Included In This Report 3Capital Markets Overview: Introduction 4Capital Markets Overview: US Equity Markets 5Capital Markets Overview: Global Equity Markets 6Capital Markets Overview: US Bond Market 7Asset Allocation 8Time Weighted Performance Summary 9Investment Summary Dollar Weighted Returns - Advisory Assets Only
VSC All Accounts 10VERMONT STATE COLLEGES 383-108872 11VERMONT STATE COLLEGES 383-110533 12VERMONT STATE COLLEGES 383-122584 13VERMONT STATE COLLEGES 383-110534 14VERMONT STATE COLLEGES 383-108874 15VERMONT STATE COLLEGES 383-108918 16IRONWOOD 383-020918 17SKYBRIDGE 383-020919 18VERMONT STATE COLLEGES 383-108873 19VERMONT STATE COLLEGES 383-108920 20
Disclosures 21
Page 2 of 29
Vermont State Colleges Board of Trustees Finance & Facilities Committee Meeting Materials 56 February 22, 2017
ACCOUNT(S) INCLUDED IN THIS REPORTVSC All Accounts Reporting Currency: USD
ACCOUNT(S) DETAIL
Account Name and Address Advisory/Brokerage
Date ClosedDate OpenedAccount NumberAccount Type/Manager Name
IRONWOODPO BOX 7 MONTPELIER
Alternative Investments Advisory 383-020918 09/17/14Advisory
SKYBRIDGEPO BOX 7
Alternative Investments Advisory 383-020919 09/17/14Advisory
383-108872 12/20/02AdvisoryConsulting Group AdvisorVERMONT STATE COLLEGES383-108874 12/20/02AdvisoryDelaware Intl ADR -LondonATTN STEPHEN WISLOSKI PO BOX 7 MONTPELIER383-108873 12/20/02BrokerageAAA 383-108918 02/06/03AdvisoryAnchor Mid Cap Value 383-108920 02/06/03 01/25/17AdvisoryAAA 383-110533 04/19/06AdvisoryClearBridge Multi Growth 383-110534 04/19/06AdvisorySeix High Yield Bond 383-122584 03/07/12AdvisoryThomasPartners 999-209262 10/27/10Advisory
Investment, insurance and annuity products offered through Morgan Stanley Smith Barney LLC are: NOT FDIC INSURED | MAY LOSE VALUE | NOT BANK GUARANTEED | NOT A BANK DEPOSIT | NOT INSURED BY ANY FEDERAL GOVERNMENT AGENCY.All content within this Document applies to the accounts listed above or a subset thereof, unless otherwise indicated. Closed Accounts listed above are included for historical performance.
ACCOUNT(S) INCLUDED IN THIS REPORT Page 3 of 29
Vermont State Colleges Board of Trustees Finance & Facilities Committee Meeting Materials 57 February 22, 2017
Past performance is no guarantee of future results. Estimates of future performance are based on assumptions that may not be realized. This material is not a solicitation of any offer to buy or sell any security or other financial instrument or to participate in any trading strategy. Please refer to important information, disclosures and qualifications at the end of this material. This slide sourced from Market Performance section.
• The election of Donald Trump as the next U.S. President sent markets surging to new highs during the 4th quarter of 2016. Trump’s pro-growth agenda focusing on infrastructure spending, tax reform, and deregulation fueled markets into the so-called “Trump Rally.” Along with the election, all eyes were on the Federal Open Market Committee as the US reported improving inflation expectations and employment numbers, giving the Fed a green light to hike in December. With expectations fully priced in, markets reacted calmly when the Fed raised their target rate by 25 basis points and signaled three further hikes in 2017.
• For the quarter, US equities posted strong performance, especially the Financials sector of the S&P 500, which returned 21.1%. REITs and long-term US Treasuries lagged on the back of increasing inflation expectations and rising real interest rates. For the one-year period ending December 31, 2016, MLPs, US high yield corporate bonds, US equities and emerging market equities led the pack with double-digit returns. Managed futures and munis were the laggards for the year.
• The Dow Jones Industrial Average increased 8.7% in the fourth quarter. The NASDAQ Composite Index was up 1.7% for the quarter. The S&P 500 Index increased 3.8% for the quarter.
Eight of the 11 sectors within the S&P 500 generated positive returns in the fourth quarter of 2016. The top-performing sector was Financials, which was up 21.1%. Energy and Industrials rose 7.3% and 7.2%, respectively, and were also among the top-performing sectors. The biggest laggards were Real Estate, which decreased 4.4%, and HealthCare, which fell 4.0%.
The bond market registered negative returns during the fourth quarter. The Bloomberg U.S. Aggregate Bond Index, a general measure of the bond market, decreased 3.0% for the quarter.
Morgan Stanley & Co. economists expect U.S. real GDP will be 1.6% in 2016 and 2.0% in 2017. They forecast global GDP growth to be 3.0% in 2016 and 3.4% in 2017.
After posting negative third quarter returns, commodities registered positive returns in the fourth quarter; the Bloomberg Commodity Index increased 2.7%.
For the fourth quarter of 2016, global mergers and acquisitions (M&A) deal volume was $1,200 billion, compared to $813 billion for the third quarter of 2016. Global M&A activity decreased to $3.6 trillion in 2016 from $4.3 trillion in 2015.
Introduction As of 4Q 2016
Source: FactSet, Bloomberg, Morgan Stanley & Co. Research, Morgan Stanley Wealth Management GIC
Page 4 of 29
Vermont State Colleges Board of Trustees Finance & Facilities Committee Meeting Materials 58 February 22, 2017
Presenter
Presentation Notes
{title}:MarketPerformance001:
Past performance is no guarantee of future results. Estimates of future performance are based on assumptions that may not be realized. This material is not a solicitation of any offer to buy or sell any security or other financial instrument or to participate in any trading strategy. Please refer to important information, disclosures and qualifications at the end of this material. This slide sourced from Market Performance section.
Key US Stock Market Index Returns (%) for the Period Ending 12/31/2016
Capital Markets Overview: 4Q 2016
The Dow Jones Industrial Average increased 8.7% in the fourth quarter. The NASDAQ Composite Index was up 1.7% for the quarter. The S&P 500 Index increased 3.8% for the quarter.
Eight of the 11 sectors within the S&P 500 generated positive returns in the fourth quarter of 2016. The top-performing sector was Financials, which was up 21.1%. Energy and Industrials rose 7.3% and 7.2%, respectively, and were also among the top-performing sectors. The biggest laggards were Real Estate, which decreased 4.4%, and Health Care, which fell 4.0%.
Growth-style stocks of large-cap companies increased during the fourth quarter. The large-cap Russell 1000 Growth Index rose 1.0%. The Russell 1000 Index, a large-cap index, increased 3.8% for the quarter. The Russell 1000 Value Index, also a large-cap index, increased 6.7% for the quarter.
The Russell Midcap Growth Index rose 0.5% for the quarter. The Russell Midcap Index increased 3.2% for the quarter. The Russell Midcap Value Index increased 5.5% for the quarter. The Russell 2000 Growth Index, a small-cap index, increased 3.6% for the quarter. The small-cap Russell 2000 Index rose 8.8% for the quarter. The Russell 2000 Value Index, also a small-cap index, increased 14.1% for the quarter.
US Equity Markets As of 4Q 2016
Source: FactSet, Bloomberg, Morgan Stanley Wealth Management GIC
Page 5 of 29
Vermont State Colleges Board of Trustees Finance & Facilities Committee Meeting Materials 59 February 22, 2017
Presenter
Presentation Notes
{title}:MarketPerformance003:
Past performance is no guarantee of future results. Estimates of future performance are based on assumptions that may not be realized. This material is not a solicitation of any offer to buy or sell any security or other financial instrument or to participate in any trading strategy. Please refer to important information, disclosures and qualifications at the end of this material. This slide sourced from Market Performance section.
Source: FactSet, Bloomberg, Morgan Stanley Wealth Management GIC
INDEX IN USD Quarter 12 Months5-Years
(Annualized)7-Years
(Annualized)
MSCI EAFE -0.7% 1.5% 6.9% 4.3%
MSCI EAFE Growth -5.5% -2.7% 6.9% 4.9%
MSCI EAFE Value 4.2% 5.7% 6.7% 3.6%
MSCI Europe -0.4% 0.2% 6.7% 3.9%
MSCI Japan -0.1% 2.7% 8.4% 5.8%
S&P 500 3.8% 12.0% 14.7% 12.8%
MSCI Emerging Markets -4.1% 11.6% 1.6% 0.8%
Key Global Equity Market Index Returns (%) for the Period Ending 12/31/2016
In the fourth quarter, emerging markets (EM) and international developed regions both delivered negative returns (in USD). The MSCI EAFE Index (a benchmark for international developed markets) decreased 0.7% for U.S.-currency investors and increased 7.1% for local-currency investors, as the U.S. dollar significantly appreciated in relation to the currencies of many nations in the index.
For the fourth quarter, the MSCI Emerging Markets Index decreased 4.1% for US-currency investors and 1.4% for local-currency investors, as the US dollar appreciated in relation to the currencies of the nations in the index. The MSCI Europe Index decreased 0.4% for US-currency investors and increased 5.5% for local-currency investors during the fourth quarter of 2016.
The S&P 500 Index increased 3.8% for the quarter.
Emerging economy equity market indices were down in the fourth quarter. The MSCI BRIC (Brazil, Russia, India and China) Index fell 3.8% for the quarter in US dollar terms and 3.7% in terms of local currencies. For the fourth quarter, the MSCI EM Asia Index was down 6.0% in US dollar terms and 3.0% in local terms.
Global Equity Markets As of 4Q 2016
Page 6 of 29
Vermont State Colleges Board of Trustees Finance & Facilities Committee Meeting Materials 60 February 22, 2017
Presenter
Presentation Notes
{title}:MarketPerformance004:
Past performance is no guarantee of future results. Estimates of future performance are based on assumptions that may not be realized. This material is not a solicitation of any offer to buy or sell any security or other financial instrument or to participate in any trading strategy. Please refer to important information, disclosures and qualifications at the end of this material. This slide sourced from Market Performance section.
Barclays Capital US Aggregate -3.0% 2.6% 2.2% 3.6%
Barclays Capital High Yield 1.8% 17.1% 7.4% 8.1%
Barclays Capital Government/Credit -3.4% 3.0% 2.3% 3.8%
Barclays Capital Government -3.8% 1.0% 1.2% 3.1%
Barclays Capital Intermediate Govt/Credit -2.1% 2.1% 1.8% 3.0%
Barclays Capital Long Govt/Credit -7.8% 6.7% 4.1% 7.4%
Barclays Capital Mortgage Backed Securities -2.0% 1.7% 2.1% 3.1%
Barclays Capital Muni -3.6% 0.2% 3.3% 4.2%
Key US Bond Market Index Returns (%) for the Period Ending 12/31/2016
Capital Markets Overview: 4Q 2016
The bond market registered negative returns during the fourth quarter. The Bloomberg U.S. Aggregate Bond Index, a general measure of the bond market, decreased 3.0% for the quarter.
Interest rates increased during the fourth quarter, as the yield on the 10-year U.S. Treasury note rose to a quarter-end 2.44% from 1.59% at the end of the 3Q 2016. This came out to a dramatic 53.3% increase in rates for the quarter.
Riskier parts of the bond market such as US high yield debt increased in the fourth quarter. The Bloomberg Barclays Capital High Yield Index, a measure of lower-rated corporate bonds, rose 1.8%.
Mortgage-backed securities posted negative returns during the fourth quarter. The Bloomberg Barclays Capital Mortgage Backed Index decreased 2.0% for the quarter. During the fourth quarter, the municipal bond market also decreased. As a result, the Bloomberg Barclays Capital Muni Index generated a negative 3.6% return for the quarter.
The US Bond Market As of 4Q 2016
Source: FactSet, Bloomberg, Morgan Stanley & Co. Research, Morgan Stanley Wealth Management GIC
Page 7 of 29
Vermont State Colleges Board of Trustees Finance & Facilities Committee Meeting Materials 61 February 22, 2017
Presenter
Presentation Notes
{title}:MarketPerformance005:
Large Cap Growth
Large Cap ValueSmall / Mid
GrowthSmall / Mid Value International
International Emerging
Domestic and High Yield Fixed
International Fixed
Alternatives Cash Total% of Total Portfolio
CG Advisor
I shares Russell 1000 Growth 2,706,945$ 2,706,945$ 11.0%
I shares Russell 1000 Value 3,397,870$ 3,397,870$ 13.8%
I shares Trust S&P Mid Cap 400 30,245$ 30,245$ 0.1%
iShares Russell 2000 206,253$ 206,253$ 412,506$ 1.7%
William Blair Int Growth 1,284,558$ 1,284,558$ 5.2%
The above summary/prices/quote/statistics have been obtained from sources we believe to be reliable, but we cannot guarantee its accuracy or completeness. Past performance is no guarantee of future results. The information provided in this summary is for illustrative purposes only and does not represent an official statement by the firm. You must refer to your monthly statements for an accurate and complete record of your transactions, holdings & balances. Best efforts have been made to reflect the true values of the figures, but we can not guarantee the accuracy or completeness due to the element of human error. This is not a binding or legal document. This information is based upon the market value of your account as of the close of business on 12/31/16 and is subject to daily market fluctuation. Morgan Stanley Smith Barney, LLC.
Member SIPC. Prepared by: John O. Myhre, Vice President, Financial Advisor
VERMONT STATE COLLEGES
PORTFOLIO SUMMARY - ASSET ALLOCATION
December 31, 2016
Page 8 of 29
Vermont State Colleges Board of Trustees Finance & Facilities Committee Meeting Materials 62 February 22, 2017
VSC All Accounts
TIME WEIGHTED PERFORMANCE SUMMARYAs of December 31, 2016|Reporting Currency: USD
The investment returns shown on this page are time-weighted measurements which exclude the effect of the timing and amount of your contributions and withdrawals.
PERFORMANCE Page 9 of 29
Vermont State Colleges Board of Trustees Finance & Facilities Committee Meeting Materials 63 February 22, 2017
INVESTMENT SUMMARY DOLLAR WEIGHTED RETURNS - ADVISORY ASSETS ONLYVSC All Accounts As of December 31, 2016|Reporting Currency: USD
TOTAL VALUE VS. NET INVESTED CAPITAL
$0
$4,000,000
$8,000,000
$12,000,000
$16,000,000
$20,000,000
$24,000,000
$28,000,000
SIP
2003
2004
2005
2006
2007
2008
2009
2010
2011
2012
2013
2014
2015
2016
$10,803,838.37
$24,633,573.83
Net Invested CapitalTotal Value
CHANGE IN VALUE AND RETURN % (NET OF FEES)
Year to Date Last 5 Years Performance Inception12/31/15-12/31/16 02/27/03-12/31/1612/31/11-12/31/16
Income Summary does not include income from external assets.
Does not include Performance Ineligible Assets.
ASSET ALLOCATION
Cash1.1%
Equities64.3%
Fixed Income & Preferreds27.3%
Alternatives7.3%
Cash1.1%
Equities64.3%
Fixed Income & Preferreds27.3%
Alternatives7.3%
Inception dates for advisory account(s) reflect the most recent advisory program or discretion change.
INVESTMENT SUMMARY Page 10 of 29
Vermont State Colleges Board of Trustees Finance & Facilities Committee Meeting Materials 64 February 22, 2017
INVESTMENT SUMMARY DOLLAR WEIGHTED RETURNS - ADVISORY ASSETS ONLYVSC All Accounts-VERMONT STATE COLLEGES 383-108872-Consulting Group... As of December 31, 2016|Reporting Currency: USD
TOTAL VALUE VS. NET INVESTED CAPITAL
$0
$2,000,000
$4,000,000
$6,000,000
$8,000,000
$10,000,000
$12,000,000
$14,000,000
$16,000,000
SIP
2006
2007
2008
2009
2010
2011
2012
2013
2014
2015
2016
$9,831,206.94
$15,535,849.90
Net Invested CapitalTotal Value
CHANGE IN VALUE AND RETURN % (NET OF FEES)
Year to Date Last 5 Years Performance Inception12/31/15-12/31/16 04/21/06-12/31/1612/31/11-12/31/16
Income Summary does not include income from external assets.
Does not include Performance Ineligible Assets.
ASSET ALLOCATION
Global Cash1.6%
US Equities42.2%
International Equities10.9%
Emerging & Frontier Mkt7.0%
Short Term Fixed Income7.1%
US Fixed Income Taxable23.1%
Intl Fixed Income3.5%
Real Assets4.7%
Global Cash1.6%
US Equities42.2%
International Equities10.9%
Emerging & Frontier Mkt7.0%
Short Term Fixed Income7.1%
US Fixed Income Taxable23.1%
Intl Fixed Income3.5%
Real Assets4.7%
Inception dates for advisory account(s) reflect the most recent advisory program or discretion change.
INVESTMENT SUMMARY Page 11 of 29
Vermont State Colleges Board of Trustees Finance & Facilities Committee Meeting Materials 65 February 22, 2017
INVESTMENT SUMMARY DOLLAR WEIGHTED RETURNS - ADVISORY ASSETS ONLYVSC All Accounts-VERMONT STATE COLLEGES 383-110533-ClearBridge... As of December 31, 2016|Reporting Currency: USD
TOTAL VALUE VS. NET INVESTED CAPITAL
$0
$400,000
$800,000
$1,200,000
$1,600,000
$2,000,000
$2,400,000
SIP
2006
2007
2008
2009
2010
2011
2012
2013
2014
2015
2016
$839,499.84
$2,366,853.68
Net Invested CapitalTotal Value
CHANGE IN VALUE AND RETURN % (NET OF FEES)
Year to Date Last 5 Years Performance Inception12/31/15-12/31/16 04/21/06-12/31/1612/31/11-12/31/16
Income Summary does not include income from external assets.
Does not include Performance Ineligible Assets.
ASSET ALLOCATION
US Large Cap Growth100.0%
US Large Cap Growth100.0%
Inception dates for advisory account(s) reflect the most recent advisory program or discretion change.
INVESTMENT SUMMARY Page 12 of 29
Vermont State Colleges Board of Trustees Finance & Facilities Committee Meeting Materials 66 February 22, 2017
INVESTMENT SUMMARY DOLLAR WEIGHTED RETURNS - ADVISORY ASSETS ONLYVSC All Accounts-VERMONT STATE COLLEGES 383-122584-ThomasPartners As of December 31, 2016|Reporting Currency: USD
TOTAL VALUE VS. NET INVESTED CAPITAL
$0
$400,000
$800,000
$1,200,000
$1,600,000
$2,000,000
$2,400,000
$2,800,000
$3,200,000
$1,152,342.00
$2,365,048.22
SIP 2012 2013 2014 2015 2016
Net Invested CapitalTotal Value
CHANGE IN VALUE AND RETURN % (NET OF FEES)
Year to Date Last 5 Years Performance Inception12/31/15-12/31/16 03/13/12-12/31/1612/31/11-12/31/16
Income Summary does not include income from external assets.
Does not include Performance Ineligible Assets.
ASSET ALLOCATION
Global Cash1.6%
US Large Cap Growth21.2%
US Large Cap Value49.6%
US Mid Cap Growth2.0%
US Mid Cap Value9.9%
Canadian Equities2.2%
European Equities9.7%
MLP/Energy Infrastructure3.9%
Global Cash1.6%
US Large Cap Growth21.2%
US Large Cap Value49.6%
US Mid Cap Growth2.0%
US Mid Cap Value9.9%
Canadian Equities2.2%
European Equities9.7%
MLP/Energy Infrastructure3.9%
Inception dates for advisory account(s) reflect the most recent advisory program or discretion change.
INVESTMENT SUMMARY Page 13 of 29
Vermont State Colleges Board of Trustees Finance & Facilities Committee Meeting Materials 67 February 22, 2017
INVESTMENT SUMMARY DOLLAR WEIGHTED RETURNS - ADVISORY ASSETS ONLYVSC All Accounts-VERMONT STATE COLLEGES 383-110534-Seix High Yield... As of December 31, 2016|Reporting Currency: USD
TOTAL VALUE VS. NET INVESTED CAPITAL
$0
$200,000
$400,000
$600,000
$800,000
$1,000,000
$1,200,000
$1,400,000
$1,600,000
SIP
2006
2007
2008
2009
2010
2011
2012
2013
2014
2015
2016
$830,609.49
$1,497,625.77
Net Invested CapitalTotal Value
CHANGE IN VALUE AND RETURN % (NET OF FEES)
Year to Date Last 5 Years Performance Inception12/31/15-12/31/16 04/21/06-12/31/1612/31/11-12/31/16
Income Summary does not include income from external assets.
Does not include Performance Ineligible Assets.
ASSET ALLOCATION
High Yield Fixed Income100.0%
High Yield Fixed Income100.0%
Inception dates for advisory account(s) reflect the most recent advisory program or discretion change.
INVESTMENT SUMMARY Page 14 of 29
Vermont State Colleges Board of Trustees Finance & Facilities Committee Meeting Materials 68 February 22, 2017
INVESTMENT SUMMARY DOLLAR WEIGHTED RETURNS - ADVISORY ASSETS ONLYVSC All Accounts-VERMONT STATE COLLEGES 383-108874-Delaware Intl... As of December 31, 2016|Reporting Currency: USD
TOTAL VALUE VS. NET INVESTED CAPITAL
-$400,000
-$200,000
$0
$200,000
$400,000
$600,000
$800,000
$1,000,000
$1,200,000
$1,400,000
$1,600,000
SIP
2003
2004
2005
2006
2007
2008
2009
2010
2011
2012
2013
2014
2015
2016
-$98,749.76
$1,098,883.19
Net Invested CapitalTotal Value
CHANGE IN VALUE AND RETURN % (NET OF FEES)
Year to Date Last 5 Years Performance Inception12/31/15-12/31/16 02/27/03-12/31/1612/31/11-12/31/16
Income Summary does not include income from external assets.
Does not include Performance Ineligible Assets.
ASSET ALLOCATION
International Equities100.0%
International Equities100.0%
Inception dates for advisory account(s) reflect the most recent advisory program or discretion change.
INVESTMENT SUMMARY Page 15 of 29
Vermont State Colleges Board of Trustees Finance & Facilities Committee Meeting Materials 69 February 22, 2017
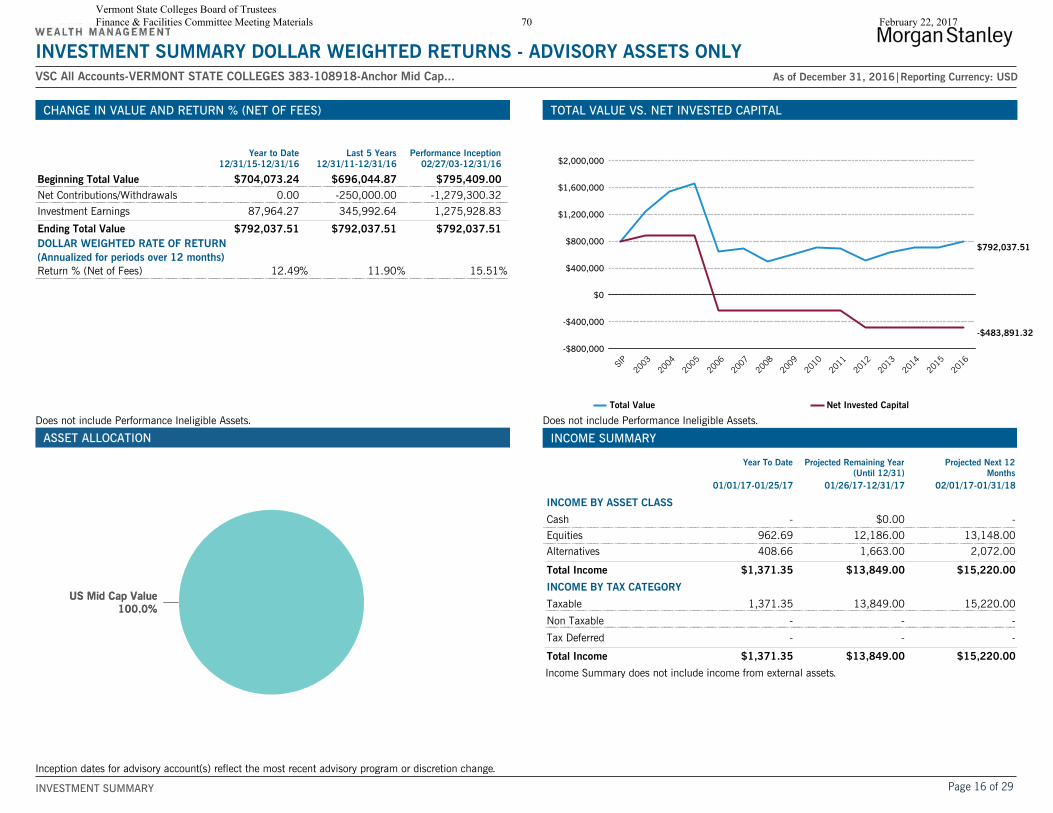
INVESTMENT SUMMARY DOLLAR WEIGHTED RETURNS - ADVISORY ASSETS ONLYVSC All Accounts-VERMONT STATE COLLEGES 383-108918-Anchor Mid Cap... As of December 31, 2016|Reporting Currency: USD
TOTAL VALUE VS. NET INVESTED CAPITAL
-$800,000
-$400,000
$0
$400,000
$800,000
$1,200,000
$1,600,000
$2,000,000
SIP
2003
2004
2005
2006
2007
2008
2009
2010
2011
2012
2013
2014
2015
2016
-$483,891.32
$792,037.51
Net Invested CapitalTotal Value
CHANGE IN VALUE AND RETURN % (NET OF FEES)
Year to Date Last 5 Years Performance Inception12/31/15-12/31/16 02/27/03-12/31/1612/31/11-12/31/16
Income Summary does not include income from external assets.
Does not include Performance Ineligible Assets.
ASSET ALLOCATION
US Mid Cap Value100.0%
US Mid Cap Value100.0%
Inception dates for advisory account(s) reflect the most recent advisory program or discretion change.
INVESTMENT SUMMARY Page 16 of 29
Vermont State Colleges Board of Trustees Finance & Facilities Committee Meeting Materials 70 February 22, 2017
INVESTMENT SUMMARY DOLLAR WEIGHTED RETURNS - ADVISORY ASSETS ONLYVSC All Accounts-IRONWOOD 383-020918-Alternative Investments Advisory As of December 31, 2016|Reporting Currency: USD
TOTAL VALUE VS. NET INVESTED CAPITAL
$0
$100,000
$200,000
$300,000
$400,000
$500,000
$600,000
$516,408.54 $508,426.80
SIP 2015 2016
Net Invested CapitalTotal Value
CHANGE IN VALUE AND RETURN % (NET OF FEES)
Year to Date Last 5 Years Performance Inception12/31/15-12/31/16 05/21/15-12/31/1612/31/11-12/31/16
Income Summary does not include income from external assets.
Does not include Performance Ineligible Assets.
ASSET ALLOCATION
Global Cash0.0%
Non-Directional MMgr/FoF100.0%
Global Cash0.0%
Non-Directional MMgr/FoF100.0%
Inception dates for advisory account(s) reflect the most recent advisory program or discretion change.
INVESTMENT SUMMARY Page 17 of 29
Vermont State Colleges Board of Trustees Finance & Facilities Committee Meeting Materials 71 February 22, 2017
INVESTMENT SUMMARY DOLLAR WEIGHTED RETURNS - ADVISORY ASSETS ONLYVSC All Accounts-SKYBRIDGE 383-020919-Alternative Investments Advisory As of December 31, 2016|Reporting Currency: USD
TOTAL VALUE VS. NET INVESTED CAPITAL
$0
$100,000
$200,000
$300,000
$400,000
$500,000
$600,000
$515,834.58 $468,848.76
SIP 2015 2016
Net Invested CapitalTotal Value
CHANGE IN VALUE AND RETURN % (NET OF FEES)
Year to Date Last 5 Years Performance Inception12/31/15-12/31/16 05/21/15-12/31/1612/31/11-12/31/16
Income Summary does not include income from external assets.
Does not include Performance Ineligible Assets.
ASSET ALLOCATION
Global Cash0.0%
Multi-Manager/FoF100.0%
Global Cash0.0%
Multi-Manager/FoF100.0%
Inception dates for advisory account(s) reflect the most recent advisory program or discretion change.
INVESTMENT SUMMARY Page 18 of 29
Vermont State Colleges Board of Trustees Finance & Facilities Committee Meeting Materials 72 February 22, 2017
INVESTMENT SUMMARY DOLLAR WEIGHTED RETURNS - ADVISORY ASSETS ONLYVSC All Accounts-VERMONT STATE COLLEGES 383-108873 Reporting Currency: USD
This exhibit is not applicable for this portfolio
INVESTMENT SUMMARY
Page 19 of 29
Vermont State Colleges Board of Trustees Finance & Facilities Committee Meeting Materials 73 February 22, 2017
INVESTMENT SUMMARY DOLLAR WEIGHTED RETURNS - ADVISORY ASSETS ONLYVSC All Accounts-VERMONT STATE COLLEGES 383-108920-AAA As of December 31, 2016|Reporting Currency: USD
TOTAL VALUE VS. NET INVESTED CAPITAL
$0
$1,000,000
$2,000,000
$3,000,000
$4,000,000
$5,000,000
SIP
2003
2004
2005
2006
2007
2008
2009
2010
2011
2012
2013
2014
2015
$1,318,849.84
$0.00
Net Invested CapitalTotal Value
CHANGE IN VALUE AND RETURN % (NET OF FEES)
Year to Date Last 5 Years Performance Inception12/31/15-12/31/16 02/28/03-12/31/1612/31/11-12/31/16
Income Summary does not include income from external assets.
Does not include Performance Ineligible Assets.
ASSET ALLOCATION
This exhibit is not applicable for this portfolio
Inception dates for advisory account(s) reflect the most recent advisory program or discretion change.
INVESTMENT SUMMARY Page 20 of 29
Vermont State Colleges Board of Trustees Finance & Facilities Committee Meeting Materials 74 February 22, 2017
VSC All Accounts Prepared on January 26, 2017|Reporting Currency: USD
DISCLOSURES
Explanatory Notes and Disclosure: This document is designed to assist you and your Financial Advisor in understanding portfolio positions, composition and subsets thereof . It is designed solely for your individual use, is for informational purposes only and is not intended as an offer or solicitation with respect to the purchase or sale of any security. Do not take action relying on this information without confirming its accuracy and completeness. Please read carefully all accompanying notes and disclosures provided in this Document.For convenience purposes, your Financial Advisor may have assigned a designated name for this Document. The list of the accounts covered in this document is noted herein and may not include all of your accounts with us. Furthermore, the information included in this document may not include all asset classes/securities held by you at the firm. Please review this document carefully and discuss any questions you may have with your Financial Advisor. If you do not understand an entry, suspect an error, or want more details on current values or other information, contact your Financial Advisor. This document is based upon your Morgan Stanley account holdings and may include other holdings/information that you or a third party provided about assets custodied elsewhere. Morgan Stanley will not verify any other holdings/information. If any information reflects assets held away from Morgan Stanley that will be indicated. The information contained in this document is subject to, and does not supersede the confirmations and account statements you receive from us. Values shown in your official account statement may differ from the values shown in this document due to, among other things, different reporting methods, delays, market conditions and interruptions. If there are discrepancies between your official account statement and this document, rely on your official account statement.The information in this document is approximate and subject to updating, correction and other changes. We are not obligated to notify you if information changes. Although the statements of fact and data in this document have been obtained from, and are based upon sources that we believe to be reliable, we do not guarantee their accuracy, or timeliness, and any such information may be incomplete or condensed. Percentage values shown in this document are subject to rounding, which may impact total values. The values of securities and other investments not actively traded may be estimated or may not be available.This information is provided for informational purposes only and should not be used for tax preparation. The information reported on your Form(s) 1099 supersedes the information provided in this report and should be exclusively relied upon for tax preparation. Morgan Stanley, its affiliates and its employees are not in the business of providing tax or legal advice. Clients should seek advice based on their particular circumstances from an independent tax and legal advisor. Morgan Stanley Smith Barney LLC is a registered Broker/Dealer, Member SIPC and not a bank. Where appropriate, Morgan Stanley Smith Barney LLC has entered into arrangements with banks and other unaffiliated third parties to assist in offering certain banking related products and services .Investment, insurance and annuity products offered through Morgan Stanley Smith Barney LLC are: NOT FDIC INSURED | MAY LOSE VALUE | NOT BANK GUARANTEED | NOT A BANK DEPOSIT | NOT INSURED BY ANY FEDERAL GOVERNMENT AGENCY.
Additional information about your Floating Rate Notes: For floating rate securities, the estimated accrued interest and estimated annual income are based on the current floating coupon rate and may not reflect historic rates within the accrual period.
Important Information About Auction Rate Securities: For certain Auction Rate Securities there is no or limited liquidity. Therefore, the price(s) for these Auction Rate Securities are indicated as not available by a dash “-“ . There can be no assurance that a successful auction will occur or that a secondary market exists or will develop for a particular security.
Important Pricing Information: Prices of securities not actively traded may not be available, and are indicated by a dash "-".
Asset Classification: We classify assets based on general characteristics such as: income generation, underlying capital structure, or exposure to certain market sectors. As many assets contain characteristics of more than one asset class, allocations may be under or over inclusive. These classifications do not constitute a recommendation and may differ from the classification of instruments for regulatory or tax purposes. In addition, the Other asset class contains securities that are not included in the various asset class classifications . This can include, but is not limited to, non-traditional investments such as some Equity Unit Trusts, Index Options and Structured Investments issued outside of Morgan Stanley. Additionally, investments for which we are unable to procure market data to properly classify them will appear in the Other category.
Performance: Performance results are annualized for time periods greater than one year and include all cash and cash equivalents, realized and unrealized capital gains and losses, and dividends, interest and income. The investment results depicted herein represent historical performance. As a result of recent market activity, current performance may vary from the figures shown. Please contact your Financial Advisor for up to date performance information. Past performance is not a guarantee of future results.Market values used for performance calculation do not include performance ineligible assets and thus may differ from asset allocation market values. Common examples of Performance Ineligible Assets include life insurance, Manually Added assets and some annuities and Externally Held accounts. Unless otherwise indicated, performance is a composite calculation on the entire portfolio and may include brokerage and investment advisory accounts, as well as assets for different accounts included in this report. The accounts included in the composite may have (or have had) different investment objectives and strategies, been subject to different restrictions, and incurred different types of fees, markups, commissions and other charges . Accordingly, performance results may blend
DISCLOSURESPage 21 of 29
Vermont State Colleges Board of Trustees Finance & Facilities Committee Meeting Materials 75 February 22, 2017
VSC All Accounts Prepared on January 26, 2017|Reporting Currency: USD
the performance of assets and strategies that may not have been available in all of the accounts at all times during the reporting period . In addition, accounts in the composite may have changed from brokerage to advisory or vice versa. Accounts may also have moved from one advisory program to another (including from a discretionary program to a non-discretionary program).For Morgan Stanley Smith Barney LLC accounts, Performance information may cover the full history of the account(s) or just the performance of an account(s) since the inception of the current program(s). Performance results on individual accounts will vary and may differ from the composite returns. Your Financial Advisor can provide you with individual account portfolio composition and performance information. For investment advisory accounts, please see the Morgan Stanley Smith Barney LLC Form ADV Part 2 or applicable disclosure brochure and any applicable brokerage commission and/or fee schedule for a full disclosure of fees and expenses. Your Financial Advisor will provide those documents to you upon request. For brokerage accounts, please speak to your Financial Advisor for more information on commissions and other account fees and expenses.Performance inception date does not necessarily correspond to the account opening date. Where multiple accounts are included in performance calculations, the inception date is the oldest performance inception. Performance data may not be available for all periods as some accounts included in performance may have more recent performance inception dates. Consequently, the actual performance for a group of accounts may differ from reported performance. Please ask your Financial Advisor for the performance inception date for each account.
Indices: Benchmark indices and blends included in this material are for informational purposes only, are provided solely as a comparison tool and may not reflect the underlying composition and /or investment objective(s) associated with the account(s). In some circumstances, the benchmark index may not be an appropriate benchmark for use with the specific composite portfolio . For instance, an index may not take into consideration certain changes that may have occurred in the portfolio since the inception of the account(s) , (e.g., changes from a brokerage to an advisory account or from one advisory program to another, asset class changes, or index changes for individual managers). The volatility of the index used for comparison may be materially different from that of the performance shown. Indices are unmanaged and not available for direct investment. Index returns do not take into account fees or other charges. Such fees and charges would reduce performance. Please see the Benchmark Definitions section of this material for additional information on the indices used for comparison .
Projected 12 Month Income: Projected Next 12 Months income includes cash income such as interest and cash dividends, based on current yields and may include income from Morgan Stanley & Co . and Externally Held accounts where data is available. These are projections based on historical data and the actual income may be lower or higher than the projections. Projected income for Morgan Stanley & Co. and Externally Held accounts is calculated based upon data obtained from sources that we believe to be reliable, however, Morgan Stanley Wealth Management does not guarantee its accuracy or timeliness. As such, Morgan Stanley Wealth Management recommends confirming projected income information with the custodian institution prior to taking any action . Projections will not include income from Manually Added assets.
Additional information about your Alternative Investments: An alternative investment is any non-traditional asset beyond stocks, bonds, and cash, and may include derivatives such as options and futures, leveraged equity or bonds, private equity, currencies, commodities, less common types of stocks such as natural resources stocks, master limited partnerships (MLPs), and real estate investment trusts (REITs), or even collectibles such as paintings or other works of art, or luxury items such as wine and spirits . Many of these alternative investments typically have eligibility requirements that cannot be met by the average investor and are therefore not appropriate for all investors. Typical alternative investment vehicles are generally private offerings and can include hedge funds and funds of hedge funds, managed futures funds, and other vehicles. They utilize alternative strategies and investing techniques such as long/short, hedged equity and event driven, to name just a few. Often, alternative strategies seek to provide competitive returns relative to a given benchmark, while at the same time limiting downside risk in the event of a market downturn, although objectives vary widely depending on the type of strategy. In recent years, certain open-end mutual funds can now be classified as another type of alternative investment vehicle as they seek alternative-like exposure and these may be included in the Alternative Investments category. They are publicly offered and more accessible by a larger number of investors. Both types of alternative investment vehicles often seek investment returns that have lower correlation to traditional markets and increased diversification in an overall portfolio . However, unlike hedge funds, open-end mutual funds that seek alternative-like exposure do not require investor pre-qualifications, enable efficient tax reporting, are subject to lower investment minimums and lower fees, provide greater portfolio transparency, daily liquidity, and are required to provide daily NAV pricing. While alternative mutual funds offer some advantages, generally they must utilize a more limited investment universe and, therefore, will have relatively higher correlation with traditional market returns. Additionally, open-end mutual funds are statutorily limited in their use of leverage, short sales, and the use of derivative instruments as compared to hedge funds.Potential benefits to hedge funds include greater flexibility in terms of seeking enhanced returns through the use of leverage, exposure to less liquid investments, and the more flexible use of complex instruments such as derivatives. Because of the differences noted above, performance for a mutual fund that seeks alternative-like exposure and its portfolio characteristics may vary from a hedge fund that is seeking a similar investment objective. Historically, hedge funds in certain categories have enjoyed a performance advantage relative to their mutual fund counterparts.It is important to note in this report that Morgan Stanley categorizes both types of alternative investment vehicles under the category "Alternatives" in the asset classification based view and under the category "Other" in a Product based view. This differs from your official Morgan Stanley account statement, which assigns alternative mutual funds under the category of "Mutual Funds" and typical alternative investment vehicles such as hedge funds, under the category "Alternatives".Please note that no formal trading markets exist for private alternative investments. They are generally illiquid and may not be currently priced and values may not necessarily have been reduced to reflect prior distributions. If values and prices are assigned to the investments, they are estimates, based on information typically received from the funds' general partners, managing members,
DISCLOSURESPage 22 of 29
Vermont State Colleges Board of Trustees Finance & Facilities Committee Meeting Materials 76 February 22, 2017
VSC All Accounts Prepared on January 26, 2017|Reporting Currency: USD
sponsors, administrators, or advisors of the funds and/or underlying funds, are typically subject to change and are as-of a date prior to the date of this report. Where applicable, see the particular fund statement for the final prices. Values and prices may not be realized upon the sale or ultimate disposition of the securities. For investment in funds valued in non-US Dollar currencies, the valuations received have been converted to US Dollars using then prevailing foreign exchange rates. If index values are illustrated in the report, they may be more up to date than the data for the alternative investments illustrated. Private Alternative Investments listed in this report may not be not in our possession, and are included solely as a service to the client, are not covered by the Securities Investor Protection Corporation (SIPC), and information contained herein is derived from an external service for which we are not responsible. If you have any questions regarding these investments, please contact your Financial Advisor.
Morgan Stanley Wealth Management is the trade name of Morgan Stanley Smith Barney LLC, a registered broker-dealer in the United States. The sole purpose of this material is to inform, and it in no way is intended to be an offer or solicitation to purchase or sell any security, other investment or service, or to attract any funds or deposits . Investments mentioned may not be suitable for all clients. Any product discussed herein may be purchased only after a client has carefully reviewed the offering memorandum and executed the subscription documents. Morgan Stanley Wealth Management has not considered the actual or desired investment objectives, goals, strategies, guidelines, or factual circumstances of any investor in any fund(s). Before making any investment, each investor should carefully consider the risks associated with the investment, as discussed in the applicable offering memorandum, and make a determination based upon their own particular circumstances, that the investment is consistent with their investment objectives and risk tolerance . Morgan Stanley Smith Barney LLC offers investment program services through a variety of investment programs, which are opened pursuant to written client agreements. Each program offers investment managers, funds and features that are not available in other programs; conversely, some investment managers, funds or investment strategies may be available in more than one program.Morgan Stanley’s investment advisory programs may require a minimum asset level and, depending on your specific investment objectives and financial position, may not be suitable for you . Please see the Morgan Stanley Smith Barney LLC program disclosure brochure (the “Morgan Stanley ADV”) for more information in the investment advisory programs available. The Morgan Stanley ADV is available at www.morganstanley.com/ADV. Sources of Data. Information in this material in this report has been obtained from sources that we believe to be reliable, but we do not guarantee its accuracy, completeness or timeliness. Third-party data providers make no warranties or representations relating to the accuracy, completeness or timeliness of the data they provide and are not liable for any damages relating to this data. All opinions included in this material constitute the Firm’s judgment as of the date of this material and are subject to change without notice . This material was not prepared by the research departments of Morgan Stanley & Co. LLC or Morgan Stanley Smith Barney LLC. Some historical figures may be revised due to newly identified programs, firm restatements, etc.Global Investment Manager Analysis (GIMA) Focus List, Approved List and Tactical Opportunities List; Watch Policy. GIMA uses two methods to evaluate investment products in applicable advisory programs: Focus (and investment products meeting this standard are described as being on the Focus List) and Approved (and investment products meeting this standard are described as being on the Approved List). In general, Focus entails a more thorough evaluation of an investment product than Approved. Sometimes an investment product may be evaluated using the Focus List process but then placed on the Approved List instead of the Focus List. Investment products may move from the Focus List to the Approved List, or vice versa. GIMA may also determine that an investment product no longer meets the criteria under either process and will no longer be recommended in investment advisory programs (in which case the investment product is given a “Not Approved” status). GIMA has a ‘Watch” policy and may describe a Focus List or Approved List investment product as being on “Watch” if GIMA identifies specific areas that (a) merit further evaluation by GIMA and (b) may, but are not certain to, result in the investment product becoming “Not Approved.” The Watch period depends on the length of time needed for GIMA to conduct its evaluation and for the investment manager or fund to address any concerns. Certain investment products on either the Focus List or Approved List may also be recommended for the Tactical Opportunities List based in part on tactical opportunities existing at a given time. The investment products on the Tactical Opportunities List change over time. For more information on the Focus List, Approved List, Tactical Opportunities List and Watch processes, please see the applicable Form ADV Disclosure Document for Morgan Stanley Wealth Management . Your Financial Advisor or Private Wealth Advisor can also provide upon request a copy of a publication entitled “Manager Selection Process.”The Global Investment Committee is a group of seasoned investment professionals who meet regularly to discuss the global economy and markets. The committee determines the investment outlook that guides our advice to clients. They continually monitor developing economic and market conditions, review tactical outlooks and recommend model portfolio weightings, as well as produce a suite of strategy, analysis, commentary, portfolio positioning suggestions and other reports and broadcasts.The Global Investment Manager Analysis (GIMA) Services Only Apply to Certain Investment Advisory Programs GIMA evaluates certain investment products for the purposes of some – but not all – of Morgan Stanley Smith Barney LLC’s investment advisory programs (as described in more detail in the applicable Form ADV Disclosure Document for Morgan Stanley Wealth Management). If you do not invest through one of these investment advisory programs, Morgan Stanley Wealth Management is not obligated to provide you notice of any GIMA Status changes even though it may give notice to clients in other programs.Strategy May Be Available as a Separately Managed Account or Mutual Fund Strategies are sometimes available in Morgan Stanley Wealth Management investment advisory programs both in the form of a separately managed account (“SMA”) and a mutual fund. These may have different expenses and investment minimums. Your Financial Advisor or Private Wealth Advisor can provide more information on whether any particular strategy is available in more than one form in a particular investment advisory program. In most Morgan Stanley Wealth Management investment advisory accounts, fees are deducted quarterly and have a compounding effect on performance. For example, on an advisory account with a 3% annual fee, if the gross annual performance is 6.00%, the compounding effect of the fees will result in a net performance of approximately 3.93% after one year, 1 after three years, and 21.23% after five years. Conflicts of Interest: GIMA’s goal is to provide
DISCLOSURESPage 23 of 29
Vermont State Colleges Board of Trustees Finance & Facilities Committee Meeting Materials 77 February 22, 2017
VSC All Accounts Prepared on January 26, 2017|Reporting Currency: USD
professional, objective evaluations in support of the Morgan Stanley Wealth Management investment advisory programs. We have policies and procedures to help us meet this goal. However, our business is subject to various conflicts of interest. For example, ideas and suggestions for which investment products should be evaluated by GIMA come from a variety of sources, including our Morgan Stanley Wealth Management Financial Advisors and their direct or indirect managers, and other business persons within Morgan Stanley Wealth Management or its affiliates . Such persons may have an ongoing business relationship with certain investment managers or mutual fund companies whereby they, Morgan Stanley Wealth Management or its affiliates receive compensation from, or otherwise related to, those investment managers or mutual funds. For example, a Financial Advisor may suggest that GIMA evaluates an investment manager or fund in which a portion of his or her clients’ assets are already invested. While such a recommendation is permissible, GIMA is responsible for the opinions expressed by GIMA. See the conflicts of interest section in the applicable Form ADV Disclosure Document for Morgan Stanley Wealth Management for a discussion of other types of conflicts that may be relevant to GIMA’s evaluation of managers and funds. In addition, Morgan Stanley Wealth Management, MS & Co., managers and their affiliates provide a variety of services (including research, brokerage, asset management, trading, lending and investment banking services) for each other and for various clients, including issuers of securities that may be recommended for purchase or sale by clients or are otherwise held in client accounts, and managers in various advisory programs. Morgan Stanley Wealth Management, managers, MS & Co., and their affiliates receive compensation and fees in connection with these services. Morgan Stanley Wealth Management believes that the nature and range of clients to which such services are rendered is such that it would be inadvisable to exclude categorically all of these companies from an account .Consider Your Own Investment Needs: The model portfolios and strategies discussed in the material are formulated based on general client characteristics including risk tolerance . This material is not intended to be a client-specific suitability analysis or recommendation, or offer to participate in any investment. Therefore, clients should not use this profile as the sole basis for investment decisions. They should consider all relevant information, including their existing portfolio, investment objectives, risk tolerance, liquidity needs and investment time horizon . Such a suitability determination may lead to asset allocation results that are materially different from the asset allocation shown in this profile. Talk to your Financial Advisor about what would be a suitable asset allocation for you, whether CGCM is a suitable program for you.No obligation to notify – Morgan Stanley Wealth Management has no obligation to notify you when the model portfolios, strategies, or any other information, in this material changes .Please consider the investment objectives, risks, fees, and charges and expenses of mutual funds, ETFs, closed end funds, unit investment trusts, and variable insurance products carefully before investing. The prospectus contains this and other information about each fund. To obtain a prospectus, contact your Financial Advisor or Private Wealth Advisor or visit the Morgan Stanley website at www.morganstanley.com. Please read it carefully before investing.An investment in a money market fund is not insured or guaranteed by the Federal Deposit Insurance Corporation or any other government agency. Although the Fund seeks to preserve the value of your investment at $1.00 per share, it is possible to lose money by investing in the fund.The type of mutual funds and ETFs discussed in this presentation utilizes nontraditional or complex investment strategies and /or derivatives. Examples of these types of funds include those that utilize one or more of the below noted investment strategies or categories or which seek exposure to the following markets: (1) commodities (e .g., agricultural, energy and metals), currency, precious metals; (2) managed futures; (3) leveraged, inverse or inverse leveraged; (4) bear market, hedging, long-short equity, market neutral; (5) real estate; (6) volatility (seeking exposure to the CBOE VIX Index). Investors should keep in mind that while mutual funds and ETFs may, at times, utilize nontraditional investment options and strategies, they should not be equated with unregistered privately offered alternative investments. Because of regulatory limitations, mutual funds and ETFs that seek alternative-like investment exposure must utilize a more limited investment universe. As a result, investment returns and portfolio characteristics of alternative mutual funds and ETFs may vary from traditional hedge funds pursuing similar investment objectives. Moreover, traditional hedge funds have limited liquidity with long “lock-up” periods allowing them to pursue investment strategies without having to factor in the need to meet client redemptions and ETFs trade on an exchange . On the other hand, mutual funds typically must meet daily client redemptions. This differing liquidity profile can have a material impact on the investment returns generated by a mutual or ETF pursuing an alternative investing strategy compared with a traditional hedge fund pursuing the same strategy.Nontraditional investment options and strategies are often employed by a portfolio manager to further a fund’s investment objective and to help offset market risks . However, these features may be complex, making it more difficult to understand the fund’s essential characteristics and risks, and how it will perform in different market environments and over various periods of time . They may also expose the fund to increased volatility and unanticipated risks particularly when used in complex combinations and/or accompanied by the use of borrowing or “leverage.”KEY ASSET CLASS CONSIDERATIONS AND OTHER RISKSInvesting in the markets entails the risk of market volatility. The value of all types of investments, including stocks, mutual funds, exchange-traded funds (“ETFs”), closed-end funds, and unit investment trusts, may increase or decrease over varying time periods. To the extent the investments depicted herein represent international securities, you should be aware that there may be additional risks associated with international investing, including foreign economic, political, monetary and/or legal factors, changing currency exchange rates, foreign taxes, and differences in financial and accounting standards. These risks may be magnified in emerging markets and frontier markets. Small- and mid-capitalization companies may lack the financial resources, product diversification and competitive strengths of larger companies. In addition, the securities of small- and mid-capitalization companies may not trade as readily as, and be subject to higher volatility than, those of larger, more established companies. The value of fixed income securities will fluctuate and, upon a sale, may be worth more or less than their original cost or maturity value. Bonds are subject to interest rate risk, call risk, reinvestment risk, liquidity risk, and credit risk of the issuer. High yield bonds are subject to additional risks such as increased risk of default and greater volatility because of the lower credit quality of the issues. In the case of municipal bonds, income is generally exempt from federal income taxes. Some income may be subject to state and local taxes and to the federal alternative minimum tax. Capital gains, if any, are subject to tax. Treasury Inflation Protection Securities’ (TIPS) coupon payments and underlying principal are automatically increased to compensate for inflation by tracking the consumer price index (CPI). While the real rate of return is guaranteed, TIPS tend to offer a low return . Because the return of TIPS is linked to inflation, TIPS
DISCLOSURESPage 24 of 29
Vermont State Colleges Board of Trustees Finance & Facilities Committee Meeting Materials 78 February 22, 2017
VSC All Accounts Prepared on January 26, 2017|Reporting Currency: USD
may significantly underperform versus conventional U.S. Treasuries in times of low inflation. There is no guarantee that investors will receive par if TIPS are sold prior to maturity. The returns on a portfolio consisting primarily of environmental, social, and governance-aware investments (“ESG”) may be lower or higher than a portfolio that is more diversified or where decisions are based solely on investment considerations. Because ESG criteria exclude some investments, investors may not be able to take advantage of the same opportunities or market trends as investors that do not use such criteria. The companies identified and investment examples are for illustrative purposes only and should not be deemed a recommendation to purchase, hold or sell any securities or investment products. They are intended to demonstrate the approaches taken by managers who focus on ESG criteria in their investment strategy. There can be no guarantee that a client's account will be managed as described herein. As regards Securities Based Lending, you need to understand that: (1) Sufficient collateral must be maintained to support your loan(s) and to take future advances; (2) You may have to deposit additional cash or eligible securities on short notice; (3) Some or all of your securities may be sold without prior notice in order to maintain account equity at required maintenance levels. You will not be entitled to choose the securities that will be sold. These actions may interrupt your long-term investment strategy and may result in adverse tax consequences or in additional fees being assessed; (4) Morgan Stanley Bank, N.A., Morgan Stanley Private Bank, National Association or Morgan Stanley Smith Barney LLC (collectively referred to as “Morgan Stanley”) reserves the right not to fund any advance request due to insufficient collateral or for any other reason except for any portion of a securities based loan that is identified as a committed facility; (5) Morgan Stanley reserves the right to increase your collateral maintenance requirements at any time without notice; and (6) Morgan Stanley reserves the right to call securities based loans at any time and for any reason. Options and margin trading involve substantial risk and are not suitable for all investors. Besides the general investment risk of holding securities that may decline in value and the possible loss of principal invested, closed-end funds may have additional risks related to declining market prices relative to net asset values (NAVs), active manager underperformance and potential leverage. Closed-end funds, unlike open-end funds, are not continuously offered. There is a one-time public offering and once issued, shares of closed-end funds are sold in the open market through a stock exchange. NAV is total assets less total liabilities divided by the number of shares outstanding. At the time an investor purchases shares of a closed-end fund, shares may have a market price that is above or below NAV.Alternative investments often are speculative and include a high degree of risk. Investors could lose all or a substantial amount of their investment. Alternative investments are suitable only for eligible, long-term investors who are willing to forgo liquidity and put capital at risk for an indefinite period of time. They may be highly illiquid and can engage in leverage and other speculative practices that may increase the volatility and risk of loss. Alternative Investments typically have higher fees than traditional investments. Investors should carefully review and consider potential risks before investing. Certain of these risks may include but are not limited to: Loss of all or a substantial portion of the investment due to leveraging, short-selling, or other speculative practices; Lack of liquidity in that there may be no secondary market for a fund; Volatility of returns; Restrictions on transferring interests in a fund; Potential lack of diversification and resulting higher risk due to concentration of trading authority when a single advisor is utilized; Absence of information regarding valuations and pricing; Complex tax structures and delays in tax reporting; Less regulation and higher fees than mutual funds; and Risks associated with the operations, personnel, and processes of the manager . As a diversified global financial services firm, Morgan Stanley Wealth Management engages in a broad spectrum of activities including financial advisory services, investment management activities, sponsoring and managing private investment funds, engaging in broker -dealer transactions and principal securities, commodities and foreign exchange transactions, research publication, and other activities . In the ordinary course of its business, Morgan Stanley Wealth Management therefore engages in activities where Morgan Stanley Wealth Management’s interests may conflict with the interests of its clients, including the private investment funds it manages . Morgan Stanley Wealth Management can give no assurance that conflicts of interest will be resolved in favor of its clients or any such fund. All expressions of opinion are subject to change without notice and are not intended to be a forecast of future events or results. Further, opinions regarding Alternative Investments expressed herein may differ from the opinions expressed by Morgan Stanley Wealth Management and/or other businesses/affiliates of Morgan Stanley Wealth Management. This is not a "research report" as defined by NASD Conduct Rule 2711 and was not prepared by the Research Departments of Morgan Stanley Smith Barney LLC or Morgan Stanley & Co. LLC or its affiliates. Certain information contained herein may constitute forward-looking statements. Due to various risks and uncertainties, actual events, results or the performance of a fund may differ materially from those reflected or contemplated in such forward-looking statements. Clients should carefully consider the investment objectives, risks, charges, and expenses of a fund before investing. While the HFRI indices are frequently used, they have limitations (some of which are typical of other widely used indices). These limitations include survivorship bias (the returns of the indices may not be representative of all the hedge funds in the universe because of the tendency of lower performing funds to leave the index); heterogeneity (not all hedge funds are alike or comparable to one another, and the index may not accurately reflect the performance of a described style); and limited data (many hedge funds do not report to indices, and the index may omit funds, the inclusion of which might significantly affect the performance shown . The HFRI indices are based on information self-reported by hedge fund managers that decide on their own, at any time, whether or not they want to provide, or continue to provide, information to HFR Asset Management, L .L.C. Results for funds that go out of business are included in the index until the date that they cease operations . Therefore, these indices may not be complete or accurate representations of the hedge fund universe, and may be biased in several ways. Composite index results are shown for illustrative purposes and do not represent the performance of a specific investment. Individual funds have specific tax risks related to their investment programs that will vary from fund to fund. Clients should consult their own tax and legal advisors as Morgan Stanley Wealth Management does not provide tax or legal advice. Interests in alternative investment products are offered pursuant to the terms of the applicable offering memorandum, are distributed by Morgan Stanley Smith Barney LLC and certain of its affiliates, and (1) are not FDIC-insured, (2) are not deposits or other obligations of Morgan Stanley or any of its affiliates, (3) are not guaranteed by Morgan Stanley and its affiliates, and (4) involve investment risks, including possible loss of principal. Morgan Stanley Smith Barney LLC is a registered broker-dealer, not a bank. This material is not to be reproduced or distributed to any other persons (other than professional advisors of the investors or prospective investors, as applicable, receiving this material) and is intended solely for the use of the persons to whom it has been delivered . This material is not for distribution to the general public. Past performance is no guarantee of future results. Actual results may vary. SIPC insurance does not apply to precious metals, other commodities, or traditional alternative investments. Interests in alternative investment products are offered pursuant to the terms of the applicable offering memorandum, are distributed by Morgan
DISCLOSURESPage 25 of 29
Vermont State Colleges Board of Trustees Finance & Facilities Committee Meeting Materials 79 February 22, 2017
VSC All Accounts Prepared on January 26, 2017|Reporting Currency: USD
Stanley Smith Barney LLC and certain of its affiliates, and (1) are not FDIC-insured, (2) are not deposits or other obligations of Morgan Stanley or any of its affiliates, (3) are not guaranteed by Morgan Stanley and its affiliates, and (4) involve investment risks, including possible loss of principal. Morgan Stanley Smith Barney LLC is a registered broker-dealer, not a bank. In Consulting Group’s advisory programs, alternative investments are limited to US-registered mutual funds, separate account strategies and exchange-traded funds (ETFs) that seek to pursue alternative investment strategies or returns utilizing publicly traded securities. Investment products in this category may employ various investment strategies and techniques for both hedging and more speculative purposes such as short-selling, leverage, derivatives and options, which can increase volatility and the risk of investment loss. Alternative investments are not suitable for all investors. As a diversified global financial services firm, Morgan Stanley Wealth Management engages in a broad spectrum of activities including financial advisory services, investment management activities, sponsoring and managing private investment funds, engaging in broker-dealer transactions and principal securities, commodities and foreign exchange transactions, research publication, and other activities . In the ordinary course of its business, Morgan Stanley Wealth Management therefore engages in activities where Morgan Stanley Wealth Management’s interests may conflict with the interests of its clients, including the private investment funds it manages. Morgan Stanley Wealth Management can give no assurance that conflicts of interest will be resolved in favor of its clients or any such fund. Alternative investments involve complex tax structures, tax inefficient investing, and delays in distributing important tax information . Individual funds have specific risks related to their investment programs that will vary from fund to fund. Clients should consult their own tax and legal advisors as Morgan Stanley Wealth Management does not provide tax or legal advice.While the HFRI indices are frequently used, they have limitations (some of which are typical of other widely used indices). These limitations include survivorship bias (the returns of the indices may not be representative of all the hedge funds in the universe because of the tendency of lower performing funds to leave the index); heterogeneity (not all hedge funds are alike or comparable to one another, and the index may not accurately reflect the performance of a described style); and limited data (many hedge funds do not report to indices, and the index may omit funds, the inclusion of which might significantly affect the performance shown. The HFRI indices are based on information self-reported by hedge fund managers that decide on their own, at any time, whether or not they want to provide, or continue to provide, information to HFR Asset Management, L.L.C. Results for funds that go out of business are included in the index until the date that they cease operations . Therefore, these indices may not be complete or accurate representations of the hedge fund universe, and may be biased in several ways .It should be noted that the majority of hedge fund indexes are comprised of hedge fund manager returns. This is in contrast to traditional indexes, which are comprised of individual securities in the various market segments they represent and offer complete transparency as to membership and construction methodology. As such, some believe that hedge fund index returns have certain biases that are not present in traditional indexes. Some of these biases inflate index performance, while others may skew performance negatively. However, many studies indicate that overall hedge fund index performance has been biased to the upside. Some studies suggest performance has been inflated by up to 260 basis points or more annually depending on the types of biases included and the time period studied. Although there are numerous potential biases that could affect hedge fund returns, we identify some of the more common ones throughout this paper .Self-selection bias results when certain manager returns are not included in the index returns and may result in performance being skewed up or down . Because hedge funds are private placements, hedge fund managers are able to decide which fund returns they want to report and are able to opt out of reporting to the various databases . Certain hedge fund managers may choose only to report returns for funds with strong returns and opt out of reporting returns for weak performers. Other hedge funds that close may decide to stop reporting in order to retain secrecy, which may cause a downward bias in returns.Survivorship bias results when certain constituents are removed from an index. This often results from the closure of funds due to poor performance, “blow ups,” or other such events. As such, this bias typically results in performance being skewed higher. As noted, hedge fund index performance biases can result in positive or negative skew. However, it would appear that the skew is more often positive. While it is difficult to quantify the effects precisely, investors should be aware that idiosyncratic factors may be giving hedge fund index returns an artificial “lift” or upwards bias .Hedge Funds of Funds and many funds of funds are private investment vehicles restricted to certain qualified private and institutional investors. They are often speculative and include a high degree of risk. Investors can lose all or a substantial amount of their investment. They may be highly illiquid, can engage in leverage and other speculative practices that may increase volatility and the risk of loss, and may be subject to large investment minimums and initial lockups. They involve complex tax structures, tax-inefficient investing and delays in distributing important tax information. Categorically, hedge funds and funds of funds have higher fees and expenses than traditional investments, and such fees and expenses can lower the returns achieved by investors . Funds of funds have an additional layer of fees over and above hedge fund fees that will offset returns. An investment in an exchange-traded fund involves risks similar to those of investing in a broadly based portfolio of equity securities traded on an exchange in the relevant securities market, such as market fluctuations caused by such factors as economic and political developments, changes in interest rates and perceived trends in stock and bond prices. An investment in a target date portfolio is subject to the risks attendant to the underlying funds in which it invests, in these portfolios the funds are the Consulting Group Capital Market funds. A target date portfolio is geared to investors who will retire and/or require income at an approximate year. The portfolio is managed to meet the investor’s goals by the pre-established year or “target date.” A target date portfolio will transition its invested assets from a more aggressive portfolio to a more conservative portfolio as the target date draws closer . An investment in the target date portfolio is not guaranteed at any time, including, before or after the target date is reached . Managed futures investments are speculative, involve a high degree of risk, use significant leverage, are generally illiquid, have substantial charges, subject investors to conflicts of interest, and are suitable only for the risk capital portion of an investor’s portfolio . Managed futures investments do not replace equities or bonds but rather may act as a complement in a well diversified portfolio. Managed Futures are complex and not appropriate for all investors. Rebalancing does not protect against a loss in declining financial markets. There may be a potential tax implication with a rebalancing strategy. Asset allocation and diversification do not assure a profit or protect against loss in declining financial markets. Past performance is no guarantee of future results. Actual results may vary.Tax laws are complex and subject to change. Morgan Stanley Smith Barney LLC (“Morgan Stanley”), its affiliates and Morgan Stanley Financial Advisors and private Wealth Advisors do not provide tax or legal advice and are not “fiduciaries” (under ERISA, the Internal Revenue Code or otherwise) with respect to the services or activities described herein except as otherwise
DISCLOSURESPage 26 of 29
Vermont State Colleges Board of Trustees Finance & Facilities Committee Meeting Materials 80 February 22, 2017
VSC All Accounts Prepared on January 26, 2017|Reporting Currency: USD
provided in writing by Morgan Stanley. Individuals are encouraged to consult their tax and legal advisors (a) before establishing a retirement plan or account, and (b) regarding any potential tax, ERISA and related consequences of any investments made under such plan or account.Insurance products are offered in conjunction with Morgan Stanley Smith Barney LLC’s licensed insurance agency affiliates.Indices are unmanaged. An investor cannot invest directly in an index. They are shown for illustration purposes only and do not show the performance of any specific investment. Reference to an index does not imply that the portfolio will achieve return, volatility or other results similar to the index. The composition of an index may not reflect the manner in which a portfolio is constructed in relation to expected or achieved returns, portfolio guidelines, restrictions, sectors, correlations, concentrations, volatility, or tracking error target, all of which are subject to change over time .This material is not a financial plan and does not create an investment advisory relationship between you and your Morgan Stanley Financial Advisor. We are not your fiduciary either under the Employee Retirement Income Security Act of 1974 (ERISA) or the Internal Revenue Code of 1986, and any information in this report is not intended to form the primary basis for any investment decision by you, or an investment advice or recommendation for either ERISA or Internal Revenue Code purposes. Morgan Stanley Private Wealth Management will only prepare a financial plan at your specific request using Private Wealth Management approved financial planning signature.We may act in the capacity of a broker or that of an advisor. As your broker, we are not your fiduciary and our interests may not always be identical to yours. Please consult with your Private Wealth Advisor to discuss our obligations to disclose to you any conflicts we may from time to time have and our duty to act in your best interest. We may be paid both by you and by others who compensate us based on what you buy. Our compensation, including that of your Private Wealth Advisor, may vary by product and over time.Investment and services offered through Morgan Stanley Private Wealth Management, a division of Morgan Stanley Smith Barney LLC, Member SIPC.Investment, insurance and annuity products offered through Morgan Stanley Smith Barney LLC are: NOT FDIC INSURED | MAY LOSE VALUE | NOT BANK GUARANTEED | NOT A BANK DEPOSIT | NOT INSURED BY ANY FEDERAL GOVERNMENT AGENCYFor index, indicator and survey definitions referenced in this report please visit the following: http://www.morganstanleyfa.com/public/projectfiles/id.pdf
Global Investment Committee (GIC) Asset Allocation Models: The Asset Allocation Models are created by Morgan Stanley Wealth Management’s GIC. HYPOTHETICAL MODEL PERFORMANCE (GROSS): Hypothetical model performance results do not reflect the investment or performance of an actual portfolio following a GIC Strategy, but simply reflect actual historical performance of selected indices on a real-time basis over the specified period of time representing the GIC’s strategic and tactical allocations as of the date of this report . The past performance shown here is simulated performance based on benchmark indices, not investment results from an actual portfolio or actual trading. There can be large differences between hypothetical and actual performance results achieved by a particular asset allocation or trading strategy. Hypothetical performance results do not represent actual trading and are generally designed with the benefit of hindsight . Actual performance results of accounts vary due to, for example, market factors (such as liquidity) and client-specific factors (such as investment vehicle selection, timing of contributions and withdrawals, restrictions and rebalancing schedules). Clients would not necessarily have obtained the performance results shown here if they had invested in accordance with any GIC Asset Allocation Model for the periods indicated. Despite the limitations of hypothetical performance, these hypothetical performance results allow clients and Financial Advisors to obtain a sense of the risk /return trade-off of different asset allocation constructs. The hypothetical performance results in this report are calculated using the returns of benchmark indices for the asset classes, and not the returns of securities, fund or other investment products. Models may contain allocations to Hedge Funds, Private Equity and Private Real Estate. The benchmark indices for these asset classes are not issued on a daily basis. When calculating model performance on a day for which no benchmark index data is issued, we have assumed straight line growth between the index levels issued before and after that date . FEES REDUCE THE PERFORMANCE OF ACTUAL ACCOUNTS: None of the fees or other expenses (e.g. commissions, mark-ups, mark-downs, fees) associated with actual trading or accounts are reflected in the GIC Asset Allocation Models. The GIC Asset Allocation Models and any model performance included in this presentation are intended as educational materials . Were a client to use these models in connection with investing, any investment decisions made would be subject to transaction and other costs which, when compounded over a period of years, would decrease returns . Information regarding Morgan Stanley’s standard advisory fees is available in the Form ADV Part 2, which is available at www.morganstanley.com/adv. The following hypothetical illustrates the compound effect fees have on investment returns: For example, if a portfolio’s annual rate of return is 15% for 5 years and the account pays 50 basis points in fees per annum, the gross cumulative five-year return would be 101.1% and the five-year return net of fees would be 96.8%. Fees and/or expenses would apply to clients who invest in investments in an account based on these asset allocations, and would reduce clients’ returns. The impact of fees and/or expenses can be material. insurance products disclosures: Variable annuities are long-term investments designed for retirement purposes and may be subject to market fluctuations, investment risk, and possible loss of principal. All guarantees, including optional benefits, are based on the financial strength and claims-paying ability of the issuing insurance company and do not apply to the underlying investment options. Optional riders may not be able to be purchased in combination and are available at an additional cost. Some optional riders must be elected at time of purchase. Optional riders may be subject to specific limitations, restrictions, holding periods, costs, and expenses as specified by the insurance company in the annuity contract. If you are investing in a variable annuity through a tax-advantaged retirement plan such as an IRA, you will get no additional tax advantage from the variable annuity. Under these circumstances, you should only consider buying a variable annuity because of its other features, such as lifetime income payments and death benefits protection . Taxable distributions (and certain deemed distributions) are subject to ordinary income tax and, if taken prior to age 59½, may be subject to a 10% federal income tax penalty. Early withdrawals will reduce the death benefit and cash surrender value. Equity securities may fluctuate in response to news on companies, industries, market conditions and general economic environment. Ultrashort-term fixed income asset class is comprised of fixed income securities with high quality, very short maturities. They are therefore subject to the risks associated with debt securities such as credit and interest rate risk . Master Limited Partnerships (MLPs): Individual MLPs are publicly traded partnerships that have unique risks related to their structure. These include, but are not limited to, their reliance on the capital markets to
DISCLOSURESPage 27 of 29
Vermont State Colleges Board of Trustees Finance & Facilities Committee Meeting Materials 81 February 22, 2017
Dollar-Weighted Return (Internal Rate of Return): A return calculation that measures the actual performance of a portfolio over the reporting period. Since dollar weighted returns include the impact
DISCLOSURESPage 28 of 29
Vermont State Colleges Board of Trustees Finance & Facilities Committee Meeting Materials 82 February 22, 2017
VSC All Accounts Prepared on January 26, 2017|Reporting Currency: USD
of client contributions and withdrawals, they should not be compared to market indices or used to evaluate the performance of a manager, but can be used to evaluate progress toward investment goals.
Investment Earnings: A combination of the income received and total portfolio value increase or decrease, excluding net contributions and withdrawals, over the reporting period .
Net Contributions/Withdrawals: The net value of cash and securities contributed to or withdrawn from the account(s) during the reporting period. Net contributions and withdrawals may include advisory fees for advisory accounts.
Net of Fees: Performance results depicted as "net" of fees shall mean that any wrap fee, investment management fees, trade commissions, and/or other account fees have been deducted. Any other fees or expenses associated with the account, such as third party custodian fees, may not have been deducted. Please see the Morgan Stanley Smith Barney LLC Form ADV Part 2 Brochure for advisory accounts and/or any applicable brokerage account trade confirmation statements for a full disclosure of the applicable charges, fees and expenses. Your Financial Advisor will provide those documents to you upon request.
Performance ineligible assets: Performance returns are not calculated for certain assets because accurate valuations and transactions for these assets are not processed or maintained by Morgan Stanley Smith Barney LLC. Common examples include life insurance, Manually Added assets and some annuities and Externally Held accounts.
Time-Weighted Return: A return calculation that measures the investment performance of a portfolio over the reporting period. Time weighted returns do not include the impact of client contributions and withdrawals and therefore, may not reflect the actual rate of return the client received. Time weighted returns isolate investment actions and can be compared to benchmarks and used to evaluate the performance of a manager.
Total Value: Total Value represents the Market Value of the portfolio or of a given Asset Class inclusive of interest and dividend accruals. Total Value for Asset Allocation before January 2014 does not include accruals. Total Value for Morgan Stanley & Co. and Externally Held accounts may not include accruals.
BENCHMARK DEFINITIONS
65% MSCI AC World/35% Barclays Agg: The current allocation is comprised of 65.00% MSCI AC World Net, 35.00% Barclays Aggregate.
MSCI AC World Net: The MSCI ACWI Index is a free float-adjusted market capitalization weighted index that is designed to measure the equity market performance of developed and emerging markets. The MSCI ACWI consists of 46 country indexes comprising 23 developed and 23 emerging market country indexes. The developed market country indexes included are: Australia, Austria, Belgium, Canada, Denmark, Finland, France, Germany, Hong Kong, Ireland, Israel, Italy, Japan, Netherlands, New Zealand, Norway, Portugal, Singapore, Spain, Sweden, Switzerland, the United Kingdom and the United States. The emerging market country indexes included are: Brazil, Chile, China, Colombia, Czech Republic, Egypt, Greece, Hungary, India, Indonesia, Korea, Malaysia, Mexico, Peru, Philippines, Poland, Qatar, Russia, South Africa, Taiwan, Thailand, Turkey, and United Arab Emirates (as of June 2014). Net total return indices reinvest dividends after the deduction of withholding taxes, using (for international indices) a tax rate applicable to non-resident institutional investors who do not benefit from double taxation treaties. For historical return purposes the AC World gross returns are being used from 1/31/1988 to 12/31/1998 and the net returns begin as of 1/31/1999.
Barclays Aggregate: The Barclays US Aggregate Bond Index is a broad-based flagship benchmark that measures the investment grade, US dollar-denominated, fixed-rate taxable bond market. The index includes Treasuries, government-related and corporate securities, MBS (agency fixed-rate and hybrid ARM pass-throughs), ABS and CMBS (agency and non-agency).
DISCLOSURESPage 29 of 29
Vermont State Colleges Board of Trustees Finance & Facilities Committee Meeting Materials 83 February 22, 2017
Item 6: Updated FY2017 Committee Meeting Schedule
Back to Agenda
Vermont State Colleges Board of Trustees Finance & Facilities Committee Meeting Materials 84 February 22, 2017
Mtg
# Date
Topic
Count
JSC-LSC
Unification
System
Consolidation
FY18 Budget
Development
FY19 Tuition,
Fees, Room &
Board
Quarterly
Results**,
Metrics
Appropriation
Requests
Cash,
Investments,
Endowment
Debt
Management
Capital
Planning and
Projects***
Facilities
Management
Grants and
Gifts
Policies and
Procedures Special Topics
1Wed, Aug 24, 2016
(1:56pm - 3:00pm)8
Standing
Topic/Regular
Updates
Standing
Topic/Regular
Updates
Regular
quarterly report
(per Policy 404)
Debt "101"
discussion
Deferred
maintenance
update
(as needed) (as needed) (as needed)
2Wed, Sep 28, 2016
(1:15pm - 2:30pm)* 8
Unification
report to BOT
due Sep 29
Standing
Topic/Regular
Updates
Q4 FY16
Results,
reserves and
system loans
(Budget
Adjustment and
Appropriations
Bills discussed
at BOT)
TD Debt
Coverage
Covenant for
FY16
Discussion of
Policy 405 and
Legislative
Report
Preliminary
capital projects
list
Policy 411
discussion
3Wed, Oct 19, 2016
(11:00am - 12:30pm)7
Standing
Topic/Regular
Updates
Standing
Topic/Regular
Updates
Review of final
Fall 2016
enrollment
Capital
appropriation
request due
October 14
(subject to BOT
approval)
TD Bank loan
refinancing
resolution
amended to
include all debt
Capital Projects
list submitted
Repeal of Policy
411, Deferred
Payment of
Tuition and
Fees
4Wed, Nov 30, 2016
(9:00am - 10:22am)* 10
(Covered at
BOT meeting)
Accounts
payable
consolidation
target date of
Nov. 18
Initial
discussion
informed by Q1
FY17 results
Q1 FY17
Results
(Election results
covered at BOT
meeting)
Regular
quarterly report
(per Policy 404)
Debt policy
discussion
Addition of
Uniform
Guidance
Compliance
Policies
Investment
policy review
and debt policy
discussion
AGB Report
update
5 Mon, Jan 9, 2017 7
Standing
Topic/Regular
Updates
Standing
Topic/Regular
Updates
Discussion of
financial
metrics,
Composite
Financial Index
(CFI)
Responses to
Budget
Adjustment Act
(if any)
Debt
restructuring
update and
preliminary
schedule
Legislative
Report due
January 15
"Sightlines"
presentation to
Umaine
6 Wed, Feb 22, 2017 7
Standing
Topic/Regular
Updates
Standing
Topic/Regular
Updates
Preliminary
FY18 Budgets
discussion
Q2 FY17
Results
Regular
quarterly report
(per Policy 404)
Debt
restructuring
update
Adoption of
debt policy for
BOT approval
Mon, Mar 13, 2017 *
7 Mon, Apr 10, 2017 7
Standing
Topic/Regular
Updates
Standing
Topic/Regular
Updates
Preliminary
FY18 Budgets
presented
Initial FY19
Tuition
discussion
Debt
restructuring
results (if
available)
Investment
policy annual
review
AGB Report
update
8 Wed, May 31, 2017 6
Standing
Topic/Regular
Updates
Standing
Topic/Regular
Updates
Vote on FY18
Budgets
Preliminary
FY19 Tuition
request
Q3 FY17
Results
Regular
quarterly report,
Annual Banking
& Investment
Resolution (per
Policy 404)
9 Wed, Jun 21, 2017 * 6
Standing
Topic/Regular
Updates
Standing
Topic/Regular
Updates
Vote on FY19
Tuition
Metrics and
dashboard
discussion
Capital planning
discussion
AGB Report
update
* Last meeting before quarterly Board of Trustees Meeting
** Unification report due September 28 BOT (done)** Report due to Joint Fiscal Committee during November 2016 on use of $700,000 "to increase need-based aid for Vermont students" (done)*** "Long term strategic plan… for the most effective use of capital funds…" due January 15, 2017 to Institutions Committees (also from UVM)
Finance and Facilities CommitteeMeeting Schedule for Fiscal Year 2017
as of February 22, 2017
Meeting Cancelled
Vermont State Colleges Board of Trustees Finance & Facilities Committee Meeting Materials 84 February 22, 2017