Mental Health Disparities: More Questions than Answers Karen D. Lincoln Associate Professor Associate Director, Roybal Institute on Aging University of Southern California Presentation prepared for the 8th Annual SIRC Research Conference “Health Disparities: A Global Challenge, a Local Response” April 23, 2010, Phoenix, AZ.
Transcript
Mental Health Disparities: More Questions than Answers
Karen D. LincolnAssociate Professor
Associate Director, Roybal Institute on AgingUniversity of Southern California
Presentation prepared for the 8th Annual SIRC Research Conference “Health Disparities: A Global Challenge, a Local Response” April 23, 2010, Phoenix, AZ.
• “Mental health is not just the absence of mental disorder. It is defined as a state of well-being in which every individual realizes his or her own potential, can cope with the normal stresses of life, can work productively and fruitfully, and is able to make a contribution to her or his community.”
World Health Organization.
Racial Disparities in Mental Health
Health Disparities
• The unequal distribution of disease
• Health disparities are differences in the incidence, prevalence, mortality, burden of diseases and other adverse health conditions or outcomes that exist among specific population groups in the United States.
Mental Disorders are Common in the U.S.
• 1 in 2 Americans has a diagnosable mental disorder each year, including 44 million adults 13.7 million children.
• Mental disorders are as disabling as cancer or heart disease in terms of premature death and lost productivity .
• 80 to 90 percent of mental disorders are treatable using medication and other therapies.
• Of those with a diagnosable mental disorder fewer than half of adults get help. Only one-third of children get help.
Suicide
• Suicide is the 8th leading cause of death in the U.S. 81 Americans die by suicide each day.
• Since 1980, suicide has more than doubled among young Black males in America.
• 80 to 90 percent of people who die by suicide are suffering from a diagnosable mental illness.
0
1
2
3
4
5
6
7
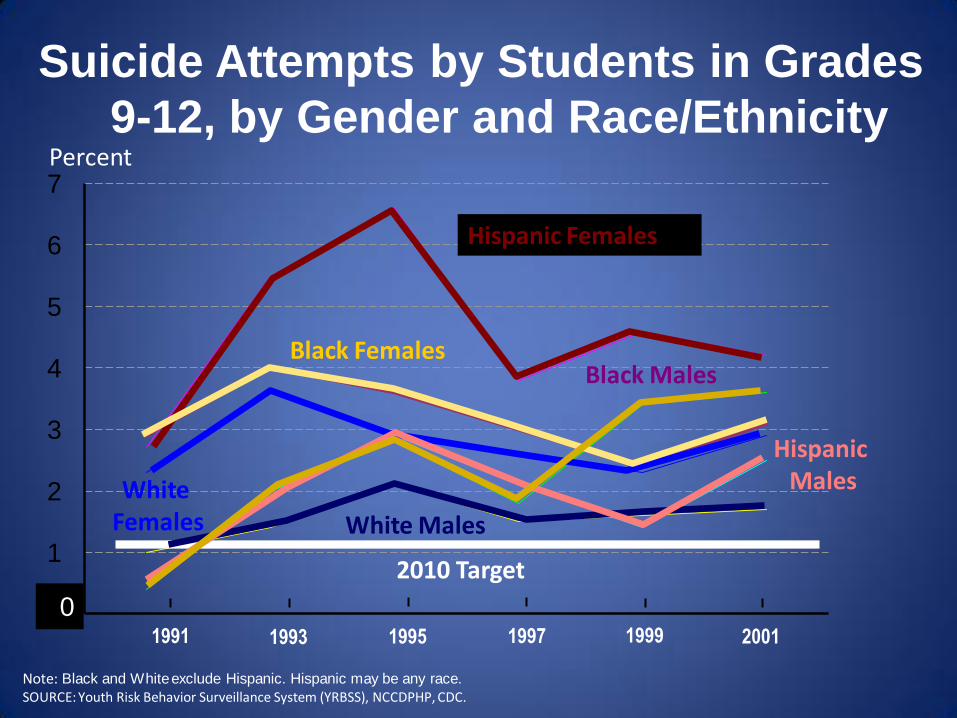
Suicide Attempts by Students in Grades
9-12, by Gender and Race/EthnicityPercent
0
Note: Black and White exclude Hispanic. Hispanic may be any race.
SOURCE: Youth Risk Behavior Surveillance System (YRBSS), NCCDPHP, CDC.
2010 Target
1991 1993 1995 1997 1999 2001
Hispanic Females
Black MalesBlack Females
White Females
Hispanic Males
White Males
Nock, M. K. et al. Epidemiol Rev 2008 30:133-154; doi:10.1093/epirev/mxn002
Numbers of suicide deaths in the United States, by race/ethnicity, sex, and age group, 2005
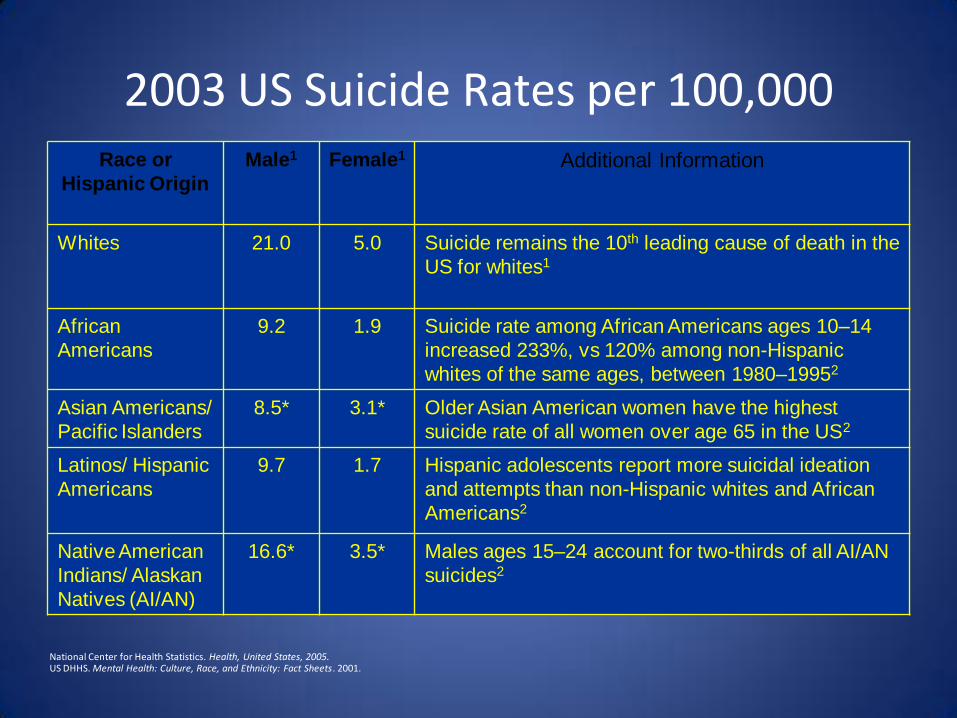
2003 US Suicide Rates per 100,000Race or
Hispanic Origin
Male1 Female1 Additional Information
Whites 21.0 5.0 Suicide remains the 10th leading cause of death in the
US for whites1
African
Americans
9.2 1.9 Suicide rate among African Americans ages 10–14
increased 233%, vs 120% among non-Hispanic
whites of the same ages, between 1980–19952
Asian Americans/
Pacific Islanders
8.5* 3.1* Older Asian American women have the highest
suicide rate of all women over age 65 in the US2
Latinos/ Hispanic
Americans
9.7 1.7 Hispanic adolescents report more suicidal ideation
and attempts than non-Hispanic whites and African
Americans2
Native American
Indians/ Alaskan
Natives (AI/AN)
16.6* 3.5* Males ages 15–24 account for two-thirds of all AI/AN
suicides2
National Center for Health Statistics. Health, United States, 2005.US DHHS. Mental Health: Culture, Race, and Ethnicity: Fact Sheets. 2001.
Lower prevalence rates for some mental health disorders
Higher persistence rate and greater disability
This is the paradox!
Prevalence and persistence of DSM-IV/CIDI-defined major depressive disorder in the NSAL sample by race
Participants, % (SE)
Prevalence African American Caribbean Black White F
Lifetime 10.4 (0.5) 12.9 (2.1) 17.9 (1.5) 30.2*
12 mo before the interview 5.9 (0.4) 7.2 (1.2) 6.9 (0.7) 1.3
30 d 2.2 (0.3) 2.2 (0.9) 3.1 (0.8) 0.9
Persistence
12 mo within lifetime 56.5 (3.0) 56.0 (5.3) 38.6 (5.4) 9.4*
30 d within 12 mo 38.2 (4.6) 31.2 (12.1) 44.1 (8.2) 0.4
30 d within lifetime 21.6 (3.2) 17.5 (7.4) 17.0 (4.3) 0.5
Severity of role impairment in 12-month DSM/CIDI-defined MDD cases in the NSAL by race
Severity of Role Impairment
Domain None/Mild/ Moderate Severe/Very Severe F Statistic (P value)
Home
Black 61.9 (4.3) 38.1 (4.3) 0.22 (.64)
White 56.8 (10.2) 43.2 (10.2)
Work
Black 62.8 (4.2) 37.2 (4.2) 0.91 (.34)
White 71.1 (7.4) 28.9 (7.4)
Relationship
Black 56.8 (4.0) 43.2 (4.0) 1.09 (.30)
White 69.1 (10.1) 30.9 (10.1)
Social
Black 44.6 (3.4) 55.4 (3.4) 9.51 (.003)
White 65.8 (5.3) 34.2 (5.3)
Overall
Black 25.6 (3.3) 74.4 (3.3) 0.91 (.35)
White 36.4 (11.7) 63.6 (11.7)
• Racial and ethnic minorities bear a greater burden from unmet mental health needs and thus suffer a greater loss to their overall health and productivity.
Severity of role impairment using the SDS in 12-month DSM/CIDI-defined MDD cases in the NSAL by race
Days out of role among 12-month MDD cases
No. of days out of role due to depression in the past 365 d, mean
Disparities arising within the clinical encounter may be more important in
mental health care than in health care
Mental Health Providers
• Physicians tend to hold a prior belief about the likelihood of a patient having a condition and update this belief according to the strength of information received in the clinical encounter.
• Because the prevalence of mental disorders may be slightly lower in minorities, underlying assumptions about the distribution of disease or communication problems between the physician and patient can lead to discrimination.
• Provider discrimination has been documented in two studies of mental health care, in which clinicians respondedwith less alacrity to variation in severity of depression among minority patients than white patients.
Balsa AI, McGuire TG, Meredith LS: Testing for statistical discrimination in health care. Health Serv Res 2005; 40:227–252.McGuire TG, Ayanian JZ, Ford DE, Henke RE, Rost KM, Zaslavsky AM: Testing for statistical discrimination by race/ethnicity in panel data for depression treatment in primary care. Health Serv Res 2008; 43:531–551.
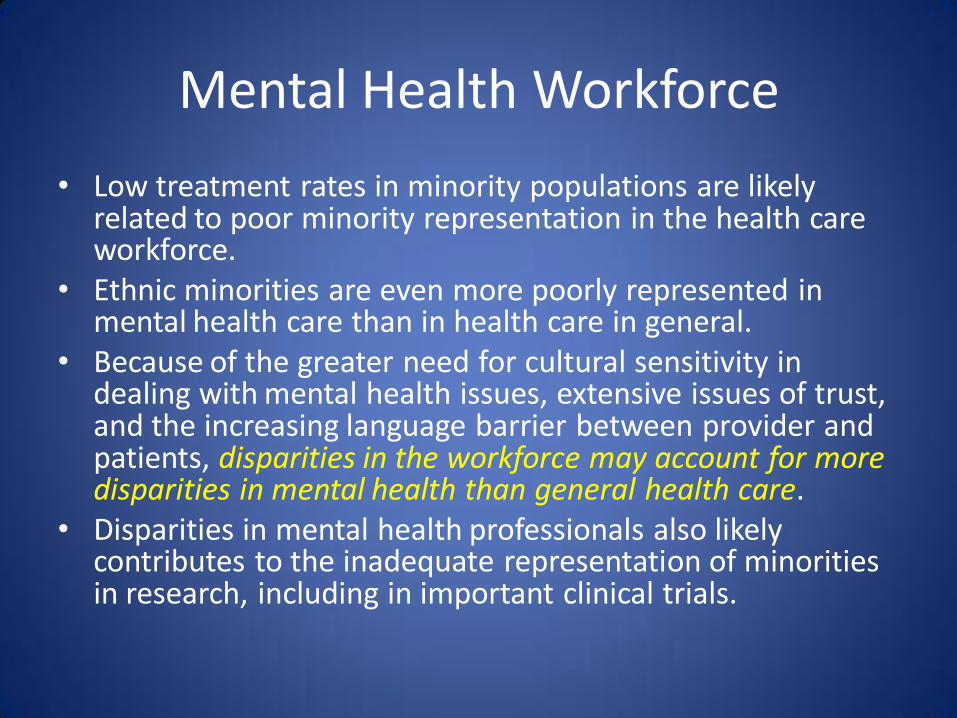
Mental Health Workforce
• Low treatment rates in minority populations are likely related to poor minority representation in the health care workforce.
• Ethnic minorities are even more poorly represented in mental health care than in health care in general.
• Because of the greater need for cultural sensitivity in dealing with mental health issues, extensive issues of trust, and the increasing language barrier between provider and patients, disparities in the workforce may account for more disparities in mental health than general health care.
• Disparities in mental health professionals also likely contributes to the inadequate representation of minorities in research, including in important clinical trials.
• Risk of Major Depression Among Breast Cancer Patients
• Preventing Comorbid Mental and Physical Health Disability
• Anxiety and Recurrent Abdominal Pain in Children
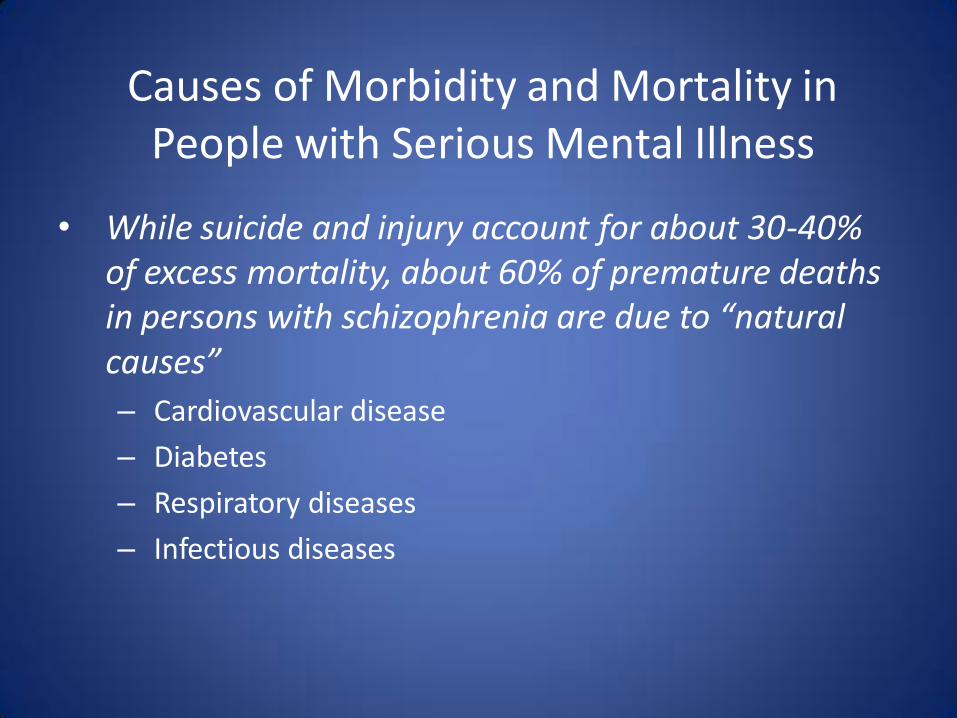
Causes of Morbidity and Mortality in People with Serious Mental Illness
• While suicide and injury account for about 30-40% of excess mortality, about 60% of premature deaths in persons with schizophrenia are due to “natural causes”
– Cardiovascular disease
– Diabetes
– Respiratory diseases
– Infectious diseases
Cardiovascular Disease (CVD) Risk Factors
Modifiable Risk
Factors
Estimated Prevalence and Relative Risk
Schizophrenia Bipolar Disorder
Obesity 45–55%, 1.5-2X 26%
Smoking 50–80%, 2-3X 55%
Diabetes 10–14%, 2X 10%
Hypertension ≥18% 15%
Dyslipidemia Up to 5X
1. Davidson S, et al. Aust N Z J Psychiatry. 2001;35:196-202. 2. Allison DB, et al. J Clin Psychiatry. 1999; 60:215-220. 3. Dixon L, et al. J Nerv Ment Dis. 1999;187:496-502. 4. Herran A, et al. Schizophr Res. 2000;41:373-381. 5. MeElroy SL, et al. J Clin Psychiatry. 2002;63:207-213. 6. Ucok A, et al. Psychiatry Clin Neurosci. 2004;58:434-437. 7. Cassidy F, et al. Am J Psychiatry. 1999;156:1417-1420. 8.
Allebeck. Schizophr Bull. 1999;15(1)81-89.
Depressive Disorders and Comorbid Diseases
• Patients with several medical complaints have an increased probability of a coexisting depressive or anxiety disorder
• Patients with depression often have histories of chronic medical conditions such as:
– Cardiovascular disease
– Diabetes mellitus
– Arthritis
– Stroke
– Cancer
Kroenke K. Primary Care Comp J Clin Psych. 2003;5(suppl7):11.
Aina Y. J Am Osteopath Assoc. 2006;106(5 suppl 2):S9.Chapman DP. Prev Chronic Dis. 2005;2(1):A14.
Racial Disparities in Health
100
200
300
400
500
600
700
1950 1960 1970 1980 1990 2000
Dea
th R
ate
s p
er 1
00,0
00 P
op
ula
tion
YEAR
Age-Adjusted Heart Disease Death Rates
for Blacks and Whites, 1950-2000
White
Black
Diabetes Death Rates 1955-1995
12.610.4
8.6
11.7
17.0
24.3 24.4
46.4
0.0
0.5
1.0
1.5
2.0
2.5
3.0
3.5
4.0
4.5
0.0
5.0
10.0
15.0
20.0
25.0
30.0
35.0
40.0
45.0
50.0
1955 1975 1985 1995
Am
In
d/W
Ra
tio
Dea
ths
per
10
0,0
00
Pop
ula
tio
n
Year
White
Am Ind
Am Ind/W Ratio
Source: Indian Health Service; Trends in Indian Health 1998-99
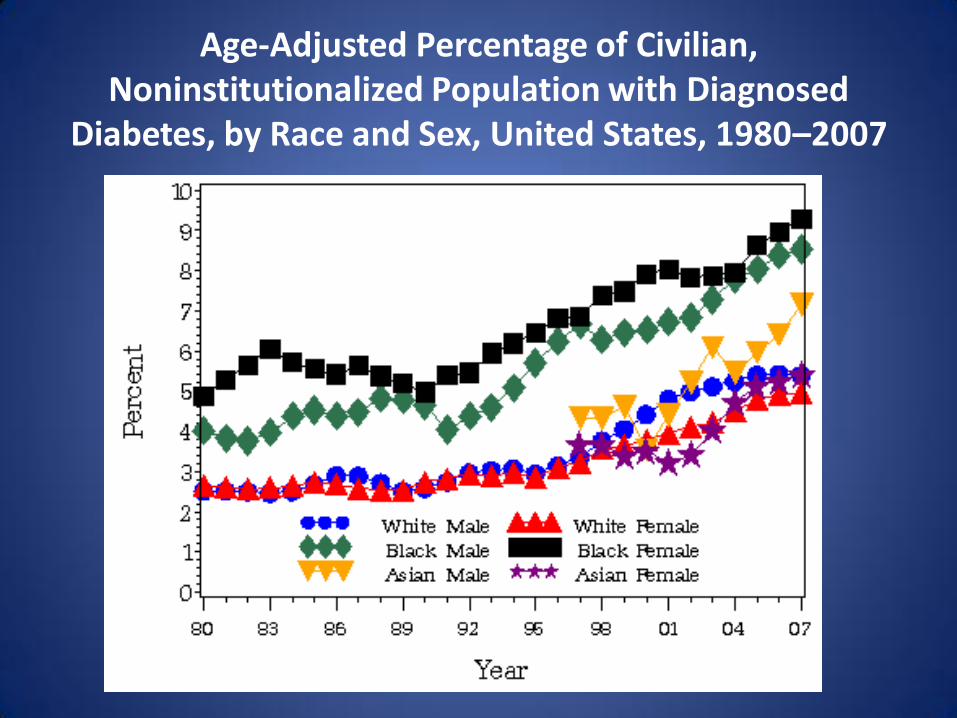
Age-Adjusted Percentage of Civilian, Noninstitutionalized Population with Diagnosed
Diabetes, by Race and Sex, United States, 1980–2007
100
150
200
250
300
1950 1960 1970 1980 1990 2000
Dea
th R
ate
s p
er 1
00,0
00 P
op
ula
tion
YEAR
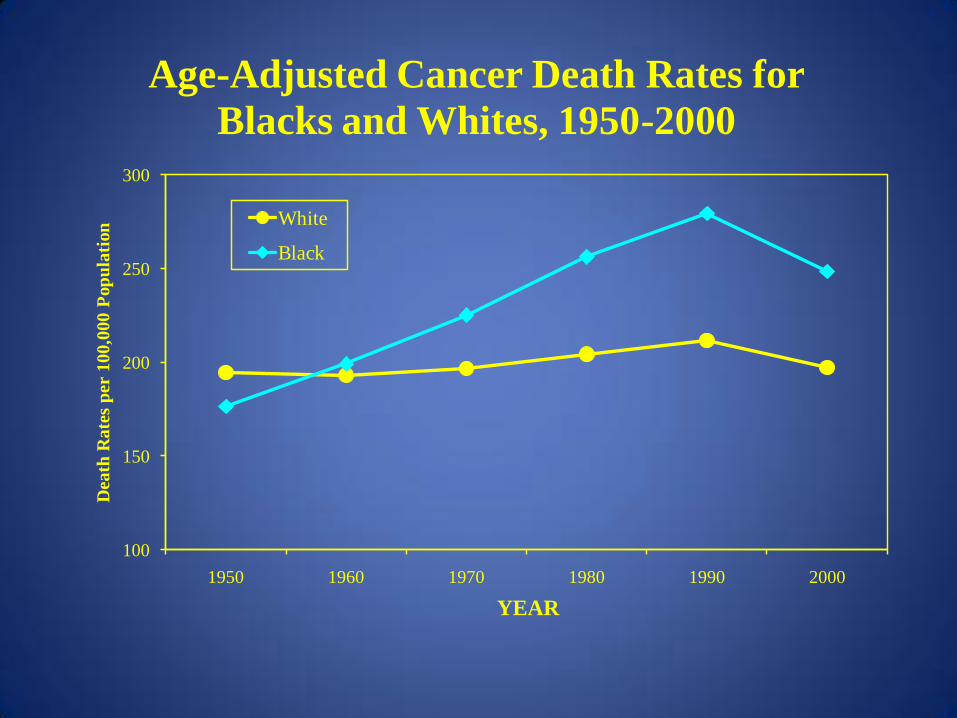
Age-Adjusted Cancer Death Rates for
Blacks and Whites, 1950-2000
White
Black
Heart Disease, Cancer, & StrokeAge-Adjusted Death Rates per 100,000 Persons by Race & Hispanic Origin: U.S.,
2005
211.1 207.8
271.3
141.8
113.3
157.3
183.8 182.6
222.7
123.2110.5
122.8
46.6 44.7
65.2
34.8 38.6 35.7
0
50
100
150
200
250
300
All Races White African American American Indian/Alaska
Native
Asian/Pacific Islander
Hispanic
Ag
e-A
dju
sted
Death
Rate
per
100,0
00
Pers
on
s
Heart Disease
Cancer
Stroke
Moving Forward
Consider the heterogeneity within and between groups
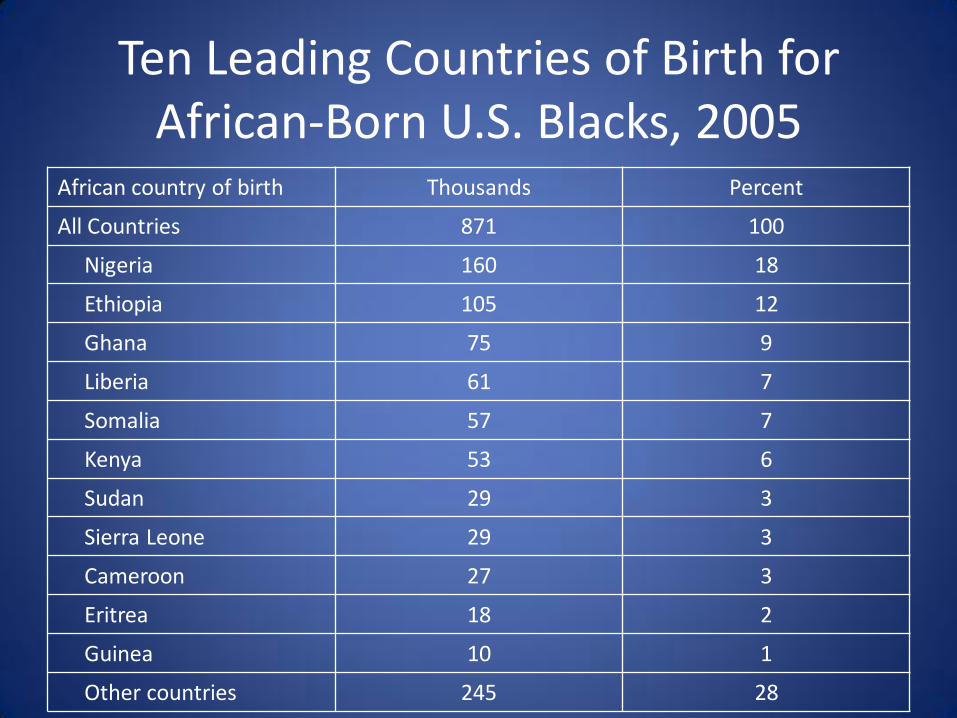
Ten Leading Countries of Birth for African-Born U.S. Blacks, 2005
African country of birth Thousands Percent
All Countries 871 100
Nigeria 160 18
Ethiopia 105 12
Ghana 75 9
Liberia 61 7
Somalia 57 7
Kenya 53 6
Sudan 29 3
Sierra Leone 29 3
Cameroon 27 3
Eritrea 18 2
Guinea 10 1
Other countries 245 28
Ten Leading Countries of Birth for Caribbean and Latin American-Born US Blacks, 2005
Caribbean/Latin Americancountry of birth
Thousands Percent
All Countries 1,876 100
Jamaica 568 30
Haiti 478 25
Trinidad and Tobago 167 9
Guyana 128 7
Dominican Republic 73 4
Barbados 49 3
Panama 45 2
Mexico 40 2
Bahamas 28 2
Belize 27 1
Other countries 274 15
1
1.25
1.5
1.75
2
2.25
1986 1989 1994 2002
Nu
mb
er o
f D
ep
ress
ive
Sym
pto
ms
Waves
Four-class Model
Increasers (N=260)
Decreasers (N=584)
High symptoms (N=187)
Low symptoms (N=2,462)
Lincoln, K. D. & Takeuchi, D.T. (in press). Social Biology
37.447.3*
40.328.8
62.652.7
59.771.2
0
10
20
30
40
50
60
70
80
90
100
Increasers Decreasers High Symptoms
Low Symptoms
Latent Class by Race
White
African American
10.71 47.3*9.64
11.96
10.7 10.9*
9.6*
12.0
0
5
10
15
20
Increasers Decreasers High Symptoms Low Symptoms
Latent Class by Socioeconomic Status
Income
Education
Segregation and Disparities
Segregation: Distinctive for Blacks
• Blacks are more segregated than any other racial or ethnic group in the U.S.
• Segregation varies by income for Latinos and Asians, but is high at all levels of income for Blacks.
• Wealthiest Blacks (>$50K) are more segregated than the poorest Latinos and Asians (<$15,000).
• Middle class Blacks live in poorer areas than Whites of similar SES and poor Whites live in better areas than poor Blacks.
• Blacks show a higher preference for residing in integrated areas than any other group.
Source: Massey 2004
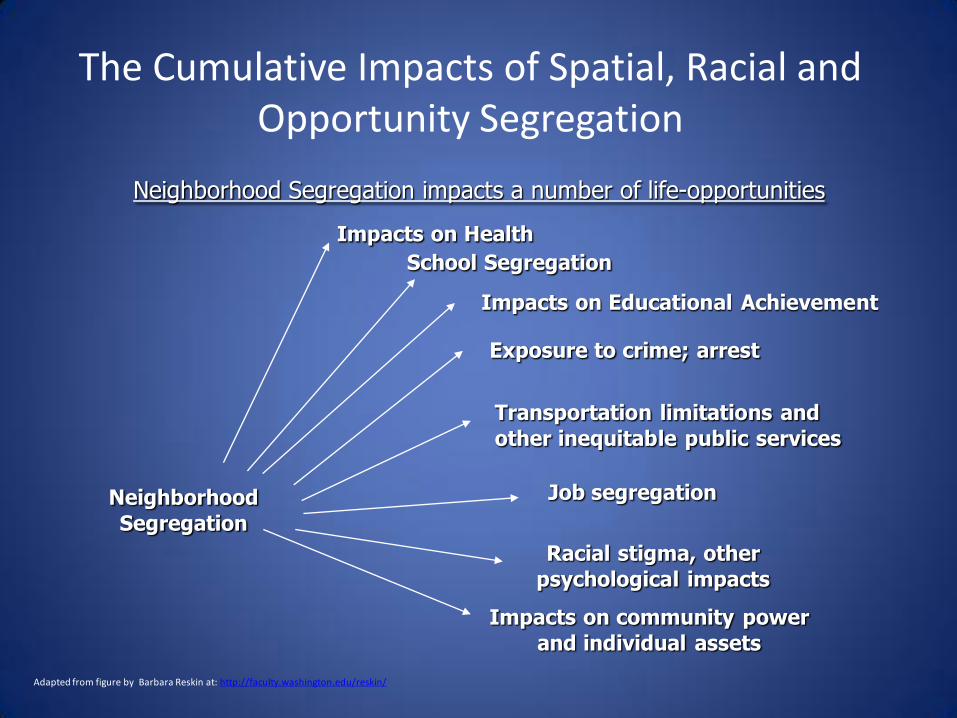
The Cumulative Impacts of Spatial, Racial and Opportunity Segregation
Neighborhood
Segregation
School Segregation
Racial stigma, other
psychological impacts
Job segregation
Impacts on community power
and individual assets
Impacts on Educational Achievement
Exposure to crime; arrest
Transportation limitations and
other inequitable public services
Adapted from figure by Barbara Reskin at: http://faculty.washington.edu/reskin/
Neighborhood Segregation impacts a number of life-opportunities
Proportion of Black & Latino Children in Poorer Neighborhoods Compared to Worst Off White Children
76%
86%
57%
69.074.0
44.0
0
10
20
30
40
50
60
7080
90
100
All Metro Areas 5 Metro Areas High Segr. 5 Metro Areas Low Segr.
Per
cen
tage
Neighborhood
Black
Latino
Policy Implications
• Geographic location determines exposure to risk factors and resources that affect health.
• Where we live, learn, work, play and worship determine our opportunities and chances for being healthy.
Redefining Health PolicyHealth Policies should include all sectors of society
that influence mental health, including:
• Housing Policy
• Employment Policies
• Community Development Policies
• Income Support Policies
• Transportation Policies
• Environmental Policies
Neighborhood Renewal and Health
• A 10-year follow-up study of residents in 5 neighborhood types in Norway found that changes in neighborhood quality were associated with improved health.
• The neighborhood improvements: a new public school, playground extensions, a new shopping center with restaurants and a cinema, a subway line extension into the neighborhood, a new sports arena & park, and organized sports activities for adolescents.
• Residents of the area that had experienced these dramatic improvements in its social environment reported improved mental health 10 years later
• This effect was not explained by selective migration
Dalgard and Tambs 1997
Neighborhood Renewal and Health
• Neighborhood improvement in a poorly functioning area in England was linked to improved health and social interaction.
• Improvements: housing was refurbished (made safe & sheltered from strangers), traffic regulations improved, improved lighting & strengthening of windows, enclosed gardens for apartments, closed alleyways, and landscaping. Residents involved in planning process.
• One year later:
– Levels of optimism, belief in the future, identification with their neighborhood, trust in other neighbors, and contactbetween the neighbors had all increased.
– Symptoms of anxiety and depression had declined.
Halpern, 1995
Neighborhood Change and Health
• The Moving to Opportunity Program randomized families with children in high poverty neighborhoods to move to less poor neighborhoods.
• It found, three years later, that there were improvements in the mental health of both parents and sons who moved to the low-poverty neighborhoods.
Leventhal and Brooks-Gunn, 2003
Income Change and Mental Health
• A natural experiment assessed the impact of an income supplement on the mental health of American Indian children.
• It found that increased family income (because of the opening of a casino) was associated with declining rates of deviant and aggressive behavior.
Costello et al. 2003
Social Context
• Neighborhood
• Built environment
• Physical structures
• Material resources
• Shapes and reflect relationships among individual inhabitants, social groups and social structures and institutions.
Place harbors the dynamics of power, varies by culture, and