Mental Models and Performance Heterogeneity (Forthcoming in the Strategic Management Journal) Mental Models, Decision Rules, and Performance Heterogeneity Michael Shayne Gary Australian School of Business University of New South Wales SYDNEY NSW 2052 Australia Telephone: +61 2 9385 9726 email: [email protected]Robert E. Wood Melbourne Business School 200 Leicester Street Carlton Victoria 3053 Australia Telephone +61 3 9349 8243 email: [email protected]ABSTRACT This paper focuses on the role of managerial cognition as a source of heterogeneity in firm strategies and performance. We link differences in mental models to differences in decision rules and performance in a management simulation. Our results show more accurate mental models lead to better decision rules and higher performance. We also find that decision makers do not need accurate knowledge of the entire business environment; accurate mental models of the key principles are sufficient to achieve superior performance. A fundamental assumption in much of strategic management is that managers who have a richer understanding about organizational capabilities and the dynamics of industry structure can improve the performance of their firms. Our findings provide empirical evidence supporting this assumption and show that differences in mental models help explain ex ante why managers and firms adopt different strategies and achieve different levels of competitive success. Keywords: mental models, decision rules, cognitive frames, heuristics, knowledge representations, schema
Transcript
Mental Models and Performance Heterogeneity
(Forthcoming in the Strategic Management Journal)
Mental Models, Decision Rules, and Performance Heterogeneity
Michael Shayne Gary Australian School of Business
University of New South Wales SYDNEY NSW 2052 Australia
Tripsas & Gavetti, 2000; Walsh, 1995). Much of the strategy research examining the content
of mental models has focused on how managers perceive and categorize information about
their organization or competitive environment (Hodgkinson & Johnson, 1994; Jackson &
Dutton, 1988; Porac et al., 1995; Porac et al., 1989; Reger & Huff, 1993). In contrast, there
has been very little research investigating decision makers’ mental models of the causal
relationships in business environments and how these affect strategic choices. Recent
research in psychology provides strong evidence that beliefs about cause-effect relationships
are particularly important in supporting strategic decision making since they serve as the
Mental Models and Performance Heterogeneity
4
basis on which decision makers infer the consequences of their actions and guide intervention
efforts to reach desired targets (Rehder, 2003). For example, solving complex strategic
problems requires managers to generate options about where and how to intervene in their
business by forming expectations about the possible outcomes resulting from their decisions.
This process of developing strategic prescriptions relies heavily on the inferred causal
relationships that make up managers’ mental models about their business environment.
Therefore, it is crucial to examine decision makers’ inferences about chains of cause-effect
relationships linking specific decision options to outcomes in order to understand how
managers make strategic decisions (Levitt & March, 1988).
Prior research on managerial cognition has also established that different managers
often perceive the same objective business environment differently (Barr et al., 1992;
Bourgeois, 1985; Tripsas & Gavetti, 2000). Despite strong evidence of heterogeneity in
mental models, there has been very little strategy research investigating the importance of
accurate mental models on performance outcomes. This is surprising since a fundamental
assumption in much of strategic management is that successful firms and managers
purposefully adopt strategies–based on accurate mental models–that match or ‘fit’ the
competitive environment. Most strategy scholars believe that managers who have a richer
understanding of the dynamics of industry structure and organizational capabilities can take
advantage of this knowledge to improve firm performance. Strategy courses at business
schools are built on the basic idea that managers can advance their understanding (i.e.,
mental models) of the business environment through rigorous, disciplined analysis, and that
these richer mental models will facilitate the development of winning strategies. “The worth
of a strategy depends on management’s ability to… identify and to evaluate correctly the
[business] environment” (Hatten & Schendel, 1975: 196). However, we have little systematic
evidence that this is true (Henderson, 2000).
Mental Models and Performance Heterogeneity
5
An alternative explanation is that the success or failure of individual firms is
primarily driven by initial conditions, random shocks, and luck (Stinchcombe, 2000). This
could be the case if resource positions are randomly distributed among firms during founding
and any initial advantages are maintained through unyielding path dependence. This
alternative might also be the dominant explanation for performance heterogeneity if
managers are so completely overwhelmed by the complexity, uncertainty, and dynamism of
the business environment to the point that strategic choices are equivalent to gambles at the
race track (Stinchcombe, 2000). In other words, performance differences among firms may
simply be a function of the realized competitive environment favoring some resource
positions and some strategies above others.
There is some evidence from fieldwork as well as limited empirical support that
accuracy of managerial mental models plays an important role in firm success (Barr et al.,
1992; Bourgeois, 1985; Tripsas & Gavetti, 2000). In addition, recent simulation-based work
suggests that more accurate mental models about the causal relationships linking actions to
outcomes translate into better performance (Denrell et al., 2004) and may play a central role
in the discovery of superior strategic positions (Gavetti & Levinthal, 2000; Gavetti,
Levinthal, & Rivkin, 2005). On the other hand, Weick speculates that “Accuracy [in mental
models] is nice, but not necessary” (Weick, 1990: 6). Similarly, Sutcliffe (1994) suggests
that inaccurate perceptions may lead to positive consequences for organizations if they
enable managers to overcome inertial tendencies and propel them to pursue goals that might
look unattainable when the environment is assessed accurately. In this line of reasoning,
having an accurate mental model may be less important than having some mental map that
brings order to the world and enables incremental and adaptive action.
Overall, prior strategy research suggests that accurate mental models are important,
but no prior studies have empirically tested the value of mental model accuracy about the
Mental Models and Performance Heterogeneity
6
causal relationships of the business environment. Given the importance of this issue for
strategic management, we need to improve our understanding about whether more accurate
mental models enable managers ex ante to identify and interpret signals from their business
environment that lead to superior strategic choices and performance outcomes.
We investigate this issue directly in this paper. Based on the research streams
discussed above, we expect variation in the accuracy of decision makers’ mental models as a
result of their own individual, unique experiences and due to differences in their learning
strategies and differing abilities to draw inferences. Within this diversity, we expect decision
makers with more accurate mental models to make better decisions and to achieve higher
performance outcomes. Of course, through good luck, vastly deficient and incorrect mental
models may result in correct action in some circumstances. However, on average, we expect
more accurate mental models will help direct managerial attention to the most relevant
information and serve as a better guide for strategic decisions.
Managers with accurate beliefs about interdependencies between their firm,
competitors, and the market have a better understanding of the market drivers, the likely
effects of different actions, and the resources needed to ensure success in different strategic
positions. They will better understand competitive reactions and time delays and therefore are
less likely to abandon effective long run strategies prematurely or to remain committed to
failing courses of action. In summary, decision makers with more accurate mental models
have a more comprehensive understanding of the fit between different strategic options and
the business environment, formulate more effective strategies, and better understand market
information and other sources of feedback compared to decision makers with less accurate
mental models.
H1: More accurate mental models of causal relationships in the business environment result in higher performance outcomes.
Mental Models and Performance Heterogeneity
7
As simplifications of reality, mental models will always be incomplete and inaccurate.
In the complex organizational environments in which managers operate, making accurate
causal inferences is often very difficult. Consequently, decision makers are unlikely to
construct completely accurate mental models in even a moderately complex environment.
Prior research on judgment and decision-making shows that complexity–including time
delays, nonlinearities, feedback effects, and stock accumulation processes–impairs the
formation of accurate mental models and undermines performance (Moxnes, 1998; Paich &
Sterman, 1993; Sengupta & Abdel-Hamid, 1993; Sterman, 1989a). Although greater
complexity degrades the fidelity of mental models, recent simulation-based research suggests
mental model accuracy becomes more important as complexity increases (Gavetti &
Levinthal, 2000). Accurate mental models, the rationale goes, help managers identify
promising regions of the competitive landscape. Other simulation-based strategy work
suggests mental model accuracy may not be especially helpful in very simple or very
complex contexts, but is instead most beneficial in moderately complex situations (Rivkin,
2001). Very simple decision environments can be effectively navigated without accurate
mental models, while highly complex environments impair the development of highly
accurate mental models.
Overall, prior research suggests that the benefits of mental model accuracy increase
as decision environment complexity increases, but that very high levels of complexity may
degrade mental models so much that they are not helpful in making strategic choices. Based
on these arguments, we expect the benefits of mental model accuracy will be moderated by
complexity of the decision environment. Decision makers with low quality, inaccurate
mental models may still achieve relatively high performance outcomes in low complexity
decision environments. Low complexity means there are fewer determinants to consider,
fewer options, and the effects of decisions are more immediate and more transparent. In
Mental Models and Performance Heterogeneity
8
these simple environments, accurate mental models may offer little competitive advantage as
all managers can quickly understand feedback and adapt strategies appropriately from the
limited options available. As environments become more complex, an accurate
understanding of causal relationships can contribute to the quality of choices during the
formulation, implementation and evaluation of strategies. More accurate mental models help
managers identify promising regions of the competitive landscape and drastically reduce the
feasible strategy choices, thus affording a significant competitive advantage over managers
with less accurate mental models. We expect mental model accuracy will be more important
for achieving high performance outcomes in more complex decision environments.
H2: More accurate mental models of the causal relationships in the business environment have a greater positive effect on performance in more complex environments.
The discussion so far has focused on the benefits of accurate mental models of the
complete business environment. However, recent simulation-based research suggests that
even partial knowledge of the business environment may dramatically improve performance
by playing an important role in seeding and constraining the process of experiential learning
(Denrell et al., 2004; Gavetti & Levinthal, 2000). In search processes, even a small amount of
knowledge may provide significant performance advantages by cutting down the search
space and thereby reducing an otherwise lengthy random search process. This raises the
question about whether accurate mental models of the entire business environment are
required or if partial knowledge results in superior performance outcomes.
Research findings on expertise provide some guidance about the performance benefits
of partial knowledge. Specifically, research shows that experts have deeper, structural-level
mental representations of problems, while novices typically represent problems based on
representations of the deep structure of a problem domain are composed of ‘chunks’ of
Mental Models and Performance Heterogeneity
9
knowledge about the important key principles at work (Chase & Simon, 1973; Gentner,
Loewenstein, & Thompson, 2003). Mental models of the key principles enable experts to
recognize common elements and patterns across a class of problems, to quickly generate and
evaluate relevant options, and to systematically outperform novices whose mental models
typically focus on inconsequential details rather than the deep structure. Recent strategy work
has started to explore the related issue of how experienced senior executives–with rich mental
models of the deep structure or architecture of a strategic problem–often draw on solutions
from past experience dealing with analogous situations (Gavetti et al., 2005).
Based on these strands of prior research, we expect accurate mental models of key
principles of the deep structure will result in superior performance outcomes.
H3: More accurate mental models of key principles of the deep structure of the business environment lead to higher performance outcomes.
METHODS
We use an interactive, computer-based simulation of managing new product launch
and lifecycle dynamics as the experimental task in our study. MBA students with no prior
experience on the management simulation were invited to participate. The 63 participants
included 47 male and 16 female volunteers, with an average age of 30 and seven years of
work experience. Participants were randomly assigned to either the low complexity (n = 31)
or the high complexity (n = 32) group and remained in the same group throughout the
experiment. Participants were paid for taking part in the experiment. In addition, a small
donation was paid to a nominated charity for the 43 students who also participated in the
delayed-testing stage fifteen weeks later.
Task and Procedures
The management simulation has been utilized in previous research and captures many
well-established features of product lifecycle management (Paich & Sterman, 1993). The
Mental Models and Performance Heterogeneity
10
core dynamic of the simulation is the process through which potential customers become
aware of and choose to adopt the product. The causal relationships driving this market
diffusion process are well understood (Bass, 1969; Kalish & Lilien, 1986; Mahajan, Muller,
& Bass, 1995; Roberts & Urban, 1988). Customer adoption increases the installed customer
base. The installed customer base generates word of mouth resulting in additional sales, but
also depleting the pool of potential customers. The customer base follows an S-shaped
growth pattern where sales rise exponentially, then peak and decline to the rate of
replacement purchases as the market saturates (Paich & Sterman, 1993).
Participants take on the role of Chief Executive Officer of the firm and make quarterly
decisions, such as price and production capacity expansion, with the goal of maximizing
cumulative profit from the sales of their product over a forty-quarter simulation. The business
environment changes as a consequence of participants’ decisions and includes a large number
of interdependent variables with multiple feedback effects, time delays, nonlinear
relationships, and stock accumulations (Paich & Sterman, 1993; Sterman, 1989a). These
features of the management simulation also characterize the sort of complex environments
that senior managers typically operate in while making strategic decisions.
Participants completed three phases: a learning phase, an immediate testing phase,
and a delayed testing phase. The learning phase and immediate testing phases were
completed in an initial laboratory session in groups of 15 to 20. Each participant was seated
at a separate computer and could not see other screens. The learning phase included three
blocks of 40 decision trials–120 decision trials in total–for participants to learn about and
become familiar with the simulation. After each decision trial, participants received outcome
feedback on their results for that trial plus their cumulative performance up to that point. This
feedback was presented in both table and graphical format in order to control for the effects
of feedback format (Atkins, Wood, & Rutgers, 2002). After each trial block of 40 quarters,
Mental Models and Performance Heterogeneity
11
the simulation was reset to the same initial values and the next trial block began. The
simulated outcomes could be, and were, very different from one trial block to the next since
different decisions result in different simulated responses.
Following the learning phase, participants were asked to complete a series of
questionnaires to assess their self-efficacy and mental models of the task. After completing
the questionnaires, participants proceeded to the immediate testing phase, in which they
completed three more blocks of 40 decision trials on the same version of the task. Participants
completed each phase at their own pace. On average, the initial experimental session took
three hours. Upon completing the immediate testing phase, participants left the laboratory and
were paid for their participation in the study. The delayed testing phase was completed fifteen
weeks later, and involved logging into the simulation from remote locations and completing
three more blocks of 40 trials on the exact same version of the task. This phase was used to
test the stability of the relationships proposed in all of our hypotheses.
Task Complexity
There were two levels of task complexity associated with either a monopoly market or
a competitive market. In the low complexity version of the task, there were two decision
variables−price and target capacity−and 19 interdependent variables in the causal structure.
There was no competitor in the low complexity version of the task. There were three decision
variables−price, target capacity, and marketing spend−and over 30 interdependent variables
in the causal structure of the high complexity version of the task. This included causal
relationships for a competitor in the market. While it is difficult to characterize any decision
as inherently strategic, the set of decisions required each quarter involve substantial capital,
are made difficult by the complexity of the business environment, and have considerable
potential to influence firm performance.
Mental Models and Performance Heterogeneity
12
Measures
Performance. Performance was measured for each of the nine trial blocks by the
cumulative profit at the end of the last decision trial for each block. The nine trial blocks of
performance included three blocks completed during the learning phase, three blocks
completed in the immediate testing phase, and three blocks completed in the delayed testing
phase. The potential achievable cumulative profit was different in the high and low
complexity task conditions, and therefore we divided the raw performance scores by
benchmarks for the high and low conditions. The performance benchmarks were found
through a modified Powell search optimization (Powell, 1998). Marketing Spend was fixed
at 5% of revenue throughout the simulation. Capacity was determined by a perfect foresight
rule in which capacity always matched demand. Finally, the single price level that optimized
profits over the entire simulation was computed. Note that this pricing rule is very simplistic
since price does not change throughout the simulation in response to changing capacity,
backlog, order demand, or any other variable in the decision environment. Therefore, the
calculated cumulative profit benchmark is not a global optimum for the task, but is instead a
consistently calculated benchmark enabling comparison across the two complexity groups1
Mental Model Accuracy. We evaluated several methods for assessing the accuracy of
decision makers’ knowledge structures. We considered using the repertory grid technique
(Reger & Huff, 1993), but this approach was not feasible given the number of variables in the
management simulation. Over 900 response cells would have been necessary for the high
complexity version of the task. We also considered facilitated interviews to develop
individual causal loop diagrams (Huff, 1990; Sterman, 2000), but this approach was not
practical for use in a large-sample experiment. Other scholars have used content analysis of
written narratives to infer managerial mental models (Osborne, Stubbart, & Ramaprasad,
.
1 We also analyzed alternative benchmarks including a behavioral rule previously used as a benchmark on the high complexity version of this task (Paich & Sterman, 1993). All of our results were robust to these alternative benchmarks.
Mental Models and Performance Heterogeneity
13
2001), but this approach did not leverage the advantage of having direct access to decision
makers in our study. We also evaluated the cognitive mapping approach in which individual
decision makers draw their own cognitive maps directly (Axelrod, 1976; Hodgkinson et al.,
1999). After a pilot test, this measurement approach was ruled out since the participants in
our study were not familiar with the cognitive mapping method. There is also evidence that
actors often have poor insight into their own decision making processes and interpretive
approaches may simply capture espoused theories rather than ‘theories in use’ (Argyris &
Schon, 1974). Instead, we devised a knowledge test using a sample of questions about the
causal relationships in the management simulation for which the answers were known.
The measurement of knowledge using standardized tests is a well-developed
subdiscipline of education and psychology. An individual’s knowledge is measured by
calculating the proportion of questions answered correctly (Borgatti & Carboni, 2007). A key
advantage of our laboratory experiment is that we know the correct answers to the knowledge
questions about causal relationships in the management simulation and can therefore
distinguish between correct and incorrect answers. This avoids a tricky and difficult problem
of measuring mental model accuracy in field settings.
One set of questions tested participants’ inferences about bivariate causal
relationships between pairs of variables from the management simulation. The questions
covered the exhaustive set of actual relationships in each of the complexity conditions along
with several items for which no relationship existed in the decision environment. Participants
answered 30 items on the relationships between variables that were common to both
complexity conditions. Participants in the high complexity condition answered a further 24
items relating to the additional variables and relationships in the high complexity condition.
For each question, participants drew a directed influence arrow between the two variables
and indicated the polarity−sign of the slope−of the relationship if they believed a causal
Mental Models and Performance Heterogeneity
14
relationship existed (Sterman, 2000). In order to complete this first set of knowledge
questions, participants were provided with a complete list of variables in the management
simulation. Appendix A provides a segment of the instructions along with the first three
items of this first set of questions. Figure 1 shows a diagram of the full set of causal
relationships in the low complexity decision environment.
----------------------------------- Insert Figure 1 Here
----------------------------------- A second set of questions tested participants’ knowledge of the relationships between
a small set of simulation variables and their ability to infer the dynamics of this set of
variables. Each question presented a graph of one or two variables over time from the
management simulation, and subjects chose from a multiple choice of answers for the
evolution of another variable in the management simulation. To answer correctly,
participants had to draw on their experience with the management simulation and their
knowledge of the causal relationships between variables in order to determine how the
dynamic behavior of the first variable or variables influences the dynamic behavior of
another variable. This second set of questions captures whether participants’ mental models
accurately simulate the interaction of small sets of variables to predict subsequent events.
This is an important aspect of mental models since decision makers use their mental models
to predict and understand the environment by ‘running’ their models mentally (Norman,
1983). Appendix B provides a segment of the instructions along with one example from this
set of questions. The full knowledge test is available upon request from the authors.
Each item on the knowledge test was scored as correct or incorrect and each
participant’s mental model accuracy was the percentage of items on the knowledge test
answered correctly. The possible scores range from 0-1, where a score of 1 indicates perfect
knowledge of the tested aspects of causal structure and dynamic behavior of small sets of
Mental Models and Performance Heterogeneity
15
variables in the decision environment. It is important to note that achieving a high score on
the knowledge test is no guarantee of success in the complex decision environment.
Understanding bivariate causal relationships and correctly inferring the dynamics of small
sets of interdependent variables supports the development of effective decision making in the
complex system, but the application of this knowledge remains a difficult task.
Mental Model Accuracy of the Deep Structure. A subset of the causal relationships
were identified from prior research as the key principles of deep structure for the new
product launch and lifecycle simulation. The multidisciplinary literature on the diffusion of
new products is extensive (for starting points see Mahajan, Muller, & Bass, 1990; Parker,
1994; Rogers, 1995) and shows that many new products follow roughly logistic or S-shaped
growth trajectories. Much of the research has focused on identifying the causal relationships
that underpin this S-shaped pattern of behavior. For example, prior research shows that an
important factor driving the growth phase in new product diffusion is social contagion
through word of mouth. As early purchasers of a new product tell their friends, work
associates, and families about the new product, some of these potential customers are
persuaded to buy it for themselves. Sales to potential customers increase the installed
customer base and further reinforce the word of mouth effect. Another source of awareness
and adoption identified in the literature is the level of marketing spend on advertising,
promotion, public relations, and direct sales efforts. The combined effects of word of mouth
and marketing spend drive the adoption rate from the pool of potential customers to the
installed customer base. However, these growth processes cannot continue forever. Once the
population of potential customers has been depleted, sales fall to the replacement level of
purchases driven by the average useful lifetime of the product.
This set of causal relationships underpinning the market diffusion process is well-
established as the key principles of deep structure underlying product lifecycle dynamics
1995; Roberts & Urban, 1988). We expect that accurate knowledge about these causal
relationships will lead to a richer understanding about the dynamics of the market. In
particular, decision makers with knowledge about these causal relationships, including an
accurate understanding about the dynamics over time of this small set of interdependent
variables, will realize that the customer base follows an S-shaped growth pattern where sales
rise exponentially, peak, and then decline to the rate of replacement purchases as the market
saturates. We expect this knowledge will be helpful in guiding decision making about
capacity investments, prices, and marketing spending to avoid–or at least mitigate–the boom
and bust dynamics common in new product introductions (Gary, Dosi, & Lovallo, 2008;
Paich & Sterman, 1993). In contrast, decision makers who lack accurate knowledge about the
market diffusion process will find it difficult to match capacity and demand over the product
lifecycle and performance will suffer as a result.
A total of eleven items from the knowledge test, involving questions about inferred
causal relationships and dynamic behavior of small sets of variables, assess participants’
knowledge of this deep structure. Appendix C provides seven example items for this measure
of deep structure accuracy. The remaining four items of the deep structure accuracy measure
are graphical scenario questions covering a subset of the same relationships. The example
graphical scenario question in Appendix B is one of those items. Each participant’s mental
model accuracy of the deep structure was the percentage of these eleven items answered
correctly. The possible scores range from 0-1, where a score of 1 indicates perfect knowledge
of the tested aspects of the key principles of deep structure.
Control Variables
Cognitive Ability. One potentially important individual difference among decision
makers in our study is cognitive ability. Cognitive abilities have been shown to play a central
Mental Models and Performance Heterogeneity
17
role in problem solving, reasoning, and learning (Anderson, 1990). Participants’ scores on
the Graduate Management Aptitude Test (GMAT) were used as a proxy for general cognitive
ability. The GMAT is widely used to assess general cognitive ability of applicants to MBA
programs around the world. In the admissions process, GMAT scores are commonly used as
a selection criterion and are thought to reflect the achievement and learning potential of
applicants in the domain of management.
Perceived self-efficacy is an established motivational predictor of performance on
complex tasks and the constituent processes−such as search, information processing and
memory processes−that can affect learning (Bandura, 1997). Also, complexity levels have
been shown to influence the motivational reactions to tasks (Wood, Bandura, & Bailey,
1990). Therefore, self-efficacy was incorporated to control for differences in performance
attributable to motivational differences. Perceived self-efficacy was measured with a 10-item
scale, available from the authors, covering a broad range of activities involved in managing
the simulated firm. The format followed the approach recommended by Bandura (1997),
which has been validated in numerous empirical studies. For each item, participants first
recorded whether or not they understood what was required to manage the activity−yes or no
−and then recorded their confidence in their capabilities on a 10-point scale where 1 = “very
low confidence” and 10 = “very high confidence.” The perceived self-efficacy score was
computed by taking the mean confidence level across all ten items.
Mental Model Complexity. A number of prior studies have used mental model
complexity as an indication of the richness and accuracy of managers’ mental models. The
basic idea is that more complex knowledge structures are necessary for coping with the
multidimensional challenges of complex organizational realities, and enable managers to
respond appropriately in complex environments. The complexity of top managers’ mental
models has also been positively linked to competitive success (McNamara, Luce, &
Mental Models and Performance Heterogeneity
18
Tompson, 2002). Therefore, mental model complexity was included as a control variable in
order to distinguish between the effects of complex mental models and accurate mental
models.
The complexity of decision makers’ mental models was measured by counting the
number of inferred causal relationships in the set of knowledge questions assessing beliefs
about bivariate causal relationships. Reported perceived relationships were included in the
count whether or not these causal relationships were correct. The potential number of
perceived bivariate relationships was different in the high and low complexity task
conditions, and therefore we divided the raw counts by the correct number of causal
relationships in each condition. The result assesses the complexity of decision makers’
mental models relative to the complexity of the perfectly correct mental model. Possible
scores range from 0 to values greater than 1, where a score less than 1 indicates less
complexity than in the correct mental model and a score greater than 1 indicates more
complexity than the correct mental model due to inaccurate beliefs.
Data Analyses
The relationships proposed in Hypotheses 1-3 were tested by estimating both
Ordinary Least Squares (OLS) regressions and linear mixed models with repeated measures.
In the OLS models, the dependent variable was performance at the end of either trial block
six−the final trial block of the immediate testing phase−or trial block nine−the final trial
block of the delayed testing phase. In the linear mixed models with repeated measures,
performance for trial blocks 4-9 in the immediate and delayed testing phases were all
dependent variables, increasing the statistical power and reducing bias in the estimates. Task
complexity was a between-subjects fixed effect. A first-order, autoregressive correlation
structure was specified for the repeated measures of performance across trial blocks. Trial
Block was also included as a fixed effect. In addition, a random intercept was included for
Mental Models and Performance Heterogeneity
19
each participant. Linear mixed models provide the best linear unbiased estimates for
unbalanced, correlated repeated measures data (Verbeke & Molenberghs, 2000).
RESULTS
Table 1 provides the correlations, means, and standard deviations for all study
variables. Task complexity was coded such that 0 = low complexity and 1 = high complexity.
Task complexity is negatively correlated with mental model accuracy and performance across
all trial blocks. Mental model accuracy is positively correlated with performance across all
trial blocks. In addition, mental model accuracy ranges from 0.32–0.81 with mean 0.56 and
standard deviation 0.11, demonstrating substantial variance. Decision makers’ in the low
complexity condition have significantly more accurate mental models [t(61) = 2.73, p < 0.01]
than the high complexity group. As expected, complexity impairs the development of
accurate mental models.
----------------------------------- Insert Table 1 Here
-----------------------------------
Figure 2 illustrates mean performance and 95 percent confidence intervals across all
nine trial blocks for the high and low complexity groups. The learning phase includes trial
blocks 1-3, the immediate testing phase includes trial blocks 4-6, and the delayed testing
phase includes trial blocks 7–9. Performance in both complexity conditions improves
considerably from trial block 1 to trial block 3, but plateaus relatively quickly in the
experiment. Performance falls slightly in the delayed testing phase but the difference is not
statistically significant. The 95 percent confidence intervals show there is considerable
variation in performance across decision makers in the same version of the management
simulation task.
----------------------------------- Insert Figure 2 Here
-----------------------------------
Mental Models and Performance Heterogeneity
20
Tests of Hypotheses
Models 1-3 of Table 2 test the impact of mental model accuracy of the business
environment on performance proposed in Hypothesis 1. Model 1 provides the OLS estimates
using performance on trial block six, the last immediate testing phase trial block, as the
dependent variable. In support of Hypothesis 1, mental model accuracy is a significant
predictor of performance (b = 1.039, p < 0.05) after controlling for task complexity, general
cognitive ability, and self-efficacy. To help interpret the effect size, the standardized
coefficient for mental model accuracy is equal to 0.30. If we increase mental model accuracy
by one standard deviation from its mean–assuming all other variables remain at their mean
levels–performance increases by 22 percent. Task complexity has a significant and negative
main effect on performance (b = -0.434, p < 0.001), indicating that participants in the high
complexity condition achieved significantly lower performance outcomes than participants in
the low complexity group. General cognitive ability, self-efficacy, and mental model
complexity were not significant predictors of performance.
Model 2 provides the OLS estimates using performance on trial block nine, the last
delayed testing phase trial block, as the dependent variable. The results are the same as in
Model 1. In fact, the effects of mental model accuracy on performance (b = 1.668, p < 0.05)
are even stronger in the delayed testing phase than in the immediate testing phase. The
standardized coefficient for mental model accuracy is 0.41, and increasing mental model
accuracy by one standard deviation increases performance by 40 percent. This indicates
decision makers’ mental models of the management simulation remained stable fifteen weeks
after the initial laboratory session and continued to impact performance. Model 3 provides
linear mixed model estimates using repeated measures for performance on trial blocks 4–9,
all of the immediate and delayed testing phases, increasing the number of observations to
315. Again, the results are the same as in Models 1 and 2 with a significant, positive
Mental Models and Performance Heterogeneity
21
relationship between mental model accuracy and performance (b = 0.988, p < 0.01) and a
negative main effect of task complexity on performance (b = -0.438, p < 0.001).2
Model 4 includes the interaction of task complexity and mental model accuracy to test
Hypothesis 2. The interaction term is not significant, indicating that more accurate mental
models do not have a greater positive effect on performance in environments that are more
complex. The data do not support Hypothesis 2. Overall, the results of Models 1–4 of
Table 2
support Hypothesis 1 and provide empirical evidence that more accurate mental models of
the business environment lead to higher performance outcomes.
-------------------------------------- Insert Table 2 Here
--------------------------------------
Models 1–3 of Table 3 test the impact of accurate mental models of the deep structure
on performance proposed in Hypothesis 3. Model 1 provides the OLS regression estimates
using performance on the sixth trial block as the dependent variable. Deep structure accuracy
has a significant positive impact on performance (b = 0.596, p < 0.05). Decision makers’ do
not need an accurate mental model of the complete business environment, but rather accurate
mental models of key principles of the deep structure. To help interpret the effect size, the
standardized coefficient for deep structure accuracy is equal to 0.23. If we increase deep
structure accuracy by one standard deviation from its mean–assuming all other variables
remain at their mean levels–performance increases by 17 percent. As established previously,
task complexity has a significant negative effect on performance (b = -0.442, p < 0.001).
General cognitive ability and self-efficacy were not significant predictors of performance.
Model 2 provides the OLS estimates using performance on trial block nine as the dependent
2 To simplify the presentation, the fixed effects associated with each trial block and the three variance-covariance components for the random-effect intercept and the autoregressive structure of the repeated measures are not shown in any of our results tables. Trial block is not significant in any of our analyses due to the performance plateau which occurs after the learning phase (refer back to Figure 3). The repeated component of all models is significant, indicating that residual errors are correlated by trial block. In addition, the random subject intercept is also significant in all models, indicating that performance varies between individuals.
Mental Models and Performance Heterogeneity
22
variable. The results are the same as in Model 1 and, as in the previous analysis with mental
model accuracy, the effects of deep structure accuracy on performance (b = 1.178, p < 0.01)
are even stronger in the delayed testing phase than in the immediate testing phase. The
standardized coefficient for deep structure accuracy is equal to 0.39, and increasing deep
structure accuracy by one standard deviation increases performance by 38 percent. Model 3
provides linear mixed model estimates using repeated measures for performance across trial
blocks 4–9. The results are the same as in Models 1 and 2 with a significant and positive
impact of deep structure accuracy on performance (b = 0.555, p < 0.05) and a negative effect
of task complexity on performance (b = -0.446, p < 0.001).
To assess the importance of deep structure knowledge relative to partial knowledge
about any subset of the competitive environment, we tested whether the improvement in R
square when we add Deep Structure Accuracy to the models is significantly better than the
change in R square obtained when randomly chosen partial knowledge variables are added to
the model instead3
Next, we generated 1,000 random samples of eleven knowledge test items–out of 69
items on the high complexity condition and 42 items in the low complexity condition–to
compute 1,000 partial knowledge variables. Eleven items were used to measure Deep
Structure Accuracy, so we kept this consistent when computing random partial knowledge
variables. We ran Model 1 regressions separately for all 1,000 partial knowledge variables
and computed the change in R square for each partial knowledge variable. The mean R
. The unadjusted R square of Model 1 in Table 3 with Intercept, Task
Complexity, Self efficacy, and GMAT included as independent variables and Performance on
the 6th trial block as the dependent variable is .45. When Deep Structure Accuracy is added
to the model, unadjusted R Square increases to 0.49. This change in R square of 0.04 is
significant (p < 0.05).
3 We would like to thank an anonymous reviewer for this helpful suggestion.
Mental Models and Performance Heterogeneity
23
square change across the 1,000 partial knowledge variables was 0.025 (N = 1,000; std dev =
0.022; std error = 0.00068) with a 95 percent confidence interval of [0.024–0.027]. The
change in R square for Deep Structure Accuracy, 0.04, is significantly different from the
mean change in R square for the 1,000 partial knowledge variables (t = -19.98, p< 0.001).
We repeated this analysis again for Model 2 in Table 3. The unadjusted R square of
Model 2 with Intercept, Task Complexity, Self-efficacy, and GMAT included as independent
variables and Performance on the 9th trial block as the dependent variable is 0.39. When
Deep Structure Accuracy is added to the model, unadjusted R Square increases to 0.496. This
change in R square of 0.106 is significant (p < 0.01). In addition, this change in R square for
Deep Structure Accuracy is significantly better (t = -38.40, p< 0.001) than the mean change
in R square across the 1,000 partial knowledge variables. Overall, these results show that
accurate knowledge about key principles of the deep structure leads to superior performance.
------------------------------------------ Insert Table 3 Here
------------------------------------------
Decision Rules and Strategies
To further investigate the mechanisms linking mental models and performance, we
performed supplementary analyses of participants’ decisions. In the face of complexity,
decision makers adopt satisficing rules of thumb and heuristics that are intended to be
consistent with their simplified mental models of the business environment (Cyert & March,
Participants’ pricing decisions involved a markup from unit variable cost, with margin
over cost driven by the ratio of demand to capacity. This markup pricing rule is consistent
with behavioral pricing rules documented in organizations from a wide range of competitive
environments (Cyert & March, 1963). Equation 2 shows the form in which this pricing
decision rule was estimated; where P is price, UVC is unit variable cost, B is Backlog, C is
Capacity, the subscript t is time, and the subscript t-1 is the current time lagged by one
period. We estimated parameters for the intercept b0 and the information weights b1 and b2.
22110 )/log()log()log( ε+++= − tttt CBbUVCbbP (2) The information weights for the capacity and pricing decision rules were estimated
separately for each trial block for each participant using Prais-Winsten regressions to correct
for first-order autocorrelation (Camerer, 1981; Einhorn et al., 1979). These decision rules
capture the majority of the variance in participants’ decisions in both complexity conditions.
The mean adjusted R square values for the high and low complexity conditions are 0.75 and
0.85 respectively for the Target Capacity rule, and 0.97 and 0.92 for the Price rule. For the
capacity and pricing decision rules, we also computed the optimal information weights
maximizing cumulative profit4. These should in no way be construed as the global optimal
decision rules for the management simulation since the rules only incorporate a handful of
information cues in accordance with the information processing constraints of boundedly
rational decision makers. The optimal information weights for these rules were used to
calculate how far participants’ information weights deviated from the optimal values5
We estimated linear mixed models with repeated measures to investigate the
relationships between mental models and decision rules using deviation from the optimal
information weights across trial blocks 4–9 as the dependent variable. Larger deviations
.
4 The optimal information weights were computed using the Powell algorithm with random multiple starts over more than ten million simulations. 5 The deviations were adjusted by a weighting factor to account for the sensitivity of performance to each information cue, and then the absolute differences summed across all information cues in both decision rules.
Mental Models and Performance Heterogeneity
26
indicate less effective decision rules and Models 1–3 of Table 4 show the results6
--------------------------------------
. Model 1
shows that mental model accuracy of the business environment has a significant impact (b =
-3.40, p < 0.001), with more accurate mental models reducing the deviation from optimal
information weights. Task complexity also has a significant impact (b = 2.64, p < 0.001)
indicating participants’ decision rules in the high complexity condition deviate more from
the optimal information weights than participants in the low complexity group. Model 2
shows that more accurate mental models of the deep structure result in more effective
decision rules with significantly smaller deviations from the optimally computed information
weights (b = -2.14, p < 0.01). Overall, these results provide evidence for a positive
relationship between mental models and effective decision heuristics. Establishing the link
between mental model accuracy and decision rules highlights one more mechanism
connecting mental models and performance variation.
Insert Table 4 Here --------------------------------------
Further analysis of participants’ pricing and capacity decision rules shows rapid
stabilization of the information weights for both rules. The evolution of decision rules were
tested using ANOVA contrasts comparing the information weights between trial blocks with
the data pooled across participants and analyzed separately for each level of complexity. For
the capacity investment decision rules, there are some significant differences between
information weights on the first four trial blocks. However, there are no significant
differences between information weights in all subsequent trial blocks of the immediate
testing phase. In the pricing decision rule, there are no significant differences between
information weights throughout all trial blocks of the learning and immediate testing phases.
These results provide evidence that participants formed decision rules rapidly and largely
6 A total of 12 cases–out of 315 total repeated measures cases–were identified as extreme outliers across multiple information weights and removed for the analysis.
Mental Models and Performance Heterogeneity
27
stabilized the information weights for these rules by the end of the fourth trial block with
little adjustment thereafter. This speedy stabilization of the decision rules helps explain why
average performance plateaus so rapidly.
Our analysis of decision rules shows a great deal of variation in participants’
information weights. To the extent that there are distinctive patterns of decision rules, this
could be evidence of different high-level policies or strategies. Recent strategy research
suggests different configurations of specific choice and decision sets lie below the surface of
higher-level policies and overarching strategies (Gavetti et al., 2005). Managers and firms
vary in terms of the overall strategies they adopt. For example, a firm that adopts a pricing
rule to capture market share by dropping price as unit cost decreases over time (e.g., due to
learning curve effects) and a capacity investment rule that rapidly expands capacity to fulfill
demand could be characterized as adopting a ‘Get-big-fast’ cost leadership strategy (Sterman
et al., 2007). Different patterns of decision rules could similarly represent other generic
strategies such as a premium price, niche strategy, as well as many other mixed strategies.
These strategies may be the result of either rational ex ante planning or emergent behavior.
Identifying different strategies by examining the observed patterns in decision rules is
necessarily exploratory, but enables us to investigate heterogeneity in strategies and the
relationships between mental models and strategies.
We used two-stage cluster analysis of the information weights to explore patterns in
the decision rules. The first stage involved hierarchical analysis to identify outliers and
centroid means, followed by K-Means nonhierarchical analysis to identify distinctive
strategies (Ketchen Jr & Shook, 1996)7 Table 5. As shown in , this analysis identified five
distinct strategies for the low complexity task condition and four distinct strategies for the
high complexity task condition. These strategies capture the range of observed patterns in the
7 Analyses were run separately for each task complexity condition and the results were robust to using different distance algorithms for identifying clusters.
Mental Models and Performance Heterogeneity
28
pricing and capacity investment decision rules. For example, the Tenacious Build and Hold
strategy in the low complexity task combined building capacity to an initial forecast–as
indicated by the large intercept for capacity investment–along with reducing price as unit
costs fall; as indicated by a relatively large cue weight for unit cost. Figure 3 illustrates the
different patterns of capacity investment decisions for the four distinct strategies in the high
complexity condition. Similarly, Figure 4 illustrates the different patterns of pricing decisions
associated with the five distinct strategies in the low complexity decision environment.
------------------------------------------ Insert Table 5 Here
------------------------------------------
------------------------------------------ Insert Figure 3 and Figure 4 Here -----------------------------------------
ANOVA shows there are significant differences in both mental model accuracy (F =
5.372, p< 0.01) and performance (F = 14.745, p< 0.001) between the four distinctive
strategies in the high complexity decision environment. There are also significant differences
in performance (F = 3.064, p < 0.05) and marginally significant differences in mental model
accuracy (F = 2.300, p = 0.06) between the five distinctive strategies in the low complexity
decision environment. Establishing these differences shows an additional mechanism
connecting mental models and performance variation. Specifically, the accuracy of decision
makers’ mental models impacts the strategies they adopt and there are significant
performance differences between the different strategies.
We also ran the complete set of pairwise tests of the differences in mental model
accuracy and performance across the various strategies. The results show that decision
makers with the most accurate mental models adopt the best strategies and achieve superior
performance under both complexity conditions. However, at lower levels of mental model
accuracy the connection between mental model accuracy, the strategies adopted and
Mental Models and Performance Heterogeneity
29
performance outcomes achieved, are not as straightforward. These findings suggest there may
be threshold effects relating mental models to the selection of higher-level strategies. It is
important to highlight that we are not suggesting that the highest performing strategies in the
simulation are the optimal strategies for firms to adopt when launching new products and
managing the lifecycle. Instead, these results demonstrate there are links between decision
makers’ mental models and the different strategies they adopt, and connect heterogeneity in
mental model accuracy, decision rules, and strategies to variation in performance outcomes.
DISCUSSION
Our results provide empirical evidence for the links between mental models and
performance outcomes and help explain why some managers and not others adopt strategies
that are ultimately associated with competitive success. We found substantial variation in the
accuracy of decision makers’ mental models and in performance. While it is certainly true
that perfect mental models are not necessary to reach high performance outcomes (Sutcliffe,
1994; Weick, 1990), our findings show that decision makers with more accurate mental
models of the causal relationships in the business environment achieve higher performance
outcomes. Further, this relationship not only remained stable but grew stronger between the
immediate and delayed testing phases, providing evidence that decision makers’ mental
models of the experimental task were not ephemeral.
Our results are consistent with the limited prior empirical research findings about the
importance of accurate mental models (Barr et al., 1992; Bourgeois, 1985), and extend prior
work by providing systematic evidence connecting differences in mental models of causal
relationships with performance heterogeneity. Our findings also help address an important
challenge facing the strategy field about whether more accurate mental models enable
managers ex ante to identify and interpret signals from their business environment that lead to
superior strategic choices and performance outcomes (Cockburn et al., 2000). In our
Mental Models and Performance Heterogeneity
30
experimental study, variation in mental model accuracy is a key source of performance
heterogeneity.
Our findings also show that managers do not need accurate mental models of the
entire business environment. Accurate mental models about the key principles of the business
environment lead to superior decision rules and performance outcomes. These results support
recent theoretical work in strategy positing the benefits of partial knowledge (Denrell et al.,
2004; Gavetti & Levinthal, 2000), and extend this work by providing evidence that all partial
knowledge is not equally valuable. The benefits of partial knowledge about the key principles
far outweigh the benefits of other partial knowledge. Our findings are also consistent with
prior research showing that experts with richer cognitive representations of the deep structure
of problems outperform novices who typically focus on superficial features of problems (Chi
et al., 1981; Gentner et al., 2003). An important implication is that managers do not need to
develop perfect and complete mental models of complex business environments, but should
instead focus on identifying and understanding the key principles.
We also find considerable variation in decision rules and that more accurate mental
models and deep structure accuracy lead to more effective decision rules. These findings
extend research examining the detrimental mean effects of decision biases and heuristics
1991). More work is needed to understand the heterogeneity in decision rules and heuristics
and how differences in decision rules impact performance. This is particularly important for
strategy scholars trying to explain heterogeneity in strategies and performance among firms.
More research is also needed on the formation of decision rules and the links to mental
models to help us better understand the origins of strategy.
Our findings provide much needed empirical evidence that differences in mental
model accuracy explain why decision makers adopt different strategies associated with
different levels of competitive success. This represents an important step forward and
provides a number of opportunities for future research examining the cognitive aspects of
strategy and identifying mechanisms to support better strategic thinking and decisions.
ACKNOWLEDGEMENTS
We are grateful for many helpful suggestions from Scott Rockart, John Sterman, Will
Mitchell, Rich Burton, Margie Peteraf, and Rich Bettis. We also thank seminar participants at
Duke University, MIT, UNC Chapel Hill, Kellogg, and Dartmouth. This paper also benefitted
immensely from comments by Associate Editor Rudi Bresser and two anonymous referees.
Mental Models and Performance Heterogeneity
36
REFERENCES
Anderson CA, Lindsay JJ, Bushman BJ. 1999. Research in the Psychological Laboratory: Truth or Triviality? Current Directions in Psychological Science 8(1): 3-9
Anderson JR. 1990. Cognitive psychology and its implications (3rd ed.). Freeman: new York
Argyris C, Schon D. 1974. Theories in Practice. San Fransciso: Jossey Bass Atkins PWB, Wood RE, Rutgers PJ. 2002. The effects of feedback format on dynamic
decision making. Organizational Behavior and Human Decision Processes 88: 587-604
Axelrod RM. 1976. Structure of decision: the cognitive maps of political elites. Princeton University Press, Princeton, NJ
Bandura A. 1997. Self-efficacy: The exercise of control. Freeman: New York
Bass FM. 1969. A New Product Growth Model for Consumer Durables. Management Science 15(5): 215-227
Bettis RA, Prahalad CK. 1995. The Dominant Logic: Retrospective and Extension. Strategic Management Journal 16(1): 5-14
Borgatti SP, Carboni I. 2007. On Measuring Individual Knowledge in Organizations. Organizational Research Methods 10(3): 449
Bourgeois LJ. 1985. Strategic goals, perceived uncertainty, and economic performance in volatile environments. Academy of Management Journal 28(3): 548-573
Camerer C. 1981. General conditions for the success of bootstrapping models. Organizational Behavior and Human Performance 27(3): 411-422
Camerer C, Lovallo D. 1999. Overconfidence and Excess Entry: An Experimental Approach. The American Economic Review 89(1): 306-318
Chase, Simon HA. 1973. Perception in Chess. Cognitive Psychology 4: 55-81
Chattopadhyay P, Glick WH, Miller CC, Huber GP. 1999. Determinants of executive beliefs: Comparing functional conditioning and social influence. Strategic Management Journal 20(8): 763-789
Chi M, Feltovich PJ, Glaser R. 1981. Representation of physics knowledge by experts and novices. Cognitive Science 5: 121-152
Cockburn IM, Henderson RM, Stern S. 2000. Untangling the Origins of Competitive Advantage. Strategic Management Journal 21(10/11): 1123-1145
Cohen-Charash Y, Spector PE. 2001. The Role of Justice in Organizations: A Meta-Analysis. Organizational Behavior and Human Decision Processes 86(2): 278-321
Cyert RM, March JG. 1963. A Behavioral Theory of the Firm (2nd ed.). Blackwell Publishers Inc.: Cambridge, MA. 1992.
Denrell J, Fang C, Levinthal DA. 2004. From T Mazes to Labyrinths: Learning from Model Based Feedback. Management Science 50(10): 1366-1378
Eden C, Spender J-C (Eds.). 1998. Managerial and organizational cognition: Theory, methods, and research. Sage: London
Mental Models and Performance Heterogeneity
37
Einhorn HJ, Kleinmuntz DN, Kleinmuntz B. 1979. Linear regression and process-tracing models of judgment. Psychological Review 86(5): 465-485
Ericsson KA, Krampe TT, Tesch-Romer C. 1993. The role of deliberate practice in the acquisition of expert performance. Psychological Review 100: 363-406
Gary MS, Dosi G, Lovallo D. 2008. Boom and Bust Behavior: On the Persistence of Strategic Decision Biases. In GP Hodgkinson, WH Starbuck (Eds.), The Oxford Handbook of Organizational Decision Making: 33-55. Oxford University Press: Oxford
Gavetti G. 2005. Cognition and Hierarchy: Rethinking the Microfoundations of Capabilities’ Development. Organization Science 16(6): 599-617
Gavetti G, Levinthal D. 2000. Looking forward and looking backward: Cognitive and experiential search. Administrative Science Quarterly 45(1): 113-137
Gavetti G, Levinthal DA, Rivkin JW. 2005. Strategy making in novel and complex worlds: the power of analogy. Strategic Management Journal 26(8): 691-712
Gentner D, Loewenstein J, Thompson L. 2003. Learning and transfer: a general role for analogical encoding. Journal of Educational Psychology 95(2): 393-408
Hatten K, Schendel D. 1975. Strategy′ s role in policy research. Journal of Economics and Business 8: 195-202
Henderson R. 2000. Luck, leadership, and strategy. In JAC Baum, F Dobbin (Eds.), Economics meets sociology in strategic management: Advances in strategic management, Vol. 17. JAI Press Inc: Stamford, CT
Hodgkinson GP, Bown NJ, Maule AJ, Glaister KW, Pearman AD. 1999. Breaking the frame: An analysis of strategic cognition and decision making under uncertainty. Strategic Management Journal 20(10): 977
Hodgkinson GP, Johnson G. 1994. Exploring the mental models of competitive strategists: The case for a processual approach. The Journal of Management Studies 31(4): 525
Hodgkinson GP, Maule AJ, Bown NJ. 2004. Causal Cognitive Mapping in the Organizational Strategy Field: A Comparison of Alternative Elicitation Procedures. Organizational Research Methods 7(1): 3
Huff AS. 1990. Mapping strategic thought. Wiley: New York and Chichester
Jackson SE, Dutton JE. 1988. Discerning threats and opportunities. Administrative Science Quarterly 33(3): 370-387
Johnson-Laird PN. 1983. Mental models: Towards a cognitive science of language, inference and consciousness. Cambridge University Press: Cambridge
Kahneman D, Tversky A. 2000. Choices, Values, and Frames. Cambridge University Press
Kalish S, Lilien GL. 1986. A market entry timing model for new technologies. Management Science 32(2): 194-205
Kaplan S, Tripsas M. 2008. Thinking about technology: Applying a cognitive lens to technical change. Research Policy 37(5): 790-805
Ketchen Jr DJ, Shook CL. 1996. The Application of Cluster Analysis in Strategic Management Research: An Analysis and Critique. Strategic Management Journal 17(6): 441-458
Mental Models and Performance Heterogeneity
38
Larkin J. 1983. The role of problem representation in physics. In D Gentner, A Stevens (Eds.), Mental models: 75–98. Erlbaum: Hillsdale, NJ
Levitt B, March JG. 1988. Organizational learning. Annual Review of Sociology 14: 319-340
Lurigio AJ, Carroll JS. 1985. Probation officers' schemata of offenders: Content, development, and impact on treatment decisions. Journal of Personality and Social Psychology 48(5): 1112–1126
Mahajan V, Muller E, Bass FM. 1990. New product diffusion models in marketing: A review and directions for research. Journal of Marketing 54(1): 1-26
Mahajan V, Muller E, Bass FM. 1995. Diffusion of new products: Empirical generalizations and managerial uses. Marketing Science 14(3): 79-89
March JG, Simon HA. 1958. Organizations. Wiley: New York
McNamara GM, Luce RA, Tompson GH. 2002. Examining the effect of complexity in strategic group knowledge structures on firm performance. Strategic Management Journal 23(2): 153-170
Moxnes E. 1998. Not only the tragedy of the commons: misperceptions of bioeconomics. Management Science 44(9): 1234-1248
Nelson RR, Winter SG. 1982. An evolutionary theory of economic change. Harvard University Press: Cambridge, MA
Norman DA. 1983. Some observations on mental models. In D Gentner, A Stevens (Eds.), Mental models: 7-14. Erlbaum: Hillsdale, NJ
Osborne JD, Stubbart CI, Ramaprasad A. 2001. Strategic groups and competitive enactment: a study of dynamic relationships between mental models and performance. Strategic Management Journal 22(5): 435-454
Paich M, Sterman JD. 1993. Boom, Bust, and failures to learn in experimental markets. Management Science 39(12): 1439-1458
Parker P. 1994. Aggregate diffusion forecasting models in marketing: A critical review. International Journal of Forecasting 10(2): 353-380
Porac J, Thomas H, F TW, Paton D, Kanfer A. 1995. Rivalry and the industry model of Scottish knitwear production. Administrative Science Quarterly 40(2): 203-230
Porac JF, Thomas H, Baden-Fuller C. 1989. Competitive groups as cognitive communities: The case of Scottish knitwear manufacturers. Journal of Management Studies 26(4): 397-416
Powell MJD. 1998. Direct search algorithms for optimization calculations. ACTA NUMERICA: 287-336
Rivkin JW. 2001. Reproducing knowledge: Replication without imitation at moderate complexity. Organization Science 12(3): 274-293
Mental Models and Performance Heterogeneity
39
Rivkin JW, Siggelkow N. 2003. Balancing Search and Stability: Interdependencies Among Elements of Organizational Design. Management Science 49(3): 290
Roberts JH, Urban GL. 1988. Modeling Multiattribute Utility, Risk, and Belief Dynamics for New Consumer Durable Brand Choice. Management Science 34(2): 167-185
Rogers E. 1995. Diffusion of innovations (4th ed.). Free Press: New York
Schwab DP. 1980. Construct validity in organizational behavior. Research in organizational behavior 2(1): 3-43
Sengupta K, Abdel-Hamid TK. 1993. Alternative conceptions of feedback in dynamic decision environments: An experimental investigation. Management Science 39(4): 411-428
Simon HA. 1991. Bounded rationality and organizational learning. Organization Science 2(1): 125-134
Sterman JD. 1989a. Misperceptions of Feedback in Dynamic Decision making. Organizational Behavior and Human Decision Processes 43(3): 301-335
Sterman JD. 1989b. Modeling Managerial Behavior: Misperceptions of Feedback in a Dynamic Decision Experiment. Management Science 35(3): 321-339
Sterman JD. 2000. Business Dynamics: Systems Thinking and Modeling for a Complex World. McGraw-Hill
Sterman JD, Henderson R, Beinhocker ED, Newman LI. 2007. Getting Big Too Fast: Strategic Dynamics with Increasing Returns and Bounded Rationality. Management Science 53(4): 683
Stinchcombe A. 2000. On equilibrium, organizational form, and competitive strategy. In JAC Baum, F Dobbin (Eds.), Economics Meets Sociology in Strategic Management: Advances in Strategic Management, Vol. 17: 271-284. JAI Press Inc: Stamford, CT
Sutcliffe KM. 1994. What executives notice: Accurate perceptions in top management teams. Academy of Management Journal 37(5): 1360-1378
Sutherland JW. 1980. A quasi-empirical mapping of optimal scale of enterprise. Management Science 26(10): 963-981
Tripsas M, Gavetti G. 2000. Capabilities, cognition, and inertia: evidence from digital imaging. Strategic Management Journal 21(10-11): 1147-1161
Verbeke G, Molenberghs G. 2000. Linear Mixed Models for Longitudinal Data. Springer Verlag
Walsh JP. 1995. Managerial and organizational cognition: Notes from a trip down memory lane. Organization Science 6: 280-321
Weick KE. 1990. Cartographic Myths in Organisation. In AS Huff (Ed.), Mapping Strategic Thought. John Wiley & Sons: London
Wood RE, Bandura A, Bailey T. 1990. Mechanisms governing organizational performance in complex decision-making environments. Organizational Behavior and Human Decision Processes 46: 181-201
Zajac EJ, Bazerman MH. 1991. Blind spots in industry and competitor analysis: Implications of interfirm (mis)perceptions for strategic decisions. Academy of Management Review 16(1): 37-56
Mental Models and Performance Heterogeneity
40
Figure 1 Causal relationships of the low complexity task8
8 The arrows linking variables are defined formally as follows (Sterman, 2000):
00 <∂∂
⇒→>∂∂
⇒→xyyxand
xyyx OS
PotentialCustomers
InstalledCustomer Base
Word of MouthEffect
OrdersS
BacklogShipments
O
S
S
PriceDecision
Reentry as PotentialCustomers
S
S
O
MarketingSpend
Revenue
S
Capacity
TargetCapacityDecision
S
S
S
S
CumulativeProduction
S
Net Profit
Variable Costs
Investment Costs
S
O
O
Fixed Costs
S
O
SO
O
S
SO
CumulativeProfits
S
S
DeliveryDelay
CancellationsOS S
O
Unit Cost
O
S
S
OS
Mental Models and Performance Heterogeneity
41
Figure 2 Mean performance relative to benchmark and 95% confidence intervals for low and high complexity groups across all nine trial blocks
Mental Models and Performance Heterogeneity
42
Figure 3 Different patterns of target capacity decisions for the four high complexity strategies
Figure 4 Different patterns of pricing decisions for the five strategies in the low complexity task
Mental Models and Performance Heterogeneity
43
Table 1 Correlations, means and standard deviations for study variables
Notes: Unstandardized coefficients with standard errors in parentheses * p < .05; ** p < .01; *** p < .001 a Dependent variable is Performance on 6th trial block and the OLS model is:
Perf6 = Intercept + B1TaskComplexity + B2SelfEff + B3GMAT + B4MentalModComplex + B5MentalModAcc + ε b Dependent variable is Performance on 9th trial block and the OLS model is:
Perf9 = Intercept + B1TaskComplexity + B2SelfEff + B3GMAT + B4MentalModComplex + B5MentalModAcc + ε c Dependent variable is Performance on trial blocks 4-9 (repeated measures) and the linear mixed model is: Perfit = β1 + β2TaskComplexityi + β3SelfEffi + β4GMATi + β5MentalModComplexi + β6MentalModAcci + β7TrialBlki4 + β8TrialBlki5 + β9TrialBlki6 + β10TrialBlki7 + β11TrialBlki8+ b1 + εit
where β1 - β11 are the fixed-coefficients (including the intercept term β1), b1 is the random-effect intercept capturing the variance among subject i intercepts, and εit is the error for observation t of subject i and is modeled using a first-order autoregressive structure to account for the correlation within individuals. Two parameters are estimated for the first-order autoregressive structure εit = φεi,t-1 + νt where νt ~ NID(0, 𝜎𝜎ν
2) and the autocorrelation between two errors one time-period apart is ρ(1) = φ.
d Dependent variable is Performance on trial blocks 4-9 (repeated measures) and the linear mixed model is: Perfit = β1 + β2TaskComplexityi + β3SelfEffi + β4GMATi + β5MentalModComplexi + β6MentalModAcci + β7TrialBlki4 + β8TrialBlki5 + β9TrialBlki6 + β10TrialBlki7 + β11TrialBlki8+ β12MentalModAcc X TaskComplexity + b1 + εit
Mental Models and Performance Heterogeneity
45
Table 3 Impact of mental model accuracy of the deep structure on performance
Notes: Unstandardized coefficients with standard errors in parentheses * p < .05; ** p < .01; *** p < .001 a Dependent variable is Performance on 6th trial block and the OLS model is:
b Dependent variable is Performance on 9th trial block and the OLS model is: Perf9 = Intercept + B1TaskComplexity + B2SelfEff + B3GMAT + B4DeepStrucAcc + ε
c Dependent variable is Performance on trial blocks 4-9 (repeated measures) and the linear mixed model is: Perfit = β1 + β2TaskComplexityi + β3SelfEffi + β4GMATi + β5DeepStrucAcci + β6TrialBlki4 + β7TrialBlki5 + β8TrialBlki6 + β9TrialBlki7 + β10TrialBlki8+ b1 + εit
Mental Models and Performance Heterogeneity
46
Table 4 Impact of mental model accuracy on deviation from optimal information weights
Notes: Unstandardized coefficients with standard errors in parentheses * p < .05; ** p < .01; *** p < .001 Deviation from Optimal Information Weights on trial blocks 4-9 is the Dependent Variable a Dev_from_Opt_Weightsit = β1 + β2TaskComplexityi + β3SelfEffi + β4GMATi + β5MentalModAcci + β6TrialBlki4 + β7TrialBlki5 + β8TrialBlki6 + β9TrialBlki7 + β10TrialBlki8+ b1 + εit
Build capacity to initial forecast and maintain constant margin
77 0.30 0.53 11.72 0.14 0.24 0.42 0.74 0.88 0.01
[3] Show Me Invest in capacity only after seeing demand & drop prices as unit costs fall
76 0.02 0.52 2.35 0.79 0.02 -0.06 0.35 0.97 -0.01
[4] Rapid Response Aggressive capacity adj. to match demand and drop prices as unit costs fall
16 0.49 0.62 10.13 0.23 1.22 1.62 0.73 0.88 0.00
Notes: a Number of decision makers adopting each strategy over trial blocks 1-9 b Mean performance across trial blocks 4-9 for each strategy c Mean mental model accuracy across trial blocks 4-9 for each strategy d Mean information weights (cluster centroids) for the capacity investment decision rule for each strategy over trial blocks 1-9 d Mean information weights (cluster centroids) for the pricing decision rule for each strategy over trial blocks 1-9
Mental Models and Performance Heterogeneity
48
Appendix A: Segment from the first set of knowledge questions about bivariate causal relationships
This arrow indicates that an increase in X results in an increase in Y above what it would have been (all else equal). On the other hand, a decrease in X results in a decrease in Y below what it would have been (all else equal). X and Y move in the SAME direction.
In contrast, this arrow indicates X and Y move in the OPPOSITE direction. For example, an increase in X results in a decrease in Y below what it would have been (all else equal). On the other hand, a decrease in X results in an increase in Y above what it would have been (all else equal).
Think about the relationships between these variables that you believe are embedded in the simulator. Relying only on your experience with the simulated firm, draw the appropriate influence arrow(s) for each variable pair and indicate whether the causal influence is in the same or opposite direction using an ‘S’ or ‘O’ at the end of the arrow. Identify any cases in which there is two-way dependency between the variables by drawing the appropriate arrows representing the two-way loop of influence. Focus only on direct relationships and ignore any intervening variables that may result in indirect influence arrows. If there is no direct relationship between the variable pair, write ‘NONE’ between the two variables. If you do not have any idea about the correct answer, then write ‘Do Not Know’ instead of guessing randomly.
1. Orders Backlog
2. Shipments Backlog
3. Backlog Delivery Delay
X YS
X YO
Mental Models and Performance Heterogeneity
49
Appendix B: Example graphical scenario question from the second set of knowledge questions
Using the time path of Total Industry Orders provided in the top graph below, select the letter of the appropriate time path for Industry Potential Customers on the bottom graph. Circle D if none of the lines in the bottom graph show the correct time path. Assume the initial value of industry Potential Customers is 5 million at Time 0. Also assume that no other variables affect industry Potential Customers over this time horizon.
Answer: A) B) C) D) None of the Above
Orders1,000,000
750,000
500,000
250,000
00 1 2 3 4 5 6 7 8 9 10
Time (Quarter)
Potential Customers10 M
7.5 M
5 M
2.5 M
00 1 2 3 4 5 6 7 8 9 10
Time (Quarter)
A
B
C
Mental Models and Performance Heterogeneity
50
Appendix C: Example questions assessing deep structure accuracy
The following are seven example items about bivariate causal relationships used to measure deep structure accuracy. See Appendix A for the instructions participants were given for answering these questions. Also note that these questions were randomly placed throughout the knowledge test and therefore the numbers along the left side of the table below do not reflect the order of the questions in the full knowledge test. The remaining four items of the deep structure accuracy measure are graphical scenario questions covering a subset of the same relationships. The example graphical scenario question in Appendix B is one of those items.
1. Potential Customers Orders
2. Potential Customers Reentry as Potential Customers


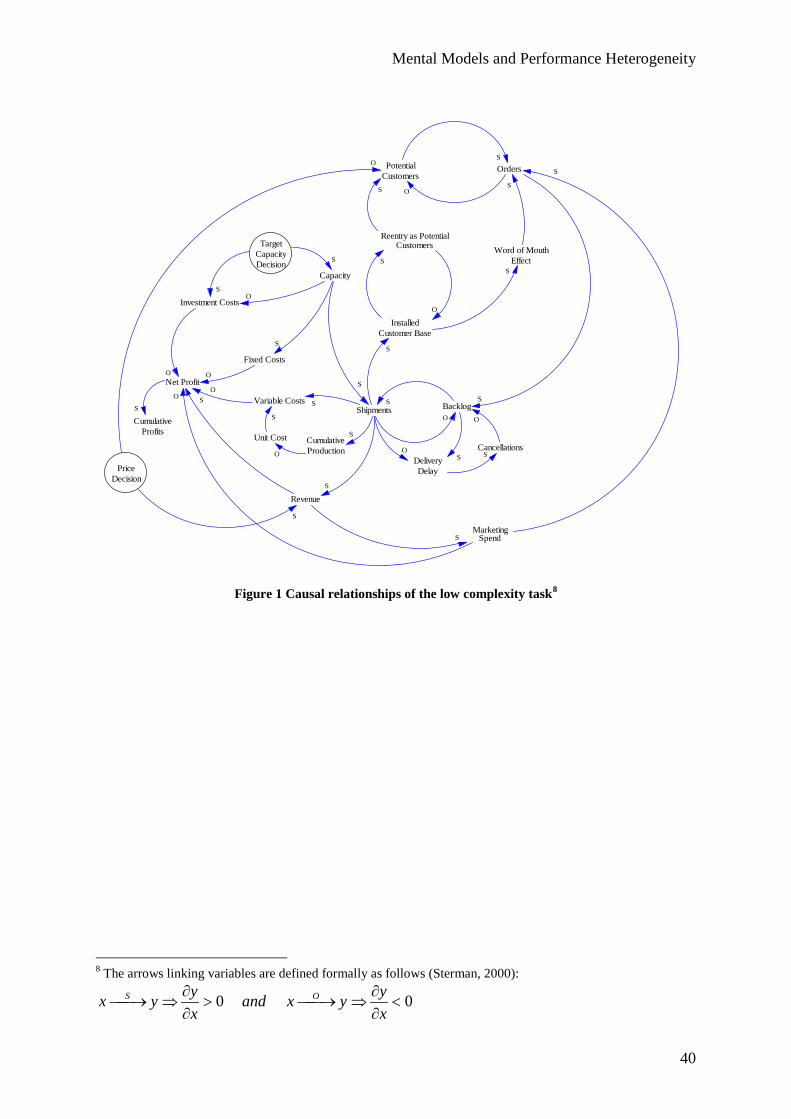


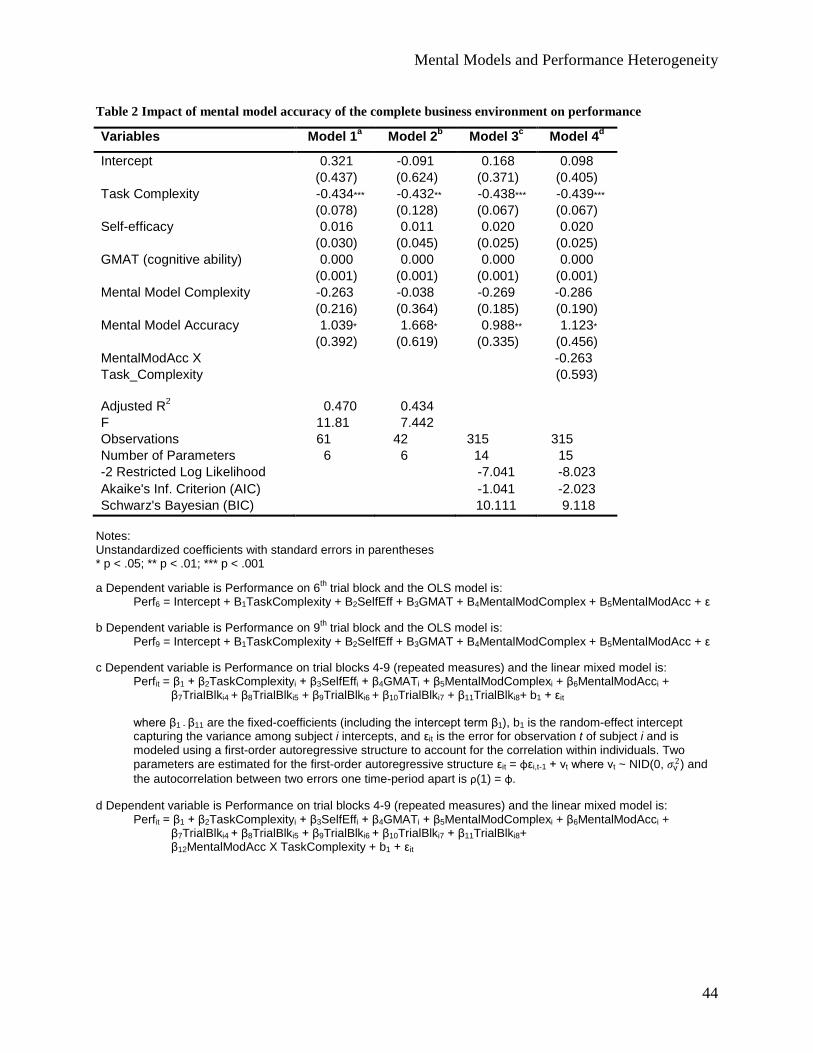
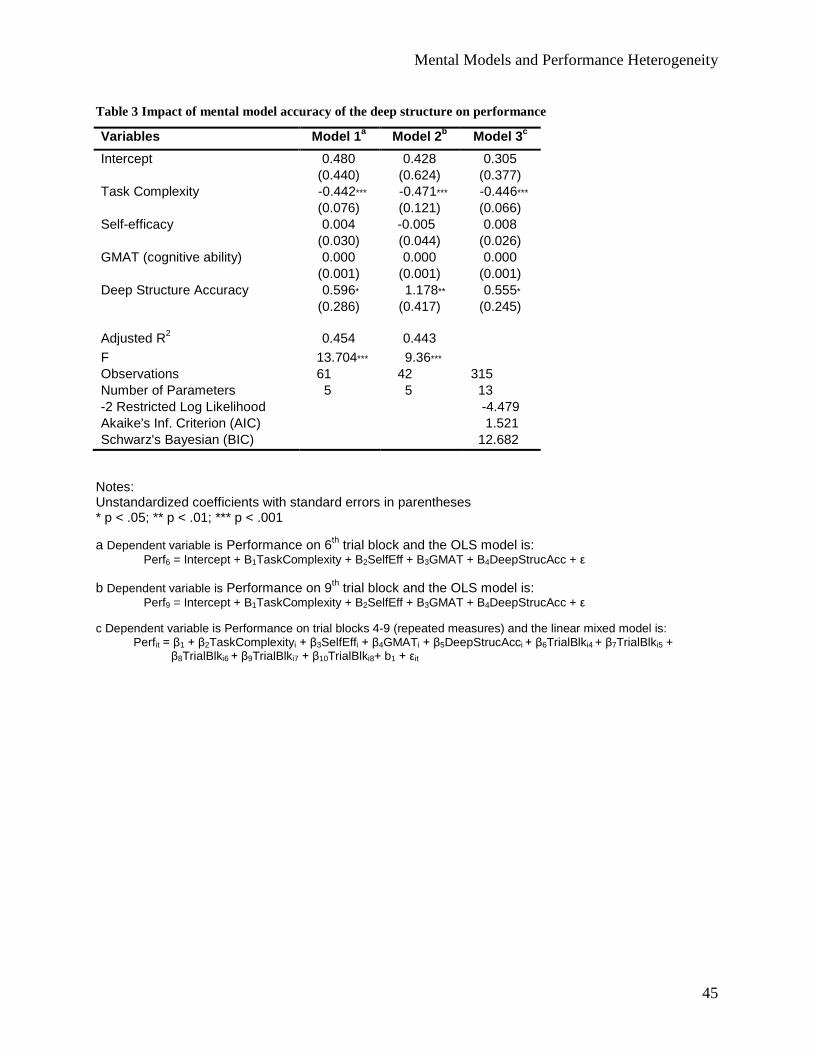

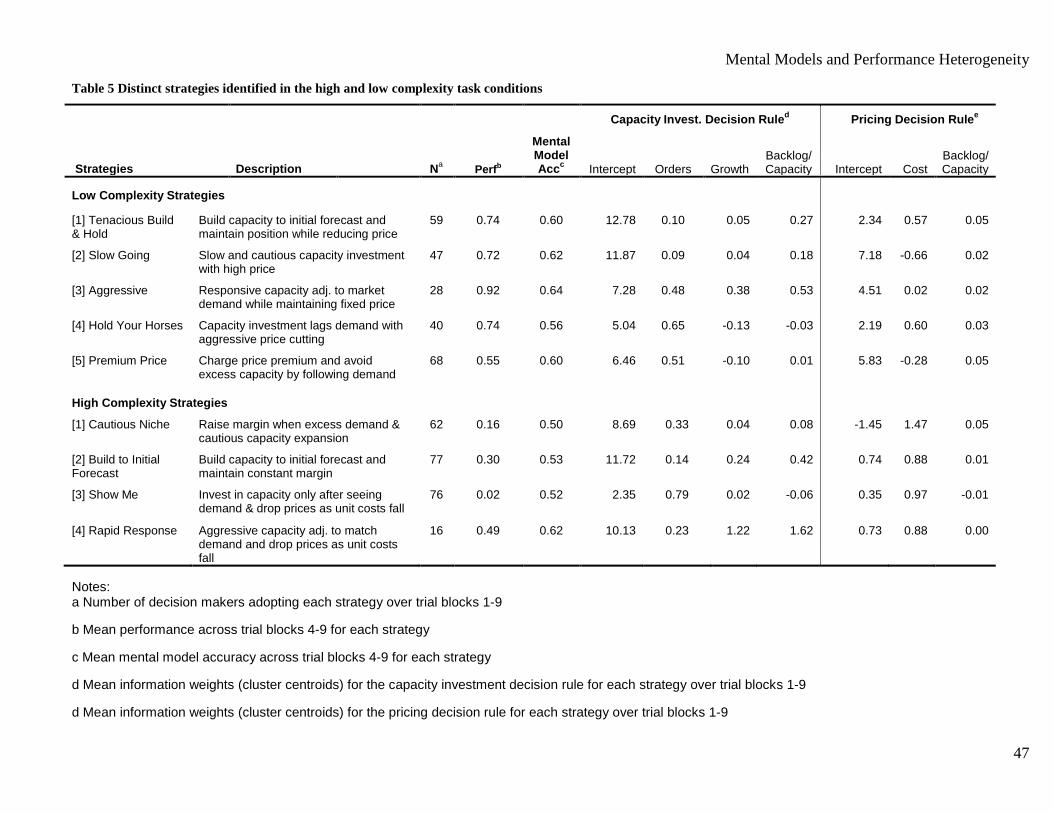


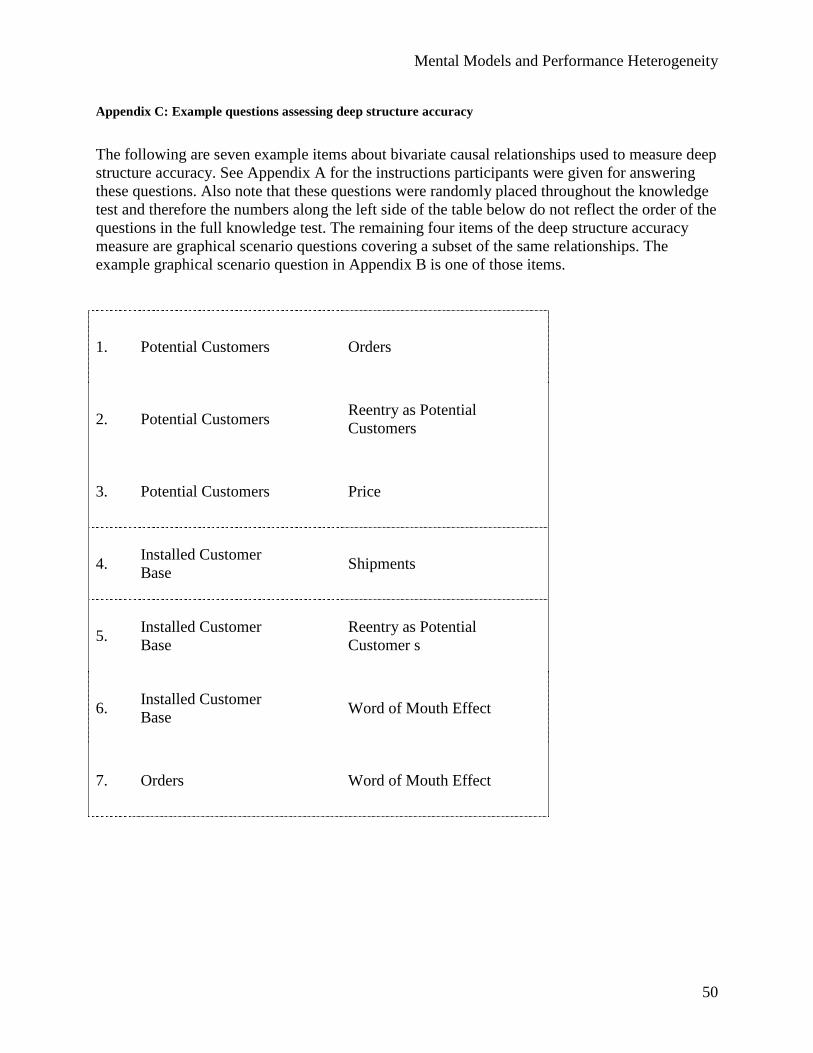


![8: Cognitive Capabilities: Mental …itm/688/Wk5 - Mental Models...8: Cognitive Capabilities: Mental Representations, Problem Solving, and Decision Making [Ritter] There are several](https://static.documents.pub/doc/80x56/5b854d3e7f8b9aea498e1feb/8-cognitive-capabilities-mental-itm688wk5-mental-models8-cognitive-capabilities.jpg)


