40


Mention of trade names or commercial products does not constitute endorsement or recommendation for their use by the United States government.
Citation for the Full ReportHartwell, S.I., Apeti, D., Claflin, L.W., Johnson, W.E. and Kimbrough, K. 2011. Sediment Quality Triad Assessment in Kachemak Bay: Characterization of Soft Bottom Benthic Habitats and Contaminant Bioeffects Assessment. 35pp.

Sediment Quality Triad Assessment in Kachemak Bay: Characterization of Soft Bottom
Benthic Habitats and Contaminant Bioeffects Assessment
S. Ian Hartwell, A. Dennis Apeti, W. Larry Claflin, W. Edward Johnson, and L. Kimani KimbroughNational Oceanic and Atmospheric Administration
National Ocean ServiceNational Centers for Coastal Ocean Science
Center for Coastal Monitoring and Assessment
Silver Spring, MD
2011

Table of Contents
LIST OF TABLES....................................................................... i
LIST OF FIGURES .................................................................... i
LIST OF ACRONYMS ............................................................... ii
EXECUTIVE SUMMARY ........................................................... iv
INTRODUCTION ....................................................................... 1
KACHEMAK BAY STUDY ......................................................... 2
METHODS ........................................................................ 4
RESULTS AND DISCUSSION .................................................. 9
SUPPLEMENTAL SAMPLES AT PORT GRAHAM ................... 23
CONCLUSION ........................................................................ 28
ACKNOWLEDGEMENTS .......................................................... 28
LITERATURE CITED ................................................................. 29
List of Tables
Table 1. Number of metals and groups of organic contaminants measured in this study. For simplicity the term metal is used without distinction between true metals and metalloids ................6
Table 2. Metal concentration ranges in Kachemak Bay sediments. Values are minimum and maximum with the stratum median in parenthesis (μg /g dry weight). Values for Al, Si and Fe are expressed in percentage.*Denotes metal concentration above the ERL values of sediment quality guideline in, at least one site in the study area .......................................12
Table 3. Total number of taxa and abundance per square meter for stations in Kachemak Bay nodes........................................................................................................................22
List of Figures
Figure 1. Map of Kachemak Bay study area in Alaska .......................................................................5
Figure 2. Map detailing Lower Cook Inlet and Kachemak Bay circulation pattern .............................5
Figure 3. Top: Map of Kachemak Bay showing sediment collection sites in Kachemak Bay. The inserts depict sites within Homer Harbor. Bottom: Map of Kachemak Bay showing sites collected in the Port Graham area. The inserts depict sites within Port Graham. . ............................................................7

Figure 4. Combined cluster analysis overlays of species clusters and site clusters. The top figure illustrates the dominant species communities found in different site clusters. The lower figure illustrates how different species assemblages distribute themselves between different habitats. ..............................................................................................................................8
Figure 5. Top: Kachemak Bay habitat characterization. Bathymetry with 10 meter isobath contours (KBNERR, 2001). Bottom: Water clarity from Secchi disc measurements. The water column was significantly more turbid in the east of the bay. ...................10
Figure 6. Top: Spatial distribution of fine sediment (percent silt + clay). Bottom: total organic carbon in sediment at Kachemak Bay study sites, bottom. ...............................................................11
Figure 7. Mean normalized concentrations for trace metals in Kachemak Bay sediments (site concentration of each metal and organic class was divided by the overall mean of the metal). EF4 is eastern flat station #4. ..........................................................................................13
Figure 8. Selected metals sediment concentrations from the present study and averaged Mussel Watch data from southern Alaska. (Homer = Homer spit; GOA = Gulf of Alaska; PWS = average of 5 sites in Prince William Sound) ..........................................................................14
Figure 9. Plots of chromium, cadmium, mercury, selenium, lead, copper, nickel and zinc (mg/kg) as a function of aluminum concentration in Kachemak Bay sediments. Solid triangles - Kachemak Bay; open squares – Homer Harbor. ....................................................15
0.0
0.5
1.0
1.5
2.0
2.5
3.0
3.5
4.0
4.5
5.0
Tota
l PCB
s n
g gm
-1
Homer Harbor
Eastern SubtidalEastern FlatWestern Subtidal
Western Flat
0.0
0.1
0.2
0.3
0.4
0.5
0.6
0.7
0.8
Tota
l DD
Ts n
g gm
-1
Homer Harbor
Eastern SubtidalEastern Flat
Western SubtidalWestern Flat
0
2
4
6
8
10
12
Tota
l But
ylti
ns a
s Sn
ng
gm-1
Homer Harbor
Eastern SubtidalEastern Flat
Western SubtidalWestern Flat
0.0
0.1
0.2
0.3
0.4
0.5
0.6
0.7
0.8
Tota
l Cyc
lodi
enes
ng
gm-1
Homer Harbor
Eastern SubtidalEastern Flat
Western SubtidalWestern Flat
0
500
1000
1500
2000
2500
3000
Tota
l PA
H W
/O P
eryl
ene n
g gm
-1
Homer Harbor
Eastern SubtidalEastern Flat
Western SubtidalWestern Flat
0.00
0.02
0.04
0.06
0.08
0.10
0.12
0.14
0.16
0.18
0.20
Tota
l HCH
ng
gm-1
Homer Harbor Eastern SubtidalEastern Flat
Western SubtidalWestern Flat
Figure 10. Mean normalized concentrations for organic contaminants in Kachemak Bay sediments (site concentration of each organic class was divided by the overall mean of the organic class). ..............................................................................................................16
Figure 11. Concentration of Total PCBs, DDT, and PAHs in sediment from Kachemak Bay study sites..........................................................................................................................................17
Figure 12. Top: Concentrations of individual PAHs in sediment from subtidal western sites. Bottom: Homer Harbor sites. ..........................................................................................................................19
Figure 13. Grids used for boat hull cleaning and maintenance operations in Homer Harbor. ...........20
Figure 14. Top: Benthic species abundance. Bottom: Benthic species diversity distribution. Strong east-west gradients of increasing species abundance and diversity were observed ...................................................................................................................................21
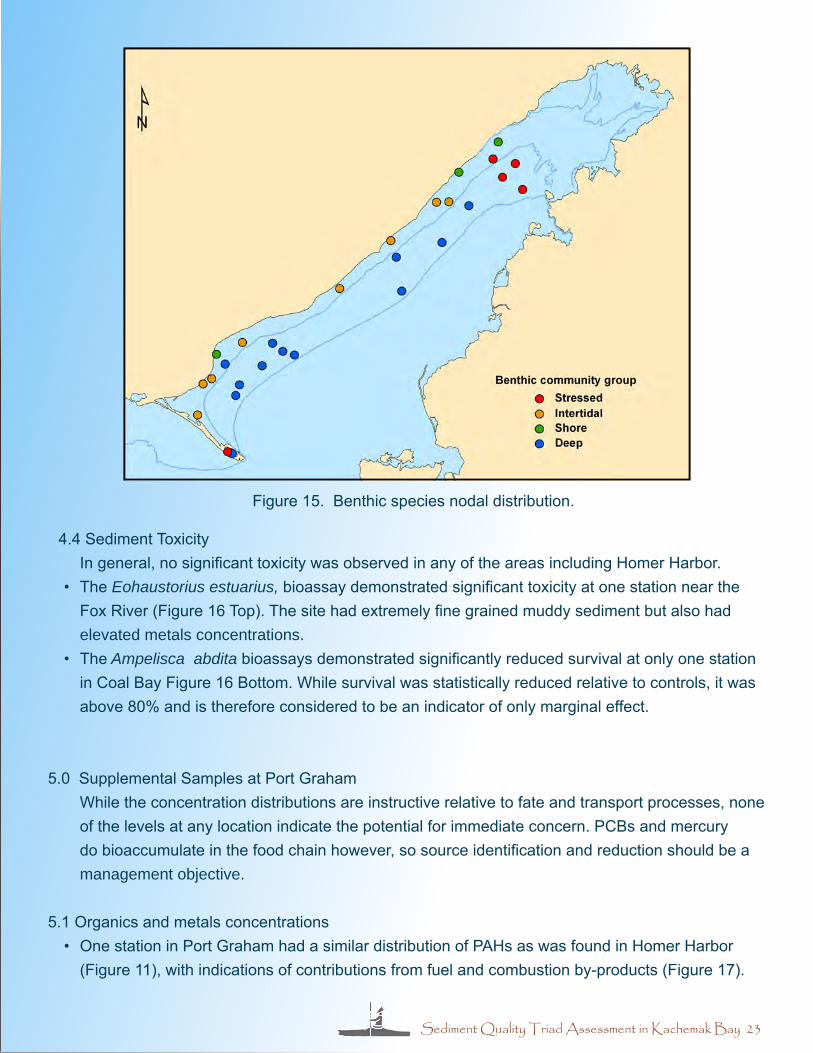
Figure 15. Benthic species nodal distribution. ..................................................................................23
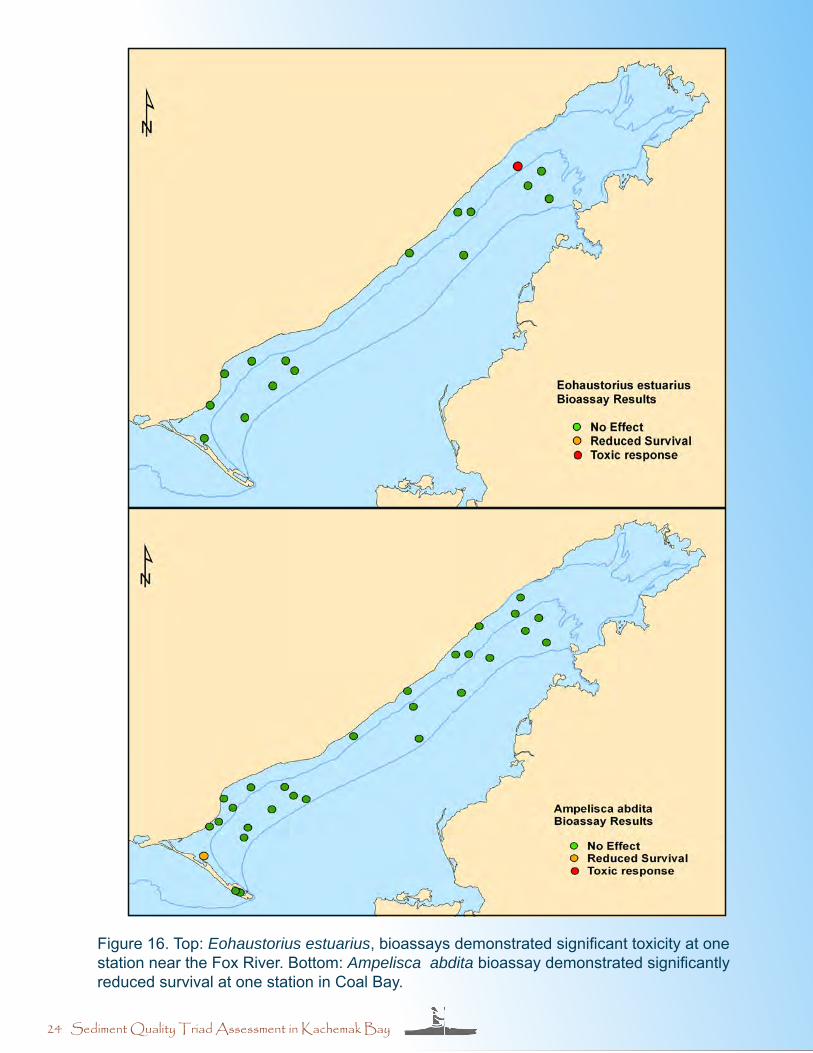
Figure 16. Top: Eohaustorius estuarius, bioassays demonstrated significant toxicity at one station near the Fox River. Bottom: Ampelisca abdita bioassay demonstrated significantly reduced survival at one station in Coal Bay ...................................................................24
Figure 17 . Concentrations of individual PAH compounds found at three Port Graham stations. The PAH signature for Port Graham appears slightly different from other Kachemak Bay study sites, indicative of source differences. Site PG3c resembles Homer Harbor. ...................................25
i
Figure 18A. Relative concentrations of four elements (cadmium, chromium, mercury, selenium) in Kachemak Bay sampling areas and extra sampling stations at Port Graham. Concentrations are normalized to the overall mean concentration in the Kachemak Bay only (excluding Port Graham) and expressed as a percentage. ...............................................................26
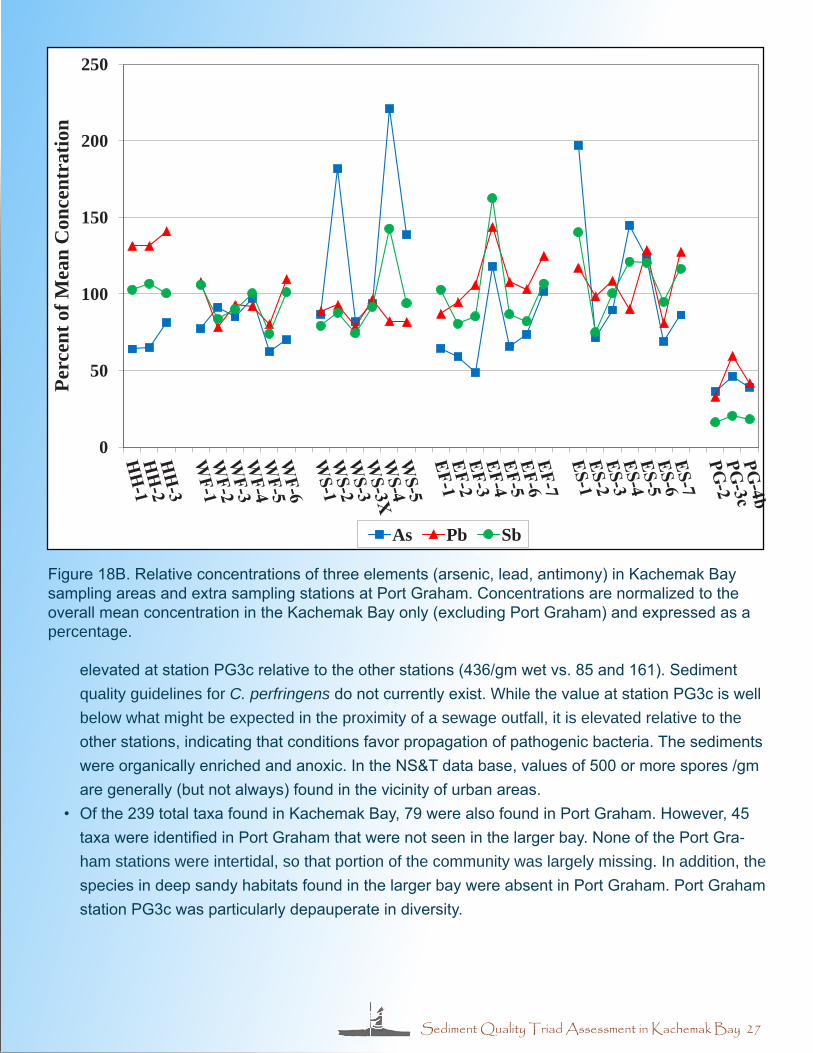
Figure 18B. Relative concentrations of three elements (arsenic, lead, antimony) in Kachemak Bay sampling areas and extra sampling stations at Port Graham. Concentrations are nor-malized to the overall mean concentration in the Kachemak Bay only (excluding Port Graham) and expressed as a percentage. ...............................................................27
Figure 19. Distribution of ERM quotients in Kachemak Bay, Port Graham, and Homer Harbor relative to open water reaches of other bays, and large ports around the United States ..........................................................................................................28
List of Acronyms
AAS Atomic Absorption SpectroscopyADEC Alaska Department of Environmental ConservationADF&G Alaska Department of Fish & GameAg silverAl aluminumAMAP Arctic Monitoring & Assessment ProgramAOOS Alaska Ocean Observation SystemAPHA American Public Health AssociationAs arsenicASTM American Society of Testing and MaterialsBT Butyl TinCd cadmiumCFR Code of Federal RegulationsCIRCAC Cook Inlet Regional Citizens Advisory CouncilCr chromiumCu copperDDT DichlorodiphenyltrichloroethaneDO Dissolved OxygenEF Eastern FlatEMAP Environmental Monitoring and Assessment ProgramEPA Environmental Protection AgencyERL Effects Range - LowERM Effects Range - MedianES Eastern SubtidalEVOS Exxon Valdez Oil SpillFe ironGC/ECD Gas Chromatography/Electron Capture DetectorGC/MS Gas Chromatography/Mass Spectroscopygm gramGOA Gulf of AlaskaH’ Diversity (Shannon-Weiner)
ii

HCH Hexachloro-CyclohexaneHg mercuryHH Homer HarborHRGS Human Reporter GeneICP Inductively Coupled PlasmaKBNERR Kachemak Bay National Estuarine Research Reservekm kilometerL Literm meterMDL Method Detection Limitmg milligramMn manganeseMS Matrix SpikeMSD Matrix Spike Duplicateng NanogramNi nickelNIST National Institute of Standards and TechnologyNPRB North Pacific Research BoardNOAA National Oceanic and Atmospheric AdministrationNS&T National Status and TrendsP ProbabilityPAH Polycyclic Aromatic HydrocarbonPb LeadPCA Principal Component AnalysisPCB Polychlorinated BiphenylPOP Persistent Organic PollutantPOTW Publically Owned Treatment Plantppt parts per thousandPWSRCAC Prince William Sounds Regional Citizens Advisory CouncilQA/QC Quality Assurance/Quality ControlSb antimonySe seleniumSi siliconSn tinSQG Sediment Quality GuidelinesSQT Sediment Quality TriadSRM Standard Reference MaterialTBT TributyltinTIC Total Inorganic CarbonTOC Total Organic Carbonug microgramWF Western FlatWS Western SubtidalZn zinc
iii

EXECUTIVE SUMMARY
A baseline environmental characterization of the inner Kachemak Bay, Alaska was conducted using standardized National Status and Trends Bioeffects Program methods. Three sites near the village of Port Graham were also sampled for comparison. Concentrations of over 120 organic and metallic contaminants were analyzed. Ambient toxicity was assessed using two bioassays. A detailed benthic community condition assessment was performed. Habitat parameters (e.g. depth, salinity, tempera-ture, dissolved oxygen, sediment grain size, and organic carbon content) that influence species and contaminant distribution were also measured at each sampling site. The following is the synopsis of findings
• Sediments were mostly mixed silt and sand with pockets of muddy zones. Organic compounds (PAHs, DDTs, PCBs, chlorinated pesticides) were detected throughout the bay but at relatively low concentrations. With some exceptions, metals concentrations were relatively low and prob-ably reflect the input of glacial runoff.
• Homer Harbor had elevated concentrations of metallic and organic contaminants. Concentra-tions of organic contaminants measured were five to ten times higher in the harbor sites than in the open bay sites. Tributyltin was elevated in Homer Harbor relative to the other areas.
• There was no evidence of residual PAHs attributable to oil spills, outside of local input in the confines of the harbor.
• The benthic community is very diverse. Specific community assemblages were distributed based on depth and water clarity. Species richness and diversity was lower in the eastern end of the bay in the vicinity of the Fox River input. Abundance was also generally lower in the east-ern portion of the study area, and in the intertidal areas near Homer. The eastern portions of the bay are stressed by the sediment load from glacial meltwater.
• Significant toxicity was virtually absent. • The benthic fauna at Port Graham contained a significant number of species not found in
Kachemak Bay. • Selected metal concentrations were elevated at Port Graham relative to Kachemak Bay, prob-
ably due to local geology. Organic contaminants were elevated at a site south of the village.
iv(Chugach Wood Carving)

Sediment Quality Triad Assessment in Kachemak Bay 1
1. INTRODUCTION
1.1 National Status and Trends Bioeffects Studies The National Oceanic and Atmospheric Administration’s (NOAA) National Status and Trends
(NS&T) Bioeffects Program studies consist of measurement of sediment toxicity, chemistry, and benthic community assessment (Sediment Quality Triad - SQT) in estuarine and coastal areas throughout the U.S. The NS&T Program has conducted SQT assessment studies in coastal wa-ter bodies of the contiguous U.S. and portions of the Hawaiian Islands since 1991. Results from previous sediment bioeffects studies in over 20 coastal water bodies and estuaries have been published (Long et al. 1996, Turgeon et al. 1998, Long 2000, Hartwell et. al., 2001, Hartwell and Hameedi 2007, Harmon et. al., 2003). As a part of the NS&T goal to expand its coastal data-base to include Alaska, sediment chemistry, toxicity, and benthos assessments were conducted in Kachemak Bay. This report presents the results of the study which was funded in part by the North Pacific Research Board (NPRB), the Cook Inlet Regional Citizens Advisory Council (CIR-CAC), and NOAA.
1.2 Rationale Sediment contamination in U.S. coastal area is a major environmental issue because of poten-
tial toxic effects on biological resources and often, indirectly, on human health. A large variety of contaminants from industrial, agricultural, urban, and maritime activities are associated with bottom sediments, including synthetic organic chemicals, polycyclic aromatic hydrocarbons (PAHs), and trace elements. Contaminants can biomagnify in the food chain with increasing concentration in predatory wildlife and ultimately, in humans. Thus, characterizing and delineating areas of sediment contamination and toxicity are viewed as important goals of coastal resource management. This is particularly important in Alaska where subsistence food contamination is an emerging health concern, especially in rural areas where large amounts of these foods are consumed as a primary source of protein (Wolfe 1996). With no known industrial point sources of contamination, current sources of pollution to Kachemak Bay may include sewage discharge, leaking septic tanks, erosion from metal rich soil, and runoff from old mines. Historically, canner-ies, mineral, and coal mining in the region have generated shoreline and watershed contaminant inputs in the region. Since Kachemak Bay lies between Cook Inlet and Prince William Sound oil operations traffic, the possibility of using the bay as shelter for vessels could result in pollution from oil leaks and release of other hazardous substance that can impact marine resources.
1.3 Approach Bioeffects assessments measure three kinds of parameters; sediment chemistry, sediment ani-
mal community condition, and sediment toxicity. These constitute what is referred to as the Sedi-ment Quality Triad (SQT). The SQT is an important ecosystem-based management tool widely used by coastal managers for coastal resource management. Study areas are divided into small-

2 Sediment Quality Triad Assessment in Kachemak Bay
er subunits consisting of uniform habitat type which are sampled at multiple locations. The NS&T Bioeffects Program uses a stratified-random statistical design for selection of sampling sites to determine the spatial extent of sediment contaminant effects in coastal waters. One of the de-sign principles is to sample all locations in the same time frame and using the exact same meth-ods at all places so that comparison of the severity and spatial extent of impacts between areas is possible.
Chemical contamination assessments include analysis of a large suite of organic compounds, pesticides and trace element contaminants. Knowing the concentrations of contaminants in a region is critical to understanding where and to what degree pollutants have been released and where they accumulate.
Benthic organisms (animals that live in the bottom sediments) play an important role in the es-tuarine environment. Critical habitats and food chains supporting many fish, crabs, and wildlife species include them. They are composed of diverse species with a variety of life history char-acteristics. Furthermore, most benthic species have limited mobility and cannot move away from stressful environmental conditions. Thus these biological communities are able to integrate the complexity of natural stressors and pollutants. Information on changes in benthic populations and community patterns due to habitat change can be useful for separating natural variation from changes associated with human activities. Benthic community studies have a long history of use in regional estuarine monitoring programs and have been proven to serve as an effective indica-tor for describing the extent and magnitude of pollution impacts and habitat modification in estua-rine ecosystems, as well as for assessing the effectiveness of management actions (Llanso et al. 2004, Long et al. 1995).
Bioeffects studies also measure toxicity using bioassays (laboratory tests that measure the response of animals to sediment that may be contaminated). Sediment toxicity assessments are based on a suite of bioassays that assess different levels of effect and exposure. These may include direct effects of mortality and/or sub-lethal effects of impaired fertilization, abnormal larval development, physiological stress, and biomarkers of exposure to specific chemical con-taminants. Tests may be conducted with whole sediment, pore water trapped between sediment particles, or extracts from sediments. In this study amphipod mortality bioassays using two spe-cies of amphipods were carried out.
2. KACHEMAK BAY STUDY
2.1 Background Despite its extensive coastline of 33,000 miles, greater than the contiguous US (EPA, 2005),
and vast natural marine and coastal resources, Alaska lacks adequate data to provide baseline information necessary to assess future trends. More environmental monitoring and research is

Sediment Quality Triad Assessment in Kachemak Bay 3
needed to assess not only areas of known pollution impact, but also the whole coastal Alaska re-gion. Historically, assessment in the region has been either limited or focused on areas of known impairment.
In collaboration with the U.S. EPA Environmental Monitoring and Assessment Program (EMAP), the Alaska Department of Environmental Conservation conducted a region-wide coastal ecologi-cal condition study that included assessment of contaminants and benthic communities along the Gulf of Alaska and the Aleutian Islands (Saupe et al. 2005). The Cook Inlet Regional Citizens Advisory Council (CIRCAC) assesses, water quality, impacts of oil and gas operations, chemical and benthic community assessment in Cook Inlet. This NS&T study augments these ongoing ef-forts to provide detailed data on sediment quality in Kachemak Bay.
2.2 Site Conditions Kachemak Bay is a 64 km long glacial fjord on the east side of lower Cook Inlet located in south
central Alaska (Figure 1). At the mouth between Anchor Point in the north and Point Pogibshi to the south, Kachemak Bay is nearly 40 km wide but narrows to 10-11 km at Homer Spit which cuts the Bay into inner and outer portions (Figure 2). The inner portion of the Bay behind the spit is approximately 32 km long. Inner Kachemak Bay is composed of a shallow shelf in the north and a deeper zone to the south. The north shore of Kachemak Bay is mostly tidal flats below sandy bluffs with numerous coal seams. The south shore has numerous smaller fjords and em-bayments cut into steep terrain that rises to glaciated valleys and mountain peaks on the Kenai Peninsula. Except for the Jakalof Trench running along its southern edge, inner Kachemak Bay has a relatively flat bottom and averages 46 m in depth. Glaciers have covered and retreated from Kachemak Bay repeatedly over the past 25,000 years. Homer Spit and the Archimandritof Shoals to the west of it may be the result of terminal glacial moraines.
Water circulation in the bay is fueled by the intrusion of saline water from the Gulf of Alaska mak-ing the inner bay a fairly saline environment. Freshwater inputs from rivers, glacial meltwater and precipitation maintain a slightly brackish water mass with an overall salinity range of 18 – 30‰. East of Homer, small canyons cut through the bluff crest, draining the Fritz, McNeil, and Eastland Creeks, as well as numerous other creeks toward the head of the Bay. Glaciers on the Kenai Peninsula contribute meltwater to the bay during the summer months. The amount of flow from glacial rivers can be much higher than from clearwater rivers on the north side. Glacial meltwater carries a large sediment load of clay and silt, and this is what gives them their color. The Fox and Bradley Rivers in the eastern end of the bay deliver large volumes of freshwater and silt to the bay from the Kachemak, Dinglestadt and Chernof Glaciers. which alters water salinity and pos-sibly the water circulation patterns.

4 Sediment Quality Triad Assessment in Kachemak Bay
Kachemak Bay has a complex water circulation pattern (Burbank 1977, KBNERR 2001). The large tides and wind mix the fresh and salty waters that create two circular counterclockwise cur-rents that tend to deposit sediment in the northern portion of the bay (Figure 2). Seasonal winds and summer glacial meltwater sometimes causes two currents to merge into one large ring cov-ering the entire bay. This circulation pattern coupled with the tidal exchange help create diverse habitats such as tidal flats, kelp beds, marshes and eelgrass north of the relatively deep zone in the middle and south portion of the bay. These habitats and the brackish water make the bay an excellent spawning ground for several marine organisms (KBNERR 2001).
This nutrient rich estuarine environment sustains a diverse marine wildlife of important economic value such as fish, shrimp, crabs, and clams. Additionally, hundreds of plant and animal spe-cies inhabit the bay and its watershed, including thriving populations of sea otters, bald eagles, moose, black bears, salmon, Pacific halibut and large number of other marine organisms. The bay supports significant subsistence and commercial fishery resources and it is considered as one of the most productive bays in the U.S. although stocks have been reported to be declining in recent years (Szarzi et al. 2007, ADF&G 1998). Commercial harvests of herring, coonstripe shrimp, and king, Dungeness, and Tanner crabs have been closed due to depressed stock (ADF&G 1998). Other studies point to impacts of natural changes and anthropogenic activities that cause pollution as the overriding causes of the depressed stock (Exxon Valdez Oil Spill Trustee Council 2002).
2.3 Objectives The objectives of this project were to: 1) Identify natural and manmade stressors that influence habitat quality and affect benthic com-
munity health and distribution; 2) Provide baseline chemical concentrations for a suite of metals and organic contaminants; 3) Produce a comprehensive species list and distribution patterns of benthic species in soft bot-
tom substrates.
3. METHODS
The choice of the study location in the northern half of Kachemak Bay was based on the pres-ence of extensive soft bottom habitat, the presence of diverse marine organisms including har-vestable species, and water circulation patterns which would likely deliver contaminants or spilled oil to a depositional area of the bay. The study site was divided into five areas of relatively uni-form habitat: Homer Harbor (HH), intertidal mudflats (WF) and subtidal zones of Coal Bay (WS) to a depth of 10 fathoms, and intertidal mudflats (EF) and subtidal zones (ES) east of Coal Bay to Chugachik Island. Multiple sampling sites were located on a random basis within each area. Three sites were located in Homer Harbor; six sites were located in each area in Coal Bay; and

Sediment Quality Triad Assessment in Kachemak Bay 5
Figure 1. Map of Kachemak Bay study area in Alaska
Figure 2. Map detailing Lower Cook Inlet and Kachemak Bay circulation pattern.

6 Sediment Quality Triad Assessment in Kachemak Bay
seven in both of the areas between Coal Bay and Chugachik Island (Figure 3 Top). In addition, three sites in the vicinity of the Native Village of Port Graham were sampled to assess that area and as a contrast to the Homer area (Figure 3 Bottom).
3.1. Sampling procedures Sediment samples were taken at each site in addition to water quality measurements using stan-
dard NS&T methods. A total of 29 sites were sampled. The samples were subdivided for distribu-tion to various testing laboratories. Samples were collected for grain size measurement, chemical analyses, and toxicity testing. A second sample was taken for benthic community analysis.
3.2. Chemical analysis Chemical analyses followed procedures routinely used in the NOAA NS&T Program (Kimbrough
and Lauenstein 2006a, 2006b, American Society for Testing and Materials [ASTM] 2003). A broad suite of sediment contaminants were analyzed at each station, including 55 Polycyclic Aromatic Hydrocarbons (PAH) , 18 chlorinated pesticides including DDT and its break-down products, 27 Polychlorinated Biphenyls (PCBs), 16 major and trace elements, tributyl-tin and its break-down products. Other parameters included grain size (%sand, silt and clay) and total organic/inorganic carbon (TOC/TIC). Standard water quality measurements were also collected (salinity, dissolved oxygen, clarity, temperature).
Table 1. Number of metals and groups of organic contaminants measured in this study. For simplicity the term metal is used without distinction between true metals and metalloids.
Types of compound Category Number analyzedMetals and metalloids Elements 16Butyltins Antifouling pesticide 3Chlorinated pesticides pesticide 12DDTs pesticides 6PAHs Fossil fuel pollutants 55PCBs Industrial pollutants 27
3.3. Benthic community characterization All animals were identified to species unless the specimen was a juvenile or damaged. The ben-
thic communities were characterized by abundance (number of animals), number of species, and diversity (a type of ratio of abundance and number of species). A special analysis to create a plot of the distribution of different communities called a nodal analysis was done. The first step of a nodal analysis was to cluster the sites based on the species present at the sites. This step yield-ed site groups with similar biological communities. The second step was to cluster the species based on their presence at the sites. This step yielded species groups with similar habitat types. The third step was to plot the results of clustering the sites and species on top of each other in a graphical array (Figure 4). In practice, this is done on large 3’x4’ plots of the cluster analysis output. Reduction to normal text page size sacrifices a significant amount of detail.

Sediment Quality Triad Assessment in Kachemak Bay 7
Figure 3. (Top) Map of Kachemak Bay showing sediment collection sites in Kachemak Bay. The inserts depict sites within Homer Harbor. (Bottom) Map of Kachemak Bay showing sites collected in the Port Graham area. The inserts depict sites within Port Graham.

8 Sediment Quality Triad Assessment in Kachemak Bay
Figure 4. Combined cluster analysis overlays of species clusters and site clusters. The top figure illustrates the dominant species commu-nities found in different site clusters. The lower figure illustrates how different species assemblages distribute themselves between differ-ent habitats.
3.4. Sediment toxicity bioassays Whole sediment mortality bioassays using two species of amphipods (Ampelisca abdita and
Eohaustorius estuarius) were carried out on the sediment samples. All methods are based on standard methods promulgated by the EPA, ASTM, and/or APHA. Results were contrasted to physical and chemical characteristics of the sediment on a site-by-site basis.
High abundanceLow abundance
Species
Sites
Species
SitesHigh abundanceLow abundance
Sediment Quality Triad Assessment in Kachemak Bay 9
4. RESULTS AND DISCUSSION
4.1. Habitat Conditions• The study area is relatively flat with depth varying from 2.6 – 11.2 m at high tide. Beyond this,
the bottom falls off more steeply to more than 23 m depth beyond the shelf (Figure 5 Top). Past the mouth of the Fox River delta, the shelf drops directly into deep water (greater than 30 m).
• The water column is fairly well mixed. Only small differences in salinity, temperature and dis-solved oxygen (DO) were observed between the surface and bottom.
• Water clarity showed a distinct gradient from east to west in the bay, reflecting the turbid inflow of glacial till transported by the Fox and Bradley Rivers (Figure 5 Bottom)
• Both eastern and western subtidal areas have similar sediment texture of sand to sandy mud. • Sediment composition in the intertidal mudflats varied from sandy silt to clayey silt in the eastern
flat; and from sandy mud to silty sand in the western flat (Figure 6 Top). • In the Homer Harbor area, the bottom sediment was mainly composed of fine grained mud. • Total organic carbon (TOC) content demonstrated a distinctive gradient between the eastern and
western areas of the study area (Figure 6 Bottom).
4.2. Chemical Concentrations
4.2.1 Metals• Concentration and distribution of metals are illustrated in Table 2. In Figure 7, each of the trace
metal concentrations shown are normalized to the respective mean concentration on a metal-by-metal basis. This places the values in the same relative scale and allows for comparison of relatively common elements (e.g. zinc) with relatively rare elements (e.g. mercury).
• In general, trace element concentrations in Homer Harbor were slightly elevated relative to other areas.
• Site EF4 in the eastern flats areas showed spikes in the concentration of silver, chromium, cop-per, nickel, mercury, selenium, antimony, and zinc
• Excluding Homer Harbor, metals were found to be significantly elevated in the eastern areas of the bay compared to the western areas.
• Mercury was higher in the western area relative to the eastern areas. • Grain size (% fine) was found to be strongly correlated with metals. Metal concentrations are
elevated in finer grained sediment due to adsorption onto particle surfaces. • Most of the trace element concentrations were below sediment quality guidelines known as the
ERL (Effects range low - concentrations below which toxicity would be expected in less than 10% of bioassay tests) and ERM (Effects range median – concentrations at which toxicity would be expected in 50% of the bioassay tests). Sediment concentrations of arsenic, chromium, cop-per, and zinc were above the ERL in at least one area. Nickel exceeded the ERM in one site.

10 Sediment Quality Triad Assessment in Kachemak Bay
Figure 5. Kachemak Bay habitat characterization. Top: bathymetry with 10 meter isobath contours. (KBNERR, 2001). Bottom: water clarity from Secchi disc measurements. The water column was sig-nificantly more turbid in the east of the bay.
Sediment Quality Triad Assessment in Kachemak Bay 11
Figure 6. Top: spatial distribution of fine sediment (percent silt + clay). Bottom: total organic carbon in sediment at Kachemak Bay study sites.

12 Sediment Quality Triad Assessment in Kachemak Bay
Table 2. Metal concentration ranges in Kachemak Bay sediments. Values are minimum and maximum with the stratum median in parenthesis (μg /g dry weight). Values for Al, Si and Fe are expressed in percentage.*Denotes metal concentration above the ERL values of sediment quality guideline in, at least one site in the study area.
Element Homer Harbor Western Flat Western Subtidal Eastern Flat Eastern Subtidal
Ag 0.115 - 0.15 (0.12) 0.08 – 0.112 (0.10) 0 - 0.074 (0.054) 0.07 - 0.14 (0.1) 0.04 - 0.11 (0.07)
As* 14.1 - 17.9 (14.3) 13.7 - 21.4 (17.9) 18 - 48.6 (30.5) 11 – 26 (15) 15 - 43 (20)
Cd 0.19 - 0.22 (0.21) 0.10 - 0.17 (0.15) 0 - 0.10 (0.08) 0.11 - 0.17 (0.12 0 - 0.14 (0.09)
Cr* 94.3 - 96.2 (95.1) 59.3 -73.5 (66.5) 62 - 68 (63) 67.3 – 110 (73.2) 75 – 109 (83)
Cu* 60.2 - 69.4 (64.7) 20.1 - 40.3 (30.4) 22 - 28 (26) 27.5 - 65.6 (34.2) 24 - 40(32)
Hg* 0.11 - 0.12 (0.12) 0.09 - 0.1 (0.1) 0.09 - 0.1 (0.1) 0.06 - 0.10 (0.07) 0.05 - 1.1 (0.1)
Mn 650 – 703 (702) 467 – 635 (502) 500 – 1080 (642) 507 – 863 (567) 592 – 989 (656)
Ni* 45.5 - 45.9 (45.7) 32.0 - 37.7 (35.1) 33.4 - 43.7 (34.5) 34 - 57 (38) 34 - 44 (40)
Pb 13.9 - 14.9 (13.9) 8.29 - 11.6 (9.78) 8.33 - 9.82 (8.70) 9.22 - 15.2 (11.2) 8.56 - 13.6 (11.5)
Sn 1.26 - 1.34 (1.29) 0.93 - 1.33 (1.20) 0.93 - 1.79 (1.10) 1.0 - 2.0 (1.09) 0.9 - 1.8 (1.5)
Se 0.30 - 0.33 (0.3) 0.15 - 0.30 (0.20) 0.0 - 0.27 (0.13) 0.11 - 0.3 (0.2) 0.0 - 0.2 (0.1)
Sn 1.82 - 2.02 (2.01) 1.33 - 1.69 (1.45) 1.13 - 1.72 (1.28) 1.4 - 2 (1.5) 1.5 - 1.8 (1.6)
Zn 144 – 158 (152) 74.5 - 92.6 (82.2) 74 - 83.4 (81.6) 82 – 139 (90) 78 - 97 (91)
Al (%) 7.68– 8.55 (7.69) 6.25 – 7.21 (6.42) 6.6 – 7.2 (7.0) 7.3 – 8.4 (7.6) 6.6 – 7.5 (7.1)
Si (%) 25.7 – 28.8 (25.8) 25.0 – 29.9 (28.3) 27.5 – 32.5 (30.5) 27 – 31 (29) 26.1 – 30.5 (30)
Fe (%) 4.7 – 4.9 ( 4.8) 3.2 – 3.9 (3.6) 3.57 – 6.1 (4.1) 3.3 – 5.3 (3.8) 3.5 – 4.4 (4.2)

Sediment Quality Triad Assessment in Kachemak Bay 13
Figure 7. Mean normalized concentrations for trace metals in Kachemak Bay sediments (site concen-tration of each metal and organic class was divided by the overall mean of the metal). EF4 is eastern flat station #4.
0
2
4
6
8
10
12
14
16
18
Nor
mal
ized
Con
cent
ratio
n
Ag As Cd Cu Cr Hg Ni Pb Sb Se Zn
Homer Harbor Western Flat Western Subtidal Eastern Flat Eastern Subtidal
EF-4
4.2.2 Comparison to other studies• These results agree with the EMAP findings. Data published by Saupe et al. (2005) also indicat-
ed that concentrations of antimony, arsenic, chromium, copper, mercury and zinc were relatively elevated in the inner Kachemak Bay.
• The National Status and Trends Mussel Watch Program has monitoring sites in southeast Alaska and the Gulf of Alaska (Kimbrough et al. 2008). Compared to the 1995-1997 Mussel Watch sedi-ment data from Prince William Sound, the concentrations of metals in Kachemak Bay had similar ranges with the exception of mercury, which was relatively elevated in Kachemak Bay (Figure 8). Mercury concentration, and particularly its biomagnification in aquatic food chain, is a concern in Alaska. In Kachemak Bay the source of mercury may be linked to both geological and anthro-pogenic sources. The Cook Inlet basin that encompasses Kachemak Bay and its watershed lies on top of large coal deposits (Flores et al. 2004). Coal has been mined for export and burned for electricity in the Homer region. Coal-fired power plants emit mercury, but its presence in Kache-mak Bay sediments may be of atmospheric and/or geological source.
• Cadmium, while high relative to the rest of the system, is nevertheless well below the ERM and ERL. Mercury exceeds the ERL, but the high concentration is half of the ERM. Chromium is nearly at the ERL level.
14 Sediment Quality Triad Assessment in Kachemak Bay
4.2.3 Human versus natural sources
Because all metals have both natural and man-made sources, it is important to identify back-ground metal concentrations in a given study area. To help account for differences in metal concentrations among background samples and thereby identify man-made inputs, metal values are often normalized to iron or aluminum. Natural values for iron and aluminum, and many trace metals, also vary as a function of sediment grain size, mineralogy and organic carbon content with higher metal concentrations in fine-grained sediments. Without human inputs, metal concen-trations are expected to co-vary with grain size and aluminum.
• Most metals were correlated with Al and grain size composition of the sediment in Kachemak Bay (Figure 9). Homer Harbor and station EF-4 usually had the highest concentrations.
• Mercury and selenium did not correlate with aluminum concentrations.• Likely sources of metals in Kachemak Bay are natural bedrock weathering and material trans-
ported from mountains by rivers and streams of glacial meltwater.
0
20
40
60
80
100
120
140
160
180
HH WF WS EF ES Homer Kodiak GOA Skagway Valdez PWS
mg/
kg
Chromium
0.00
0.05
0.10
0.15
0.20
0.25
0.30
0.35
HH WF WS EF ES Homer Kodiak GOA Skagway Valdez PWS
mg/
kg
Cadmium
0
5
10
15
20
25
30
35
HH WF WS EF ES Homer Kodiak GOA Skagway Valdez PWS
mg/
kg
Arsenic
0.00
0.02
0.04
0.06
0.08
0.10
0.12
0.14
HH WF WS EF ES Homer Kodiak GOA Skagway Valdez PWS
mg/
kg
Mercury
Figure 8. Selected metals sediment concentrations from the present study and averaged Mussel Watch data from southern Alaska. (Homer = Homer spit; GOA = Gulf of Alaska; PWS = average of 5 sites in Prince William Sound).

Sediment Quality Triad Assessment in Kachemak Bay 15
40
60
80
100
120
6 7 8 9
Cr
mg
/ kg
Al %
Chromium
0
0.1
0.2
0.3
6 7 8 9
Cd
mg
/ kg
Al %
Cadmium
0.04
0.06
0.08
0.1
0.12
0.14
6 7 8 9
Hg
mg
/ kg
Al %
Mercury
0
0.05
0.1
0.15
0.2
0.25
0.3
0.35
6 7 8 9
Se m
g / k
g
Al %
Selenium
6
8
10
12
14
16
6 7 8 9
Pb m
g / k
g
Al %
Lead
30
40
50
60
6 7 8 9
Ni
mg
/ kg
Al %
Nickel
40
60
80
100
120
140
160
180
6 7 8 9
Zn m
g / k
g
Al %
Zinc
20
30
40
50
60
70
6 7 8 9
Cu
mg
/ kg
Al %
Copper
Figure 9. Plots of chromium, cadmium, mercury, selenium, lead, copper, nickel and zinc (mg/kg) as a function of aluminum concentration in Kachemak Bay sediments. Solid triangles - Kachemak Bay; open squares – Homer Harbor.

16 Sediment Quality Triad Assessment in Kachemak Bay
• Outside of the harbor, anthropogenic inputs are negligible as the human population density is low and no large scale industrial activities exist in the region.
• However long range atmospheric transport is generally considered as a nonpoint source of air-born contaminants in the arctic environment (Arctic Monitoring and Assessment Program , AMAP, 2005). Thus transboundary air pollution may contribute to the overall metals concentration in the region to some extent.
4.2.4 Organic contaminants Organic contaminants were found at low levels throughout the study area. Relative concentra-
tions of the organic contaminants in each area are presented in Figure 10. Absolute concentra-tions are shown in Figure 11.• Total PAHs concentrations in the study area were low.• Most of organic compounds are nearly ten times higher in Homer Harbor relative to other areas. • Hexachlorocyclohexane (HCHs), which were present in subtidal and mudflat areas, were not
detected in the Harbor.
Nor
mal
ized
Con
cent
ratio
n
Figure 10. Mean normalized concentrations for organic contaminants in Kachemak Bay sediments (site concentration of each metal and organic class was divided by the overall mean of the organic class).
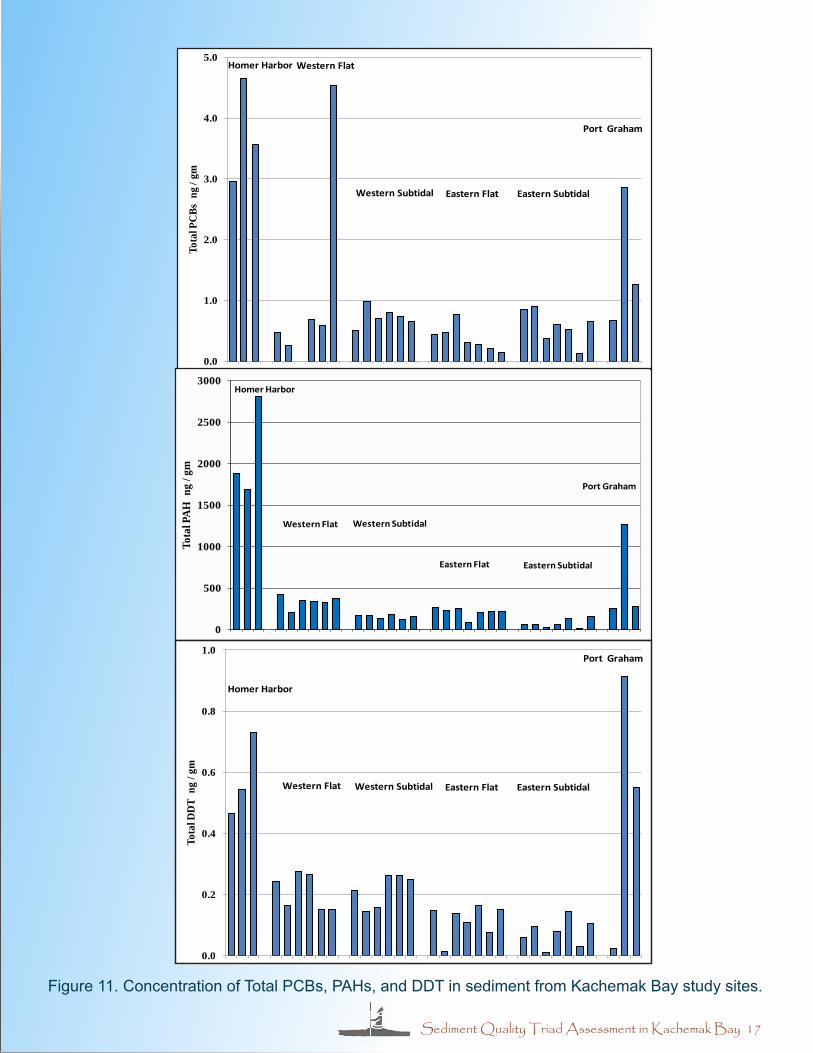
Sediment Quality Triad Assessment in Kachemak Bay 17
Figure 11. Concentration of Total PCBs, PAHs, and DDT in sediment from Kachemak Bay study sites.
0.0
1.0
2.0
3.0
4.0
5.0
Tota
l PC
Bs n
g / g
m
Homer Harbor
Eastern SubtidalEastern FlatWestern Subtidal
Western Flat
Port Graham
0
500
1000
1500
2000
2500
3000
Tota
l PA
H n
g / g
m
Homer Harbor
Eastern SubtidalEastern Flat
Western SubtidalWestern Flat
Port Graham
0.0
0.2
0.4
0.6
0.8
1.0
Tota
l DD
T n
g / g
m
Homer Harbor
Eastern SubtidalEastern FlatWestern SubtidalWestern Flat
Port Graham

18 Sediment Quality Triad Assessment in Kachemak Bay
• Homer Harbor had elevated PCB concentrations (up to 4 µg/kg) while most stations were below 1.0 µg/kg. Elevated PCBs (2.2 ng /gm) were detected in the western intertidal area near
Miller’s Landing. • Overall, PCB concentrations in the study area are very low, and even in Homer Harbor they
are well below sediment quality guidelines. • The distribution of total DDTs was similar to that of the PAHs. • Cyclodiene insecticides (chlordanes, heptachlors, nonachlors, aldrin, dieldrin, endrin and endo-
sulfan) were also found at most sites in the study area, but concentrations were very low. • Butyltins were above detection limits only in the harbor.
4.2.5 Comparison to other studies Overall, the concentrations of organic contaminant including PCBs, pesticides and butyltins in
Kachemak bay were very low. Concentration levels were comparable to the national Status and Trends Mussel Watch monitoring data in Alaska reported by Kimbrough et al. (2008).
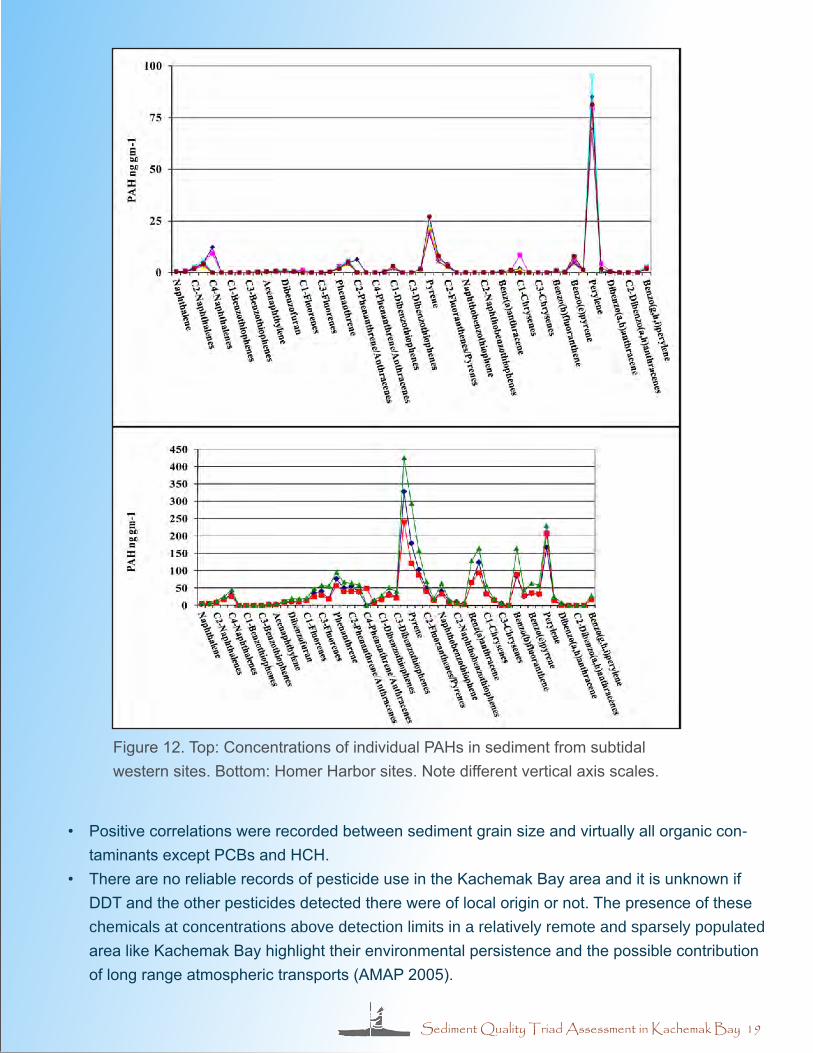
4.2.6 Human versus natural sources The levels and distributions of PAHs is of great interest in the region. In south central Alaska, the
presence of PAHs in coastal and estuarine environments is often linked to the Exxon Valdez Oil Spill. Sources of PAHs are both petrogenic and pyrogenic. Petrogenic PAHs originate from natu-ral releases from petroleum and coal deposits, or spills. Pyrogenic PAHs are formed as a result of combustion of organic materials such as fuel, trash, or wood. Usually, high proportions of low molecular weight PAHs are associated with oil and petroleum releases (petrogenic source). A high proportion of high weight PAHs is often linked to combustion by-products and/or long-term weathering. However, outside the harbor, by far the largest component of PAHs was perylene (Figure 12). This is a natural by-product of the breakdown of terrestrial plant material. So, the contribution of anthropogenic PAHs in the bay is extremely limited. Even in the harbor, the total concentrations are relatively low, being below the ERL guideline.
• In Kachemak Bay the dominant PAH was perylene, usually accounting for 40-60% of the total PAHs. Perylene is a natural product from old plant material as opposed to petroleum, coal, or pyrogenic pollution sources.
• In the harbor, total PAHs concentration varied from 1,600 to over 2,800 ng /gm. The elevated concentrations of pyrene and other unsubstituted high molecular weight compounds, with lower concentrations of alkylated compounds, are indicative of pyrogenic sources (burned fuel).
• Aliphatic organic compound (hydrocarbons without aromatic benzene rings, e.g. PAHs) characteristics did not indicate the presence of oil pollution except to a small degree within
Homer Harbor.• The presence of butyltins in the harbor is due to the use of antifouling paint applied to boat
hulls. The sloughing paint chips from hulls, and the slow release from the paint into the water, cleaning boat hulls and uncontrolled runoff from power washing hulls that falls directly into the harbor increases ambient environmental levels (Figure 13).
Sediment Quality Triad Assessment in Kachemak Bay 19
Figure 12. Top: Concentrations of individual PAHs in sediment from subtidal western sites. Bottom: Homer Harbor sites. Note different vertical axis scales.
• Positive correlations were recorded between sediment grain size and virtually all organic con-taminants except PCBs and HCH.
• There are no reliable records of pesticide use in the Kachemak Bay area and it is unknown if DDT and the other pesticides detected there were of local origin or not. The presence of these chemicals at concentrations above detection limits in a relatively remote and sparsely populated area like Kachemak Bay highlight their environmental persistence and the possible contribution of long range atmospheric transports (AMAP 2005).

20 Sediment Quality Triad Assessment in Kachemak Bay
4.3 Benthic Community Characterization Benthic community analysis indicates the primary influences on community distributions are
depth and proximity to the outflow from the Fox and Bradley Rivers. Stressed sites were charac-terized by low diversity and abundance. There were shoreline stressed sites which are exposed for many more hours per day than they are submerged, and many species cannot tolerate those conditions. There were stressed sites in the east end of the bay and one in Homer Harbor. The sites in the east are impacted by the high sediment loads from glacial meltwater. The Homer Har-bor site was very fine grained mud which was dominated by one species. The remaining intertidal and subtidal habitats each contained distinct species assemblages that segregate themselves into turbid and clear water habitats. All sites were characterized by the presence of a small num-ber of dominant species, and a much larger number of less numerous taxa.
• Polychaete worms had the highest number of taxa at every station, and were the most numer ous at all but four stations. Clams were the next most abundant taxa. Snails and crustaceans were more numerous and diverse in the western stations.
• There was a strong gradient of increasing species abundance (Figure 14 Top) and diversity from east to west (Figure 14 Bottom). Some stations close to the shoreline also exhibited low abundance and diversity.
• High diversity was negatively correlated with increasing proportions of fine grained sediment but positively correlated with TOC and water clarity.
• Contaminant concentrations did not appear to impact the biota. • The nodal analysis identified four major habitat groups shown in Figure 15. The majority of
sites were divided into intertidal and subtidal sites, in addition to shoreline and stressed site clusters which were characterized by relatively low abundance and species richness (Table 4).
• There were three main groups of species. Cosmopolitan species were found in all four types
Figure 13. Grids used for boat hull cleaning and maintenance operations in Homer Harbor.

Sediment Quality Triad Assessment in Kachemak Bay 21
Figure 14. Top: Benthic species abundance. Bottom: Benthic species diversity distribution. Strong east-west gradients of increasing species abundance and diversity were observed.
22 Sediment Quality Triad Assessment in Kachemak Bay
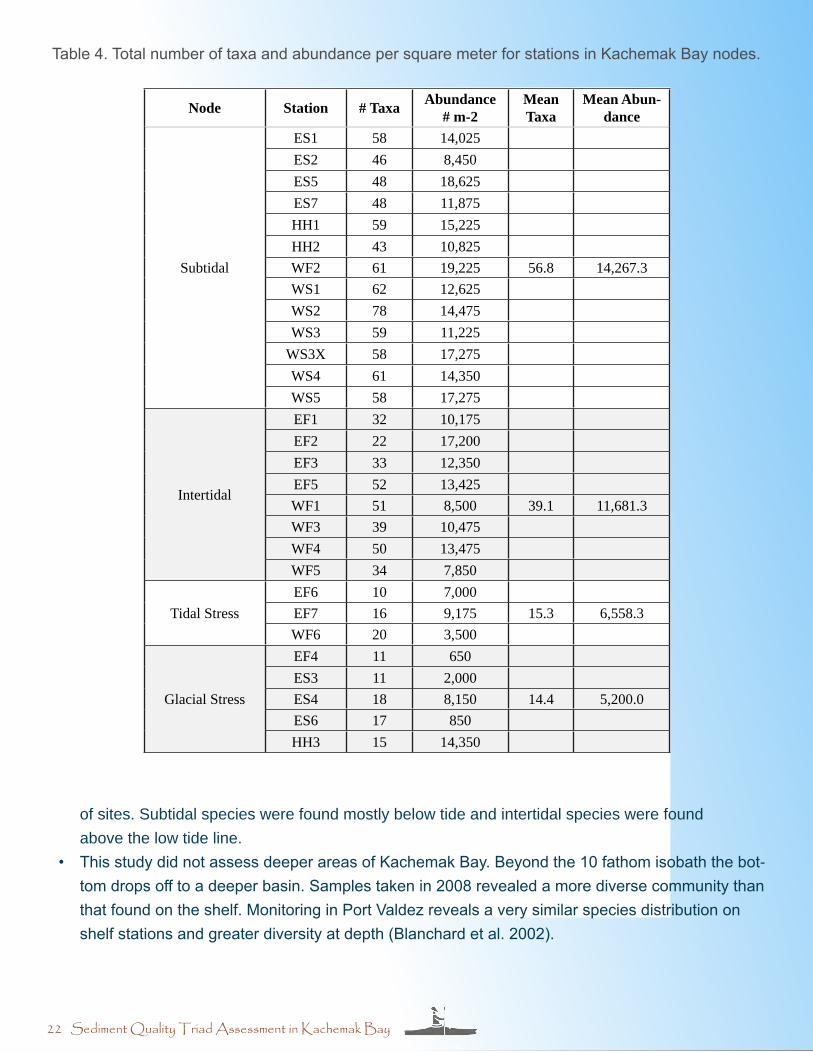
Table 4. Total number of taxa and abundance per square meter for stations in Kachemak Bay nodes.
Node Station # Taxa Abundance# m-2
Mean Taxa
Mean Abun-dance
Subtidal
ES1 58 14,025ES2 46 8,450ES5 48 18,625ES7 48 11,875HH1 59 15,225HH2 43 10,825WF2 61 19,225 56.8 14,267.3WS1 62 12,625WS2 78 14,475WS3 59 11,225
WS3X 58 17,275WS4 61 14,350WS5 58 17,275
Intertidal
EF1 32 10,175EF2 22 17,200EF3 33 12,350EF5 52 13,425WF1 51 8,500 39.1 11,681.3WF3 39 10,475WF4 50 13,475WF5 34 7,850
Tidal StressEF6 10 7,000EF7 16 9,175 15.3 6,558.3WF6 20 3,500
Glacial Stress
EF4 11 650ES3 11 2,000ES4 18 8,150 14.4 5,200.0ES6 17 850HH3 15 14,350
of sites. Subtidal species were found mostly below tide and intertidal species were found above the low tide line.
• This study did not assess deeper areas of Kachemak Bay. Beyond the 10 fathom isobath the bot-tom drops off to a deeper basin. Samples taken in 2008 revealed a more diverse community than that found on the shelf. Monitoring in Port Valdez reveals a very similar species distribution on shelf stations and greater diversity at depth (Blanchard et al. 2002).
Sediment Quality Triad Assessment in Kachemak Bay 23
4.4 Sediment Toxicity In general, no significant toxicity was observed in any of the areas including Homer Harbor.
• The Eohaustorius estuarius, bioassay demonstrated significant toxicity at one station near the Fox River (Figure 16 Top). The site had extremely fine grained muddy sediment but also had
elevated metals concentrations.• The Ampelisca abdita bioassays demonstrated significantly reduced survival at only one station
in Coal Bay Figure 16 Bottom. While survival was statistically reduced relative to controls, it was above 80% and is therefore considered to be an indicator of only marginal effect.
5.0 Supplemental Samples at Port Graham While the concentration distributions are instructive relative to fate and transport processes, none
of the levels at any location indicate the potential for immediate concern. PCBs and mercury do bioaccumulate in the food chain however, so source identification and reduction should be a management objective.
5.1 Organics and metals concentrations• One station in Port Graham had a similar distribution of PAHs as was found in Homer Harbor
(Figure 11), with indications of contributions from fuel and combustion by-products (Figure 17).
Figure 15. Benthic species nodal distribution.
24 Sediment Quality Triad Assessment in Kachemak Bay
Figure 16. Top: Eohaustorius estuarius, bioassays demonstrated significant toxicity at one station near the Fox River. Bottom: Ampelisca abdita bioassay demonstrated significantly reduced survival at one station in Coal Bay.

Sediment Quality Triad Assessment in Kachemak Bay 25
• The single station in Port Graham where PAHs were elevated, also had elevated PCBs relative to the other stations, but was below the levels in Homer Harbor (Figure 11).
• Concentrations of DDT showed a slightly different pattern, in which the highest concentration was seen at Port Graham (Figure 11).
• The remaining pesticides and related compounds were generally found at or below detection limits.
• Metals concentrations in greater Kachemak Bay and Port Graham Bay sediments were quite different and may be an indication of significant differences in geologic composition of the water-shed as much as man-made contamination.
• Cadmium, mercury, and selenium were elevated 4-6 times above the average levels at station PG-3c (Figure 18A). Chromium, selenium, and cadmium were elevated at station PG-4b, located toward the head of the bay. Conversely, arsenic, antimony, and lead at all three Port Graham
Figure 17 . Concentrations of individual PAH compounds found at three Port Graham stations. The PAH signature for Port Graham appears slightly different from other Kachemak Bay study sites, in-dicative of source differences. Site PG3c resembles Homer Harbor.
0
25
50
75
100
125PA
H n
g / g
m
PG-2 PG-3C PG-4b

26 Sediment Quality Triad Assessment in Kachemak Bay
sites were approximately half the concentrations seen in Kacheamk Bay (Figure 18B). Concen-trations at station PG-2, located directly across the bay from the village were otherwise unre-markable.
• Given the well documented harmful biological consequences of cadmium, mercury, chromium and selenium, a follow-up study to assess bioavailability and bioaccumulation may be warranted.
5.2 Benthos and sediment toxicity• Sediment toxicity tests at Port Graham showed significant toxicity results only with A. abdita at
station PG3c. Survival was reduced to 68.8%. All the other tests resulted in survival rates of 90% or more. Significant reduction in survival was not observed in the E. estuarius bioassays.
• Samples were also taken at Port Graham to assess the presence of Clostridium perfringens in the sediment as an indicator of possible sewage contamination. C. perfringens counts were
0
100
200
300
400
500
600
700Pe
rcen
t of M
ean
Con
cent
ratio
n
Cd Cr Hg Se
Figure 18A. Relative concentrations of four elements (cadmium, chromium, mercury, selenium) in Kachemak Bay sampling areas and extra sampling stations at Port Graham. Concentrations are normalized to the overall mean concentration in the Kachemak Bay only (excluding Port Graham) and expressed as a percentage.
Sediment Quality Triad Assessment in Kachemak Bay 27
0
50
100
150
200
250Pe
rcen
t of M
ean
Con
cent
ratio
n
As Pb Sb
Figure 18B. Relative concentrations of three elements (arsenic, lead, antimony) in Kachemak Bay sampling areas and extra sampling stations at Port Graham. Concentrations are normalized to the overall mean concentration in the Kachemak Bay only (excluding Port Graham) and expressed as a percentage.
elevated at station PG3c relative to the other stations (436/gm wet vs. 85 and 161). Sediment quality guidelines for C. perfringens do not currently exist. While the value at station PG3c is well below what might be expected in the proximity of a sewage outfall, it is elevated relative to the other stations, indicating that conditions favor propagation of pathogenic bacteria. The sediments were organically enriched and anoxic. In the NS&T data base, values of 500 or more spores /gm are generally (but not always) found in the vicinity of urban areas.
• Of the 239 total taxa found in Kachemak Bay, 79 were also found in Port Graham. However, 45 taxa were identified in Port Graham that were not seen in the larger bay. None of the Port Gra-ham stations were intertidal, so that portion of the community was largely missing. In addition, the species in deep sandy habitats found in the larger bay were absent in Port Graham. Port Graham station PG3c was particularly depauperate in diversity.
28 Sediment Quality Triad Assessment in Kachemak Bay
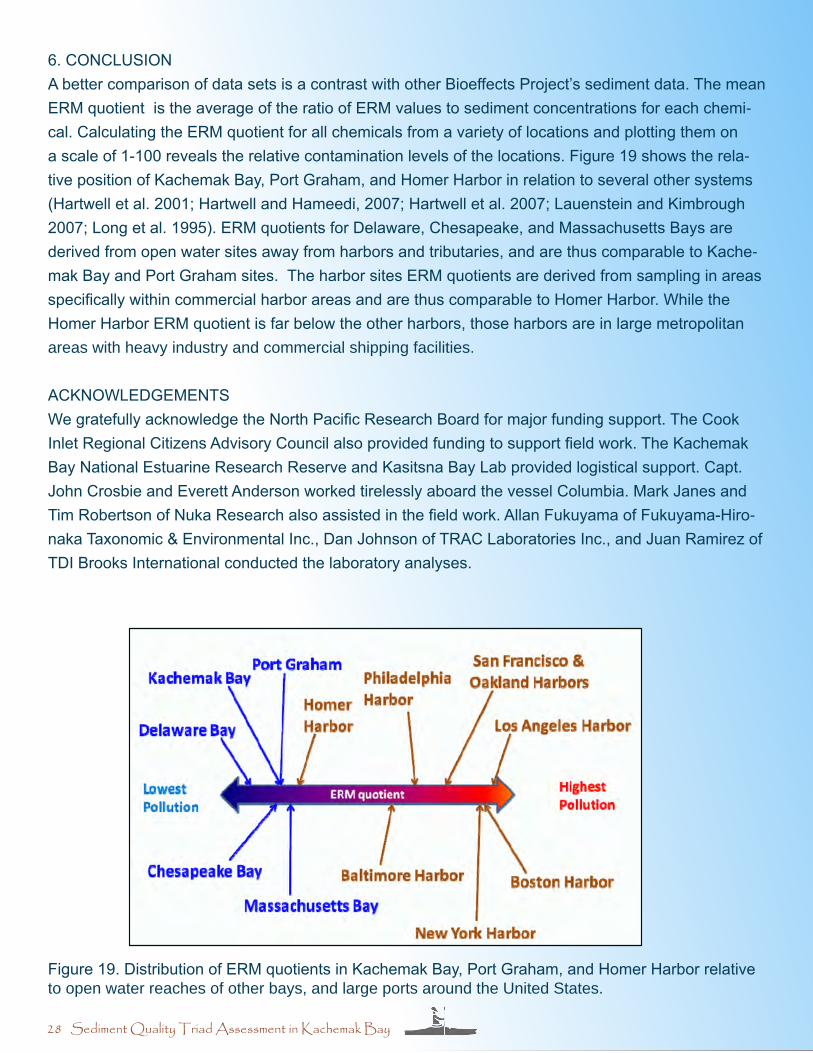
6. CONCLUSIONA better comparison of data sets is a contrast with other Bioeffects Project’s sediment data. The mean ERM quotient is the average of the ratio of ERM values to sediment concentrations for each chemi-cal. Calculating the ERM quotient for all chemicals from a variety of locations and plotting them on a scale of 1-100 reveals the relative contamination levels of the locations. Figure 19 shows the rela-tive position of Kachemak Bay, Port Graham, and Homer Harbor in relation to several other systems (Hartwell et al. 2001; Hartwell and Hameedi, 2007; Hartwell et al. 2007; Lauenstein and Kimbrough 2007; Long et al. 1995). ERM quotients for Delaware, Chesapeake, and Massachusetts Bays are derived from open water sites away from harbors and tributaries, and are thus comparable to Kache-mak Bay and Port Graham sites. The harbor sites ERM quotients are derived from sampling in areas specifically within commercial harbor areas and are thus comparable to Homer Harbor. While the Homer Harbor ERM quotient is far below the other harbors, those harbors are in large metropolitan areas with heavy industry and commercial shipping facilities.
ACKNOWLEDGEMENTSWe gratefully acknowledge the North Pacific Research Board for major funding support. The Cook Inlet Regional Citizens Advisory Council also provided funding to support field work. The Kachemak Bay National Estuarine Research Reserve and Kasitsna Bay Lab provided logistical support. Capt. John Crosbie and Everett Anderson worked tirelessly aboard the vessel Columbia. Mark Janes and Tim Robertson of Nuka Research also assisted in the field work. Allan Fukuyama of Fukuyama-Hiro-naka Taxonomic & Environmental Inc., Dan Johnson of TRAC Laboratories Inc., and Juan Ramirez of TDI Brooks International conducted the laboratory analyses.
Figure 19. Distribution of ERM quotients in Kachemak Bay, Port Graham, and Homer Harbor relative to open water reaches of other bays, and large ports around the United States.
Sediment Quality Triad Assessment in Kachemak Bay 29
LITERATURE CITED
ADF&G. 1998. Final Environmental Impact Statement/Final Management Plan. Kachemak Bay Na-tional Estuarine Research Reserve. Online at www.habitat.adfg.state.ak.us.
AMAP, Arctic Monitoring Assessment Program. 2005. AMAP Assessment 2002: Heavy Metals in the Arctic. Arctic Monitoring and Assessment Program (AMAP), Oslo, Norway. xvi + 265 pp. (first pub-lished as electronic document in 2004). www.amap.no
American Society for Testing and Materials (ASTM). 2003. Standard Test Method for Measuring the Toxicity of Sediment-Associated Contaminants with Estuarine and Marine Invertebrates Designation E-1367-03. Annual Book of Standards, 11.05. American Society of Testing and Materials, Philadel-phia, PA, USA.
Blanchard, A.L., Feder, H.M. and Shaw, D.G. 2002. Long-term investigation of benthic fauna and the influence of treated ballast water disposal in Port Valdez, Alaska. Marine Pollution Bulletin, 44 (5):367-382.
Burbank, D.C. 1977. Circulation studies in Kachemak Bay and lower Cook Inlet, Volume III of En-vironmental Studies of Kachemak Bay and lower Cook, Trasky et al. (eds) Marine/Coastal Habitat Management Report, Alaska Department of Fish and Game. Anchorage, AK.
Exxon Valdez Oil Spill Trustee council. 2002. Update on injured resources and services. Exxon Val-dez Oil Spill Restoration Plan. Anchorage, Alaska.
Flores, R.M., Stricker, G.D. and Kinney, S.A. 2004. Alaska, Coal Geology, Resources, and Coalbed Methane Potential. Department of Interior, U.S. Geological Survey, U.S. DDS-77, Denver, Colorado.
Harmon, M., Pait, A.S., and Hameedi, M.J.. 2003. Sediment Contamination, Toxicity, and Macroinver-tebrate Infaunal Community in Galveston Bay. NOAA Tech. Memo. NOS NCCOS CCMA 122. Silver Spring, MD: NOAA, NOS, Center for Coastal Monitoring and Assessment. 66pp
Hartwell, S.I., D. Apeti, M. Moore, and A. Mason. 2007. Characterization of Chemical Contaminants. In Battista T, Clark R, and Pittman S (eds.). An Ecological Characterization of the Stellwagen Bank National Marine Sanctuary Region: Oceanographic, Biogeographic, and Contaminants Assessment, NOAA Technical Memorandum NOS NCCOS 45, Silver Spring, MD. Nov. 2006. Chapter 2, p59-88.
Hartwell, S.I. and J. Hameedi. 2007. Magnitude and Extent of Contaminated Sediment and Toxicity in Chesapeake Bay. NOAA Technical Memorandum NOS/NCCOS/CCMA 47. National Oceanic and Atmospheric Administration, National Ocean Service, Silver Spring, MD, 234 pp.
Hartwell, S.I., J. Hameedi and, M. Harmon. 2001. Magnitude and Extent of Contaminated Sediment and Toxicity in Delaware Bay. NOAA Technical Memorandum NOS/NCCOS/CCMA 148. National Oce-anic and Atmospheric Administration, National Ocean Service, Silver Spring, MD, 107pp.
Kachemak Bay National Estuarine Research Reserve (KBNERR). 2001. Kachemak Bay Ecological Characterization. CD-ROM. NOAA/CSC/20017-CD. Charlston, SC.

30 Sediment Quality Triad Assessment in Kachemak Bay
Kimbrough, K. L., & Lauenstein, G.G. 2006. Trace Metal Analytical Methods of the National Status and Trends Program: 2000-2006. US Dept. Comm., NOAA Technical Memorandum 29, NOS NC-COS, Silver Spring, MD.
Kimbrough, K.L. and Lauenstein, G.G., eds. 2006. Organic Contaminant Analytical Methods of the National Status and Trends Program: Update 2000-2006. NOAA Technical Memorandum NOS NC-COS 30, 137 pp.
Kimbrough, K.L, Johnson, W.E., Lauenstein, G.G., Christensen, J.D. and Apeti, D.A. 2008. An As-sessment of Two Decades of Contaminant Monitoring in the Nation’s Coastal Zone. Silver Spring, MD. NOAA Technical Memorandum, NOS NCCOS 74. 105pp.
Lauenstein, G.G. and Kimbrough, K.L. 2007. Chemical contamination of the Hudson-Raritan Estuary as a result of the attack on the World Trade Center: Analysis of polycyclic aromatic hydrocarbons and polychlorinated biphenyls in mussels and sediment. Mar Poll. Bull. 54:284-294.
Llansó, R.J., Kelly, F.S., Scott, L.C. 2004. Chesapeake Bay Water Quality Monitoring Program Long-Term Benthic Monitoring and Assessment Component Level1 Comprehensive Report, July 1984 – Dec. 2003 (VOLUME 1). Final Report to Maryland Dept. of Nat. Res., Annapolis, MD. 88pp.
Long, E.R. 2000. Spatial extent of sediment toxicity in U.S. estuaries and marine bays. Environmental Monitoring and Assessment 64:391-407.
Long, E.R., MacDonald, D.D., Smith, S.L., Calder, F.D. 1995. Incidence of adverse biological effects within ranges of chemical concentrations in marine and estuarine sediments. Environ. Manag. 19:81-97.
Long, E.R., Robertson, A., Wolfe, D.A., Hameedi, J. and Sloane, G.M. 1996. Estimates of the spatial extent of sediment toxicity in major U.S. estuaries. Environmental Science & Technology 30(12):3585-3592.
Saupe, S.M., Gendron, J., and Dasher, D. 2005. The Condition of Southcentral Alaska Coastal Bays and Estuaries. A Statistical Summary for the National Coastal Assessment Program Alaska Depart-ment of Environmental Conservation, MARCH 15, 2006.
Szarzi, N.J. C.M. Kerkvliet, C.E. Stock and M.D. Booz. 2007. Recreational Fisheries in the Lower Cook Inlet Management Area, 2005-2007, with updates for 2004. Alaska Department of Fish and Game, Division of Sport Fish and Commercial Fish, Fishery Management Report No. 07-55, Anchor-age Alaska.
Turgeon, D.D., Hameedi J., Harmon, M.R, Long, E.R., McMahon, K.D., and White, H.H. 1998. Sedi-ment toxicity in U.S. coastal waters. Special report, NOAA, National Status and Trends Program. Silver Spring, Maryland. 20 pp.
U.S. Environmental protection Agency (EPA). 2005. Coastal Condition Report for Alaska, Hawaii and island Territories. National Coastal Condition Report II. pp 215-246.
Wolfe, R.J. 1996. Subsistence food harvests in rural Alaska and food safety issues. Proceeding of the Institute of Medicine, National Academy of Sciences Committee on Environmental Justice, Spokane, WA.


Sediment Quality Triad Assessment in Kachemak Bay: Characterization of Soft Bottom Benthic Habitats and
Contaminant Bioeffects AssessmentS. Ian Hartwell, A. Dennis Apeti, W. Larry Claflin, W. Edward Johnson,
and L. Kimani KimbroughNational Oceanic and Atmospheric Administration


