WHO South-East Asia Journal of Public Health | January-June 2015 | 4 (1) 45 Access this article online Website: www.searo.who.int/ publications/journals/seajph Quick Response Code: Original research A cross-sectional study of exposure to mercury in schoolchildren living near the eastern seaboard industrial estate of Thailand Punthip Teeyapant, Siriwan Leudang, Sittiporn Parnmen ABSTRACT Background: Industrial activity in Thailand’s coastal areas has significantly increased mercury concentrations in seawater, causing accumulation through the food chain. Continuous exposure to mercury has been linked to bioaccumulation in living organisms and potential adverse health effects in children. Methods: Blood samples were collected from 873 schoolchildren aged 6–13 years living in four sites near the eastern seaboard industrial estates of the Gulf of Thailand in 2011. Total mercury level in whole blood (Hg-B) was compared with standard reference values. Results: Mean (± standard deviation) concentrations of Hg-B from schoolgirls (2.19 ± 0.5 μg/L; n = 405) and schoolboys (2.29 ± 0.3 μg/L; n = 468) did not exceed the regulatory limits of the United States Environmental Protection Agency (US EPA), the German Commission on Human Biological Monitoring (HBM I, II) or Clarke’s analysis of drugs and poisons reference values. Nevertheless, 67 children (34 girls and 33 boys) had individual values that exceeded the lowest of these standards (4 μg/L). Conclusion: The relatively low concentrations of Hg-B detected in this study suggested a relatively low risk for schoolchildren. However, 67 children had elevated mean total Hg-B concentrations, especially in the two sites located nearest the industrial area. This information may serve as an early warning of the potential for pollution to affect children living around industrial areas. Further regular monitoring, including studies assessing the health impact of mercury pollution in this region of Thailand, is to be encouraged. Key words: blood levels, eastern seaboard industrial estate, Environmental Protection Agency, German Commission on Human Biological Monitoring, mercury, schoolchildren, Thailand Toxicology Centre, National Institute of Health, Department of Medical Sciences, Ministry of Public Health, Thailand Address for correspondence: Dr Sittiporn Parnmen, Toxicology Centre, National Institute of Health, Department of Medical Sciences, Ministry of Public Health, Nonthaburi, 11000 Thailand Email: [email protected]INTRODUCTION The eastern seaboard development programme was introduced during Thailand’s fifth National Economic and Social Development Plan (1981–1984). 1 The programme plays an important role in Thailand’s economy and covers an area of four provinces: Chon Buri, Chachoengsao, Rayong and Samut Prakan. Economic activities in the coastal area of these provinces include agriculture, fisheries and tourism, as well as heavy industry, and the area is also populated with urban communities. Map Ta Phut Industrial Estate (MTPIE) is a large industrial park located in Rayong province, which was established in 1989 by state enterprises, under the management of the Industrial Estate Authority of Thailand. 2 It serves as a heavy industrial zone, with a gas separation plant, oil refineries, petrochemical industries and chemical plants. 1,3 As a result of these industrial activities, increasing mercury levels have been recorded in the coastal areas by the heavy metal monitoring scheme, which was started in 1974. 2 During the period of 1995 to 1998, high mercury levels were detected in MTPIE, especially in the area around the natural gas platform and the inner Gulf zone, owing to the release of mercury from discharged water produced from oil and gas activities. 2,4 The Pollution Control Department of the Ministry of Natural
Transcript
WHO South-East Asia Journal of Public Health | January-June 2015 | 4 (1) 45
Access this article onlineWebsite: www.searo.who.int/publications/journals/seajph
Quick Response Code:
Original research
A cross-sectional study of exposure to mercury in schoolchildren
living near the eastern seaboard industrial estate of Thailand
ABSTRACTBackground: Industrial activity in Thailand’s coastal areas has significantly increased mercury concentrations in seawater, causing accumulation through the food chain. Continuous exposure to mercury has been linked to bioaccumulation in living organisms and potential adverse health effects in children.
Methods: Blood samples were collected from 873 schoolchildren aged 6–13 years living in four sites near the eastern seaboard industrial estates of the Gulf of Thailand in 2011. Total mercury level in whole blood (Hg-B) was compared with standard reference values.
Results: Mean (± standard deviation) concentrations of Hg-B from schoolgirls (2.19 ± 0.5 μg/L; n = 405) and schoolboys (2.29 ± 0.3 μg/L; n = 468) did not exceed the regulatory limits of the United States Environmental Protection Agency (US EPA), the German Commission on Human Biological Monitoring (HBM I, II) or Clarke’s analysis of drugs and poisons reference values. Nevertheless, 67 children (34 girls and 33 boys) had individual values that exceeded the lowest of these standards (4 μg/L).
Conclusion: The relatively low concentrations of Hg-B detected in this study suggested a relatively low risk for schoolchildren. However, 67 children had elevated mean total Hg-B concentrations, especially in the two sites located nearest the industrial area. This information may serve as an early warning of the potential for pollution to affect children living around industrial areas. Further regular monitoring, including studies assessing the health impact of mercury pollution in this region of Thailand, is to be encouraged.
Key words: blood levels, eastern seaboard industrial estate, Environmental Protection Agency, German Commission on Human Biological Monitoring, mercury, schoolchildren, Thailand
Toxicology Centre, National Institute of Health, Department of Medical Sciences, Ministry of Public Health, Thailand
Address for correspondence: Dr Sittiporn Parnmen, Toxicology Centre, National Institute of Health, Department of Medical Sciences, Ministry of Public Health, Nonthaburi, 11000 Thailand Email: [email protected]
INTRODUCTION
The eastern seaboard development programme was introduced during Thailand’s fifth National Economic and Social Development Plan (1981–1984).1 The programme plays an important role in Thailand’s economy and covers an area of four provinces: Chon Buri, Chachoengsao, Rayong and Samut Prakan. Economic activities in the coastal area of these provinces include agriculture, fisheries and tourism, as well as heavy industry, and the area is also populated with urban communities. Map Ta Phut Industrial Estate (MTPIE) is a large industrial park located in Rayong province, which was
established in 1989 by state enterprises, under the management of the Industrial Estate Authority of Thailand.2 It serves as a heavy industrial zone, with a gas separation plant, oil refineries, petrochemical industries and chemical plants.1,3 As a result of these industrial activities, increasing mercury levels have been recorded in the coastal areas by the heavy metal monitoring scheme, which was started in 1974.2 During the period of 1995 to 1998, high mercury levels were detected in MTPIE, especially in the area around the natural gas platform and the inner Gulf zone, owing to the release of mercury from discharged water produced from oil and gas activities.2,4 The Pollution Control Department of the Ministry of Natural
WHO South-East Asia Journal of Public Health | January-June 2015 | 4 (1)46
Teeyapant et al.: Mercury exposure in schoolchildren in Thailand
Resources and Environment monitors the environmental quality in MTPIE on a yearly basis. Overall results obtained from the Pollution Control Department indicate that mercury concentrations in seawater, sediment, marine organisms and wastewater are within acceptable standards.1,2 However, to the authors’ knowledge, there has been no risk assessment of mercury exposure in children living near the industrial estates area.
Mercury pollution has become an issue of public concern in Thailand. Chronic toxicity from continuous exposure to this element is linked to its bioaccumulation in living bodies and to its biomagnification along the food chain.5–8 Mercury exists in different chemical forms, including elemental (metallic), inorganic and organic. Organic mercury, such as methylmercury, which accumulates in the food chain, is the most hazardous form of mercury to human health.9 A high dose of mercury can cause adverse effects during any period of development, including neurodevelopmental toxicity, nephrotoxicity, teratogenicity, cardiovascular toxicity, carcinogenicity, mutagenesis, reproductive toxicity and immunotoxicity.9,10
The objective of this study was to determine the total mercury levels in blood samples from schoolchildren aged 6 to 13 years living around the industrial zone of MTPIE, and to assess the health risks, by comparing the levels with a range of international standard reference values.
METHODS
Subjects
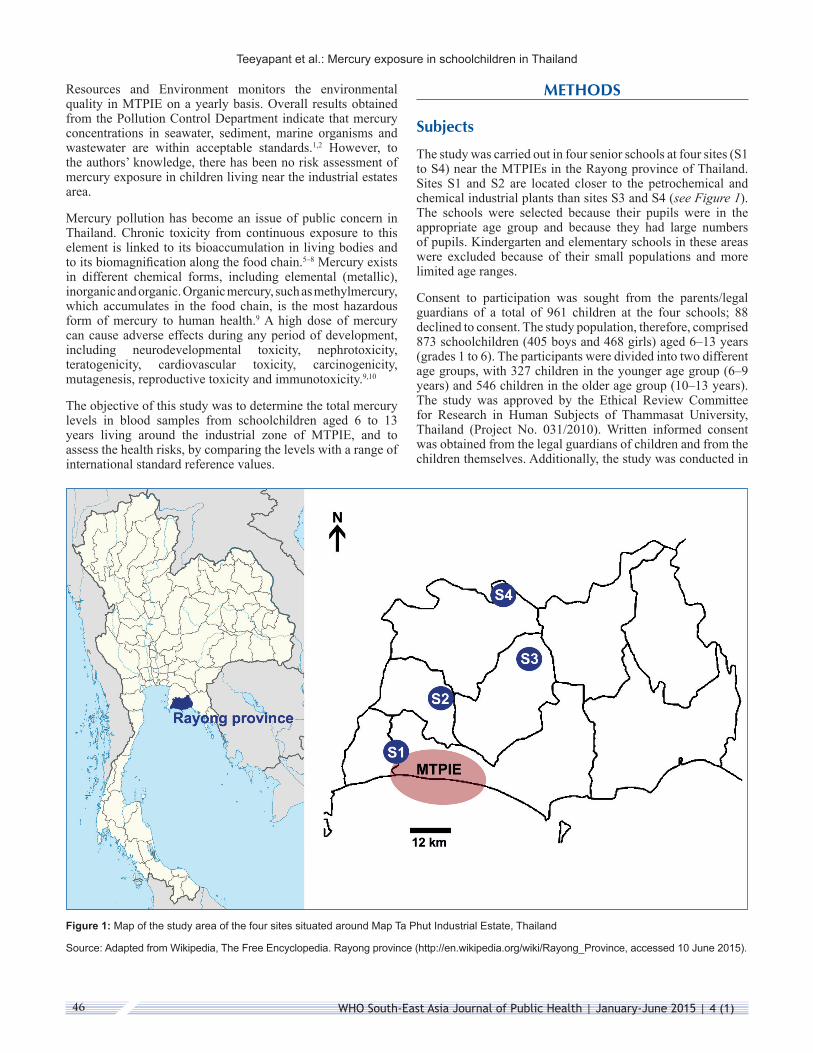
The study was carried out in four senior schools at four sites (S1 to S4) near the MTPIEs in the Rayong province of Thailand. Sites S1 and S2 are located closer to the petrochemical and chemical industrial plants than sites S3 and S4 (see Figure 1). The schools were selected because their pupils were in the appropriate age group and because they had large numbers of pupils. Kindergarten and elementary schools in these areas were excluded because of their small populations and more limited age ranges.
Consent to participation was sought from the parents/legal guardians of a total of 961 children at the four schools; 88 declined to consent. The study population, therefore, comprised 873 schoolchildren (405 boys and 468 girls) aged 6–13 years (grades 1 to 6). The participants were divided into two different age groups, with 327 children in the younger age group (6–9 years) and 546 children in the older age group (10–13 years). The study was approved by the Ethical Review Committee for Research in Human Subjects of Thammasat University, Thailand (Project No. 031/2010). Written informed consent was obtained from the legal guardians of children and from the children themselves. Additionally, the study was conducted in
Figure 1: Map of the study area of the four sites situated around Map Ta Phut Industrial Estate, Thailand
Source: Adapted from Wikipedia, The Free Encyclopedia. Rayong province (http://en.wikipedia.org/wiki/Rayong_Province, accessed 10 June 2015).
WHO South-East Asia Journal of Public Health | January-June 2015 | 4 (1) 47
Teeyapant et al.: Mercury exposure in schoolchildren in Thailand
accordance with the principles of the Declaration of Helsinki, as amended by the 59th General Assembly of the General Medical Association in Seoul, Republic of Korea, October 2008.
Blood mercury measurements
For each subject, a blood sample of 4 mL was obtained by venepuncture, collected in a Vacuette® silicone tube with an EDTA anticoagulant agent, and mixed thoroughly by inverting the tube several times. Total mercury was measured in whole blood, using flow-injection cold-vapour atomic absorption spectrometry.11 Blood samples were digested by microwave digester, with a mixture of 2:1 (v/v) nitric acid/hydrogen peroxide, and determined by a PerkinElmer® Model 4100 with flow-injection atomic spectrometry 200 for measurements of total mercury (PerkinElmer Instruments, Shelton, CT, United States of America [USA]). The limit of quantification (LOQ) for blood analysis was 1.5 μg/L (for data-analysis purposes, values below the LOQ were substituted with half this limit, that is, 0.75 μg/L). The recovery of mercury varied from 70% to 135%, obtained by the addition of three concentrations of standard solutions (1.97–17.7 μg/L) to the blood samples of the non-exposure group prior to the digestion. The average coefficient of variation between duplicate assay samples was less than 10%.
Statistical methods
Differences in the amount of mercury between or across groups were assessed by Kruskal–Wallis H test, Student’s t test or analysis of variance (ANOVA), as appropriate. The statistical analyses were done by use of SigmaPlot for Windows (version 11.0, Systat Software, Chicago, IL, USA).
Reference values
Mercury uptake by humans occurs mainly via consumption of fish and shellfish (methylmercury), inhalation of vaporous mercury released from industrial activities, and leakage from dental amalgams.12,13 Various reference values for blood mercury exist; this study used reference values published by the German Commission on Human Biological Monitoring (HBM), the United States Environmental Protection Agency (US EPA) and Clarke’s analysis of drugs and poisons.14 HBM recommended two different reference values for mercury in blood for the general population, based on toxicology and epidemiology studies, HBM I and HBM II.15,16 Toxin concentrations below the lower HBM I level (5 μg/L; alert level) are not considered to be a risk for the general population, while concentrations above HBM II (15 μg/L; action level) indicate an increased risk of adverse health effects in susceptible individuals of the general population.16,17 The US EPA reference dose for total mercury level in whole blood (Hg-B) corresponds to the estimated concentration assumed to be without appreciable harm (below 5.8 μg/L).18,19 Clarke’s analysis of drugs and poisons reports a Hg-B reference value of less than 4 μg/L in a non-exposed population.14
RESULTS
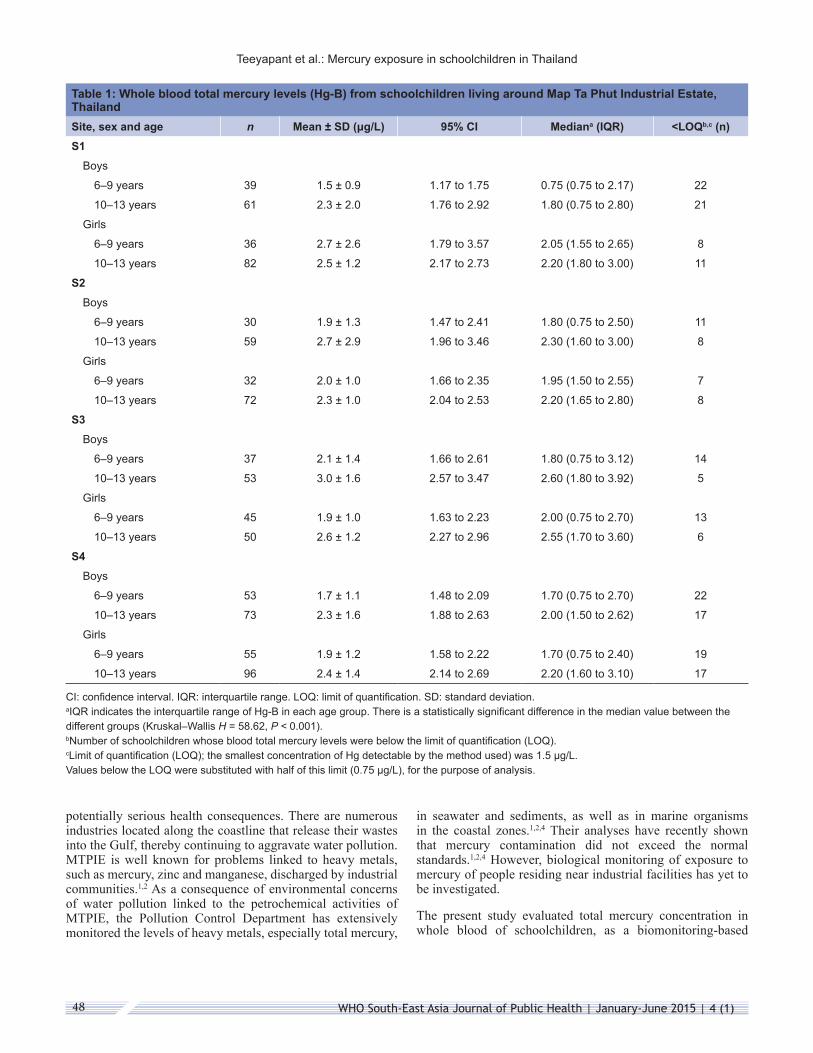
Blood mercury concentrations (Hg-B) of 873 schoolchildren aged 6–13 years, living around MTPIE are summarized in Table 1. Their mean total blood mercury concentrations ranged from 1.5 to 3.0 μg/L; most values were below the LOQ. Comparisons of total Hg-B concentration according to age and sex between different sites were performed (see Table 2). There was no statistically significant difference in total Hg-B for all sites combined by sex, when age group was not accounted for, but older children had a higher total Hg-B than younger children when sex was not accounted for (P = 0.001). Statistically significant differences were observed for boys and for girls when comparing the age groups 6–9 years and 10–13 years for all sites combined (boys: P = 0.005; girls: P = 0.001). There was a significant difference between boys and girls in the age group 6–9 years (P = 0.035) but not in the age group 10–13 years (P = 0.203).
Analysis of total Hg-B according to age and sex within each site were also performed (see Table 2). Relating to sex within sites, there were statistically significant differences in mean Hg-B concentration in sites S1 (girls’ levels higher than boys; P = 0.018) and S3 (boys’ levels higher than girls; P = 0.038). Relating to age within sites, older (10–13 years) children had higher mean Hg-B concentrations than younger (6–9 years) children in sites S2 (P = 0.038), S3 (P = 0.001) and S4 (P = 0.001), respectively.
The older age group had significantly higher mean total mercury levels than younger children in boys in all sites and in girls in sites S3 (P = 0.001) and S4 (P = 0.007).
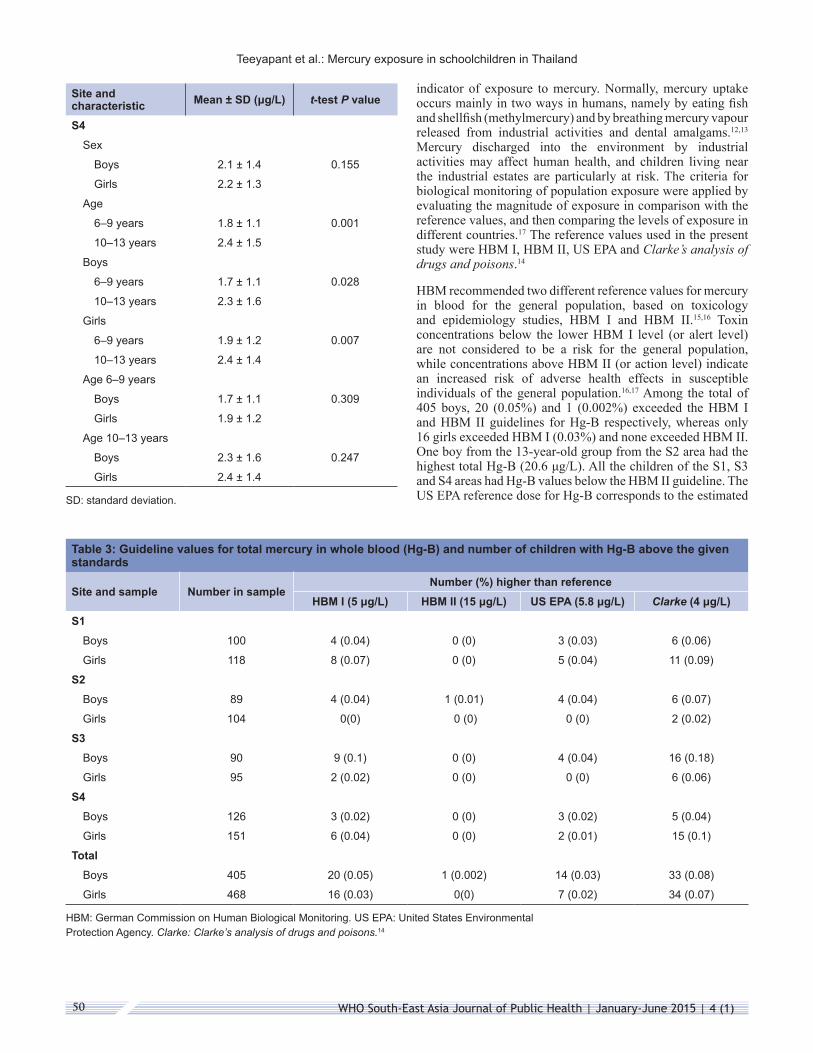
The standard reference Hg-B values of HBM I (5 μg/L), HBM II (15 μg/L), US EPA (5.8 μg/L) and Clarke’s analysis of drugs and poisons (4 μg/L)14 were exceeded by 20 (4.9%), 1 (0.2%), 14 (3.5%) and 33 (8.1%) boys respectively. Similarly for girls, 16 (3.4%), 0 (0%), 7 (1.5%) and 34 (7.3%) girls exceeded standard reference Hg-B values of HBM I, HBM II, US EPA and Clarke’s analysis of drugs and poisons, respectively (see Table 3).
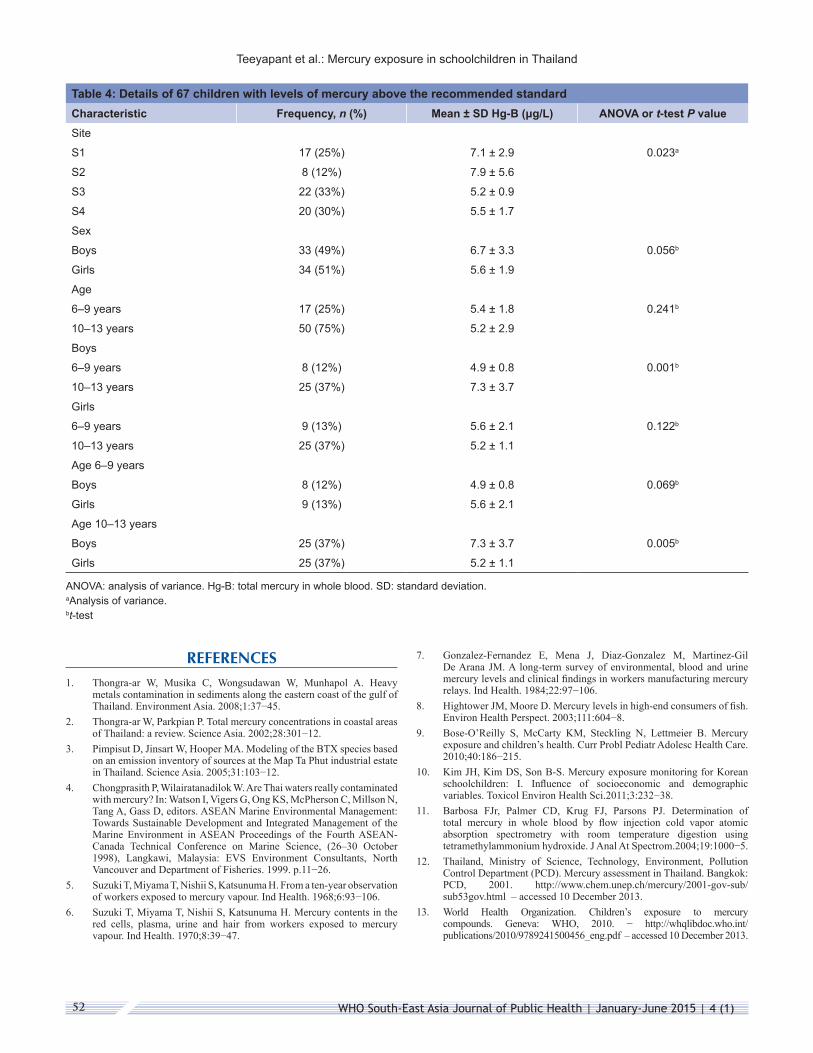
Sixty-seven children had levels of total Hg-B that exceeded the limit set in Clarke’s analysis of drugs and poisons.14 Their mean Hg-B ranged from 5.2 to 7.9 μg/L (Table 4) and one 13-year-old boy had a total Hg-B of 20.6 μg/L – the maximum value recorded in this study (see Figure 2). The higher concentrations were observed in sites S1 and S2, which are located closer to the petrochemical and chemical industrial plants than sites S3 and S4. When comparisons were made by age and sex groups within these 67 schoolchildren, statistically significant differences were found in the higher total Hg-B in older than younger boys (P = 0.001) and higher values in boys than girls aged 10–13 years. (P = 0.005).
DISCUSSION
The rapid expansion of industrialization and urbanization that is taking place around the eastern seaboard industrial estates in Thailand has led to an increase in heavy metal pollution, with
WHO South-East Asia Journal of Public Health | January-June 2015 | 4 (1)48
Teeyapant et al.: Mercury exposure in schoolchildren in Thailand
Table 1: Whole blood total mercury levels (Hg-B) from schoolchildren living around Map Ta Phut Industrial Estate, ThailandSite, sex and age n Mean ± SD (μg/L) 95% CI Mediana (IQR) <LOQb,c (n)S1
Boys
6–9 years 39 1.5 ± 0.9 1.17 to 1.75 0.75 (0.75 to 2.17) 22
10–13 years 61 2.3 ± 2.0 1.76 to 2.92 1.80 (0.75 to 2.80) 21
Girls
6–9 years 36 2.7 ± 2.6 1.79 to 3.57 2.05 (1.55 to 2.65) 8
10–13 years 82 2.5 ± 1.2 2.17 to 2.73 2.20 (1.80 to 3.00) 11
S2Boys
6–9 years 30 1.9 ± 1.3 1.47 to 2.41 1.80 (0.75 to 2.50) 11
10–13 years 59 2.7 ± 2.9 1.96 to 3.46 2.30 (1.60 to 3.00) 8
Girls
6–9 years 32 2.0 ± 1.0 1.66 to 2.35 1.95 (1.50 to 2.55) 7
10–13 years 72 2.3 ± 1.0 2.04 to 2.53 2.20 (1.65 to 2.80) 8
S3Boys
6–9 years 37 2.1 ± 1.4 1.66 to 2.61 1.80 (0.75 to 3.12) 14
10–13 years 53 3.0 ± 1.6 2.57 to 3.47 2.60 (1.80 to 3.92) 5
Girls
6–9 years 45 1.9 ± 1.0 1.63 to 2.23 2.00 (0.75 to 2.70) 13
10–13 years 50 2.6 ± 1.2 2.27 to 2.96 2.55 (1.70 to 3.60) 6
S4Boys
6–9 years 53 1.7 ± 1.1 1.48 to 2.09 1.70 (0.75 to 2.70) 22
10–13 years 73 2.3 ± 1.6 1.88 to 2.63 2.00 (1.50 to 2.62) 17
Girls
6–9 years 55 1.9 ± 1.2 1.58 to 2.22 1.70 (0.75 to 2.40) 19
10–13 years 96 2.4 ± 1.4 2.14 to 2.69 2.20 (1.60 to 3.10) 17
CI: confidence interval. IQR: interquartile range. LOQ: limit of quantification. SD: standard deviation. aIQR indicates the interquartile range of Hg-B in each age group. There is a statistically significant difference in the median value between the different groups (Kruskal–Wallis H = 58.62, P < 0.001). bNumber of schoolchildren whose blood total mercury levels were below the limit of quantification (LOQ). cLimit of quantification (LOQ); the smallest concentration of Hg detectable by the method used) was 1.5 μg/L. Values below the LOQ were substituted with half of this limit (0.75 μg/L), for the purpose of analysis.
potentially serious health consequences. There are numerous industries located along the coastline that release their wastes into the Gulf, thereby continuing to aggravate water pollution. MTPIE is well known for problems linked to heavy metals, such as mercury, zinc and manganese, discharged by industrial communities.1,2 As a consequence of environmental concerns of water pollution linked to the petrochemical activities of MTPIE, the Pollution Control Department has extensively monitored the levels of heavy metals, especially total mercury,
in seawater and sediments, as well as in marine organisms in the coastal zones.1,2,4 Their analyses have recently shown that mercury contamination did not exceed the normal standards.1,2,4 However, biological monitoring of exposure to mercury of people residing near industrial facilities has yet to be investigated.
The present study evaluated total mercury concentration in whole blood of schoolchildren, as a biomonitoring-based
WHO South-East Asia Journal of Public Health | January-June 2015 | 4 (1) 49
Teeyapant et al.: Mercury exposure in schoolchildren in Thailand
Table 2: Whole blood total mercury levels (Hg-B) from schoolchildren according to age and sex between and within sitesSite and characteristic Mean ± SD (μg/L) t-test P value
All sites combinedSex
Boys 2.29 ± 0.3 0.366
Girls 2.19 ± 0.5
Age
6–9 years 2.0 ± 1.4 0.001
10–13 years 2.5 ± 1.7
Boys
6–9 years 2.1 ± 1.6 0.005
10–13 years 2.4 ± 1.2
Girls
6–9 years 1.8 ± 1.2 0.001
10–13 years 2.6 ± 2.2
Age 6–9 years
Boys 1.8 ± 1.2 0.035
Girls 2.1 ± 1.6
Age 10–13 years
Boys 2.6 ± 2.2 0.203
Girls 2.4 ± 1.2
S1Sex
Boys 2.0 ± 1.9 0.018
Girls 2.5 ± 1.8
Age
6–9 years 2.0 ± 2.0 0.087
10–13 years 2.4 ± 1.8
Boys
6–9 years 1.5 ± 0.9 0.003
10–13 years 2.3 ± 2.0
Girls
6–9 years 2.7 ± 2.6 0.309
10–13 years 2.5 ± 1.2
Age 6–9 years
Boys 1.5 ± 0.9 0.005
Girls 2.7 ± 2.6
Age 10–13 years
Boys 2.3 ± 2.0 0.370
Girls 2.2 ± 1.0
Site and characteristic Mean ± SD (μg/L) t-test P value
S2Sex
Boys 2.5 ± 2.5 0.175
Girls 2.2 ± 1.0
Age
6–9 years 2.0 ± 1.1 0.038
10–13 years 2.5 ± 2.1
Boys
6–9 years 1.9 ± 1.3 0.042
10–13 years 2.7 ± 2.9
Girls
6–9 years 2.0 ± 1.0 0.092
10–13 years 2.3 ± 1.0
Age 6–9 years
Boys 1.9 ± 1.3 0.189
Girls 2.0 ± 1.0
Age 10–13 years
Boys 2.7 ± 1.9 0.145
Girls 2.3 ± 1.0
S3Sex
Boys 2.8 ± 1.5 0.038
Girls 2.7 ± 1.6
Age
6–9 years 2.0 ± 1.2 0.001
10–13 years 2.8 ± 1.5
Boys
6–9 years 2.1 ± 1.4 0.003
10–13 years 3.0 ± 1.6
Girls
6–9 years 1.9 ± 1.0 0.001
10–13 years 2.6 ± 2.2
Age 6–9 years
Boys 2.1 ± 1.4 0.232
Girls 1.9 ± 1.0
Age 10–13 years
Boys 3.0 ± 1.6 0.078
Girls 2.6 ± 1.2
WHO South-East Asia Journal of Public Health | January-June 2015 | 4 (1)50
Teeyapant et al.: Mercury exposure in schoolchildren in Thailand
Site and characteristic Mean ± SD (μg/L) t-test P value
S4Sex
Boys 2.1 ± 1.4 0.155
Girls 2.2 ± 1.3
Age
6–9 years 1.8 ± 1.1 0.001
10–13 years 2.4 ± 1.5
Boys
6–9 years 1.7 ± 1.1 0.028
10–13 years 2.3 ± 1.6
Girls
6–9 years 1.9 ± 1.2 0.007
10–13 years 2.4 ± 1.4
Age 6–9 years
Boys 1.7 ± 1.1 0.309
Girls 1.9 ± 1.2
Age 10–13 years
Boys 2.3 ± 1.6 0.247
Girls 2.4 ± 1.4
SD: standard deviation.
Table 3: Guideline values for total mercury in whole blood (Hg-B) and number of children with Hg-B above the given standards
Site and sample Number in sampleNumber (%) higher than reference
HBM I (5 μg/L) HBM II (15 μg/L) US EPA (5.8 μg/L) Clarke (4 μg/L)S1
HBM: German Commission on Human Biological Monitoring. US EPA: United States Environmental Protection Agency. Clarke: Clarke’s analysis of drugs and poisons.14
indicator of exposure to mercury. Normally, mercury uptake occurs mainly in two ways in humans, namely by eating fish and shellfish (methylmercury) and by breathing mercury vapour released from industrial activities and dental amalgams.12,13 Mercury discharged into the environment by industrial activities may affect human health, and children living near the industrial estates are particularly at risk. The criteria for biological monitoring of population exposure were applied by evaluating the magnitude of exposure in comparison with the reference values, and then comparing the levels of exposure in different countries.17 The reference values used in the present study were HBM I, HBM II, US EPA and Clarke’s analysis of drugs and poisons.14
HBM recommended two different reference values for mercury in blood for the general population, based on toxicology and epidemiology studies, HBM I and HBM II.15,16 Toxin concentrations below the lower HBM I level (or alert level) are not considered to be a risk for the general population, while concentrations above HBM II (or action level) indicate an increased risk of adverse health effects in susceptible individuals of the general population.16,17 Among the total of 405 boys, 20 (0.05%) and 1 (0.002%) exceeded the HBM I and HBM II guidelines for Hg-B respectively, whereas only 16 girls exceeded HBM I (0.03%) and none exceeded HBM II. One boy from the 13-year-old group from the S2 area had the highest total Hg-B (20.6 μg/L). All the children of the S1, S3 and S4 areas had Hg-B values below the HBM II guideline. The US EPA reference dose for Hg-B corresponds to the estimated
WHO South-East Asia Journal of Public Health | January-June 2015 | 4 (1) 51
Teeyapant et al.: Mercury exposure in schoolchildren in Thailand
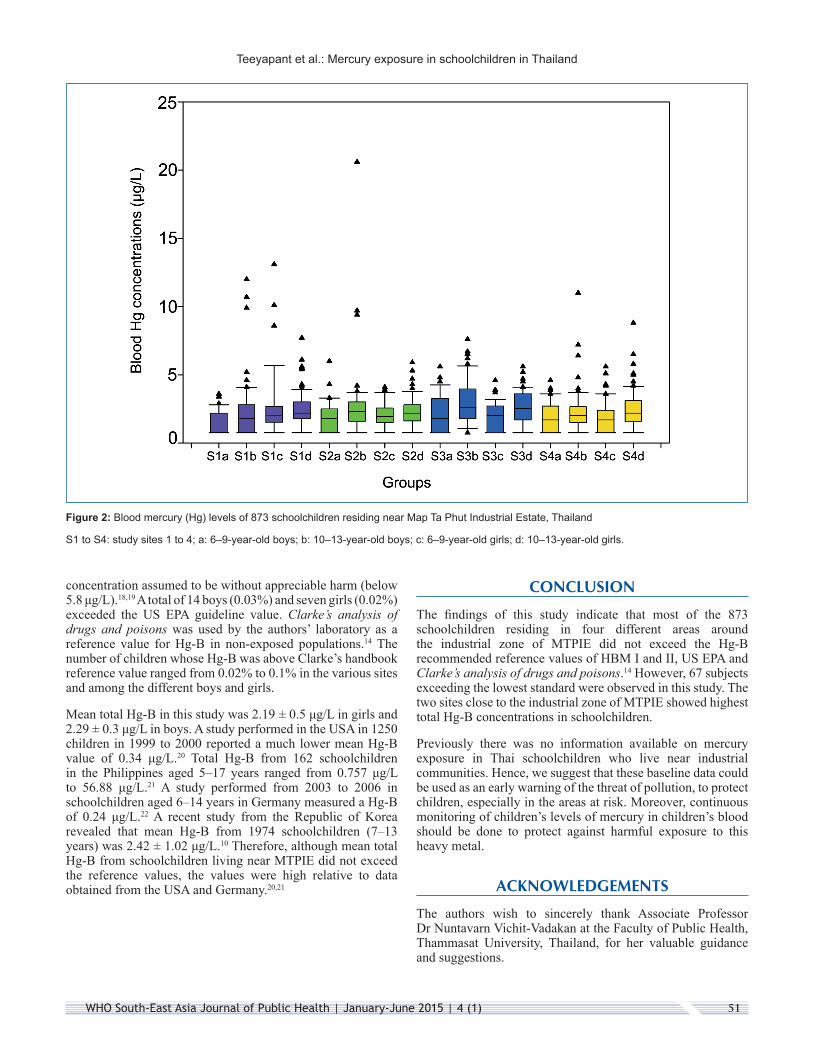
Figure 2: Blood mercury (Hg) levels of 873 schoolchildren residing near Map Ta Phut Industrial Estate, Thailand
S1 to S4: study sites 1 to 4; a: 6–9-year-old boys; b: 10–13-year-old boys; c: 6–9-year-old girls; d: 10–13-year-old girls.
concentration assumed to be without appreciable harm (below 5.8 μg/L).18,19 A total of 14 boys (0.03%) and seven girls (0.02%) exceeded the US EPA guideline value. Clarke’s analysis of drugs and poisons was used by the authors’ laboratory as a reference value for Hg-B in non-exposed populations.14 The number of children whose Hg-B was above Clarke’s handbook reference value ranged from 0.02% to 0.1% in the various sites and among the different boys and girls.
Mean total Hg-B in this study was 2.19 ± 0.5 μg/L in girls and 2.29 ± 0.3 μg/L in boys. A study performed in the USA in 1250 children in 1999 to 2000 reported a much lower mean Hg-B value of 0.34 μg/L.20 Total Hg-B from 162 schoolchildren in the Philippines aged 5–17 years ranged from 0.757 μg/L to 56.88 μg/L.21 A study performed from 2003 to 2006 in schoolchildren aged 6–14 years in Germany measured a Hg-B of 0.24 μg/L.22 A recent study from the Republic of Korea revealed that mean Hg-B from 1974 schoolchildren (7–13 years) was 2.42 ± 1.02 μg/L.10 Therefore, although mean total Hg-B from schoolchildren living near MTPIE did not exceed the reference values, the values were high relative to data obtained from the USA and Germany.20,21
CONCLUSION
The findings of this study indicate that most of the 873 schoolchildren residing in four different areas around the industrial zone of MTPIE did not exceed the Hg-B recommended reference values of HBM I and II, US EPA and Clarke’s analysis of drugs and poisons.14 However, 67 subjects exceeding the lowest standard were observed in this study. The two sites close to the industrial zone of MTPIE showed highest total Hg-B concentrations in schoolchildren.
Previously there was no information available on mercury exposure in Thai schoolchildren who live near industrial communities. Hence, we suggest that these baseline data could be used as an early warning of the threat of pollution, to protect children, especially in the areas at risk. Moreover, continuous monitoring of children’s levels of mercury in children’s blood should be done to protect against harmful exposure to this heavy metal.
ACKNOWLEDGEMENTS
The authors wish to sincerely thank Associate Professor Dr Nuntavarn Vichit-Vadakan at the Faculty of Public Health, Thammasat University, Thailand, for her valuable guidance and suggestions.
WHO South-East Asia Journal of Public Health | January-June 2015 | 4 (1)52
Teeyapant et al.: Mercury exposure in schoolchildren in Thailand
Table 4: Details of 67 children with levels of mercury above the recommended standardCharacteristic Frequency, n (%) Mean ± SD Hg-B (μg/L) ANOVA or t-test P valueSite
S1 17 (25%) 7.1 ± 2.9 0.023a
S2 8 (12%) 7.9 ± 5.6
S3 22 (33%) 5.2 ± 0.9
S4 20 (30%) 5.5 ± 1.7
Sex
Boys 33 (49%) 6.7 ± 3.3 0.056b
Girls 34 (51%) 5.6 ± 1.9
Age
6–9 years 17 (25%) 5.4 ± 1.8 0.241b
10–13 years 50 (75%) 5.2 ± 2.9
Boys
6–9 years 8 (12%) 4.9 ± 0.8 0.001b
10–13 years 25 (37%) 7.3 ± 3.7
Girls
6–9 years 9 (13%) 5.6 ± 2.1 0.122b
10–13 years 25 (37%) 5.2 ± 1.1
Age 6–9 years
Boys 8 (12%) 4.9 ± 0.8 0.069b
Girls 9 (13%) 5.6 ± 2.1
Age 10–13 years
Boys 25 (37%) 7.3 ± 3.7 0.005b
Girls 25 (37%) 5.2 ± 1.1
ANOVA: analysis of variance. Hg-B: total mercury in whole blood. SD: standard deviation. aAnalysis of variance. bt-test
REFERENCES1. Thongra-ar W, Musika C, Wongsudawan W, Munhapol A. Heavy
metals contamination in sediments along the eastern coast of the gulf of Thailand. Environment Asia. 2008;1:37−45.
2. Thongra-ar W, Parkpian P. Total mercury concentrations in coastal areas of Thailand: a review. Science Asia. 2002;28:301−12.
3. Pimpisut D, Jinsart W, Hooper MA. Modeling of the BTX species based on an emission inventory of sources at the Map Ta Phut industrial estate in Thailand. Science Asia. 2005;31:103−12.
4. Chongprasith P, Wilairatanadilok W. Are Thai waters really contaminated with mercury? In: Watson I, Vigers G, Ong KS, McPherson C, Millson N, Tang A, Gass D, editors. ASEAN Marine Environmental Management: Towards Sustainable Development and Integrated Management of the Marine Environment in ASEAN Proceedings of the Fourth ASEAN-Canada Technical Conference on Marine Science, (26–30 October 1998), Langkawi, Malaysia: EVS Environment Consultants, North Vancouver and Department of Fisheries. 1999. p.11−26.
5. Suzuki T, Miyama T, Nishii S, Katsunuma H. From a ten-year observation of workers exposed to mercury vapour. Ind Health. 1968;6:93−106.
6. Suzuki T, Miyama T, Nishii S, Katsunuma H. Mercury contents in the red cells, plasma, urine and hair from workers exposed to mercury vapour. Ind Health. 1970;8:39−47.
7. Gonzalez-Fernandez E, Mena J, Diaz-Gonzalez M, Martinez-Gil De Arana JM. A long-term survey of environmental, blood and urine mercury levels and clinical findings in workers manufacturing mercury relays. Ind Health. 1984;22:97−106.
8. Hightower JM, Moore D. Mercury levels in high-end consumers of fish. Environ Health Perspect. 2003;111:604−8.
9. Bose-O’Reilly S, McCarty KM, Steckling N, Lettmeier B. Mercury exposure and children’s health. Curr Probl Pediatr Adolesc Health Care. 2010;40:186−215.
10. Kim JH, Kim DS, Son B-S. Mercury exposure monitoring for Korean schoolchildren: I. Influence of socioeconomic and demographic variables. Toxicol Environ Health Sci.2011;3:232−38.
11. Barbosa FJr, Palmer CD, Krug FJ, Parsons PJ. Determination of total mercury in whole blood by flow injection cold vapor atomic absorption spectrometry with room temperature digestion using tetramethylammonium hydroxide. J Anal At Spectrom.2004;19:1000−5.
12. Thailand, Ministry of Science, Technology, Environment, Pollution Control Department (PCD). Mercury assessment in Thailand. Bangkok: PCD, 2001. http://www.chem.unep.ch/mercury/2001-gov-sub/sub53gov.html – accessed 10 December 2013.
13. World Health Organization. Children’s exposure to mercury compounds. Geneva: WHO, 2010. − http://whqlibdoc.who.int/publications/2010/9789241500456_eng.pdf – accessed 10 December 2013.
WHO South-East Asia Journal of Public Health | January-June 2015 | 4 (1) 53
Teeyapant et al.: Mercury exposure in schoolchildren in Thailand
14. Braithwaite R. Metals and anions. In: Moffat AC, Osselton MD, Widdop B, editors. Clarke’s analysis of drugs and poisons. 4th ed. UK: Pharmaceutical Press; 2004. p. 288−307.
15. Jakubowski M, Trzcinka-Ochocka M. Biological monitoring of exposure: trends and key developments. J Occup Health .2005;47:22−48.
16. Schulz C, Angerer J, Ewers U, Kolossa-Gehring M. The German human biomonitoring commission. Int J Hyg Environ Health. 2007;210:373−82.
17. Ewers U, Krause C, Schulz C, Wilhelm M. Reference values and human biological monitoring values for environmental toxins: report on the work and recommendations of the Commission on Human Biological Monitoring of the German Federal Environmental Agency. Int Arch Occup Environ Health. 1999;72:255−60.
18. United States Environmental Protection Agency. Toxicity and exposure assessment for children’s health October 2007. http://www.epa.gov/teach/chem_summ/mercury_org_summary.html – accessed 10 December 2013.
19. Centers for Disease Control and Prevention. Blood mercury levels in young children and childbearing-aged women−United States, 1999–2002. Morb Mortal Wkly Rep. 2004;53:1018−20.
20. Schober SE, Sinks TH, Jones RL, Bolger PM, McDowell M, Osterloh J, Garrett ES, Canady RA, Dillon CF, Sun Y, Joseph CB, Mahaffey KR. Blood mercury levels in US children and women of childbearing age, 1999–2000. JAMA. 2003;289:1667−74.
21. Akagi H, Castillo ES, Cortes-Maramba N, Francisco-Rivera AT, Timbang TD. Health assessment for mercury exposure among schoolchildren residing near a gold processing and refining plant in Apokon, Tagum, Davao del Norte, Philippines. Sci Total Environ. 2000;259:31−43.
22. Schulz C. Twenty years of the German Environmental Survey (GerES): human biomonitoring-temporal and spatial (West Germany/East Germany) differences in population exposure. Int J Hyg Environ Health. 2007;210:271−97.
How to cite this article: Teeyapant P, Leudang S, Parnmen S. A cross-sectional study of exposure to mercury in schoolchildren living near the eastern seaboard industrial estate of Thailand. WHO South-East Asia J Public Health 2015; 4(1): 45–53.
Source of Support: The Office of Natural Resources and Environmental Policy and Planning, Thailand financially supported this work. Conflict of Interest: None declared. Contributorship: PT conceived and designed the experiments, SL performed the experiments, SP analysed the data and wrote the paper.