MERCURY SPECIES IN NATURAL GAS CONDENSATE By AZMAN BIN SHAFAWI BSC (Hons), MSc A thesis submitted to the University of Plymouth in partial fiilfilment for the degree of DOCTOR OF PHILOSOPHY Department of Environmental Sciences, University of Plymouth, Drake Circus, Plymouth, PL4 8AA. In collaboration with; Petroliam Nasional Bhd, PETRONAS MALAYSIA, and P.S. Analytical Ltd. United Kingdom JANUARY 1999
Transcript
MERCURY SPECIES IN NATURAL GAS CONDENSATE
By
AZMAN BIN SHAFAWI BSC (Hons), MSc
A thesis submitted to the University of Plymouth
in partial fiilfilment for the degree of
DOCTOR OF PHILOSOPHY
Department of Environmental Sciences,
University of Plymouth,
Drake Circus,
Plymouth,
PL4 8AA.
In collaboration with;
Petroliam Nasional Bhd, PETRONAS
MALAYSIA,
and
P.S. Analytical Ltd.
United Kingdom
JANUARY 1999
LIBRARY STORE
90 0398913 3
mm- Roo3989l35_ s
Date
Class No. Conll.No.
3 A U G 1999
X - 7 o 3 S o q | - f ) o URRARY S E R V I C E S
REFERENCE ONLY
ABSTRACT
MERCURY SPECIES IN NATURAL GAS CONDENSATE
AZMAN BIN SHAFAWI
The presence of ultra-trace levels of mercury in industrial gas and condensate streams is a cause of both environmental and production conceriL The toxic nature of the element, in all forms, together with its ability to shut-down large processing plants dictates a need for its accurate and precise measurement.
The study which investigated the recoveiy of various mercury species, spiked into synthetic and real condensate sanqples using conventional and new digestion and/or extraction techniques showed recovery was dependent upon the speciation. Using the most efficient technique, L<ysteme with persulphate, recoveries of over 90 % were obtained for diphenyl mercury, ethyl and phenyl mercury chlorides and mercury chloride. The recovery of 15% for the in^rtant dimethyl mercury species limits the use of this technique.
A novel technique has been developed for the determination of total mercury in con^lex liquid hydrocarbons. San^les (up to 1.0 ml) were vaporised (400**C) and swept through a gold-coated silica trap maintained at 200°C, which retained all mercury species and discarded the matrix. The trap when heated to 900°C released the mercury for measurement by atomic fluorescence spectrometry (AFS). The recoveries for eight mercury species spiked (10 to 50 ng ml into toluene and condensate were generally over 90 %. The instrumental limit of detection (LOD) was 11 pg. The total mercury content of gas condensates, gasolines and heavy oils were determined.
Gas chromatogr^hy coupled, via a pyrolysis inter&ce, with AF detection was able to determme mercury species in gas condensate, at picogram levels (LOD: 2.5 to 7 pg) using a direct sample injection procedure. For a given column system the positive identification and quantification of up to eight mercury species was obtained. A maximum injector temperature of 125 *'C was recommended, to avoid the conversion of species. Mass balance calculations show a strong correlation between the total mercury content and the sum of the lower dialkyl mercury species, for all condensate samples studied.
Three commercially available mercury removal systems. A, B and C produced a reduction in the mercury content of hydrocarbon streams under pilot plant conditions. The two stage system, 'A' , produced a minimum of 30 % conversion fi-om organomercury to elemental mercury after the hydrogenation reaction in stage 1. While elemental mercury was adsorbed by the stage 2 reactor, the organomercury species were not removed. The single stage adsorber 'B' showed 100 % removal efficiency for three dialkyl mercury species in liquid hydrocarbon streams. The removal efficiency for adsorber ' C was species dependent. Two common condensate species gave values of 50 to 80 % removal efficiency while the third species showed time-dependent bleed-off.
iii
CONTENTS
Copyright Statement i Title Page ii Abstract iii List of contents iv List of tables X i List of figures XV Acknowledgement xix Author's Declaration XX
CHAPTER 1 : INTRODUCTION 1
1.1 Petroleum Industry 1
1.1.1 Natxiral gas and natural gas condensate 1
1.1.2 Characteristics of natural gas condensate 2
1.1.3 Natural gas condensate usage 5
1.2 Mercury in natural gas and the petrochemical industry 5
1.2.1 Mercury in natural gas industry 6
1.2.2 Mercury in the petrochemical industry 8
1.2.3 'Acceptable limits' for mercury content in process stream 9
1.2.4 Corrosion effect fi-om mercury upon process plant 10 1.2.4.1 Mercury- induced stress cracking 11 1.2.4.2 Mercury-catalysed oxidation by water 12
1.2.5 The petroleum industry and environmental impacts from mercury 14
1.2.6 Regulations and guideline levels for mercury
1.3.3 Mercury Speciation 22 1.3.3.1 Speciation by chromatography coupled with AAS 23 1.3.3.2 Speciation by chromatography coupled with AFS 24
1.3.4 The determination of mercury in natural gas condensate 24 1.3.4.1 Total mercury in natural gas condensate 26 1.3.4.2 Mercury speciation in natural gas condensate 28
1A Mercury removal methods in the petroleum and petrochemical industry
1.4.2.3 JGC processes 1.4.2.4 Other processes
1.5.2.2 Instrumentation
1.6 Aims and objectives of this study
31
1.4.1 Mercury removal from natural gas 31
1.4.2 Mercury removal from natural gas condensate 31 1.4.2.1 The DSM process 31 1.4.2.2 EFP-RAM processes 33
33 33
1.5 Atomic Fluorescence Spectrometry 34
1.5.1 Background 34
1.5.2 Atomic fluorescence-principle and instrumentation 35 35 37 39
1.5.2.1 Principle 1.5.2.1.1 Fluorescence of mercury atom 37
CHAPTER 2 : THE DETERMINATION OF TOTAL MERCURY IN NATURAL GAS CONDENSATE BY DIGESTION AND EXTRACTION-COLD VAPOUR ATOMIC FLUORESCENCE SPECTROMETRY 45
2.1 Introduction 45
2.1.1 Objective of the study 48
2.2 Experimental
2.2.1 Mercury species
222 Reagents
2.3 Instrumentation
48
48
49
49
2.4 Sanqsle digestion and extraction procedure used in the study 52
2.4.1 CaHbration 52
2.4.2 Preliminary studies using acid-persulphate digestion 52
2.4.3 (a) Preliminary studies using I " /lO 3" digestion 53 2.4.3 (b) Further studies using \ 'f\0{ digestion 53
2.4.4 Complexation with dithizone, followed by extraction using thiosulphate and oxidative digestion with acid-persulphate
53 2.4.5 Extraction with thiosulphate, followed by
oxidative digestion with acid-persulphate 54
2.4.6 Extraction using L-cysteine followed by oxidative digestion with acid-persulphate 54
2.4.7 Mercury measurement 55
2.5 Results and discussion 56
2.5.1 Acid-persulphate digestion 57
2.5.2(a) Digestion with r AO 3" 59 2.5.2 (b) Extended experiment using above procedure 60
V I
2.5.3 Complexation with dithizone, followed by extraction with thiosulphate and oxidative digestion with acid-persulphate 61
2.5.4 Extraction with thiosulphate, followed by oxidative digestion with acid-persulphate 61
2.5.5 Extraction by L-cysteine ^2 2.5.5.1 Concentration of dimethyl mercury (DMM) 64 2.5.5.2 Factorial design ^ 2.5.5.3 Effect of pH of L-cysteine 64
2.6 Conclusions
3.1 Introduction
66
CHAPTER 3 : THE DETERMINATION OF TOTAL MERCURY IN LIQUID HYDROCARBONS AND CONDENSATES BY VAPORISATION AND TRAPPING WITH ATOMIC FLUORESCENCE DETECTION 69
69
3.2 Preliminary study using a sample vaporisation technique with elevated temperature trapping of mercury 72
3.2.1 Experimental 72
3.2.2 Results and discussion 74 3.2.2.1 Preliminary study using the sample vaporistion
technique with an off-line detection system 74
3.3 Development of an efScient vaporisation and trapping instrument for mercury determination with on-line fluorescence detection 76
3.3.4 Results and Discussion 85 3.3.4.1 Performance characteristics of the trap system 85 3.3.4.2 Effect of argon sweep gas flow rate 89 3.3.4.3 Efifect of volimie of saiiq)le injected
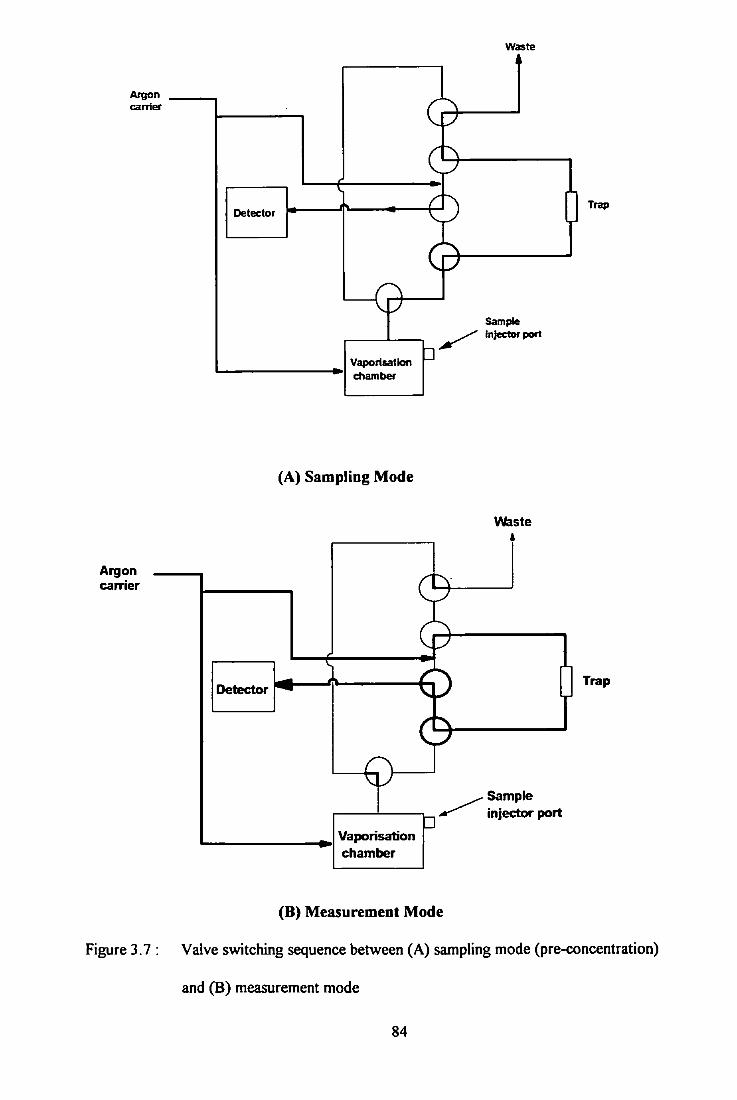
upon recovery 90 3.3.4.4 Double size trap 91 3.3.4.5 Recoveries of mercury species added
into *real' condensate samples 94 3.3.4.6 Precision of the experimental technique 98 3.3.4.7 Conostan mercury standard for oil analyses 99 3.3.4.8 Detection limits 101 3.3.4.9 Total mercury content in commercial
condensate 101
3.4 The determination of total mercury in real condensate and hydrocarbon samples by the vaporisation technique 103
3.4.1 Total mercury in condensate samples 103
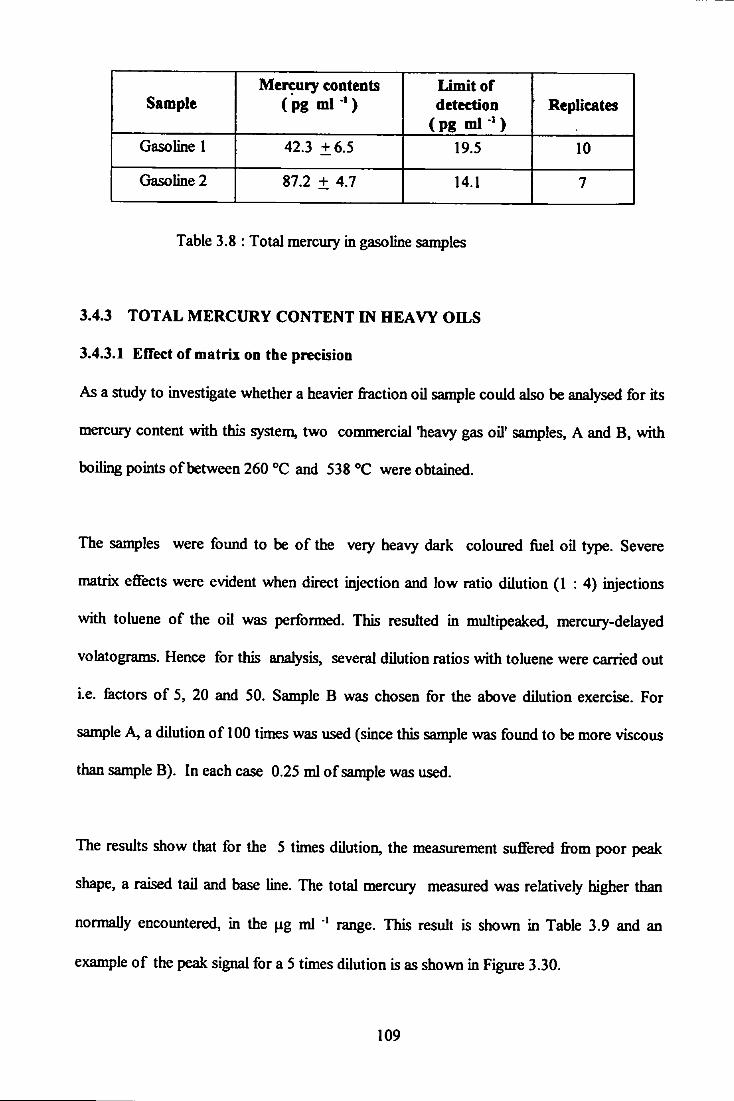
3.4.2 Gasoline with ultra trace mercury content 108
3.4.3 Total mercury content in heavy oils 109 3.4.3.1 Effect of matrix on the precision 109
3.5 Conclusions 114
CHAPTER 4 : MERCURY SPECIATION IN NATURAL GAS CONDENSATE BY GAS CHROMATOGRAPHY COUPLED WITH ATOMIC FLUORESCENCE SPECTROMETRY 116
4.1 Introduction 116
4.2 Experimental 121
4.2.1 Instrumentation and optimisation study 121
4.2.2 Chemicals and reagents 122
4.2.3 Gas condensate samples 122
V I M
4.3 Resuhs and discussion 125
4.3.1 The efiFects of injector temperature 125
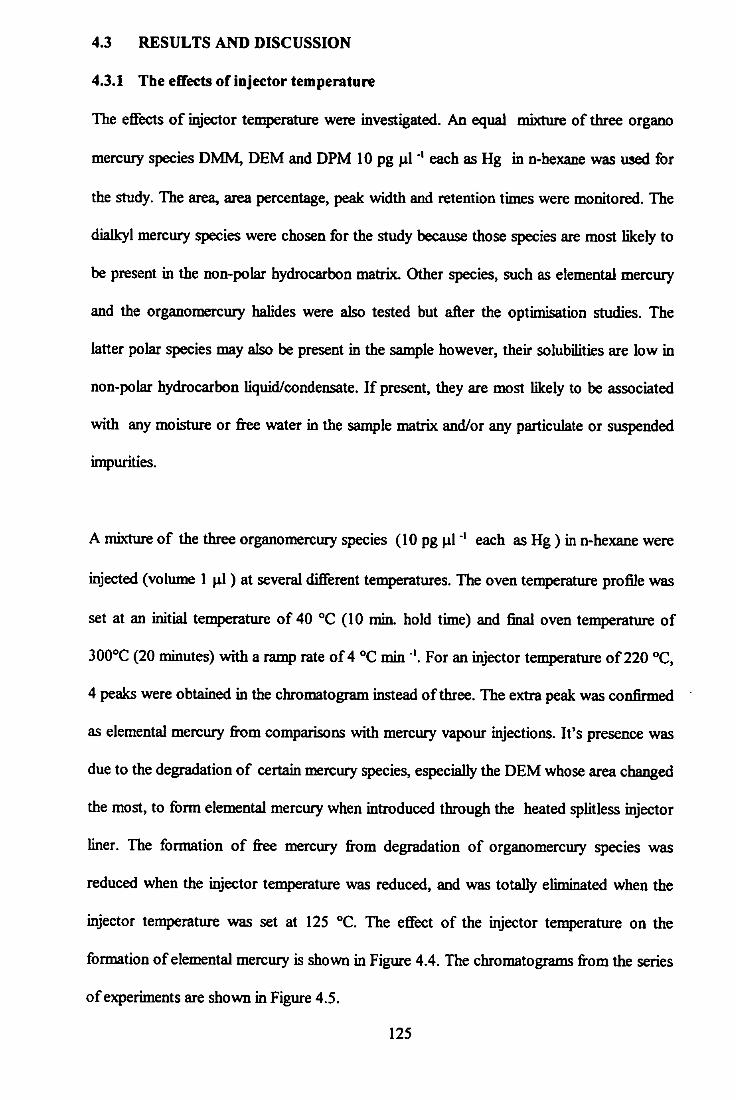
4.3.2 Optimisation of colxunn gas flow rate 126
4.3.3 Eflfect of make -up gas 131
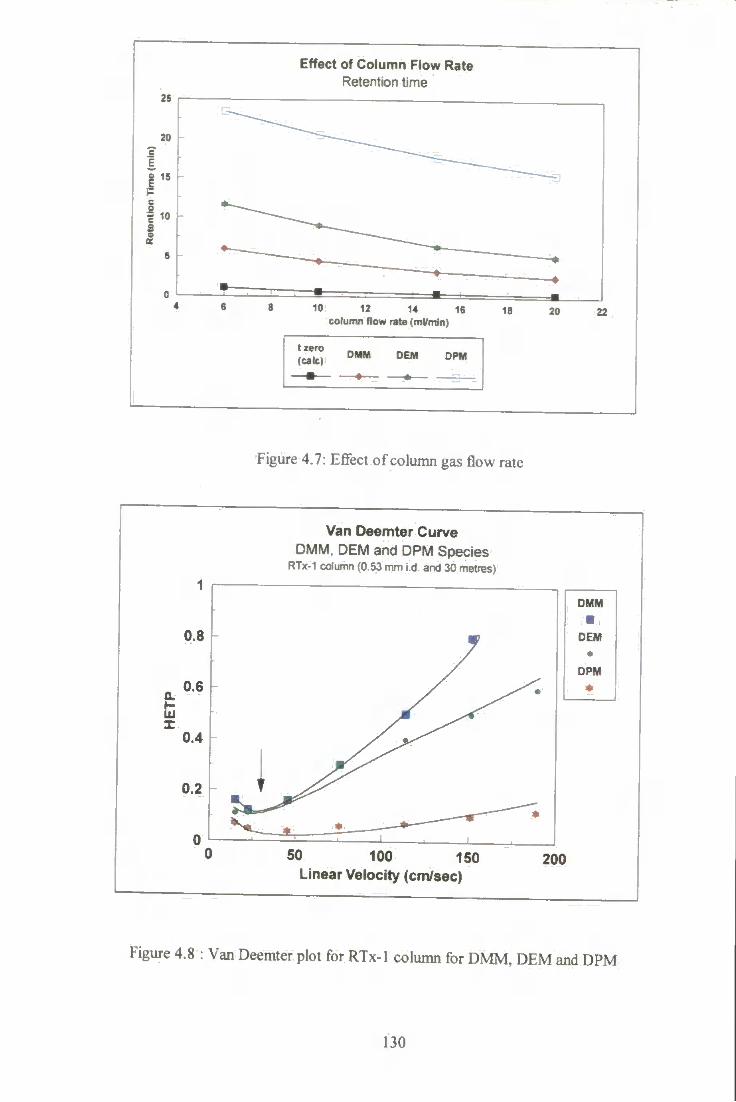
4.3.4 Resohrtion of organomercury halides by non-polar
column 131
4.3.5 Retention times for mercury species on RTx-1 column 134
4.3.6 Chromatographic perfonnance using a polar cohmm 134
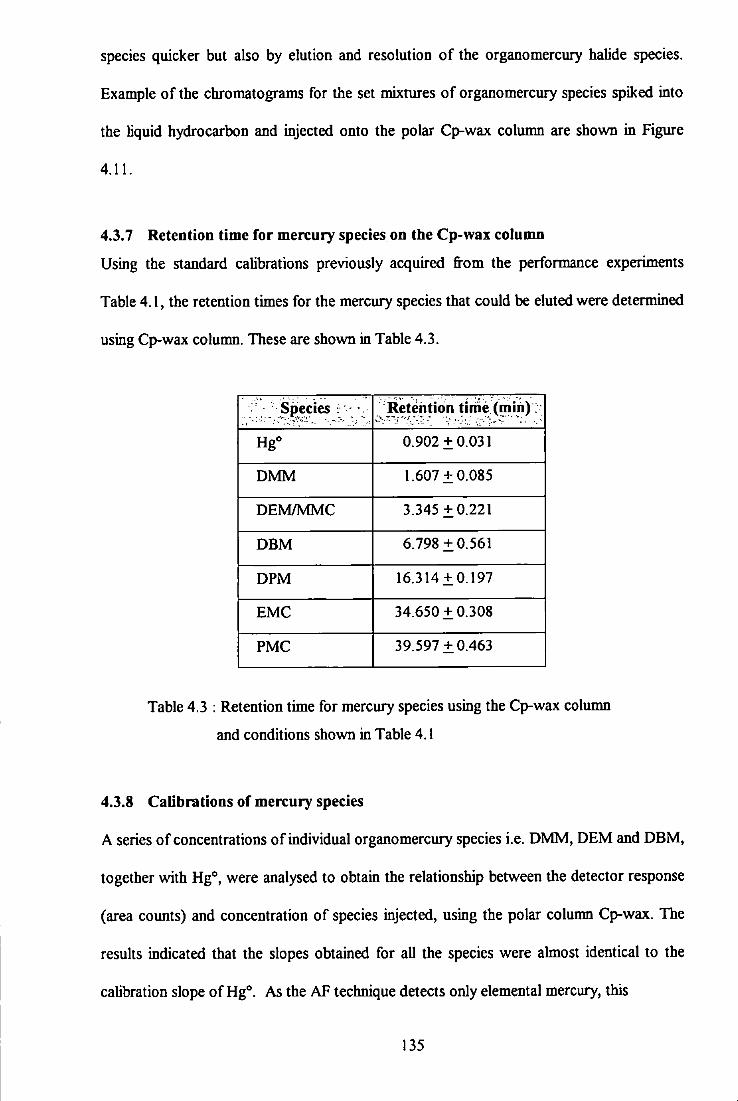
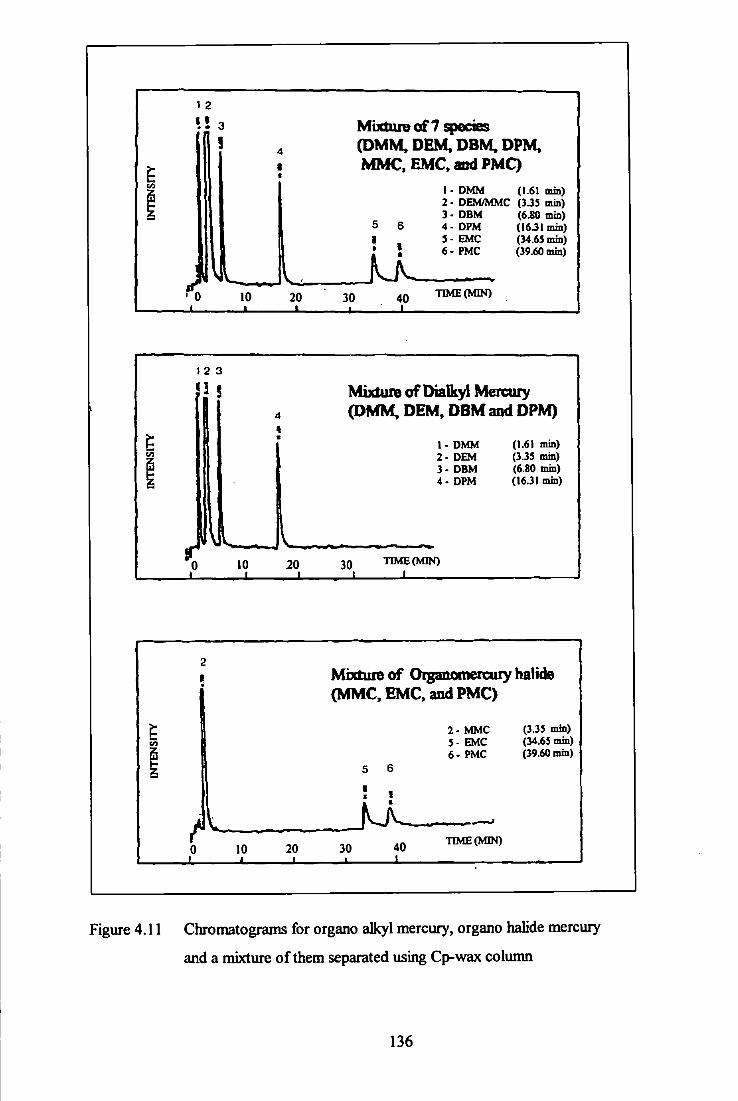
4.3.7 Retention times for mercury species on Cp-wax column 135
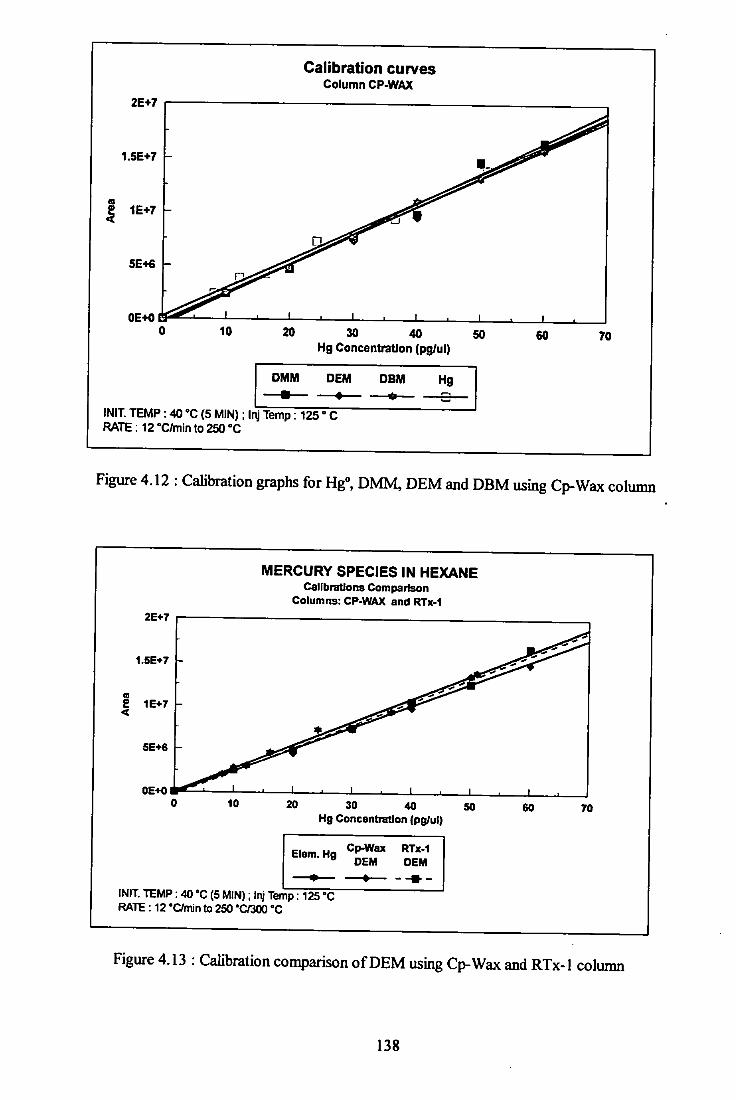
4.3.8 Calibrations of mercury species 135
4.3.9 Limits of detection 140
4.3.10 Speciation analysis of actual condensate 141 4.3.10.1 The RTx-1 non-polar column 141
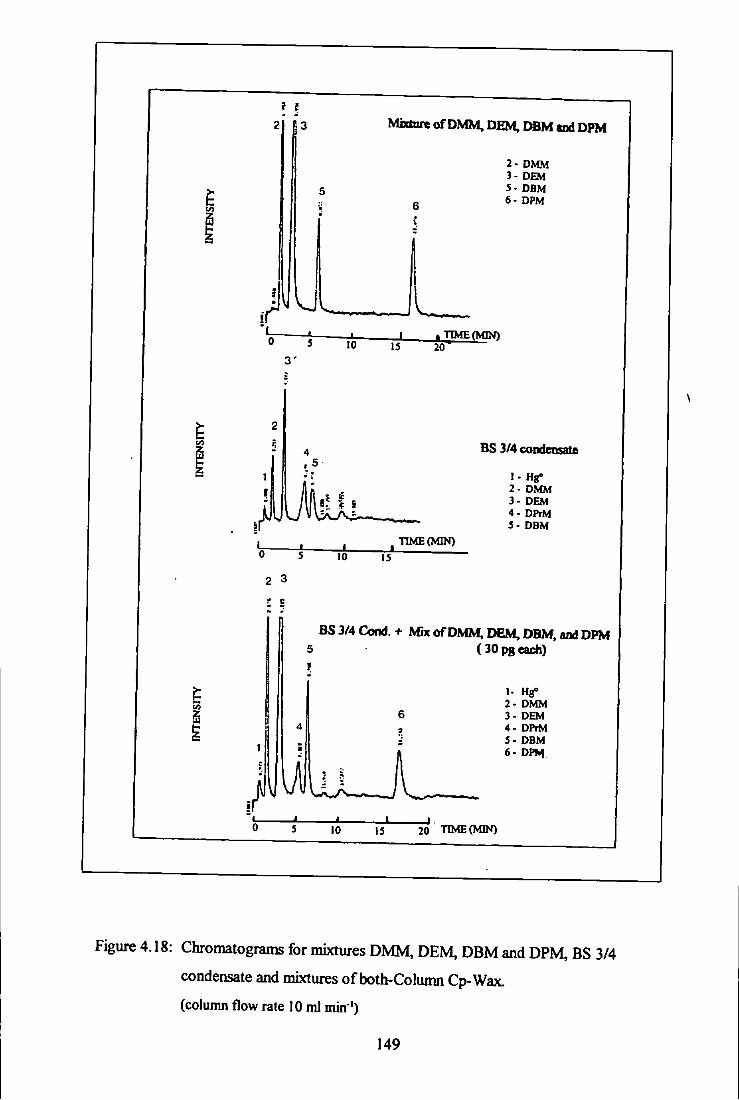
4.3.10.2 The Cp-wax polar column 146
4.3.11 Mass balance calculations 150
4.4 Conclusions 151
CHAPTER 5 : THE PRELIMINARY EVALUATION OF AN ADSORBENT-BASED MERCURY REMOVAL SYSTEM FOR GAS CONDENSATE 153
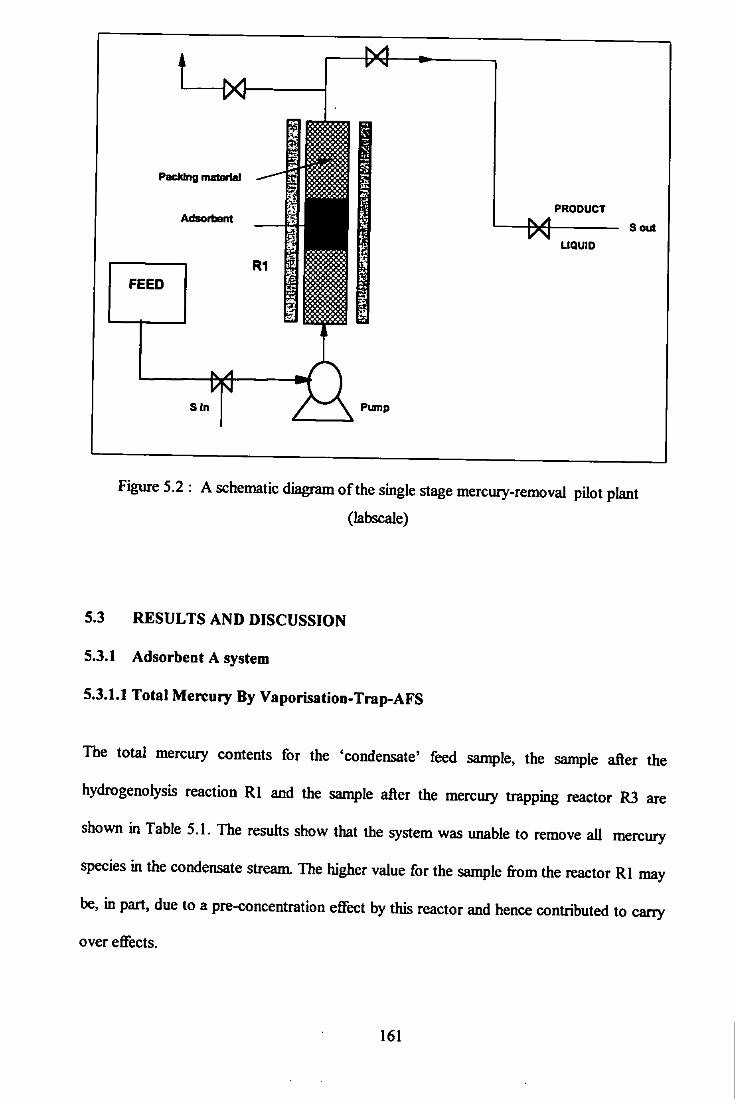
5.1 Introduction
5.2 Experimental
153
5.1.1 Characteristics of the mercury-removal system 154
5.1.2 Mercury-removal fix>m natxu^ gas condensate 155 5.1.2.1 Sulphide-containing ion exchange resin material 155 5.1.2.2 Sulphide-containing alumina 155 5.1.2.3 Other systems 156
5.1.3 Aims of the study 156
157
5.2.1 Chemicals 5.2.2 Identification of mercury removal adsorbents/catalyst 157
5.2.3 Testing procedure ^ '
I X
5.2.3.1 Two stage process 157 5.2.3.2 Single stage process 158
5.2.4 The determination of total and mercury species in samples 159
5.3 Results and discussion 161
5.3.1 Adsorbent A system 161 5.3.1.1 Total mercury by vaporisation-trap-AFS 161 5.3.1.2 Determination of mercury species content 162
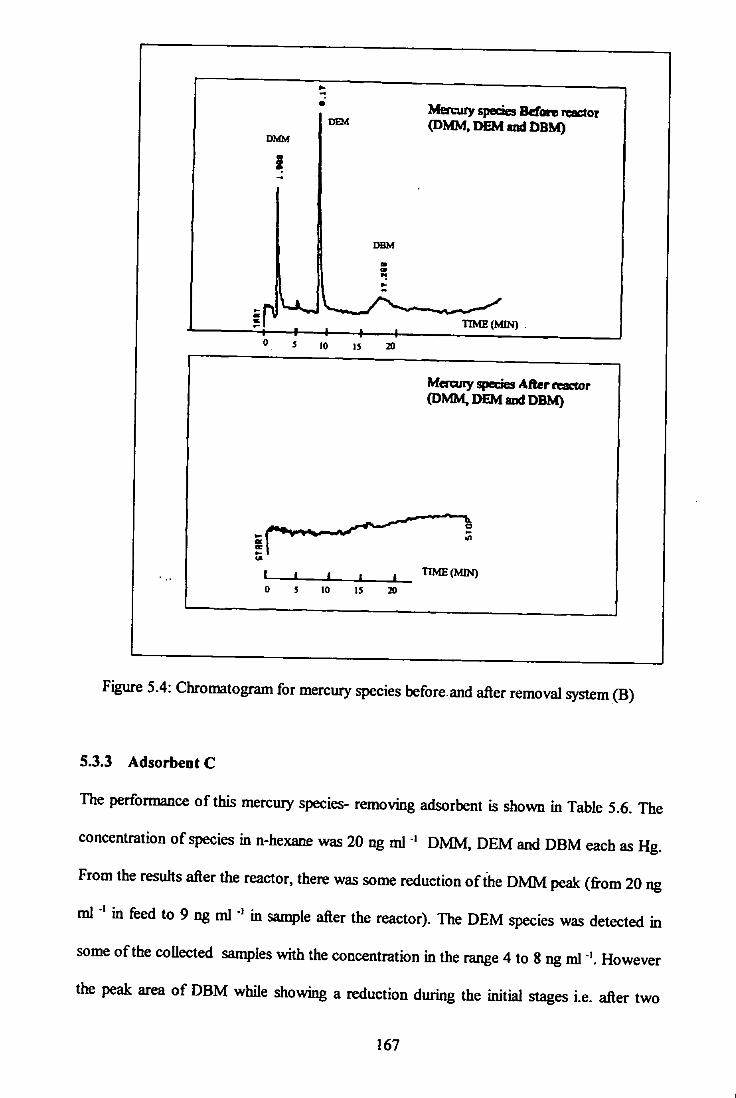
5.3.2 Adsorbent B 166
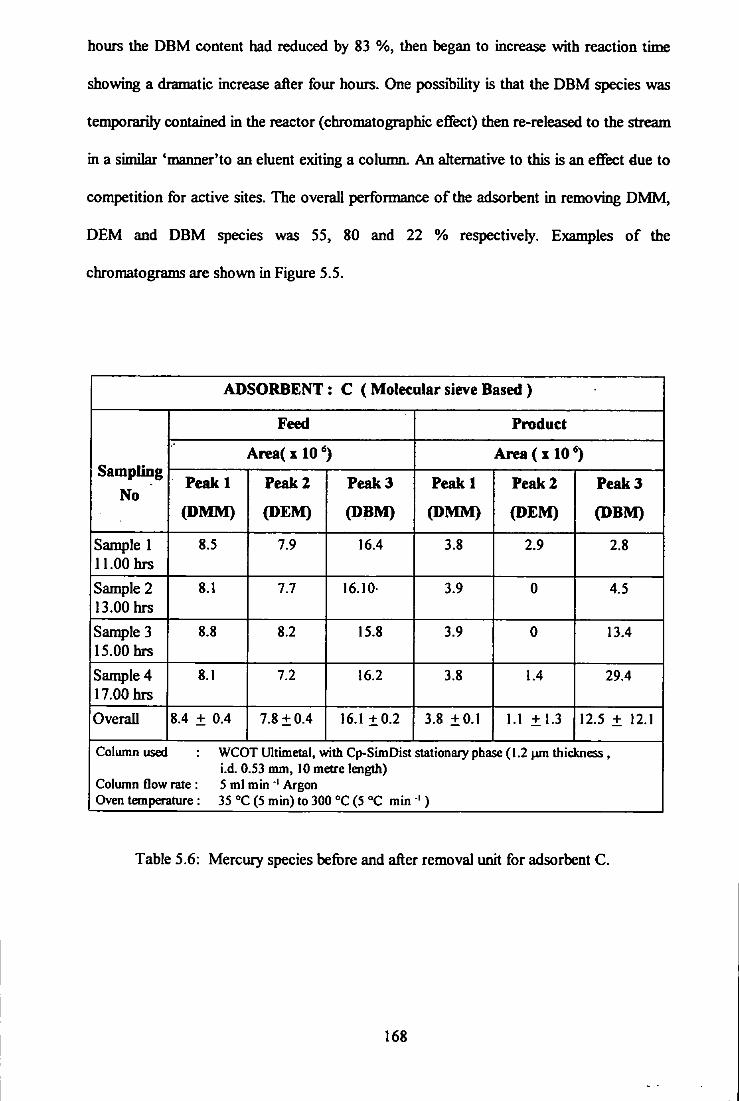
5.3.3 Adsorbent C 167
5.4 Conclusions 169
CHAPTER 6 : CONCLUSIONS AND FUTURE WORK 172
6.1 Conclusions 172
6.2 Future work 177
CHAPTER 7 : REFERENCES 180
PUBLICATIONS 195
PRESENTATIONS 195
LIST OF TABLES
1.1 Physical properties of Malaysian condensate. 3
1.2 Hydrocarbon type analysis (PONA) of BSTB condensate. 4
1.3 Distribution of mercury in gas condensate fi-om
South East Asia 6
1.4 Boiling point of mercury species that may be present
b a condensate. 1
1.5 Enthalpies of reaction between metals and water at 25 °C
and diffiision rate of metals into elemental mercury at
ambient temperature.
1.6 Estinoated world levels for mercury in natural gas
and condensate.
1.7 Summary of regulations and guideUnes regarding mercury
and mercury compounds.
1.8 Examples of microanalytical techniques for the determination
of mercury content.
1.9
13
15
18
26
Summary of mercury removal systems. ^2
2.1 Operating conditions for the continuous flow vapour generation 50
2.2 Summary of digestion/extraction procedures for
the determination of total mercury in gas condensate. 55
2.3 Recoveries of Conostan mercury compound spiked into
condensate, digested using acid persulphate. 58
X I
60
61
2.4 Recoveries of DPM and Conostan organomercury
compound spiked into condensate sanf le and hydrocarbon
samples after digestion by acidic iodideAodate. 59
2.5 Recoveries of mercury species spiked into condensate
and digested with iodide/iodate.
2.6 Recoveries of DMM, DPM, EMC and PMC species
spiked into condensate - treatment with dithizone,
thiosulphate and acid persulphate aqueous phase.
2.7 Recoveries of DMM, DPM, EMC and PMC species
spiked into condensate - extracted with thiosulphate
followed with oxidative digestion with acid persulphate. 62
2.8 Recoveries of mercury species treated with I-cysteine. 63
2.9 Recoveries of DMM and PMC spked into toluene. 63
2.10 Ionic forms of 1-cysteine at different pH*s. 64
2.11 Recoveries at different pH of l-cysteine. 65
3.1 Recoveries of DMM and DPM spiked into n-pentane. 75
3.2 Summary of operating conditions. 83
3.3 Recoveries for DMM and DPM added into toluene
- eflTect of volume injected (single size trap). 91
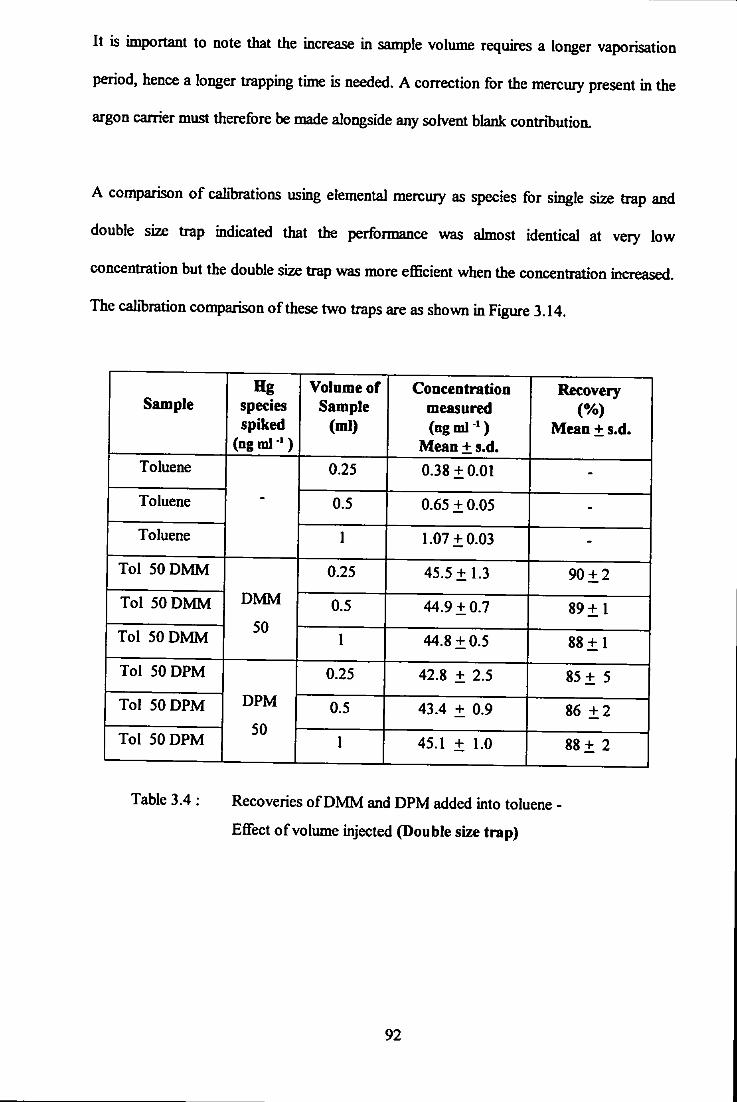
3.4 Recoveries for DMM and DPM added into toluene
- effect of volume injected (double size trap). 92
3.5 Summary of recoveiy performance. 97
3.6 Total mercury content in commercial condensates. 102
3.7 Total mercury content for condensate samples 1 to 4. 104
3.8 Total mercury in gasoline samples. 109
xii
3.9 Total mercury content of heavy oils (A and B). I l l
4.1 GC-pyrolysis-AFS operating conditions for RTx-1 cohmm 132
4.2 Retention times for mercury species using RTx-1 cohmm. 134
4.3 Retention times for mercury species using Cp-wax cohmm. 135
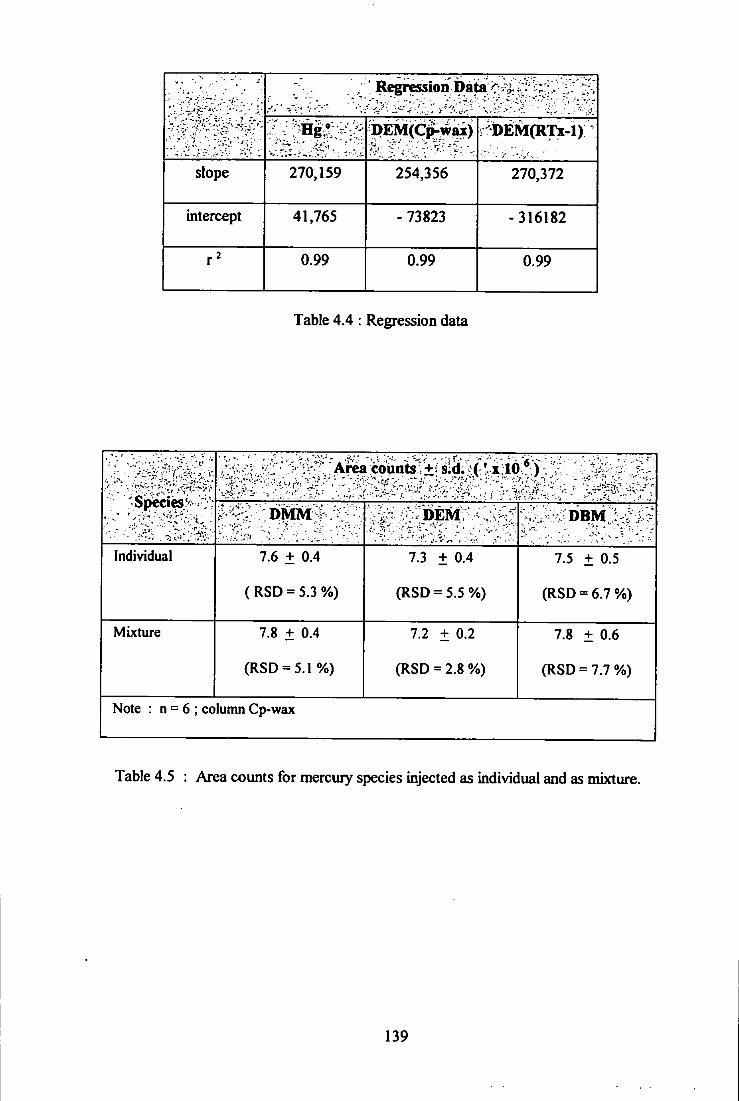
4.4 Regression data.
4.5 Area counts for mercury species injected as
individual and mixture.
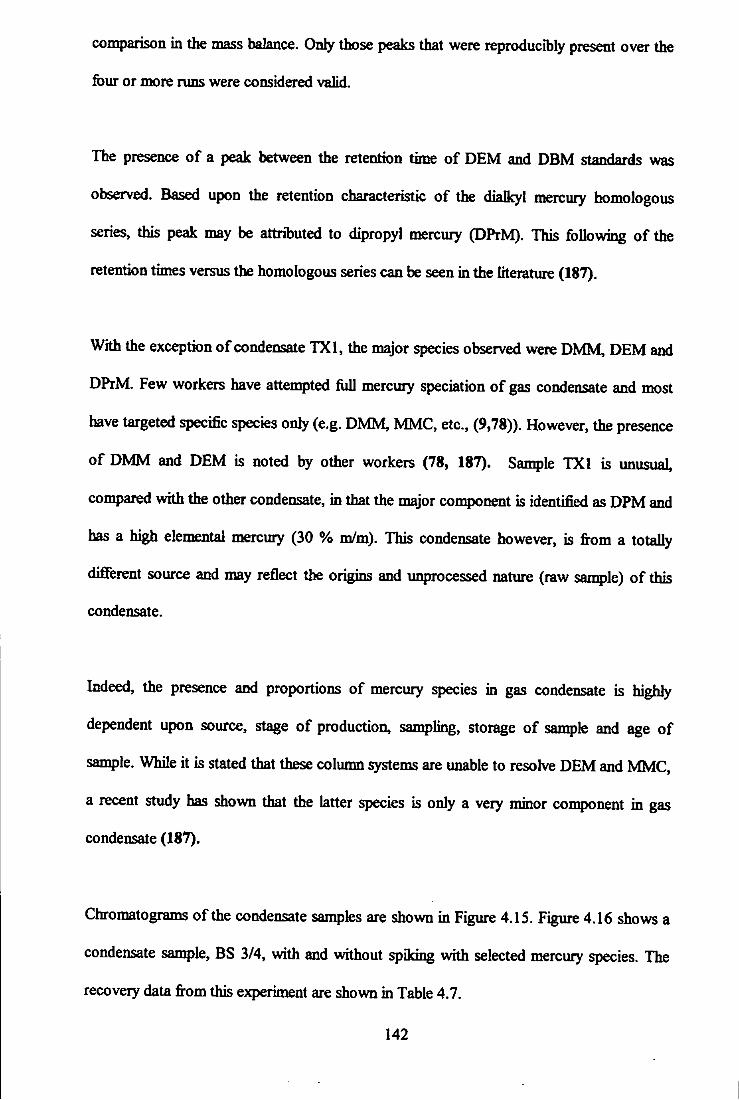
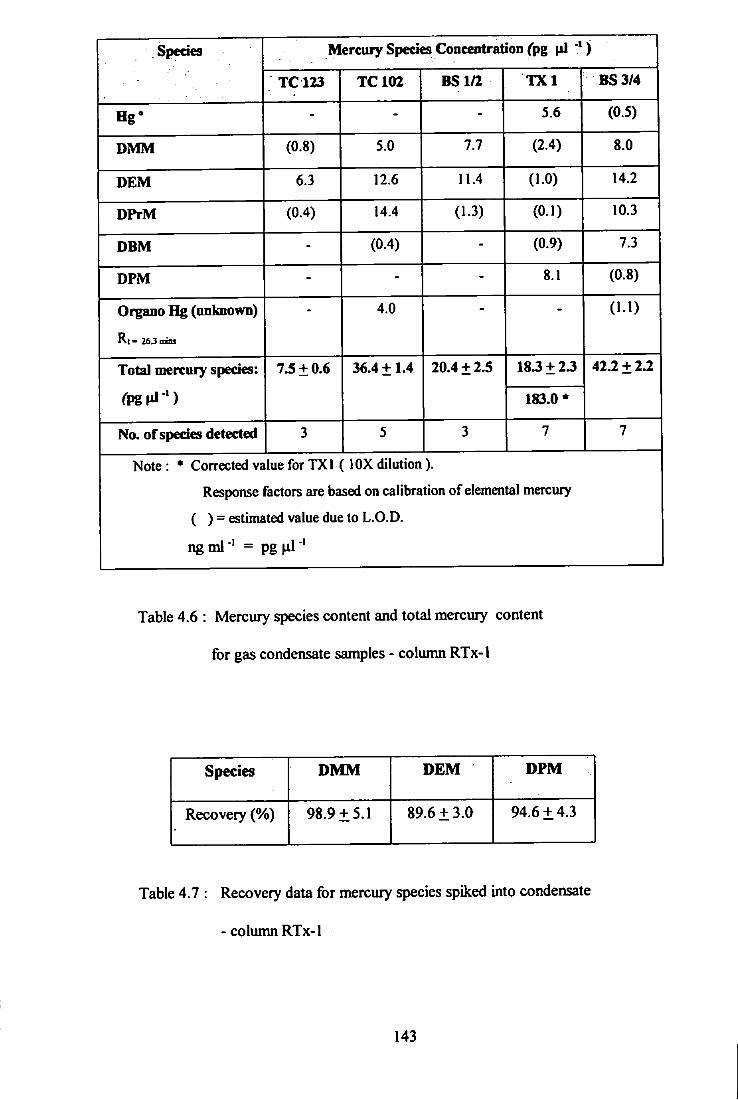
4.6 Mercury species content and total mercury content
for gas condensate samples - Cohmin RTx-1.
4.7 Recovery data for mercury species ^iked into
condensate - column RTx-1.
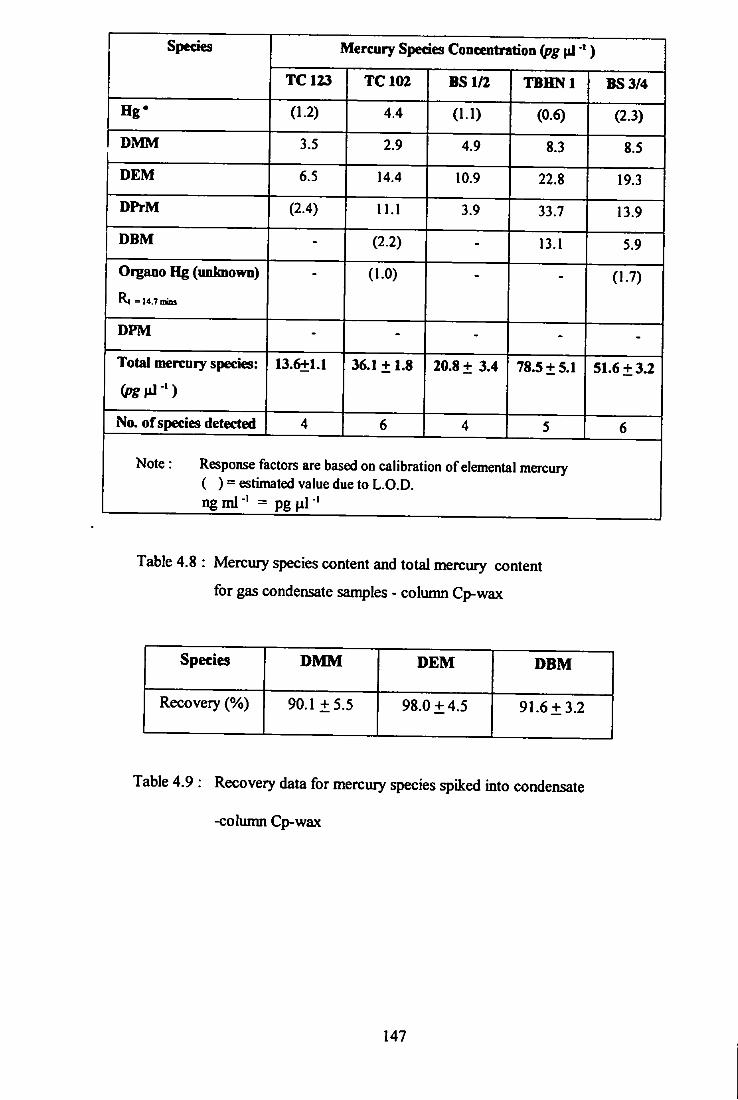
4.8 Mercury species content and total mercury content
for gas condensate samples - Column Cp-Wax.
4.9 Recovery data for mercury species spiked into
condensate - column Cp-wax.
4.10 Total mercury mass balance for condensate sample using
column sj^ems RTx-1 and Cp-wax compared with
vaporisation technique.
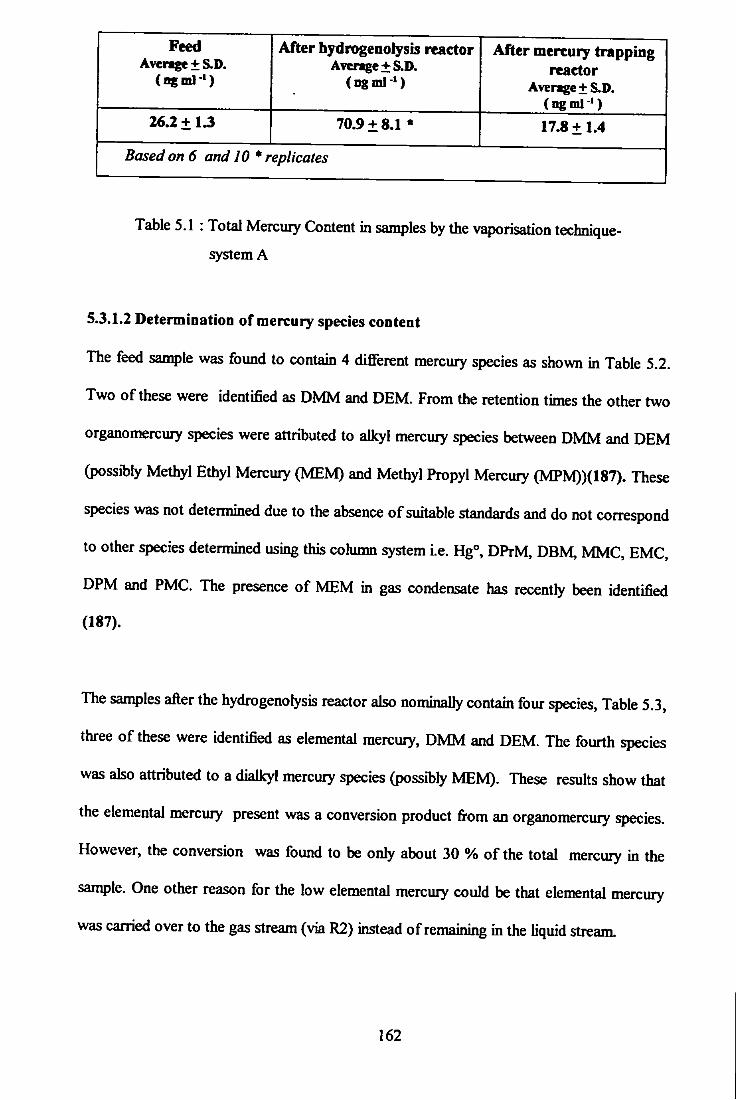
5.1 Total mercury content in samples by the vaporisation
technique - System A.
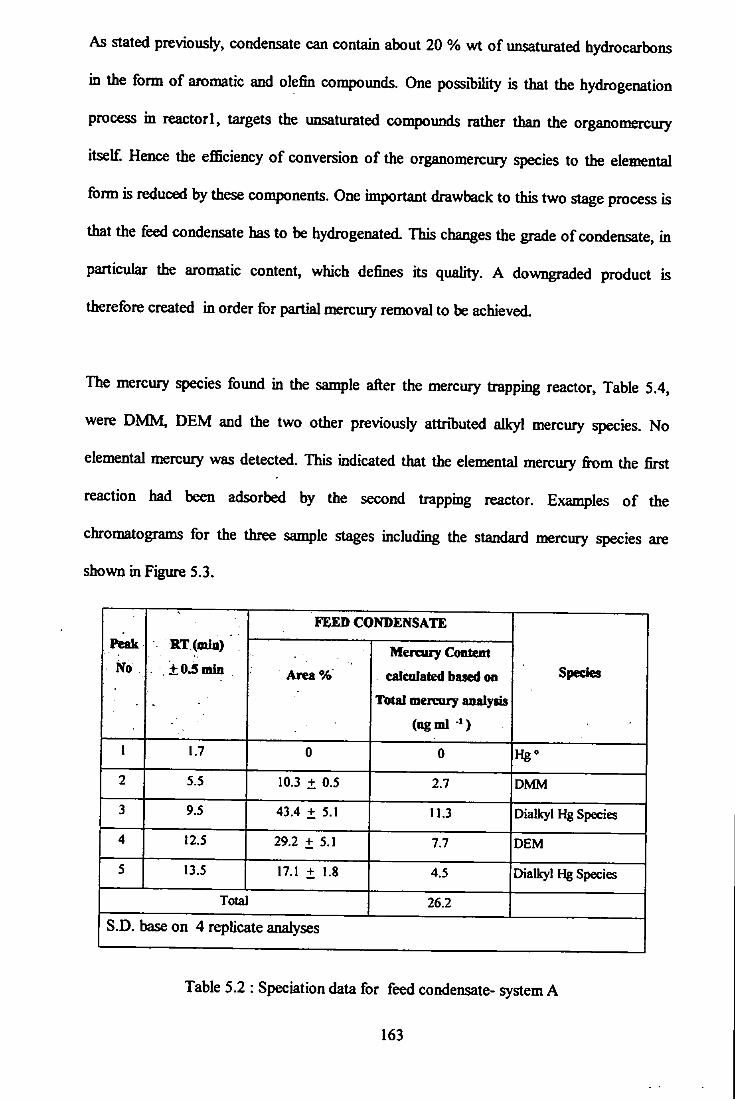
5.2 Speciation data for feed condensate - system A-
5.3 Speciation data for sample after hydrogenolysis reactor Rl
system A.
139
139
143
143
147
147
150
162
163
164
X I I I
5.4 Speciation data for sample after the mercury traping reactor R3 -
system A. 164
5.5 Mercury species before and after removal system
for adsorbent B. 166
5.6 Mercury species before and after removal system
for adsorbent C. 168
X I V
LIST OF FIGURES
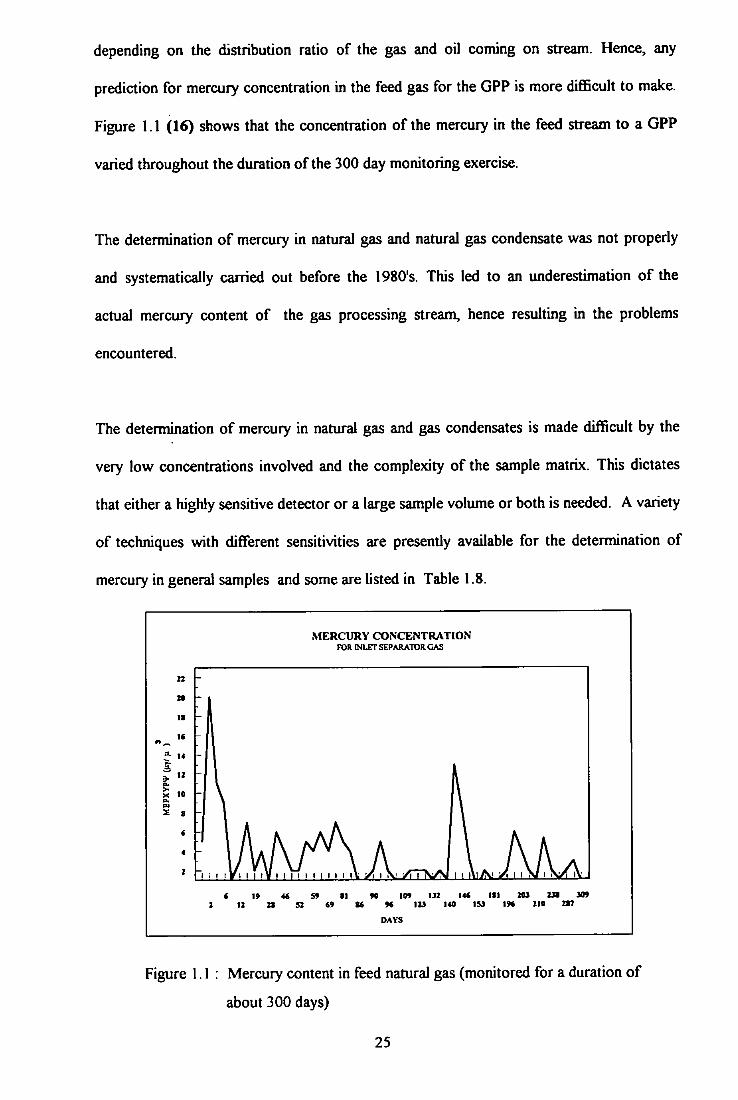
1.1 Mercury content in feed natural gas ( monitoring) 25
1.2 Energy transitions in atomic fluorescence 37
1.3 The atomic states and energy levels of mercury 38
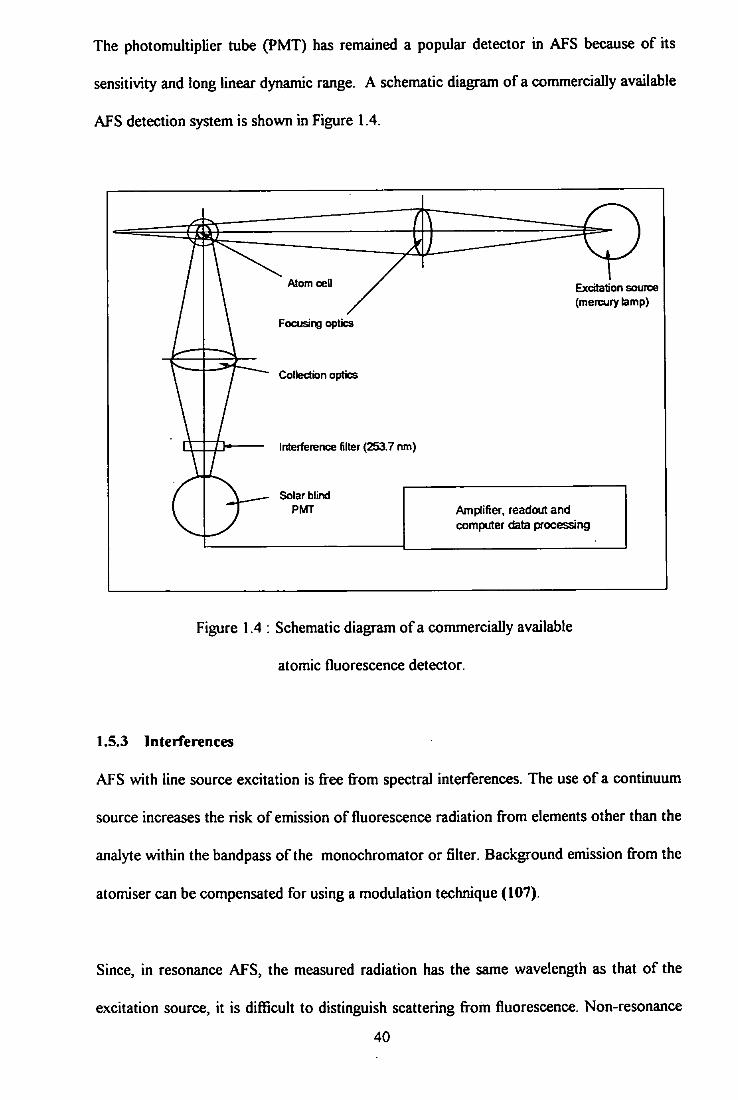
1.4 Schematic diagram of a commercially available atomic
fluorescence detector 40
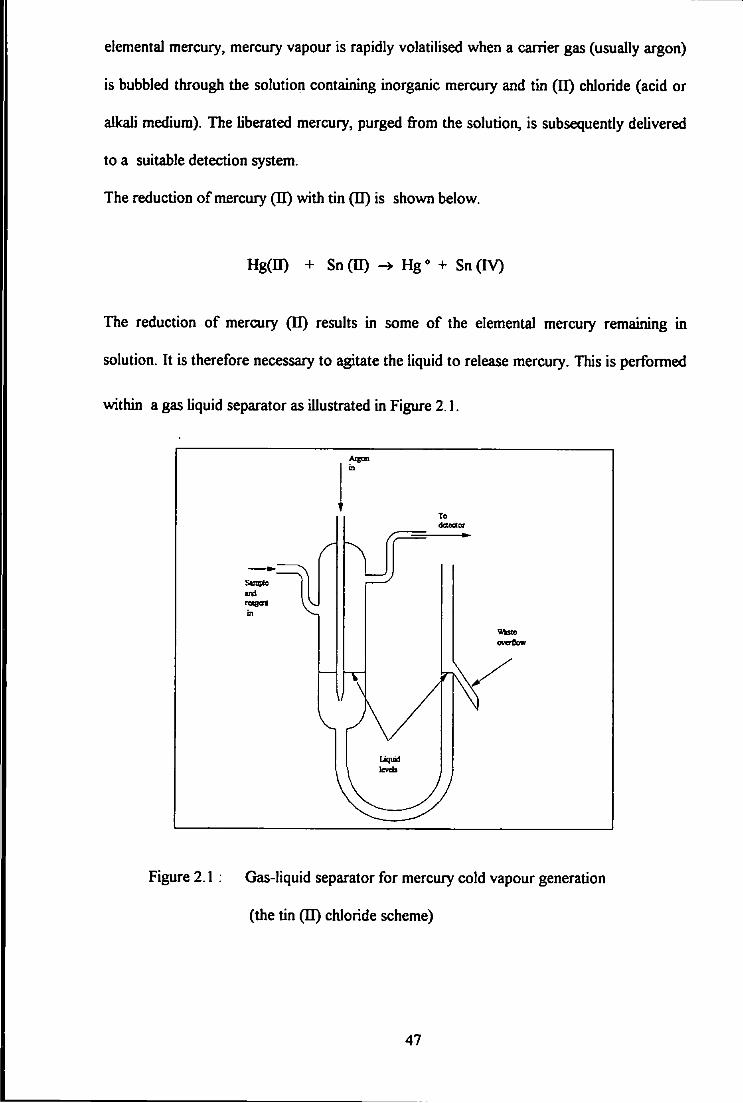
2.1 Gas-liquid separator for mercury cold vapour generation
(the tin (U) chloride scheme) 47
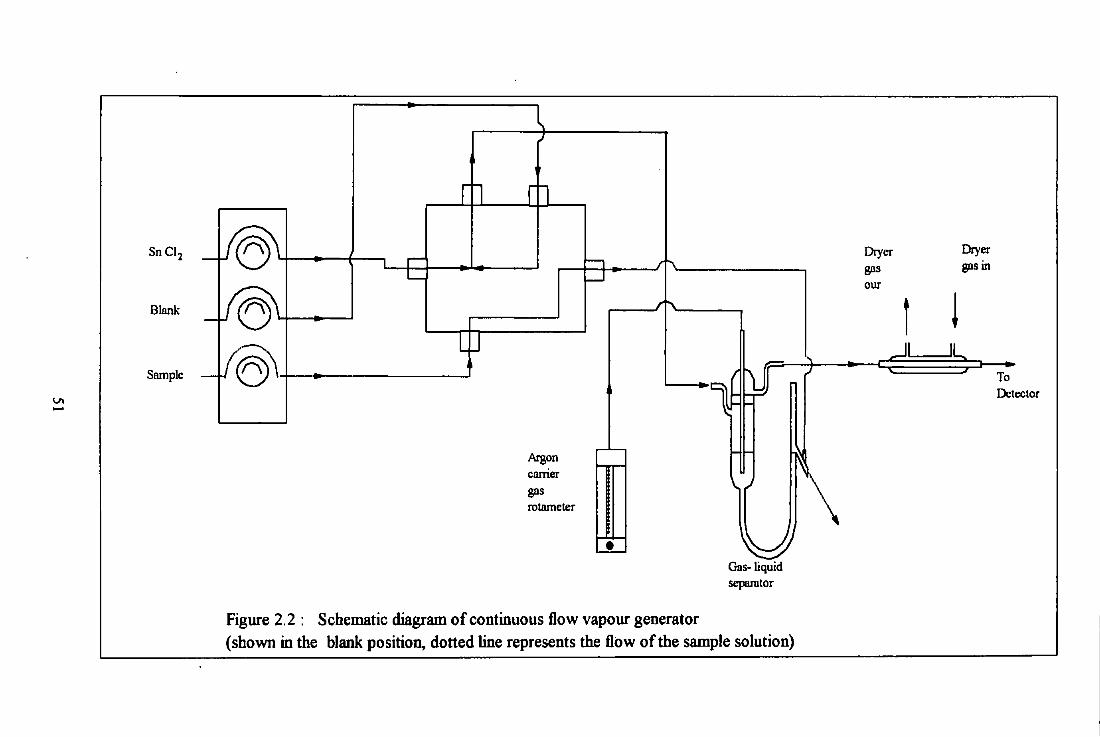
2.2 Schematic diagram of continuous flow vapour generator
in the blank position 51
2.3 Calibration graph for Hg (II) CI using different
digestion/exctration procedures 57
3 .1 Schematic diagram of a gold-coated silica trap. 73
3.2 Schematic diagram of vaporisation set-up used
in the preliminary study for the determination
of total mercury in condensate. 73
3 .3 Concentration of mercury species measured in spiked n-pentane. 76
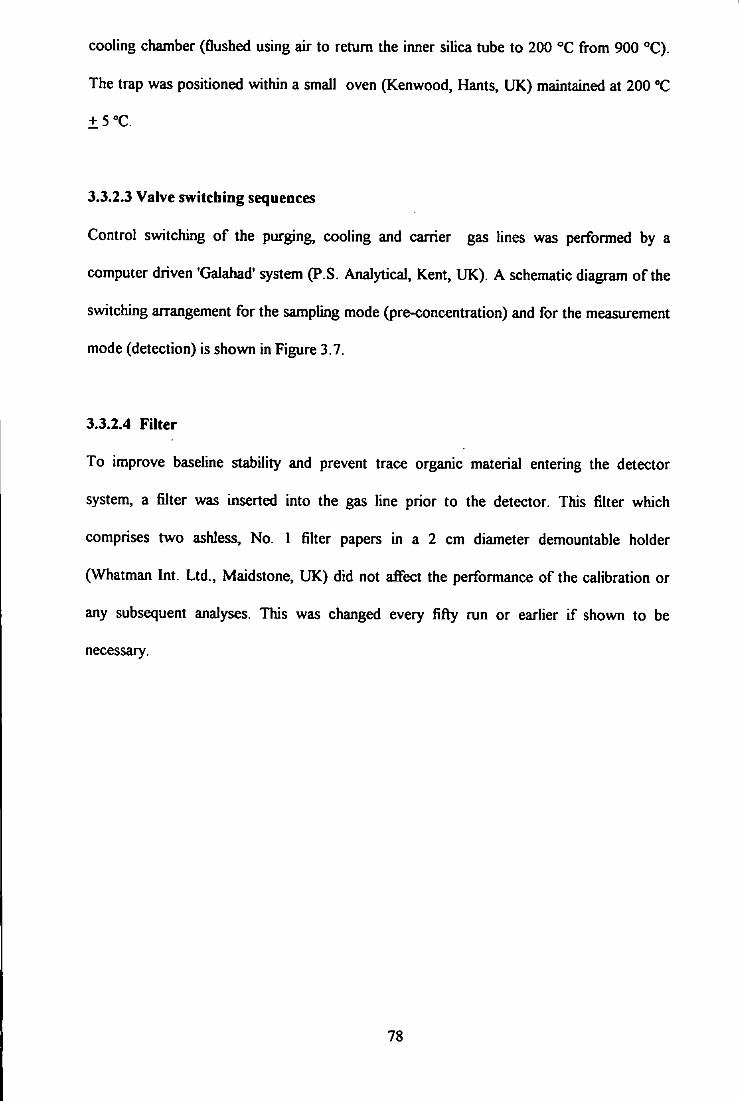
3 .4 Schematic diagram for the adsorption trap module. 79
3.5 Set-up picture for determination of total mercury in condensate. 80
3 .6 Schematic diagram of modular system for the determination
of total mercury in gas condensate by vaporisation technique. 81
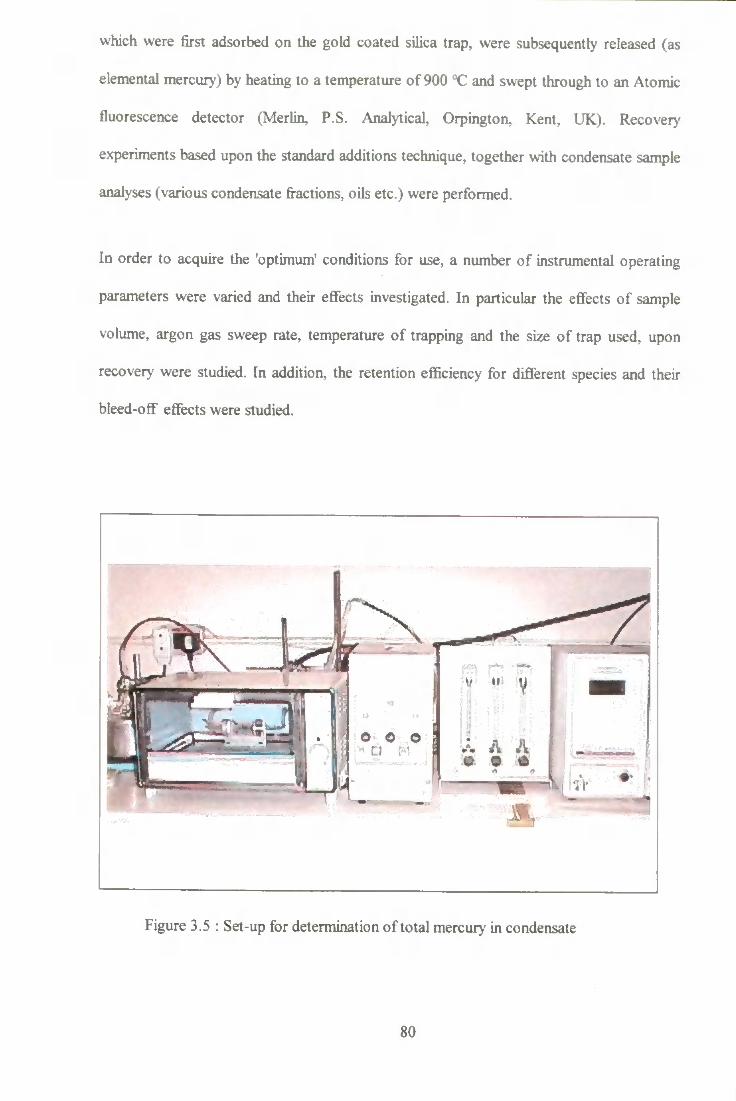
3.7 Valve switching sequences between (A) sampling mode and
(B) measurement mode. 84
X V
3.8 Calibration graphs for gold coated silica traps at
room temperature and at 200 ° C. 86
3.9 Stability of the trap in holding mercury at 200 C. 87
3.10 Calibration comparisons for several dialkyl mercury
compounds and elemental mercury. 87
3.11 Examples of volatograms of 10 ng ml
(DMM, DEM, DBM AND DPM) and
Volatogram of DMM at different concentrations. 88
3 .12 Effect of argon sweep gas flow rate upon signal response. 89
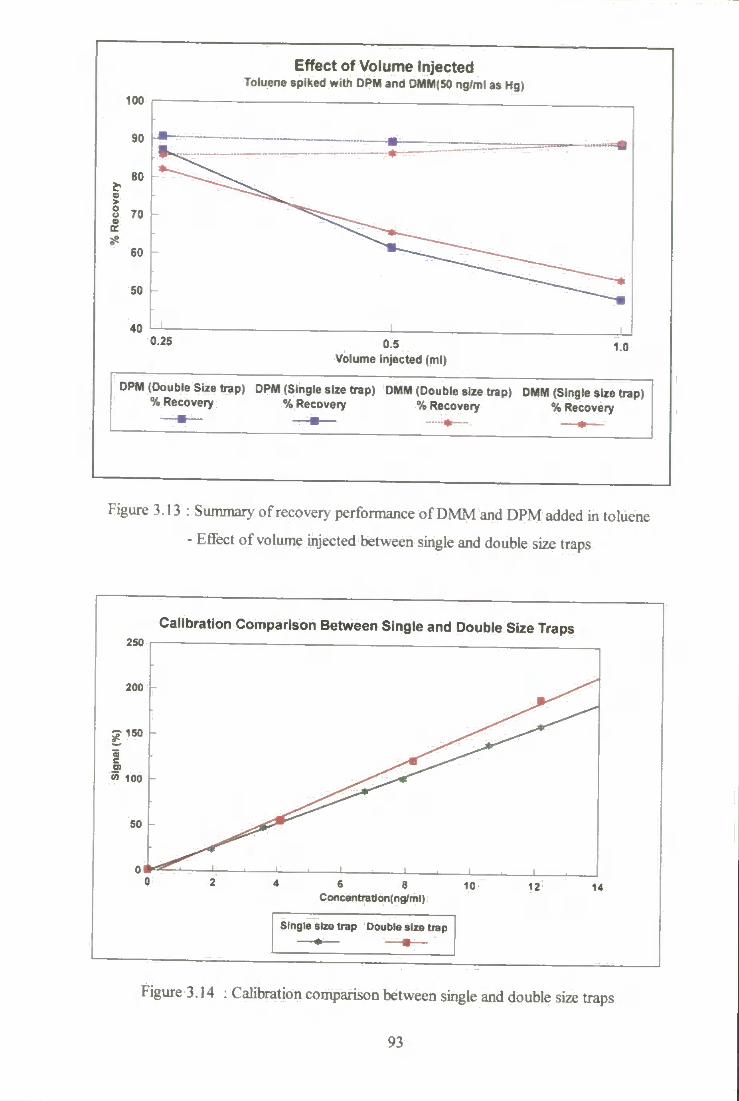
3.13 Summary of recovery performance of DMM and DPM added
into toluene - effect of volume injected between single and
double size traps. 93
3.14 Calibration comparison between single and double size traps 93
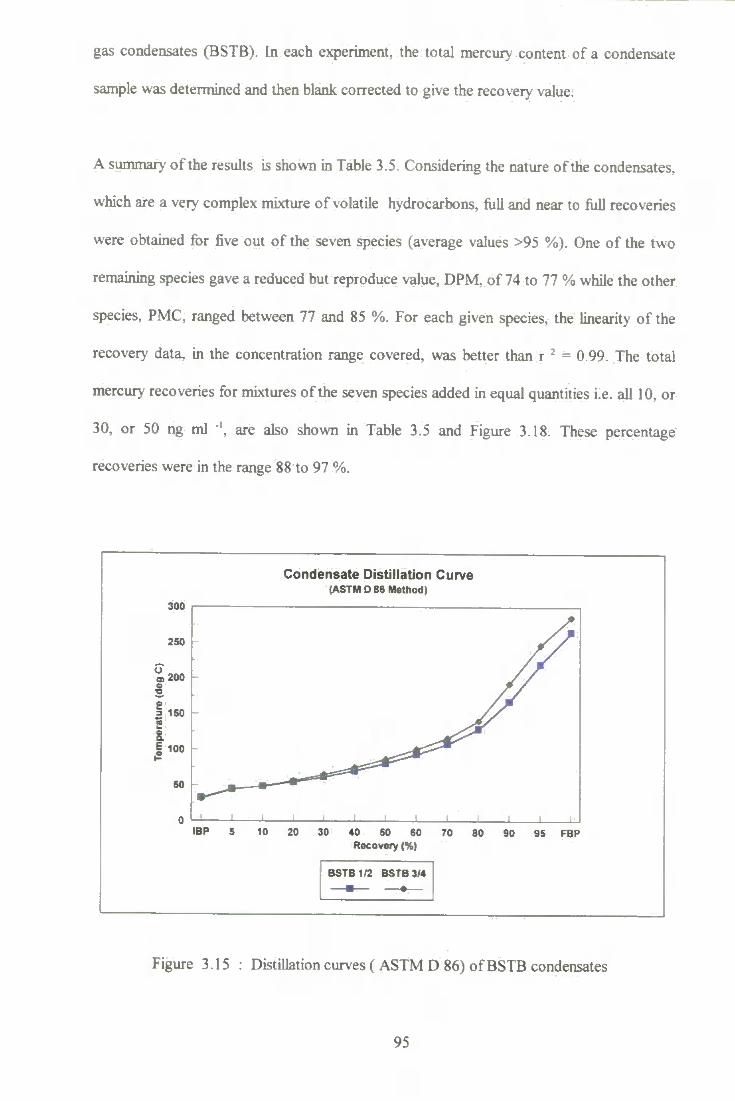
3.15 Distillation curve (ASTM D86) of BSTB condensate. 95
3.16 A typical chromatogram showing the hydrocarbon distribution
in gas condensate (PONA - ASTM D 5134). 96
3.17 Vapour-liquid phase envelope for BSTB condensate. 97
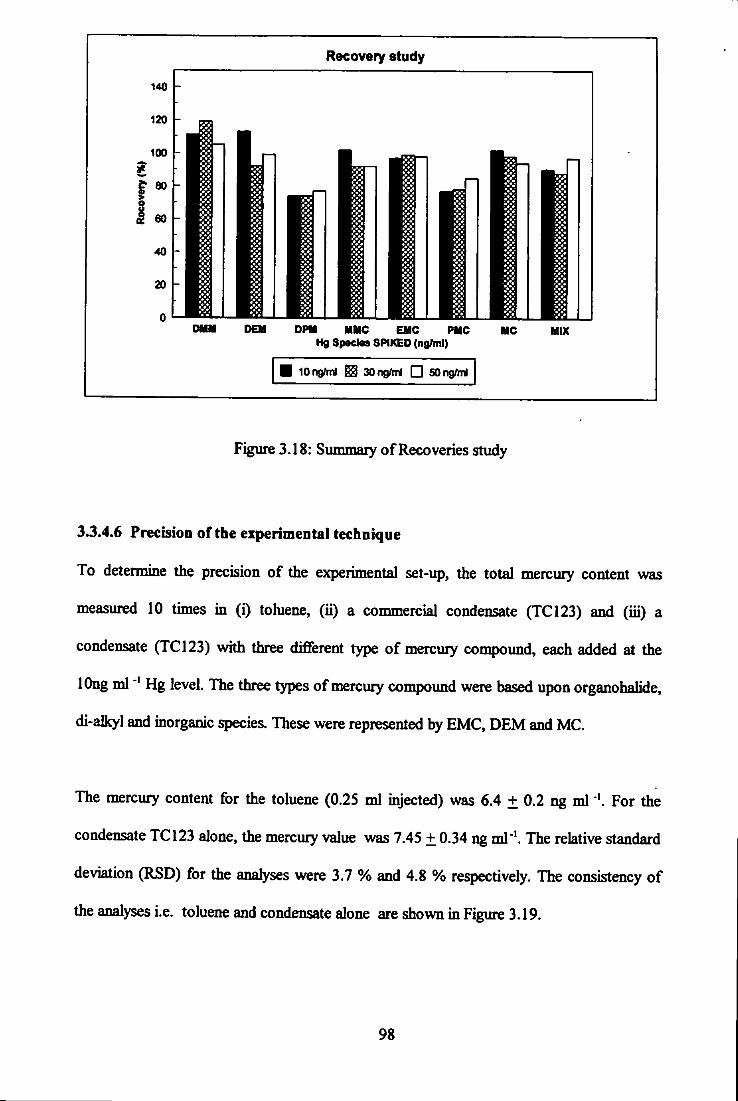
3.18 Summary of recoveries study. 98
3.19 Total mercury content in toluene and condensate TC 123. 99
3.20 Recovery of DEM, MC and EMC in condensate. 100
3.21 Recovery of Conostan in condensate. 100
3 .22 Total mercury in commercial condensate. 102
3.23 Volatogram of condensate sample 3 - 0.5 ml injected. 105
3.24 Volatogram of condensate sample 3 - 0.25 ml injected. 105
3.25 Volatogram of condensate sample 4 - 0.5 ml injected. 106
X V I
3.26 Volatogram of condensate sample 4 - 0.5 ml injeaed
(1:1 dilution) 106
3 .27 Volatogram of condensate sample 3 - 0.25 ml injected
(l:ldilution) 107
3.28 Volatogram of condensate sample 3 - 0.5 ml injected
(l:ldUution) 107
3.29 Volatogram of condensate sample 4 - 0.25 ml injected
(1:2 dilution) 108
3 .30 Volatogram of heavy oil B, 5 times dilution. 111
3 .31 Volatogram of heavy oil B, 20 times dilution. 112
3.32 Volatogram of heavy oil B, 50 times dilution. 112
3.33 Volatogram of heavy oil A, 100 times dilution. 113
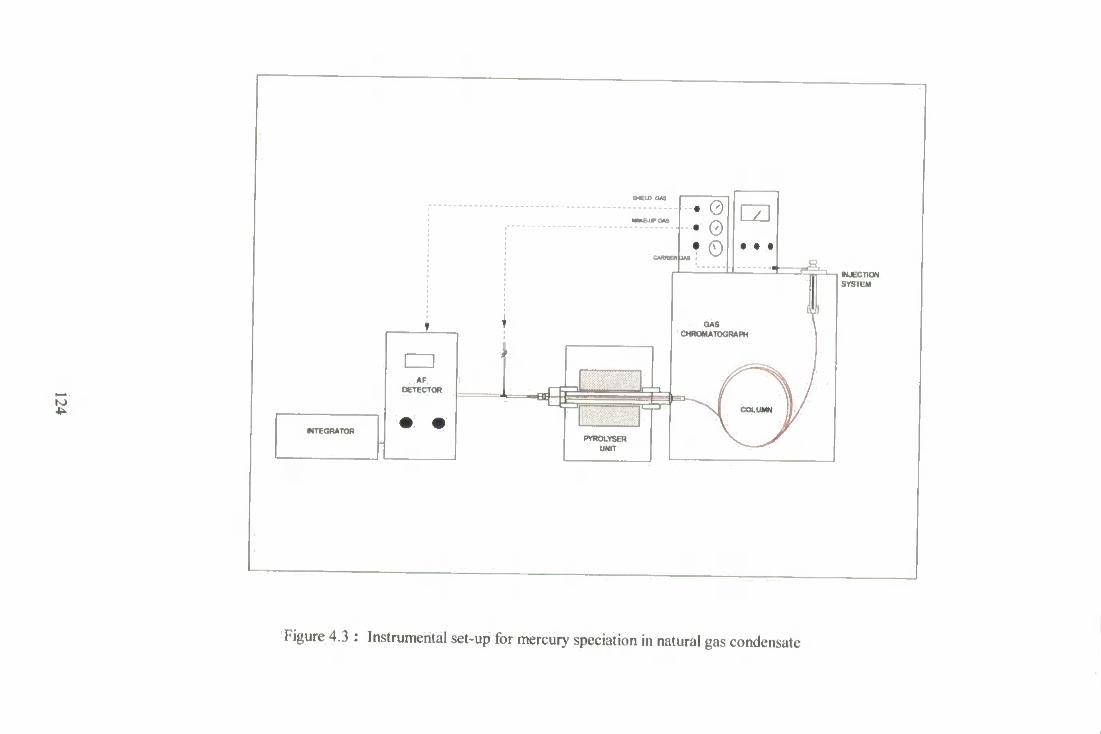
4.1 A diagram of the pyrolyser unit. 123
4.2 A diagram of the injector system. 123
4.3 Instrumental set-up for mercury speciation natural gas condensate. 124
4.4 Effect of injector temperature - elemental mercury formation. 126
4.5 Chromatogram for effect of injector temperature. 128
4.6 Chromatogram for effect of carrier gas flow rate. 129
4.7 Effect of column gas flow rate. 130
4.8 Van Deemter plot for RTx-1 column for DMM. DEM and DPM. 130
4.9 The effect of argon make-up gas upon mercury signal. 131
4.10 Chromatogram for dialkyl mercury, organomercury halide
and mixture of them - RTx-1 column. 133
4.11 Chromatogram for dialkyl mercury, organomercury halide
and mixture of them - Cp-Wax column. 136
xvii
4.12 Calibration graphs for Hg DMM, DEM, DBM and DPM
using Cp-Wax column. 138
4.13 Calibration comparison of DEM using RTx-1 and
Cp-Wax colum. 118
4.14 Area counts comparison for DMM species injected
individuallyand from mixture. 140
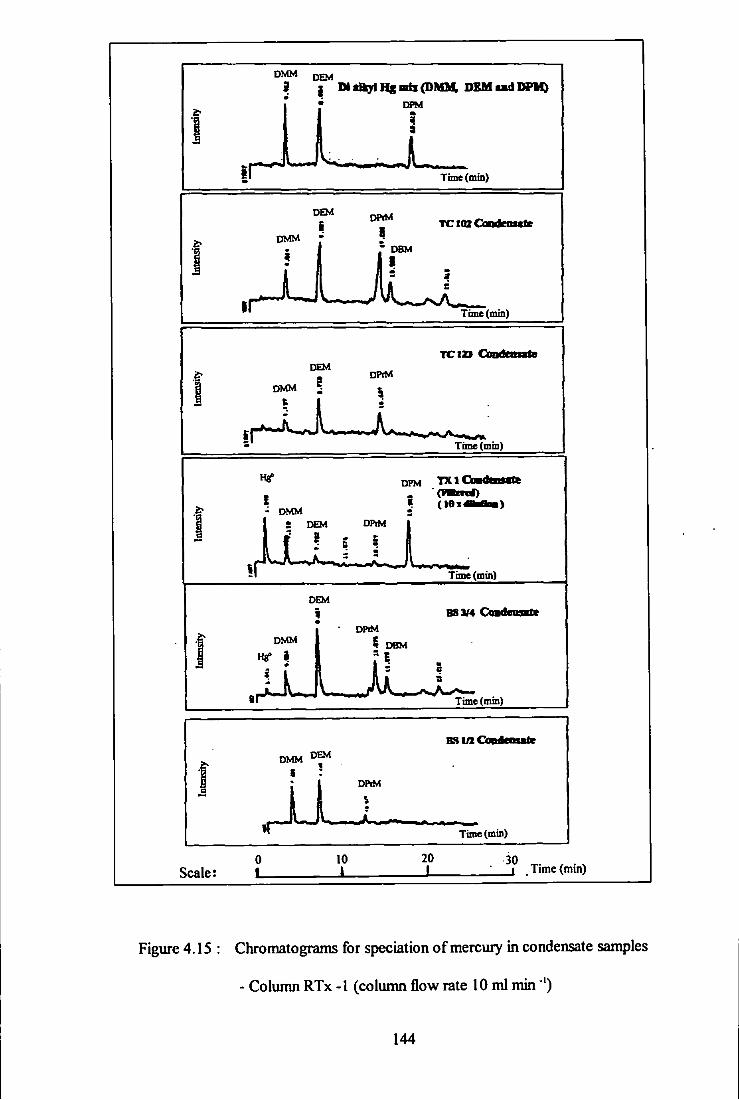
4.15 Chromatograms for speciation of mercury in condensate
samples - Column RTx-1. 144
4.16 Chromatogram of mixtures (DMM, DEM, and DPM),
BS 3/4 condensate and mixtures of both - Column RTx-1. 145
4.17 Chromatograms for speciation of mercury in condensate
samples - Column Cp-Wax. 148
4.18 Chromatogram of mixtures (DMM, DEM, DBM and DPM),
BS 3/4 condensate and mixtures of both - Column Cp-Wax. 149
5.1 A schematic of the two stage mercury removal pilot plant. 160
5.2 A schematic of the single stage mercury removal pilot plant. 161
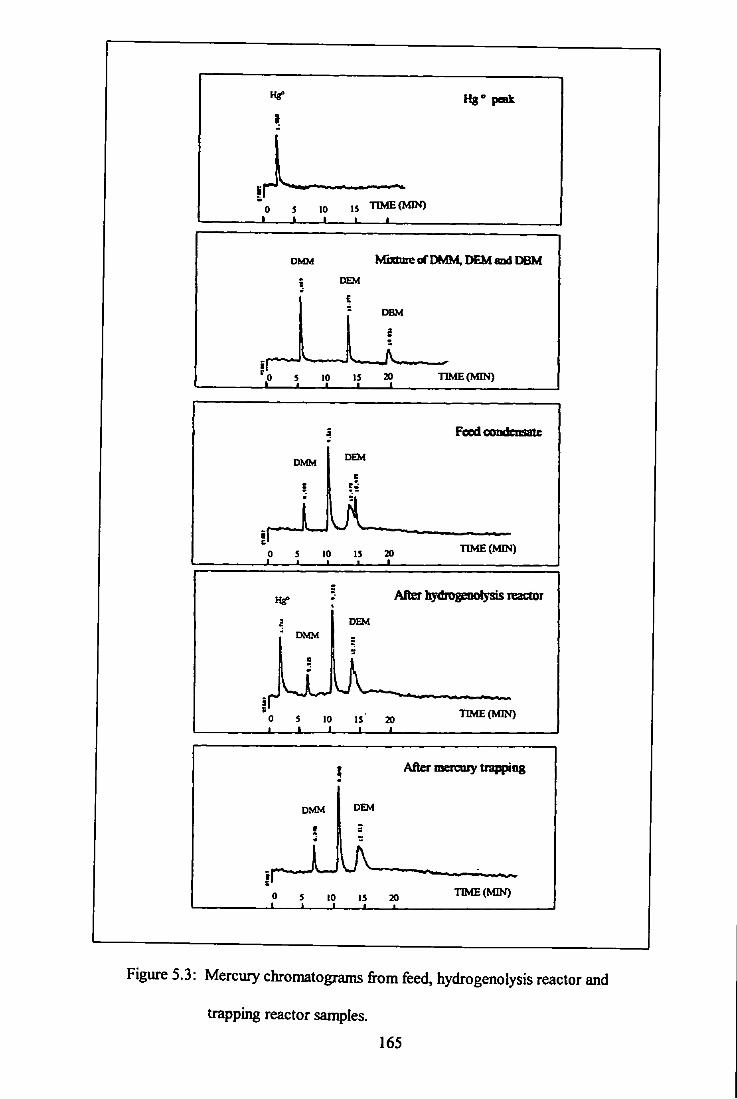
5.3 Mercury chromatograms for feed, hydrogenolysis reactor
and trapping reactor - system A. 165
5.4 Chromatogram for mercury species before and after
removal system B. 167
5 .5 Example of mercury chromatograms before and after
removal unit for adsorbent C. 169
XVIII
ACKNOWLEDGEMENTS
I would like to ofifer my sincere thanks to Dr M. E. Foulkes and Professor Les Ebdon for
their guidance and support over the last three years. Also thanks to Professor P.B.
Stockwell aiKi Dr Warren T. Corns for their support and advice. Many thank you to Dr
Andy Fidier, you are great.
I am very grateful to PETRONAS, Malaysia, for the studentship grant for this work and
maintenance expenses for me and my femily throughout the study period.
A super love to my wife Rozy, and all my children; Farid, Ainaa, Lina and Fuad for their
patient, understanding and moral support. Not forgotten my lovely kitten Sammy
Finally, many thanks to all staff in the University of Plymouth especially to aU laboratory
stafiFfor their assistance throughout my study.
AZMANSHAFAWI
XIX
AUTHOR DECLARATION
At no time during the registration for the degree of Doctor of PhUosophy has the author
been registered for any other university award.
This study was fully financed with the aid of a sponsorship grant firom PETRONAS
company, Malaysia, under their Staff Development Programme and has been conducted in
the Department of Environmental Sciences of the University of Plymouth.
Signed Date .J^LLZJI
XX
CHAPTER 1
INTRODUCTION
CHAPTER 1
INTRODUCTION
1.1 PETROLEUM INDUSTRY
l . L l Natural Gas and Natural Gas Condensate
Natural gas and natural gas condensate are complex mixtures of hydrocarbons. The source
of natural gas is mainly from gas fields and that associated with crude oil fields and gas
processing (1). It is believed that natural gas is formed from the decomposition of crude
oils or coal deposits. It contains mainly methane and ethane and i f it is more than 95 %
methane (excluding other inorganic gases i.e. carbon dioxide, nitrogen, helium, oxygen
etc.), it is known as *dry' natural gas. When it contains larger amounts of other gaseous
aikanes such as ethane, propane and butane it is known as 'wet' natural gas. Natural gas
may also contain small quantities of higher hydrocarbon isomers such as pentane, hexane
and heptane. In general, natural gas composition depends upon its origin. Sometimes wet
natural gas may even contain a hydrocarbon as high as octane. These higher hydrocarbon
components are separated and recovered as a liquid and used as fuel, or as refinery and
petrochemical feedstocks.
In the petroleum industry, the refining process can be defined as a combination of processes
that converts crude oil and other natural gas into marketable products (1). However, for
the gas industry, natural gas refining is usually referred to as a gas separation process which
converts natural gas feed stock via a combination of separation and purification processes
to produce marketable products either for direct utilisation as a fiiel or as a feedstock
material for other petrochemical processes.
Petrochemical processes can be defined as a combination of processes that utilise specific
feedstock, with either liquid or gas products obtained fi-om refining or gas separation, for
bulk production of speciality chemicals (1). Catalysts are usually involved in the processes.
Natural gas condensate is a liquid hydrocarbon mixtures that is an associate product of
natural gas. It is a highly volatile mixture that results fi-om a separation or condensation of
heavier hydrocarbon fi-actions of natural gas, or recondensation of hydrocarbons fi-om
crude oil oflf-gas. The composition of condensate depends very much on the origin of the
source. It is typically a mbcture of hydrocarbon isomers i.e. paraffins, naphthanes,
aromatics, with the carbon number of C 3 to Cjbut sometimes up to C15. A butane fi-action
may also be present as a minor constituent of these condensates. Natural gas and natural
gas condensates also contain other impurities such as sulphur compounds and of most
concern is the presence of toxic elements such as mercury and arsenic.
i.1.2 Characteristics of Natural Gas Condensate
The typical properties of natural gas condensate are shown in Tables 1.1 and 1.2. A
condensate obtained fi-om a natural gas field in Malaysia is taken as an example. The
condensate samples contain a mixture of hydrocarbons such as parafiBns, naphthanes and
aromatics. The composition of these condensates include parafi&ns with carbon numbers as
high as 15. Based on these properties, the condensate is as good as the naphtha fi-actions
obtained fi'om the processing of crude oil and can be considered as having a 'high value
petroleum fi-action' for applications other than as a fijel.
Tests Results
Methods Tests Unit Condensate 1 Condensate 2 Methods Recovery Recovery
Initial boiling point- IBP °C 32.1 31.0
5 % vol. recovered 44.3 44.0
10 % vol. recovered °C 48.4 48.7
20 % vol. recovered "C 54.8 56.4
30 % vol. recovered °C 61.7 64.6
40 % vol. recovered °C 70.1 74.4
50 % vol. recovered 80.6 86.5 ASTM D 86
60 % vol. recovered °C 93.1 100.4
70 % vol. recovered °C 107.6 116.1
80 % vol. recovered °C 128.4 140.5
90 % vol. recovered °C 167.5 192.7
95 % vol. recovered °C 219.3 246.5
Final boiling point -FBP °C 264.6 285.5
Percent recovered % vol. 98.0 97.6
Percent loss % vol. 0.4 0.7
Residue % vol. 1.6 1.7
Recovery ^ 200° C % vol. 93.9 91.5
Density 15* C k g l ' 0.7141 0.7245 ASTM D1298-85
API, Gravity @ 60 • F - 66 59 64.78 Calculated
Basic sediment & Water % vol. 0.00 0.00 ASTM D4007-81
Table 1.1: Physical properties of some Malaysian condensates
NO Hydrocarbon Type Carbon No Content (wt •/.)
Condensate 1 Condensate 2
I P A R A F F I N S P3 085 0.74
P4 678 6.24
P5 952 855
P6 946 85
P7 10.74 9 30
P8 7.86 708
P9 386 389
PIO 1.63 2 17
F l l 11 1.77
P12 0.85 2.2
P13 0.54 1.69
P14 0.22 1.94
PI 5 plus 0.16 4.49
T O T A L P A R A F F I N S 53.57 58 56
2 O L E F I N S 03-012+ 0.0 0.0
T O T A L O L E F I N S 0.0 0.0
3 NAPHTHANES N3 - -N4 - -
N5 0.94 087
N6 503 3.75
N7 17.13 13 69
N8 2.53 1.83
N9 2.82 2.47
T O T A L NAPHTHANES 2845 22.61
4 A R O M A T I C S A3 -
A4 -
A5 - -
A6 1 55 1.38
A7 533 4.70
A8 6.28 592
A9 3.76 4 1
AlO 0.65 1.35
A l l 021 071
A12 0.2 0.67
T O T A L A R O M A T I C S 17.98 1883
Table 1.2 : Hydrocarbon type analysis (PONA analysis) of BSTB condensate
4
1.1.3 Natural Gas Condensate Usage
As a hydrocarbon mixture and having properties almost similar to petroleum naphtha
fractions, the condensate is obviously a very valuable feedstock. It can be used in a variety
of applications either as a blending stock to crude oil for refinery processing or it can also
be used as a feedstock to various petroleum/petrochemical processes (1). One of the most
important is as a feedstock for catalytic cracking or thermal cracking, for the production of
intermediate products such as hydrogen, methane, ethane, ethene, ethylene, propane,
propene, C» hydrocarbons, high grade petrol and residues (fuel oil), and for catalytic
reforming processes for the production of aromatics and alicyclic compounds. The
intermediate products from these two building block processes can be used in various
secondary refinery and petrochemical processes or as a final product, depending on either
economic or market demands.
1.2 MERCURY IN NATURAL GAS AND THE PETROCHEMICAL
INDUSTRY
Mercury contamination is considered to be a 'critical severity" risk with a 'frequent to
probable' probability of occurrence (2). On a risk factor scale 1 to 9 (9 = very low risk), the
lack of a property placed and operating mercury trapping unit in natural gas plants,
petrochemical and refinery complexes is considered to be a risk factor of 2 or 3(3). Thus
within the design and operation of gas, liquefied natural gas (LNG), refinery and
petrochemical facilities, which operate v^th mercury-tainted feeds, a safety management
scheme strongly recommends the implementation of known protective measures to lower
the risk factor.
Knowledge of the total mercury content and of the different species present in natural gas
condensate is extremely important. Mercury in most forms is highly toxic, particularly when
present as the organo-mercury species and this causes great envirorunental concern. In
addition, the damage caused to industrial plants by the presence of mercury species can be
financially crippling especially when unscheduled shut-downs are forced. An example of
distribution of mercury in gas condensate fi-om South East Asia is shown in Table 1.3:
Fractions % total mercury
by weight
1 (Boiling points (B P.) <36°C) 8.9
2 ( B.P. 36 - 100 ° C) - Light naphtha 27.6
3 (B. P. 100 - 170 ° C) - Heavy Naphtha 33.8
4 (B. P. 170 - 260 ° C) - Kerosene 16
5 (B. P. 260 - 330 °C)-Diesel 7.4
6 (330+ ^'C)-Residue 6.3
Table 1.3 : Distribution of mercury in gas condensate fi-om south East Asia (7).
1.2.1 Mercury in Natural Gas Industry
Mercury occurs naturally, in trace quantities, in natural gas. Although difficult to
generalise, the typical mercury concentration in natural gas/natural gas condensate is
between 1 and 200 ng m (4^,6). Although the concentration of mercury in natural gas
and natural gas condensate may be considered to be very low, the effect is cumulative
because it almalgamates. Mercury in natural gas condensate may be present in various
chemical states: metallic, organic or inorganic forms, that all show unique
species-dependent physical, physiological and chemical properties (7^,9). Table 1.4 shows
the examples of mercury species that may be present and in general they correspond to the
boiling point of condensate (7).
Compounds Formula Boiling Point
Dimethyl mercury Hg(CH3)2 96
Diethyl mercury Hg(C2H,)2 159
Di-isopropyl mercury 170
Dipropyl mercury Hg(C3H7)2 190
Dibutyl mercury Hg(C4H9)2 206
Metallic mercury Hg° 357
Table 1.4: Boiling point of mercury species that may be present in a condensate (7).
The implications fi'om the presence of mercury in natural gas was not reported until 1973,
when a catastrophic failure of an aluminium heat exchanger occurred at the Skikda
liquefied natural gas plant in Algeria (6, 10,11,12). Investigations determined that mercury
corrosion caused the failure and that the mercury may have come fi-om an accidental
source, such as test instruments used in plant and field start-up (6),
After the Skikda failure, a study of the Gronigen field in Holland revealed similar corrosion
in the gas-gathering system. Carbon dioxide was initially thought to be the cause, but later
investigations pointed to naturally occurring mercury, with concentrations ranging fi-om
0.001 to as high as 180 ^ig m" ^ (11). In the Far East i.e. the PT Arun LNG plant in
Indonesia, the catastrophic-leak in an aluminium heat exchanger was reported to be caused
by breakthrough of mercury ft^om the mercury removal bed (13). The most recent mercury
contamination incident was again through the failure of the aluminium-made cold box in the
Petroleum Authority of the PTT plant in Thailand (12, 14,15). Other petroleum companies
such as PETRONAS in Malaysia are also experiencing the presence of mercury in their
natural gas and gas condensate. A mercury analysis and distribution study carried out in
1984 in the oflfshore fields indicated that the natural gas contained between 1 to 57 m
of mercury.
In a maintenance shutdovm of one of their gas plants in February 1991, approximately
1.2kg of elemental mercury (accumulated through a three year period since the last
turn-around) was collected in the liquefied petroleum gas (LPG) molecular sieve
regeneration system (16, 17). The mercury was suspected to be carried over in LPG
products and was trapped in the molecular sieve during LPG treatment. However, to date
no catasuophic failure has been reported by this company.
The presence of mercury in oil and gas is recognised world-wide and has been reported
for fields in Australia (18), the Commonwealth of Independent States (12, 19), Western
and Southern Africa, Chile and Venezuela (20), Canada, in several states in the US
(Kansas, Texas, Utah, Colorado, Oklahoma, and Wyoming) (21, 22), as well as The Irish
Sea, Japan and China (22).
1.2.2 Mercury in The Petrochemical Industry
As with the gas industry, several petrochemical companies, using natural gas liquids
containing mercury, have also had some unfortunate experiences of damaging cryogenic
heat exchangers at their petrochemical complex arising through mercury induced corrosion
in the low temperature separation trains (12, 23, 24). In addition, the upgrading of
mercury-contaminated natural gas condensates by steam cracking has led to severe mercury
poisoning of down-stream selective hydrogenation catalysts in many countries throughout
the worid (23). For example, palladium-based catalysts are used for selective hydrogenation
8
of acetylenic species in steam cracking of C2. C 3 , C 4 and other cuts. The few \ig mercury
species which can be present in the very wide boiling range in a condensate steam cracker
feed, are concentrated into the light fiactions of the cracker effluent. It was reported that
condensate feed containing 60 i)g ml of mercury shortened the selective hydrogenation
catalyst cycle period fi'om 1000 days to less than 30 days (12). The catalyst deactivation
was accompanied by this greatly reduced catalyst life-time because of active metal
(palladium) sintering which occurs when eliminating the mercury during catalyst
regeneration. It was also noted that the regeneration gas used, was also contaminated with
mercury. Other petrochemical processes directly or indirectly utilise a catalyst with
precious metals such as platinum, palladium, nickel etc. as an active surface. The presence
of mercury in any stream of a petrochemical process may easily poison the process. At least
one study has addressed the subject of adsorption and desorption of mercury on platinum
and palladium surfaces (25).
1.2.3 'Acceptable limits' for Mercury Content in Process Streams
The presence of mercury in the feed to gas and peuochemical plants will increase the risk
of corrosion of plant equipment and contamination of the environment. In general, the
lower the mercury content of the feed sueam, the better. However, lower limits which are
industrially accepted standard are as follows:
Natural gas 0.01 m
Natural gas liquids less than 5 g
These values are below the level considered to be dangerous to humans. The OSHA
regulations stipulate that the time weighted average (TWA) mercury content in air should
not exceed 50 m in an 8 hour working shift for a 40 hour week (26). For the purpose
of comparison, the mercury level in the respiration air fi-om an individual having an
9
amalgam filling is as high as \0 \ig m'^ (27). Thus, although the concern for mercury from
hydrocarbon streams is an environmental issue, the driving forces are plant safety and
operations issues (12).
As stated, the presence of mercury in natural gas can cause severe corrosion of plant heat
exchangers and poisoning of expensive catalysts used in downstream processing units. Both
lead to severe operational problems. In order to protect the equipment used in the
liquefaction process, it is necessary to reduce the mercury content to between 10 and 20 x\g
m , i.e. by a factor of 10
1.2.4 Corrosion efTect from mercury upon process plant
Trace amounts of mercury in LNG should concentrate in the heavier liquid phases, such as
the butanes and above. However, the more damaging mercury concentrations will most
likely occur in the cycled gas stream where losses are made up from the plant products,
methane through to pentanes (10).
Since mercury-induced corrosion occurs only in the presence of liquid water, the
temperature at which corrosion occurs must be between approximately O C and the highest
temperature at which a water dew-point can occur. There is only one condition of
operation in which this temperature can occur, i.e. when the plant is allowed to warm
above 0 ' C, for example for shut-downs.
The characteristics of mercury corrosion (10,13) are as follows:
• Attack on exchanger tubes is often on the refrigerant side.
• Elemental mercury is found and not compounds of mercury.
• The corrosion product is usually oxide or hydroxide.
• Liquid water must be present.
• Corrosion is more likely with the electropositive metals.
10
Mercury induced corrosion of aluminium cold-box equipment can proceed via two
mechanisms, mercury-induced stress cracking and mercury-catalysed oxidation by water (6,
10,11,12,13). The mechanism of all corrosion caused by the presence of metallic mercury
takes place in the following sequence:
• Elemental mercury amalgamates with the surface layer of the metal being
corroded.
• The minute amount of base metal alloyed with the elemental mercury is
exposed intimately, a short-circuited corrosion cell is formed between the
mercury and the base metal with liquid water as an electrolyte.
• In the presence of pure water and inert gases, the base metal in the
amalgam is corroded gradually by reaction with water.
If an acid anhydride, such as CO2 or H2S is present, the corrosion product is the metal
carbonate or sulphide.
1.2.4.1 Mercury-induced stress cracking.
Mercury forms amalgams (alloys) with almost all metals and leads to embrittlement of the
metals. Some brazed aluminium heat exchangers are known to have a magnesium-rich
phase at the aluminium metal grain boundaries (due to precipitation during welding). When
liquid mercury is brought into contact with this anodic phase, dissolution occurs by the
following reaction:
4Hg + AlsMgz ^ 2MgHg2 + 3 Al (1.1)
Dissolution of the grain boundary is accelerated rapidly when stress is applied to the
attacked region. Stress-cracking occurs by the propagation of a crack from the point of
11
mercury attack on the magnesium-rich phase through the connecting grain boundaries. The
embrittJement may occur with the metals that have a high diffusion rate into mercury.
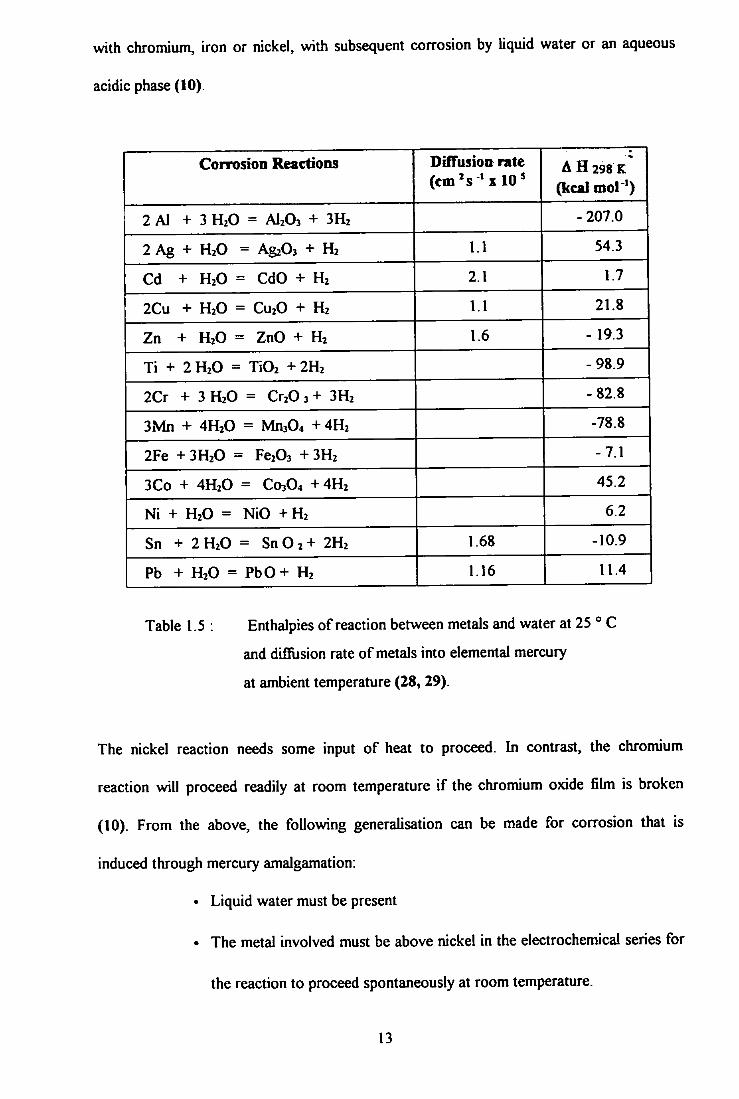
1.2.4.2 Mercury-catalysed oxidation by water
The enthalpies of reaction and Gibbs free energies of formation of various oxides from
reaction between metals and water at 25 °C are given in Table 1.5. The net enthalpy and
net free energy change for aluminium are highly negative. The reaction with water is
exothermic and goes to completion at, essentially, room temperature. The reason that
aluminium is not normally attacked by water is its tightly adhering oxide film (alumina), a
protective layer, which is not present when aluminium is amalgamated with mercury in an
anaerobic atmosphere (15). Small fissures in this layer render the clean metal surface
susceptible to local oxidation by water. These chemical reactions, for aluminium, can be
described by the following equations:
Alx(s) + Hgy( l ) -> Al(x.2)(s) + H g y A l 2 ( I ) (1 .2)
H g y A l 2 ( l ) + 3 H 2 0 ( l , v ) - ^ Hgy( l ) + A l 2 0 3 ( s ) + 3 H 2 ( g ) (1.3)
Other metals, such as copper, require heat for the reaction to be sustained and will not
proceed to completion. Therefore, copper would not be expected to be attacked by liquid
water even in an amalgam, except at elevated temperatures. However, over a long period
of time, copper will be weakened by amalgamation, through alteration of its crystal
structure (10).
The corrosion resistance of stainless steel is dependent on the hard, tough, chromium oxide
film that is formed. Here, it can be can postulated that metallic mercury forms an amalgam
12
with chromium, iron or nickel, with subsequent corrosion by liquid water or an aqueous
acidic phase (10).
Corrosion Reactions DifTusion rate (em's 'x 10^
A H 298 K
(kcal mol ')
2 Al + 3 H2O = AI2O3 + 3H2 - 207.0
2 Ag + H2O = AgzOs + H2 1.1 54.3
Cd + H2O = CdO + H2 2.1 1.7
2Cu + H2O = CU2O + H2 1.1 21.8
Zn + H2O = ZnO + H2 1.6 - 19.3
Ti + 2 H2O = TiOi + 2H2 -98.9
2Cr + 3 H2O = Cr20 3 + 3H2 -82.8
3Mn + 4H2O = Mn304 + 4H2 -78.8
2Fe + 3H2O = Fe203 + 3H2 -7.1
3Co + 4H2O = C03O4 +4H2 45.2
Ni + H2O = NiO +H2 6.2
Sn + 2H2O = S n 0 2 + 2H2 1.68 -10.9
Pb + H2O = PbO+ H2 1.16 11.4
Table 1.5 : Enthalpies of reaction between metals and water at 25 ° C
and difilision rate of metals into elemental mercury
at ambient temperature (28, 29).
The nickel reaction needs some input of heat to proceed. In contrast, the chromium
reaction will proceed readily at room temperature i f the chromium oxide fihn is broken
(10). From the above, the following generalisation can be made for corrosion that is
induced through mercury amalgamation:
• Liquid water must be present
• The metal involved must be above nickel in the electrochemical series for
the reaction to proceed spontaneously at room temperature.
13
1.2.5 The Petroleum Industry and Environmental Impacts from Mercury
The oil industry and its products impinge on ail aspects of the environment. The seas, from
its extraction and transportation; the land, from the impacts of extraction, pipelines,
processing plants and use; and the atmosphere, from its gaseous products and by-products.
It is implicated in "high profile' pollution, from accidents and ecosabotage at wells and
refineries, the decommissioning of marine installations, major spills at sea, through to the
contribution from its gaseous products to the greenhouse effect and respiratory diseases
(30).
Mercury is a naturally occurring contaminant in geological hydrocarbons and is distributed
freely throughout production, processing, transportation and consumption systems. As
shown in Table 1.6, hydrocarbons from different geological locations contain mercury in
microgram levels. The values shown are an estimation (31) and may change from time to
time, depending on geological factors and production practices.
Production and processing of gas and gas condensates containing mercury, invariably leads
to contamination of equipment and can generate waste in the form of sludge and spent
adsorbent material (31). The toxic contaminants from these activities can enter into the
environmental cycle and food chains easily, through emission during processing stages or
unregulated disposal of wastes or accidents.
The incident, in 1965 in Minamata Bay in Japan led to almost 50 deaths with hundreds
being seriously ill caused by mercury poisoning (32). The problem was traced to a
discharge by a chemical company. Other incidents involving mercury in the petroleum and
petrochemical industry have been discussed earlier in this chapter.
14
Mercury Concentratioo
Location - Gas
( H g m ^ )
Liquids
rugkg ' )
Europe 100- 150 -
South America 50- 120 50-100
Gulf of Thailand 100-400 400-1200
Africa 80- 100 500 - 1000
Gulf of Mexico (USA) 0.02 - 0.4 -
Overthrust Belt (USA) 5- 15 1 -5
North Africa 50-80 20-50
Malaysia (16,17) 1-200 10- 100
Indonesia (13) 200 - 300 10-500
Table 1.6 : Estimated world levels for mercury in natural gas and condensate (31)
The primary avenues of environmental contamination and worker exposure to mercury
involve the following:
Emission
The majority of the emissions involve exploration and production, marketing and
refining, from the use of fuel or from controlled flaring and venting, which are
necessary for safe operation (33).
• Spillage of mercury from instruments thus contaminating soil.
Soil contamination from spillage of mercury has been reported and has occurred
at compressor stations, metering stations and processing facilities (34,35).
15
Accumulation of spent mercury-adsorption material and spent catalysts (31).
Adsorbents are used to remove mercury from gas and/or liquid streams. The
sorbent materials are packed in beds designed to optimise contact. Over time,
they become expended and require replacement. The spent adsorbent therefore,
constitutes a secondary waste for a processor that employs this technology.
Equipment contamination by deposition of mercury from feedstocks.
Aluminium cryogenic equipment used in LNG and olefin processes can
accumulate mercury by deposition from gases and liquids as they are cooled. The
accumulation can cause equipment degradation in the form of cracking that causes
leaks (36).
Accumulation of sludge in condensate transportation vessels and storage tanks
and pipeline pigging debris (31).
Mercury can deposit in pipelines, transportation vessels and storage tanks.
Waste waters and formation waters, from processing well systems may contain
mercury compounds.
Treatment for mercury and other toxic species is essential, to ensure these waters
are free from contaminants, when discharged to the environment or for recycling
into the process stream.
16
1.2.6 Regulation and guideline levels for mercury in the environment
Mercury and mercury compounds are neurotoxins and are heavily regulated (Table 1.7)
(31,37,38) with a trend that has been towards increased stringency. There are many pages
of federal regulations that may apply to mercury waste originating from produced gas or
gas processing. It is important to consider how a hazardous waste is produced when
establishing legislation.
Sampling and analysis of elemental mercury spills are complicated by the non-uniform
dispersal of mercury in soil. The analysis of contaminated materials for determination of
waste classification or treatment efficacy, has historically used an EPA approach that was
not equally sensitive to all mercury species. The current situation is in transition, but
analysis for *total mercury' is becoming the only allowable method to classify mercury
containing-material (31).
17
Agency
WHO
Regulations
OSHA
Description
Guideline for drinking water mercury (all forms) Provisional tolerable weekly intake
Permissible exposure limit (PEL) Time-weighted average (TWA)
Organomercury compounds Mercury vapour
Ceiling limit Mercury (aryl and inorganic)
Short term exposure limit Organo (alkyi mercury compound)
Value
0.001 mgl - '
0.3 mg total mercury 0.2 mg methyl mercury
0.01 mgm"^ 0.05 mgm -
0.01 mgm"^
0.03 mgm '
Guidelines
NIOSH Recommended exposure limit (REL) for occupational exposure to mercury (TWA) Immediate dangerous to life or health (IDHL) level
Mercury Organo (alkyl) mercury compounds
Short-term exposure limit (STEL) mercury as Hg(skin)
Alkyl compounds
0.05 mg m
28 mgm ' 10 mgm "
0.03 mgm
EPA . Ambient water quality criteria to protect ^ human health:
Ingestion ofwater and aquatic organisms 146 ngl * Ingestion of aquatic organism only 146 ngl *
Figure 2.2 : Schematic diagram of continuous flow vapour generator (shown in the blank position, dotted line represents the flow o f the sample solution)
Dryer gas our
Dryer gas in
To Detector
2.4 SAMPLE DIGESTION AND EXTRACTION PROCEDURE USED I N
THE STUDY
A series of different digestion and extraction procedures were employed. In each case 5 ml
of sample (hydrocarbon matrix and/or base condensate, designation used in the study; BC -
Base Condensate, SBC-Spiked Base Condensate, HC-Hydrocarbon Mixture, SHC- Spiked
Hydrocarbon Mixture, T-Toluene and ST-Spiked Toluene), was treated in such a way to
produce intimate contact with each of five aqueous digestion and/or extraction routes. This
would allow transfer of the mercury-containing species to the aqueous layer prior to its
reduction for cold vapour generation.
2.4.1 Calibration
Calibration was performed by spiking Hg(lT)Chloride into the matrix matched aqueous
phase fi-om each digestion/extraction procedures and continuing through the vapour
generation step and AFS measurement.
2.4.2 Preliminary studies using acid-persulphate digestion
Samples of condensate (5 ml), spiked with Conostan organometallic mercury compound
(10 and 20 r g ml as Hg) were digested with 10 ml of nitric acid (cone.) and potassium
persulphate (O.lg or 0.2 g) in a three necked round bottom flask fitted with a reflux
condenser. The samples were stirred and heated to 40 °C for 2 hours. The flask was
allowed to cool before the condenser was rinsed with MiUi-Q de-ionised water. The lower
aqueous layer was separated into a 50 ml volumetric flask and diluted to volume with
Milli-Q water. A reagent blank was prepared by substituting toluene for the condensate
sample. Tin(n)chloride (5% m/v) in both acidic and alkaline media was used as reducing
agent.
52
2.4.3 (a) Preliminary studies using I ' flO 3 ' digestion
For the iodination reaction, 10 ml of hydrochloric acid (sp. gr, 1.18) was added to 5 ml of
sample condensate and to condensate samples spiked with DPM and Conostan
organometallic mercury compound (both 10 ng ml ' as Hg) in a 50 ml volumetric flask. An
aliquot, 5 ml (1:1) of iodide/iodate (0.05 M each) was added and the flask was shaken. The
excess iodine was removed by the addition of 3 ml of ascorbic acid (10 % m/v). The lower
aqueous layer was separated into a 50 ml volumetric flask and diluted to volume with
Milli-Q water. A reagent blank was prepared by substituting toluene for condensate. Tin
(D) chloride (5% m/v) in alkaline medium (4M NaOH) was used as the reducing agent.
2.4.3 (b) Further studies using I ' / lO 3 ' digestion
The above procedure was extended to include DMM, DPM, EMC and PMC species in the
spiking experiments.
2.4.4 Complexation with Dithizone, foUowed by eitraction using thiosulphate
and oxidative digestion with acid-persulfate
A 3 ml aliquot of citrate buffer [citric acid (21 g I ' ) and sodium hydroxide (8 g I ').
adjusted to pH 2 with O.IM hydrochloric acid] was added to 5 ml of condensate
sample/condensate sample spiked individually with the organic mercury compounds D M M ,
DPM, EMC and PMC (10 ng ml * as Hg). The mixture was mixed with 5 ml dithizone in
chloroform (1 nrunol I ' ) . The dithizone-mercury complexes were destroyed by shaking
with 3 ml of a 1:1 (w/v) mixture of 5% of sodium nitrate and acid solution consisting of
hydrochloric acid (O.IM), sulphuric acid (O.IM) and sodium chloride (O.IM) until the
colour of the solution changed fi*om green to yellow. The organomercurial complexes were
extracted into the aqueous phase with 3 ml of sodium thiosulphate solution (2 mmol I ')
buffered with ammonium acetate (0.05 mol I * ) . The aqueous layer was separated and
53
whilst shaking, 5 ml of oxidising solution consisting of sulphuric acid (0.25 mol 1'*), copper
(II) sulphate (0.008 mol 1*' ) and 2.5 % (m/v) potassium persulphate was added. The
aqueous layer was diluted to volume (50 ml volumetric flask ) with Milli-Q water. A
reagent blank was prepared using the same procedure but without sample. Alkaline (4M
NaOH) tin ( I I ) chloride (5% m/v) was used as reducing agent.
2.4.5 Extraction with thiosulphate, followed by oxidative digestion with
acid-persulphate
Samples of condensates (5 ml) spiked individually with organomercurial compounds;
DMM, DPM, EMC and PMC (10 «g ml 'as Hg) were extracted into the aqueous phase
with 3 ml of sodium thiosulphate solution (2 nmiol 1 * ) buffered with ammonium acetate
(0.05 mol 1 *). The aqueous layer was separated and filtered into 50 ml volumetric flask.
A 5 ml of oxidising solution consists of sulphuric acid (0.25 mol I * ' ) , copper (II) sulphate
(0.008 mol I ) and 2.5 % (m/v) potassium persulphate was added in to the flask and
shaken. The aqueous layer was separated 50 ml volumetric flask and make up to mark with
Milli-Q water. A reagent blank was prepared with the same procedure but without sample.
Tin ( I I ) chloride (5% m/v) in alkaline medium was used as reducing agent.
2.4.6 Extraction using L-cysteine followed by oxidative digestion with
acid-persulphate
Samples of condensates (5 ml) spiked individually with mercury compounds; Mercury (H)
Chloride (MC), DMM, DPM, MMC, EMC and PMC (10 wg ml ' as Hg) were extracted
into aqueous phase with 5 ml of L-cysteine solution (0.025 M). The aqueous layer was
separated into 50 ml volumetric flask. A 10 ml portion of oxidising solution consisting of
sulphuric acid (0.25 mol 1 ' ), copper (11) sulphate (0.008 mol I ' ) and 2.5 % (m/v)
potassium persulphate was added to the flask and shaken. Excess oxidant in the samples
54
was removed by addition of 3 ml of hydroxyl ammonium chloride (12 % m/v). A reagent
blank was prepared using the same procedure but without sample. Alkaline (4 M NaOH)
tin (D) chloride (5% m/v) was used as reducing agent.
2.4.7 Mercury measurement
The treated samples were all measured for mercury using cold vapour atomic fluorescence
spectrometry. The operating conditions for continuous flow mercury vapour generation
are shown in Table 2.1
A summary of different digestion/extraction procedures are shown in Table 2.2
Table 2.4; Recovery of DPM and Conostan organomercury compournl spiked condensate
and hydrocarbon samples after digestion with 5 ml of acidic iodide/iodate
solution (0.05M)
59
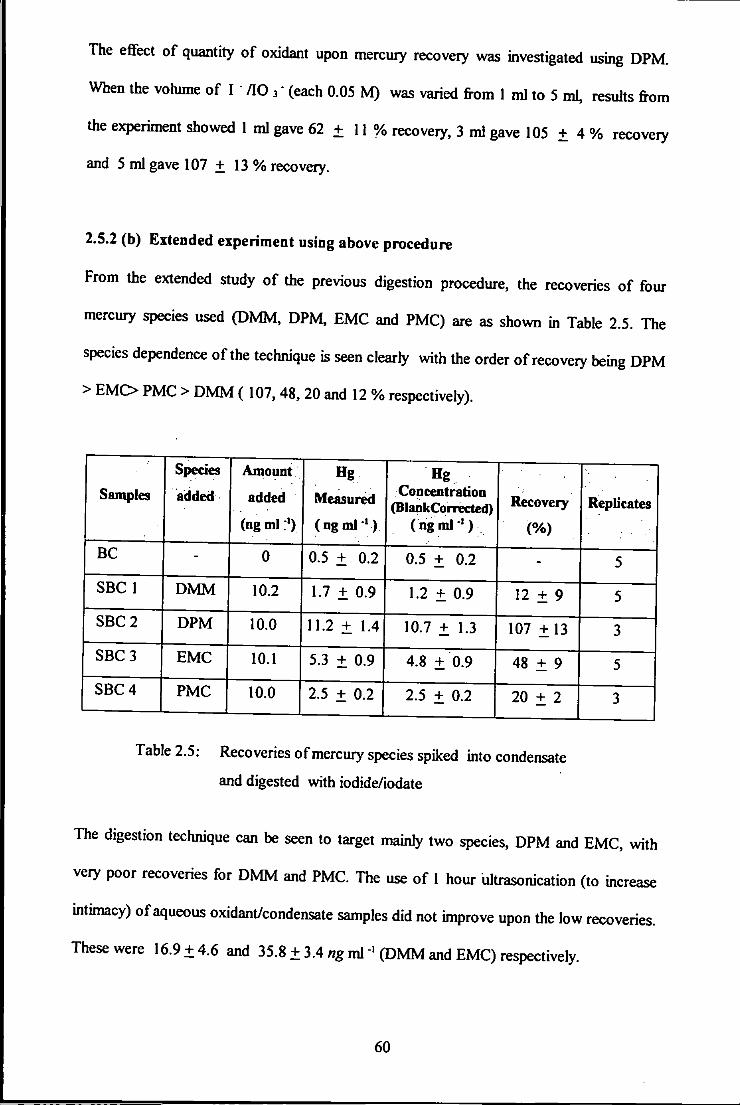
The efifect of quantity of oxidant upon mercury recovery was investigated using DPM.
When the vohime of I " / lO 3" (each 0.05 M) was varied from 1 ml to 5 ml, results from
the experiment showed 1 ml gave 62 + 11 % recovery, 3 ml gave 105 + 4 % recovery
and 5 ml gave 107 + 13 % recovery.
2.5.2 (b) Extended experiment using above procedure
From the extended study of the previous digestion procedure, the recoveries of four
mercury species used (DMM, DPM, EMC and PMC) are as shown in Table 2.5. The
species dependence of the technique is seen clearly with the order of recovery being DPM
> EMC> PMC > D M M ( 107,48, 20 and 12 % respectively).
Samples
Species
added
Amount
added
(ng ml
Measured
(ngml ^ )
Hg Concentration
(BlankConrected) (ngml-')
Recovery
(%)
Replicates
BC - 0 0.5 + 0.2 0.5 + 0.2 - 5
SBC 1 D M M 10.2 1.7 + 0.9 1.2 ± 0.9 12 ± 9 5
SBC 2 DPM 10.0 11.2 + 1.4 10.7 + 1.3 107 ± 1 3 3
SBC 3 EMC 10.1 5.3 ± 0.9 4.8 ± 0.9 48 ± 9 5
SBC 4 PMC 10.0 2.5 + 0.2 2.5 ± 0.2 20 + 2 3
Table 2.5: Recoveries of mercury species spiked into condensate
and digested with iodide/iodate
The digestion techiuque can be seen to target mainly two species, DPM and EMC, with
very poor recoveries for D M M and PMC. The use of 1 hour ultrasonication (to increase
intimacy) of aqueous oxidant/condensate samples did not improve upon the low recoveries.
These were 16.9 ± 4 . 6 and 35.8 ± 3.4 «g ml ' (DMM and EMC) respectively.
60
2.5.3 ComplexatioD with dithizone, followed by extraction with tbiosulphate
and oxidative digestion with acid-persulphate
The recoveries of DMM, DPM, EMC and PMC from spiked condensate, obtained from
this complex are shown in Table 2.6. The low recoveries indicated that the efiBcient
complexation of mercury with dithizone within the organic layer did not take place. This
could be due to interference from the samples matrix which basically prevents the
dithizone-mercury complex from being formed or the thiosulphate used to extract the
mercury species into the aqueous phase after destruction of the complex not being efi&cienl.
Sample
Species
added
Amount
added
(ngml ' )
Hg Measured
(ngml
Hg Concentration (Blank Corrected)
(ng ml ) Recovery
(%)
BC - 0 1.1 ± 0.1 1.1 + 0.1 -
SBC 1 D M M 10.2 0.8 + 0.1 0 0
SBC 2 DPM 10.0 1.7 ± 0.2 0.6 + 0.2 6 + 2
SBC 3 EMC 10.1 2.9 ± 0.2 1.8 + 0.2 18 + 2
SBC 4 PMC 10.0 0.4 + 0.1 0 0
Note : The results based on 4 replicate samples
Table 2.6: Recoveries of DMM, DPM, EMC and PMC spiked into condensates -
treatment with dithizone, thiosulphate and acid persulphate of aqueous
phase.
2.5.4 Extraction with thiosulphate, followed by oxidative digestion with
acid-persulphate
The recoveries of DMM, DPM, EMC and PMC spiked into condensates using the
technique are shown in Table 2.7. The recoveries are seen to be very poor (< 2%).
61
An experiment where sodium diethyldithiocarbamate (NaDDC, 0.5 % w/v) prepared by
dissolution of an appropriate amount in a pH 9 solution made of 0.02 ammonium hydroxide
+ 0.01 M acetic acid) was replaced thiosulphate in the above procedure gave, similar result
(very poor recoveries)
Sample
Species
added
Amount
added
(ngml »)
Hg Measured
(ng ml • )
Hg Concentration (Blank Corrected)
(ng ml »)
Recovery
(%) Replicates
BC - 0 0.8 + 0.1 0.8 ± 0.1 - 3
SBC 1 DMM 10.2 0.3 ± 0.1 0 0 3
SBC 2 DPM 10.0 0.2 ± 0.0 0 0 3
SBC 3 EMC 10.1 1.1 ± 0.1 0.2 ± 0.1 2 3
SBC 4 PMC 10.0 0.2 ± 0.1 0 0 3
Table 2.7 : Recoveries of DMM, DPM, EMC and PMC - treated with thiosulphatt
followed by oxidative digestion with acid-persulphate
2.5.5 Extraction with L-cysteine
The recoveries of five mercury species i.e. MC, DMM, EMC, PMC and DPM spiked
individually into the condensate samples are shown in Table 2.8. These values show that
the above procedure is more effective in the extraction o f certain mercury species
compared with previous procedures. The recoveries for DPM, EMC and MC were 100 %
in spiked base condensate (SBC). However the recovery of DMM, MMC and PMC were
15 %, 15 % and 33 % respectively. As DMM is an important species, likely to be present
in condensates (78, 178), the procedure could not be considered.
62
Sample
Species
added
Amount
added
(ngml^)
Hg Measured
(ngmJ-') Hg
Concentration (Blank
Corrected) (ngmlM
Recovery
(%) Replicates
BC - 0 2.7 + 0.3 2.7 + 0.3 - 6
SBC 1 D M M 10.2 4.2 + 0.1 1.5 + 0.1 15 + 1 5
SBC 2 DPM 10.0 12.6 + 1.0 9.9 + 0.9 99 + 9 5
SBC 3 EMC 10.1 13.7 + 1.4 Il.O + 1.3 110 + 13 5
SBC 4 PMC 10.0 6.1 + 0.2 3.3 + 0.2 33 + 2 5
SBC 5 MC 10.0 12.9 + 1.8 10.2 + 1.7 102 + 17 5
SBC 6 MMC 10.0 4.2 + 0.2 1.5 + 0.2 15 + 2 7
Table 2.8 : Recoveries of mercury species spiked into condensate -
treated with L- cysteine
As stated, gas condensate samples are complex mixtures of hydrocarbons, their contents
comprising paraffins, naphthanes, olefins and aromatics. To simplify the matrix problem,
the condensate sample was replaced by toluene. The toluene was spiked with PMC and
D M M (two distinctive boiling ranges of alkyi mercury compounds) and subjected to the
same extraction treatment as before. The recoveries results are shown in Table 2.9.
Sample Mercury
added (ng m l ' )
Hg Concentration
(ngml ' ) (Mean + S.D.)
(n=4)
Hg Concentration
(Blank Corrected) (ng ml ")
Recovery (%) (Mean ± S.D.)
Toluene 0 I . l + 0.2 1.1 + 0.2 -
ST 1 D M M (10.0) 3.8 + 1.9 2.7 + 1.9 27.0 +6.3
ST 2 PMC (10.0) 10.4 +1.7 9.3 +1.7 93.0 +16.5
Table 2.9: Recoveries of D M M and PMC spiked into Toluene
63 '
2.5.5.1 Concentration of DMM
As stated earlier, the DMM species is an important species and likely be present in
condensate sample. The recoveries for DMM spiked in toluene at different concentration
(10, 20 and 50 ng ml"') were measured in order to observe the effect, i f any, of the
volatility on the recovery of DMM. The resuhs obtained highlighted that the increase of
concentration did not improve the recovery.
2.5.5.2 Factorial design
An attempt to improve the recovery of DMM was undertaken using a 'factorial design'
experiment. A two levels factorial designed experiment was conducted. The variable used
in the experiment were L-cysteine (0.001 to 0.05 M), persulphate (0.1 to 2.5 %) and tin
(n) chloride (1 to 5 %) concentrations. Toluene spiked with 20 ng ml * DMM was used as
a sample. The results from the experiment did not identify any one of the three variables as
the more influential upon recoveries. No improvement upon previous recoveries was
obtained.
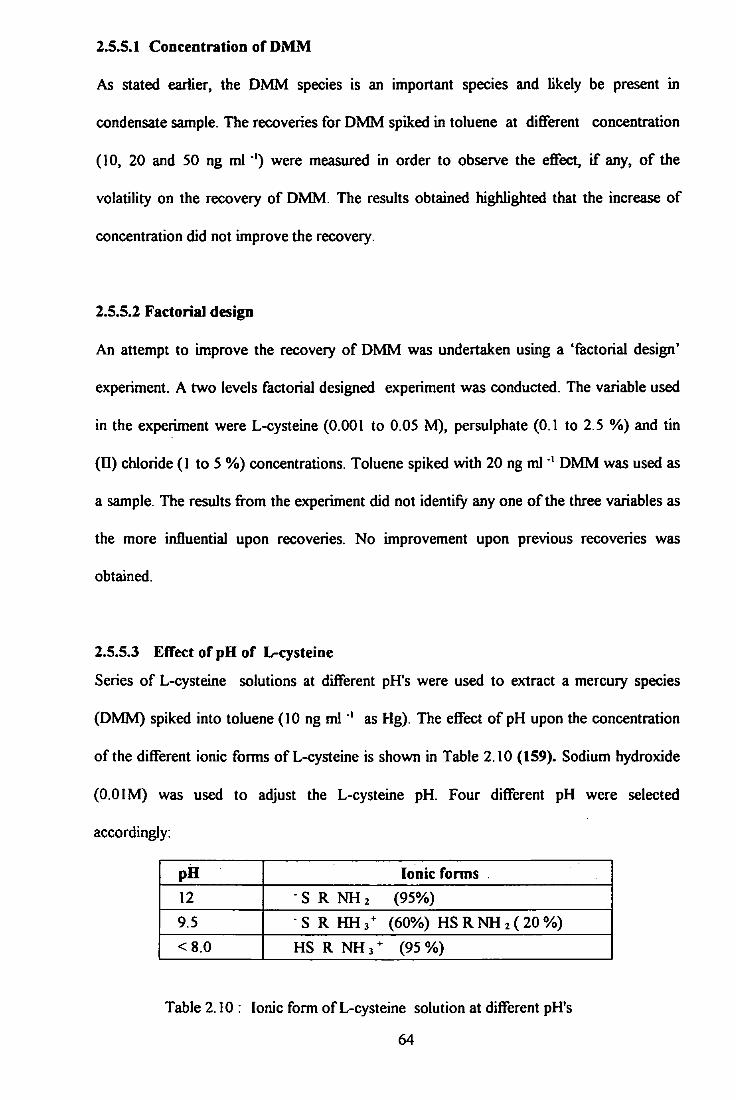
2.5.5.3 Effect of pH of L-cysteine
Series of L-cysteine solutions at different pITs were used to extract a mercury species
(DMM) spiked into toluene (10 ng ml ' as Hg). The effect of pH upon the concentration
of the different ionic forms of L-cysteine is shown in Table 2.10 (159). Sodium hydroxide
(0.0 IM) was used to adjust the L-cysteine pH. Four different pH were selected
accordingly:
pH Ionic forms 12 • S R NH 2 (95%) 9.5 S R HH^^ (60%) H S R N H 2 ( 2 0 % )
<8.0 HS R N H j ^ (95%)
Table 2.10 : Ionic form of L-cysteine solution at different pFTs
64
The recovery for D M M at different pH were measured and the results are shown in Table
2.11. While the pH is shown to be important, the maximum recoveries was still limited to
34 % (pH 8.65).
pHof L-cysteine % recovery
5.97 0
7.95 19.0±3.5
8.65 33.7 + 5.2
11.95 22.0+ 5.0
Note: Sample used : 5 ml L-cysteine (0.025M) : 5 ml Persulphate (2.5% mA') : 10 ml Alkaline tin (D) : 5%
Table 2.11: Recoveries study at different pH
The study also highlighted the batch to batch variation (variable mercury content) of
unspiked base condensate. Different batches of condensate analysis gave dififerent results,
i.e. batches 1, 2 and 3 gave respectively 2.8 + 0.3 , 1.0 + 0.1 and 8.3 + 0.9 ng ml V
This may be due to the 'base' condensate containing some particulate matter-wilh adsorbed
mercury, sediment sludge etc.,. To minimise variation in analytical results, filtration or
centrifugal may be considered in obtaining a homogenous sample. However, it would be
preferred i f the minimum of sample pre-treatment/ handling was employed to avoid losses.
65
2.6 CONCLUSIONS
The recoveries for various organic and inorganic mercury species, spiked into synthetic and
real condensate samples using different digestion and/or extraction techniques fi-om was
studied. These procedures have previously been employed for the determination of various
inorganic and organomercury halides, present in mainly aqueous systems.
The five digestion and/or extraction techniques used were (i) acid-persulphate digestion,
(ii) digestion with iodine, liberated in-situ with I ' / lO 3 ( i i i ) complexation with dithizone
followed by extraction v ath thiosulphate and oxidative digestion with acid-persulphate,
(iv) extraction with thiosulphate, followed by an oxidative digestion with acid-persulphate
and (v) extraction using L-cysteine.
The results of the study showed that the efficiency of some of the digestion and/or
extraction procedures carried out was dependent upon the speciation.
The recovery of a 'Conostan' mercury standard (mercury diethyl dithiocarbamate) fi-om the
persulphate digestion technique was in the range 4 to 29 %. Further experiments indicated
that the persulphate added for the digestion step had been consumed by the sample matrix
rather than targeting mercury species.
A 100 % recovery of di-phenyl mercury was achieved using the acidic iodine digestion
technique. For other mercury species, i.e. ethyl mercury chloride, phenyl mercury chloride
and di-methyl mercury, the recoveries by the same technique were 48 %, 20 % and 12 %
respectively.
66
The two extraction procedures involving thiosulphate, i.e. with and without a complexation
step using dithizone, were both found to be unsuitable for gas condensate samples since
they yielded low recoveries of various mercury species. With the complexation step using
dithizone, recoveries of the DMM, DPM, EMC and PMC were 0 %, 6 %, 18 % and 0 %
respectively. The recoveries obtained with extraction by thiosulphate alone were less than
2%.
Extraction using L-cysteine (0.025M) followed by oxidation with potassium persulphate
(2.5% m/v) showed very encouraging results. The recoveries of the DPM, EMC and MC
species were 100 %. While, the recovery of PMC was also high (over 90 % ) , that of
D M M was only 15 %. This latter species is considered to be a major contributor to the
total mercury in condensate samples. Only a procedure which would bring about a
significant improvement in D M M recoveries (> 90 %) could be considered useful.
There was no improvement in the recovery values, obtained from the spiking of increasing
concentrations of D M M into toluene, using the above extraction technique.
The results from a 'factorial design' experiment did not identify any one variable i.e.
concentration of L-cysteine, persulphate and tin (II) chloride, as being the most influential
upon recoveries of DMM. No improvement upon previous recovery values was obtained.
Experiments performed to change the concentration of different ionic forms of L-cysteine
available for complexation using different pH values showed that recoveries for D M M
were still Umited to a maximum of 34 % at pH 8.65.
67
Overall, it was concluded that the favoured procedures used for digestion and/or extraction
of mercury species from water and sediment samples, were of Umited application to
samples such as gas condensate.
Recovery problems encountered in the extraction and/or digestion of mercury species in
gas condensate may arise because of the following:
• A natural gas condensate sample is unique in its properties and these depend upon
its origin, and its processing and treatment steps.
• The complex matrix of a gas condensate can lead to various interferences during
the digestion and/or extraction procedure. One example is the effect from a 10** ; 1
ratio of unsaturated matrix to mercury species which limits the efficiency of certain
procedures.
• The highly volatile nature of both the condensate and the mercury species can result
in mercury loss of analytes during the determination. Heating during a procedure
can also induce losses.
It is important to note that, to date, no fully validated, certified reference material is
available for mercury species in a hydrocarbon-based sample. The absence of a CRM,
needed to serve the analytical requirements of a large and environmentally important
industry, is a reflection of the difficulty this sample-type offers. This absence also results in
a plethora of techniques available for mercury species measurement in hydrocarbon-based
samples, many of which are pooriy designed, poorly tested and pooriy presented.
68
CHAPTER 3
T H E DETERMINATION O F T O T A L M E R C U R Y IN LIQUID HYDROCARBONS AND GAS CONDENSATE B Y VAPORISATION AND TRAPPING A T E L E V A T E D T E M P E R A T U R E S T O G E T H E R WITH ATOMIC F L U O R E S C E N C E S P E C T R O M E T R Y
CHAPTER 3
T H E DETERMINATION O F T O T A L M E R C U R Y IN LIQUID
HYDROCARBONS AND CONDENSATE BY VAPORISATION
AND TRAPPING WITH ATOMIC F L U O R E S C E N C E D E T E C T I O N .
3.1 INTRODUCTION
It was seen in Chapter 2 that digestion/extraction techniques (8, 9, 12, 77, 78, 96 -100)
used for the determination of total mercury in gas condensate samples are inefficient, with
the efficiency being dependent upon the species present and the complexity of the matrix. It
is known however, that mercury species are efficiently adsorbed onto gold, gold-coated
materials and the platinum group metals (amalgamation) (66, 77). The possibility of
utilising this characteristic as a means of removing the interferent matrix prior to release
and measurement was investigated.
Unlike condensate samples, the determination of total mercury in natural gas can be carried
out accurately and to very low limit of detection by collecting the species onto special gold
coated sand traps at room temperature. The trapped/adsorbed mercury is released when
heated to a high temperature (~ 900 °C) and swept through into the atomic fluorescence
detector by argon gas for measurement (161-162).
Depending upon the type of trap system, the adsorption technique can have some
restrictions. In the presence of heavier hydrocarbons and/or *wet' conditions, the adsorbent
collection efficiencies are affected. It was reported that using Au/Pt coated wire, kept at
SO C to prevent matrix condensation, adsorption efficiency of 100 % for elemental mercury
is achievable. However only 50% of dimethyl mercury is recovered from the same gas
69
matrix (8,9,77). The trap system therefore displays species dependency, under the
conditions used.
The performance of different adsorbents in collecting mercury species, such as activated
charcoal, silver and gold coated sand has been studied by E>umarey et al, (66). Elemental
mercury, inorganic mercury (HgCk), organomercury halides (MMC and EMC) and the
di-alkyl mercury compounds (DMM and DEM) generated in a stream of air (vapour form)
were 100% collected when using gold coated sand. The study also reported that activated
charcoal and silver coated sand was not recommended as the collection is not quantitative
and depends on the sampling flow rate, the 'ageing time' of the collector, the mercury
species used and the interferent nature of the matrix. In general the gold sand trap capable
is capable of collecting various species provided the gas or the sample is dry and contains
minimum interferents.
Recently, the performance of a newly developed gold impregnated silica (Amasil) trap
indicated that the efficiency of the trap or collector was not affected by sampling in humid
air (relative humidity of 95%) (163).
Prior to the determination of mercury by an element specific detector such as AFS or
AAS, the collector or trap is required to be heated to a temperature high enough to ensure
decomposition of the compounds and the release of mercury in its elemental form. The
thermal desorption behaviour of several mercury species released fi'om a gold trap,
elemental mercury is controlled by the decomposition process (164). To obtain
desorption and decomposition, the collector or trap must be heated to at least 500 'C (66,
164-166). Mercury species will not be decomposed or released fi-ora the gold collector/trap
i f a temperature of 250 °C (93) is not reached. At 345 °C, 60 % of elemental mercury is
70
as
fiiU
released i f oxygen is used as carrier but for argon or nitrogen, a temperature of 250°C is
sufficient. At 267 °C the recovery of D M M is 0 % , and at 345 °C the recovery for MMC is
also 0 %. For DPM a temperature as high as 557 °C is required for complete
decomposition (164). This would suggest that the trapping mechanism does not produce
elemental mercury directly during the adsorption process.
The aim of this study was to develop a simple, accurate, rapid and precise technique for
the determination of total mercury in condensate samples. The excellent sensitivity of
atomic fluorescence spectrometry has been utilised in this study, using a commercially
available system, for the determination of total mercury. To address the matrix interference
and species-dependent recovery problem obtained using conventional digestion and/or
extraction techniques, a new trapping technique was designed and constructed.
The technique is based on vaporisation of the sample and trapping of mercury at an
elevated temperature prior to its determination by atomic fluorescence spectrometry. The
performance of the technique was evaluated from recovery data for total mercury using
various known species from spiking experiments. The use of real condensate samples for
analysis was carried out.
71
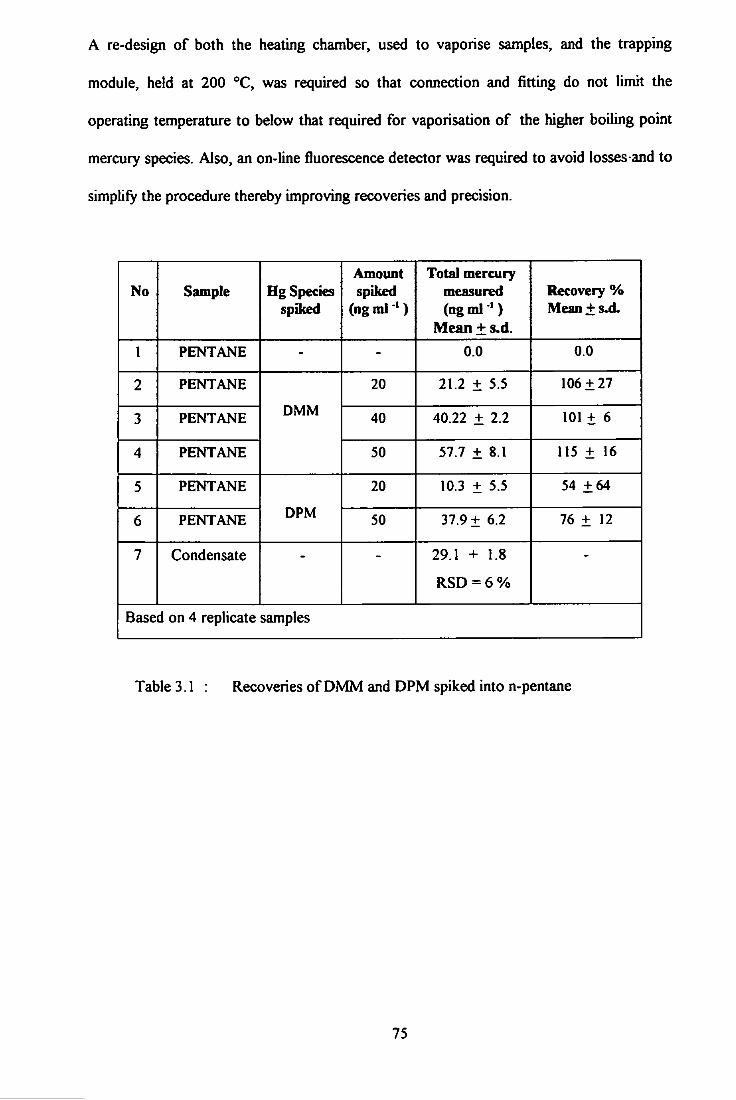
3.2 PRELIMINARY STUDY USING A SAMPLE VAPORISATION
TECHNIQUE W I T H ELEVATED TEMPERATURE TRAPPING
OF MERCURY
3.2.1 EXPERIMENTAL
In this preliminary investigation, n-pentane was employed as a 'synthetic' condensate. A
known amount of D M M and DPM, 20 to 50 ng ml ' were spiked into the n-pentane. A one
millilitre sample (spiked n-pentane) was injected into a 3 necked round bottom flask, at
room temperature and heated slowly (approximately 20°C min **) in an oven to 200 "C. This
temperature was maintained for about 10 minutes to ensure the sample vaporised
completely. The sample vapour generated was swept by argon gas through a gold coated
silica (Amasil) trap maintained at 200 T by a resistance wire heater jacket. The flow rate of
the argon was set to between 300 and 400 ml min "V To avoid losses of analyte, a minimum
amount of tubing was used for the connection of glassware.
After sample vaporisation, the gold-coated silica trap was disconnected and transferred to a
commercial mercury analyser unit (Sir Galahard Mk n , PS Analytical), for the
determination of mercury. After samples had been collected using the method described
above (remote sampling), the trap was placed into a heating module, where it was flushed
with argon to ensure that no traces of air or any matrix vapour remain. The module then
heated up and vaporised the mercury, which was carried by a stream of argon to a second
permanent gold sand trap, where it was adsorbed. The second permanent trap then went
through its heating cycle, releasing the mercury at 800 to 900 °C which was swept into the
fluorescence detector where a response was measured. A detailed description of the
instrument system has been described elsewhere (161, 162). A schematic diagram of the
preliminary instrumental arrangement is shown in Figure 3.2.
WCOT Ultimetal, with Cp-SimDist stationary phase (1.2 ^m thickness, i.d. 0.53 mm, 10 metre laigth) 5 ml min ' Argon 35 °C (5 min) to 300 X (5 °C min ' )
Table 5.6: Mercury species before and after removal unit for adsorbent C.
168
DMM Mercuiy species Before reactor (DMM, tmA and DBM)
DEM
DBM
TIME (NUN)
DMM
t4
Merony Species After reactw (DMM, DEM end DBM)
DBM DEM
TIME (NUN)
Figure 5.5 : Example of mercury chromatograms before and after removal unit
for adsorbent C
5.4 CONCLUSION
Ail three pilot plant-tested mercury-removal systems A, B and C showed a reduction in the
mercury content of the final products. For the adsorbent system A, the hydrogenolysis
reactor was able to convert some of the organomercury present in the gas condensate feed
to its elemental form However the amount of elemental mercury measured was only about
30 % of the total mercury content. Incomplete conversion of the organomercury species to
mercury metal may be due to competition between the organomercury species and the
169
unsaturated compounds in the matrix during the hydrogenation reaction. One other reason
could be that elemental mercury was carried over to the gas stream mstead of remaining in
the liquid stream. The result from the first reactor (hydrogenation) also showed a higher
total mercury content conq)ared with the feed condensate. This could be due to a
pre-concentration effect resuhing in mercury cany- over by the liquid condensate stream
to the adsorber. The second reactor (mercury trapping) was able to adsorb elemental
mercury present in the stream (the product from the first reactor) but was unable to remove
the organomercury content fix)m the condensate stream.
For the single stage adsorbent system B, the eflficiency in removing spikes of DMM, DEM
and DBM from the n-hexane hydrocarbon sample was very high. Removal of the species
was 100 % with no indication of mercury present in the product. For adsorbent system C,
efficiency of removal for the different mercury species spiked into the n-hexane was
variable. Over 50 % of DMM was removed using the adsorbent, while the DEM showed a
range of 60 to 80 % removal The DBM was initially adsorbed eflBciently (>80% at two
hours) but was rapidly released back into the product stream after foiu- hours.
The above results indicated that speciation of the mercury content is vital in the evaluation
of an adsorbent systems eflficiency. The performance of an adsorbent was dependent upon
the type of adsorbent and, for the A and C systems, the mercury species present in the feed
streanL The determination of total mercury only in feed and product samples in the system
will not give all the necessary information for an unbiased evaluation to be made of the
performance of an adsorbent.
The results obtained, while indicative of the adsorbents performance are no guarantee of
their efficiency using a real sample and should only be used as a guide. Those adsorbents
170
which show a suitable potential for removing mercury species, will require longer pilot
plant studies using real gas condensate as the feed over a longer monitoring plant period.
171
CHAPTER 6
CONCLUSIONS AND FUTURE WORK
CHAPTER 6
CONCLUSIONS AND FUTURE WORK
6.1 CONCLUSIONS
The study which investigated the recovery of various organic and inorganic mercury
species, spiked into synthetic and real condensate samples using different digestion and/or
extraction techniques, showed that recovery was dependent upon the speciation.
Using a persulphate digestion technique, the recovery of an organomercury standard was
less than 30 %. Further experiments bdicated that the persu^hate added for the digestion
step had been consumed by the sample matrix rather than targeting the mercury species.
When usmg the iodide/iodate digestion technique, only one mercury species, DPM, gave
full recoveries. Other mercury species, EMC, PMC and DMM gave recovery values of less
than 50 %.
The extraction procedures involving complexation with dithizone and/or thiosulphate were
found to be unsuitable for *real' condensate sanq)Ies. Very low recoveries, less than 18%,
of various mercury species were obtained.
The combined extraction and digestion technique involving L-cysteine and potassium
persulphate gave encouraging results with recoveries of over 90 % for the species DPM,
EMC, MC and PMC. However, one species of considerable interest in gas condensate is
DMM and using this procedure a recovery value of 15 % was observed. Further studies of
the critical extraction and digestion parameters Med to improve the recovery value for
DMM.
172
It was concluded that the fevoured procedures previously used for digestion and/or
extraction of mercury species fi-om water and sediment sauries together with some
modified and new procedures were of limited application to gas condensates. This was
in-part, if not entirely, due to the complex and volatile nature of the non-polar organic
liquid sample which contained only ultra-trace levels of different mercury species.
A relatively simple, rapid, accurate and precise technique for the determination of total
mercury in gas condensate and other liquid hydrocarbon samples has been developed. A
glass chamber, maintained at 400 *C was used to vaporise samples which were carried in
argon, via a heated* transfer line, to a gold-coated silica trap held at 200 °C. At this
temperature the mercury species were adsorbed efGciently and retained on the trap while
the conqjlex volatile matrix was swept to waste. Elemental mercury was released rapidly
when the trap tenq>erature was raised to 900 °C and swept with argon gas to an atomic
fluorescence detector for measurement.
Experiments which investigated the optimum operating conditions, sample volumes and
certain design characteristics of the technique showed that the double-sized trap was
required to retain mercury species eflBciently for san^le volumes up to 1.0 ml. An argon
carrier flow rate of 300 ml min ' was used to transport the matrix and the mercury vapour
in the system. The sample vaporisation time was dependent upon the sample volume and
sample type (usually 5 to 10 minutes for 0.25 to 0.5 ml of condensate).
The recoveries for eight different mercury species spiked in toluene and in 'real' gas
condensate (10 to 50 ng mi were generally over 90 %. The types of species studied were