57
supported by AGRIFIN ACCELERATE Benchmark Study of Smallholder Farmers of Kenya, 2015
| Date post: | 18-Feb-2017 |
| Category: |
Documents |
| Upload: | james-hokans |
| View: | 126 times |
| Download: | 0 times |
supported by
AGRIFIN ACCELERATE
Benchmark Study of Smallholder Farmers
of Kenya, 2015

www.MercyCorpsAFA.org
Survey Locations
› Two regions were surveyed; Central and Western Kenya
› A total of 50 villages were randomly selected within the two regions; 25 villages in Central and 25 villages in Western.
› Had to own a phone or a SIM card

Demographics
Gender Segregation Age Segregation
Overall Central Western
51% 257 258
49% 249 247
Age Central Western
Male Female Male Female
18 1% 1% 1% 2%
19 - 30 16% 17% 19% 35%
31 - 43 24% 31% 23% 30%
44 - 55 19% 23% 19% 17%
56 - 67 20% 14% 24% 12%
68 - 80 13% 11% 11% 4%
81+ 3% 1% 1% 0%
A total of 1,010 farmers were surveyed; 506 farmers in 25 villages in Central and 504 farmers in 25 villages in Western Kenya
51% of the interviewed respondents were females

Demographics
Highest Education Attained
27%23%
21%14%
5%3%
2%1%
1%1%
Primary education completePrimary education incomplete
Secondary education, completeSecondary education, incomplete
No formal educationDiploma Complete
Some secondary vocational…DK/Refused
College/University incompleteComplete university Degree
› 50% of the farmers report their highest level of education attained as primary, either complete or incomplete
› 75% of the respondents are monogamously married
N=1010
www.MercyCorpsAFA.org
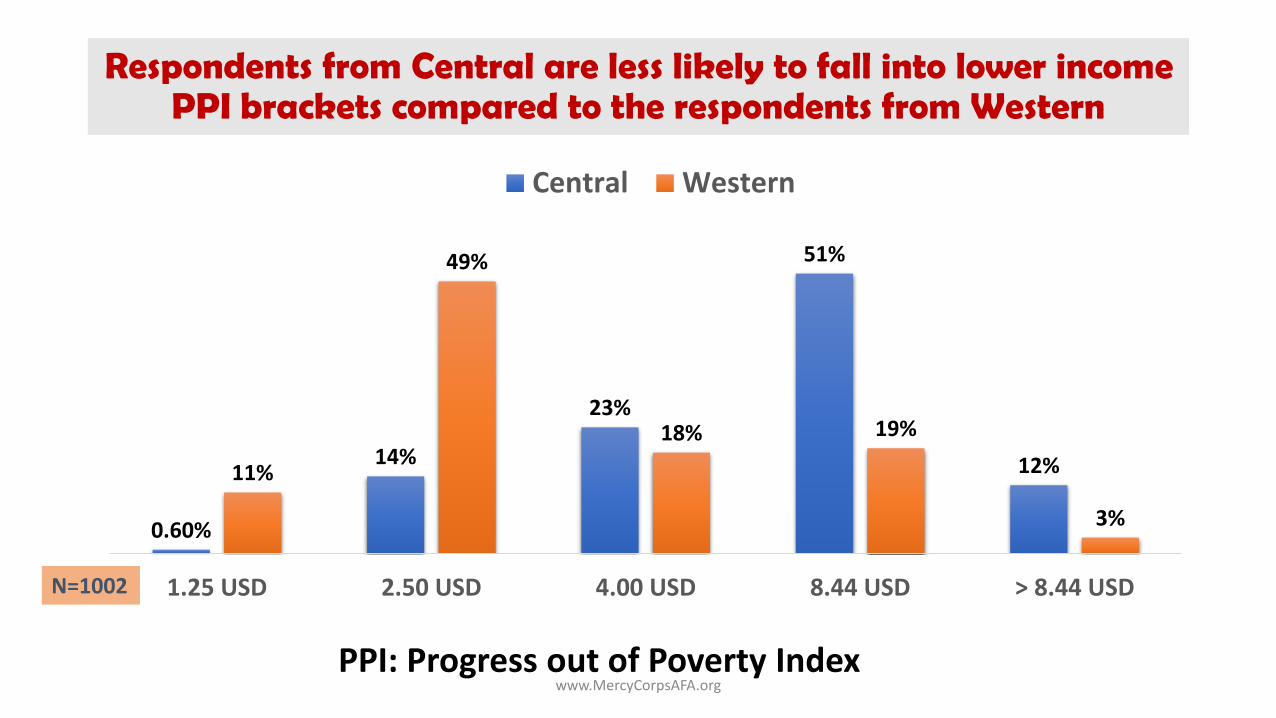
Respondents from Central are less likely to fall into lower income PPI brackets compared to the respondents from Western
0.60%
14%
23%
51%
12%11%
49%
18% 19%
3%
1.25 USD 2.50 USD 4.00 USD 8.44 USD > 8.44 USD
Central Western
N=1002
PPI: Progress out of Poverty Index

FARM CHARACTERISTICS Subtitle Goes Here
www.MercyCorpsAFA.org
www.MercyCorpsAFA.org
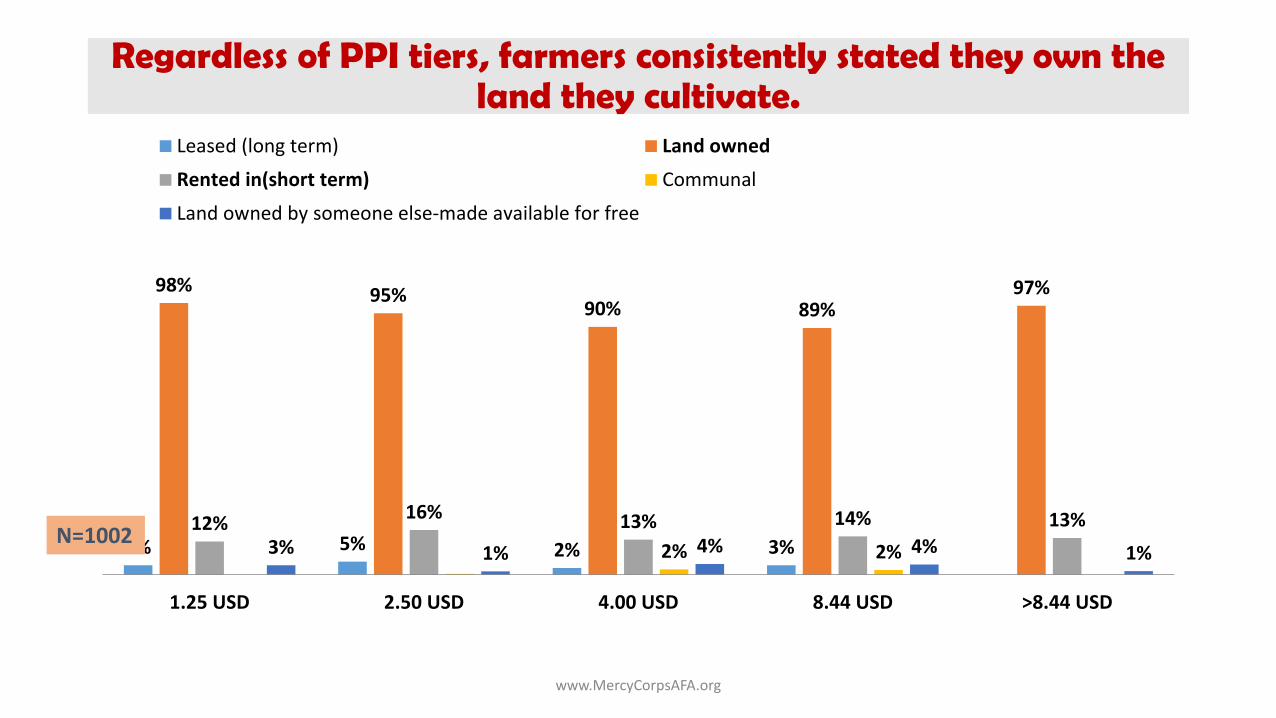
Regardless of PPI tiers, farmers consistently stated they own the land they cultivate.
3% 5% 2% 3%
98% 95%90% 89%
97%
12%16% 13% 14% 13%
2% 2%3% 1% 4% 4% 1%
1.25 USD 2.50 USD 4.00 USD 8.44 USD >8.44 USD
Leased (long term) Land owned
Rented in(short term) Communal
Land owned by someone else-made available for free
N=1002

www.MercyCorpsAFA.org
70%
21%
7%
2%
15%
5%2%
53%
15%
5%2%
34%
9%4%
1%
36%
11%
3% 1%
1 2 3 4 5 6 7
Overall 18-30 years Over 30 years Male Female
How many parcels of land did you cultivate in the last 12 months?
› Few youth cultivate more than one parcel of land› Men and women are pretty evenly split on the parcels they are cultivating, but…..
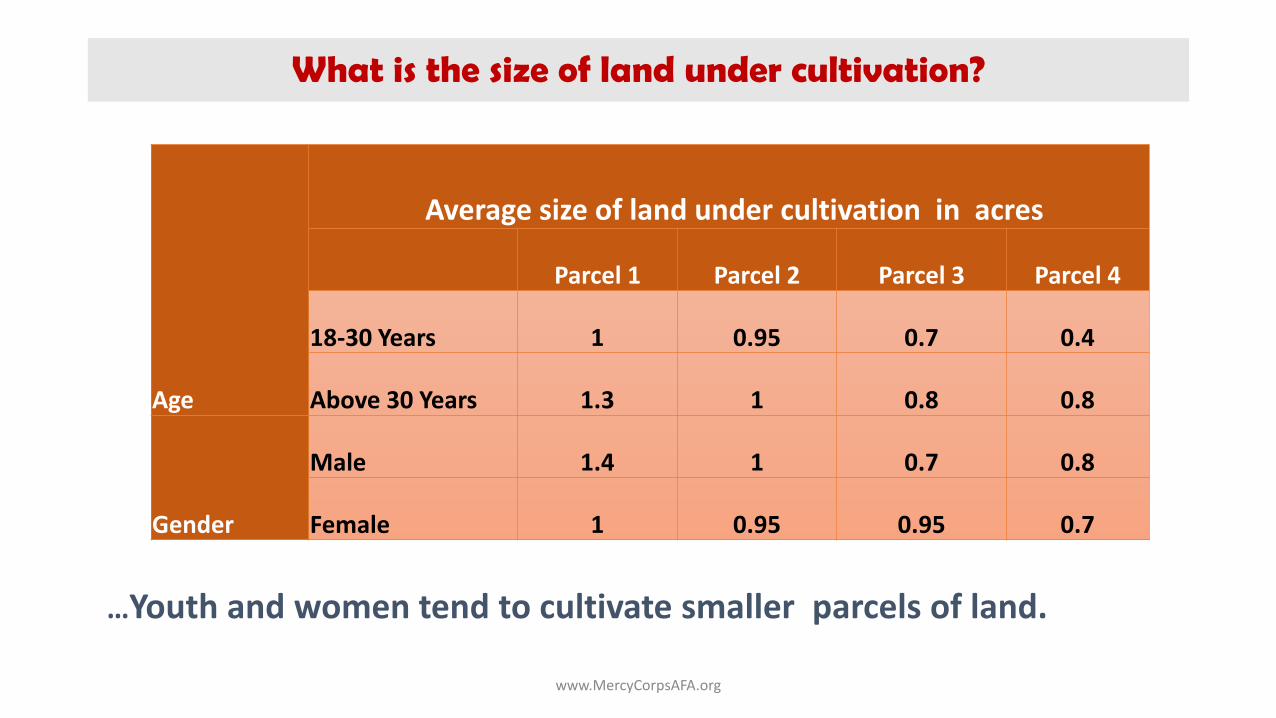
Age
Average size of land under cultivation in acres
Parcel 1 Parcel 2 Parcel 3 Parcel 4
18-30 Years 1 0.95 0.7 0.4
Above 30 Years 1.3 1 0.8 0.8
Gender
Male 1.4 1 0.7 0.8
Female 1 0.95 0.95 0.7
www.MercyCorpsAFA.org
What is the size of land under cultivation?
…Youth and women tend to cultivate smaller parcels of land.

Marital status Single/ Never
marriedPolygamously
marriedMonogamously
married Divorced Separated Widowed
Living together/
Cohabiting
Average size of land under cultivation (acres)
1.5 3.6 2.1 1.3 1.1 1.8 1.0
www.MercyCorpsAFA.org
Size of land under cultivation varies with marital status of the respondents
› Average size of land under cultivation varies with the marital status of therespondents.
› Married respondents tend to cultivate larger pieces of land as opposed to thesingle respondents and divorced/ separated or widowed respondents.
› This finding suggests that marriage may comprise an indicator for credit scoring.
N=1010

www.MercyCorpsAFA.org
Main planting season is March/May. Another planting season is in August/September/October
0%
50%
100%
150%
200%
250%
300%
350%
400%
450%
500%
January February March April May June July August September October November December
Planting
Maize Beans Tea Coffee Irish Potatoes Cabbages
Kales Groundnuts Sugar cane Cassava Bananas

www.MercyCorpsAFA.org
Farm inputs form the highest expenditure for the farmers, but they are also hiring and paying labor throughout the seasons
11%
19%
20%
25%
28%
29%
81%
82%
16%
23%
23%
32%
29%
40%
74%
75%
5%
15%
18%
18%
27%
19%
88%
89%
Manure
Hired labor for harvesting
Hired labor for weeding
Hired labor for planting
Hired labor for land preparation
Pesticides/insecticides/fungicides
Fertilizer
Seeds (planting materials)
Western Central Overall

VALUE CHAINSSubtitle Goes Here
www.MercyCorpsAFA.org

www.MercyCorpsAFA.org
89%
74%
60% 60%
32%26% 24%
20%15% 14%
81%
61% 64%
50%
31%
47%
25% 27%
3%
23%
97%
87%
56%
70%
33%
4%
22%
13%
27%
6%
Total Central Western
Top 10 value chains for the two regions
www.MercyCorpsAFA.org
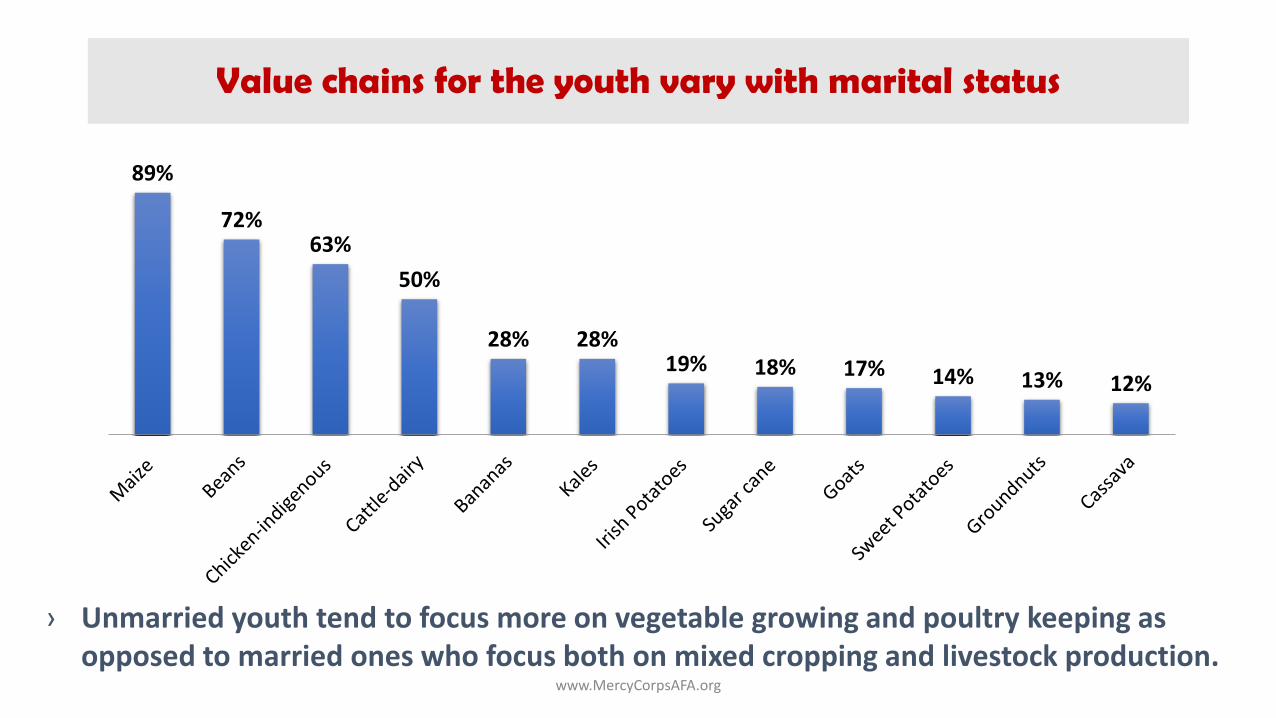
89%
72%63%
50%
28% 28%19% 18% 17% 14% 13% 12%
Value chains for the youth vary with marital status
› Unmarried youth tend to focus more on vegetable growing and poultry keeping as opposed to married ones who focus both on mixed cropping and livestock production.
www.MercyCorpsAFA.org
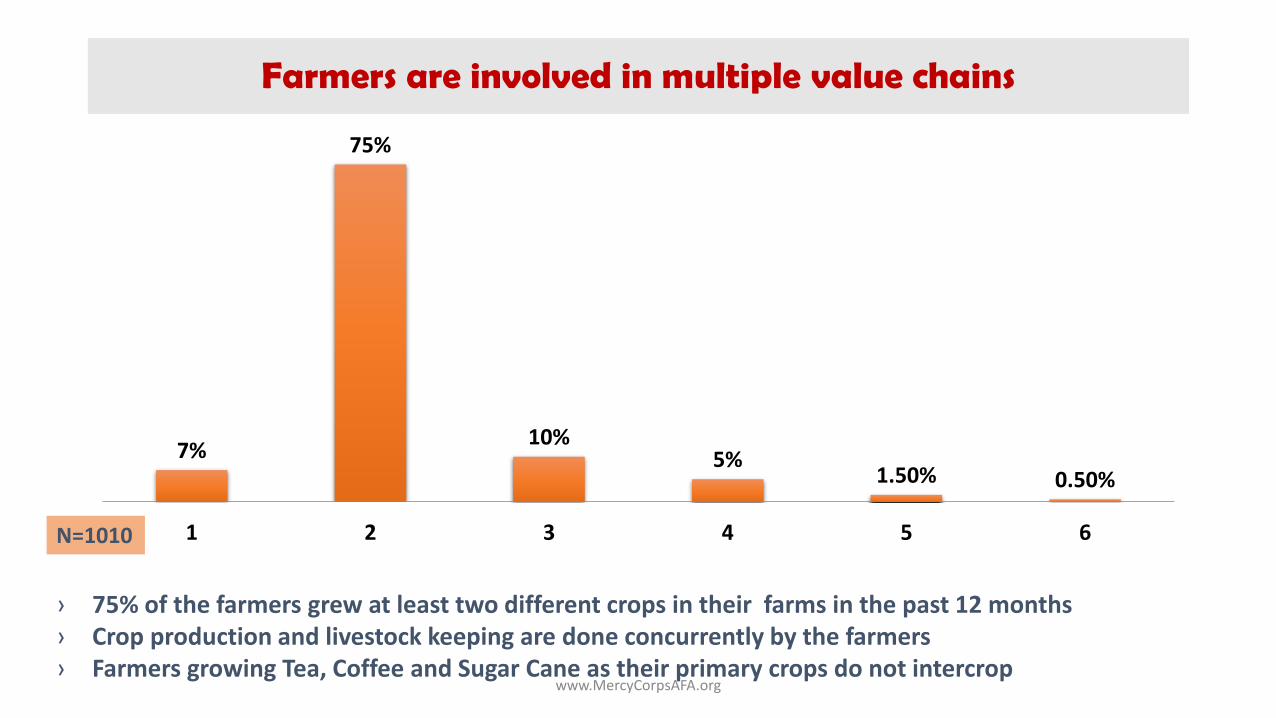
Farmers are involved in multiple value chains
7%
75%
10%5%
1.50% 0.50%
1 2 3 4 5 6N=1010
› 75% of the farmers grew at least two different crops in their farms in the past 12 months › Crop production and livestock keeping are done concurrently by the farmers› Farmers growing Tea, Coffee and Sugar Cane as their primary crops do not intercrop

www.MercyCorpsAFA.org
36%
51%
17%10%
22%
36%
7%14%
38%
29%
68%
84%
100%
50% 47%
92%84%
2% 3% 3% 5%10%
1%
26%18%
12%3%
23%
6%1%
Maize Beans Irish Potatoes Kales Coffee Groundnuts SweetPotatoes
Cabbages Tomatoes
consumed sold Shared Stored
Small holders farm crops for both consumption and selling
N=1010

Buyers of farm produce
Channel of payment used
Cash ChequeM-PESA /Mobile money transfer
Account transfer (EFT) In kind
Middleman/trading company 93% 2% 2% 2% 0%
Local market 100% 0% 0% 0% 0%
In the village 98% 0% 1% 0% 1%
Co-operative 13% 2% 3% 76% 0%
Processor 58% 13% 9% 16% 0%
At farm to a neighbor 100% 0% 0% 0% 0%
To a travelling merchant 100% 0% 0% 0% 0%
Retailer 98% 0% 2% 0% 0%
Direct to the public 100% 0% 0% 0% 0%
www.MercyCorpsAFA.org
Where do you sell your produce and how are you paid?
79% of farmers who sell to coops report they are paid electronically; 25% who sell toprocessors report they are paid electronically.
N=986
www.MercyCorpsAFA.org
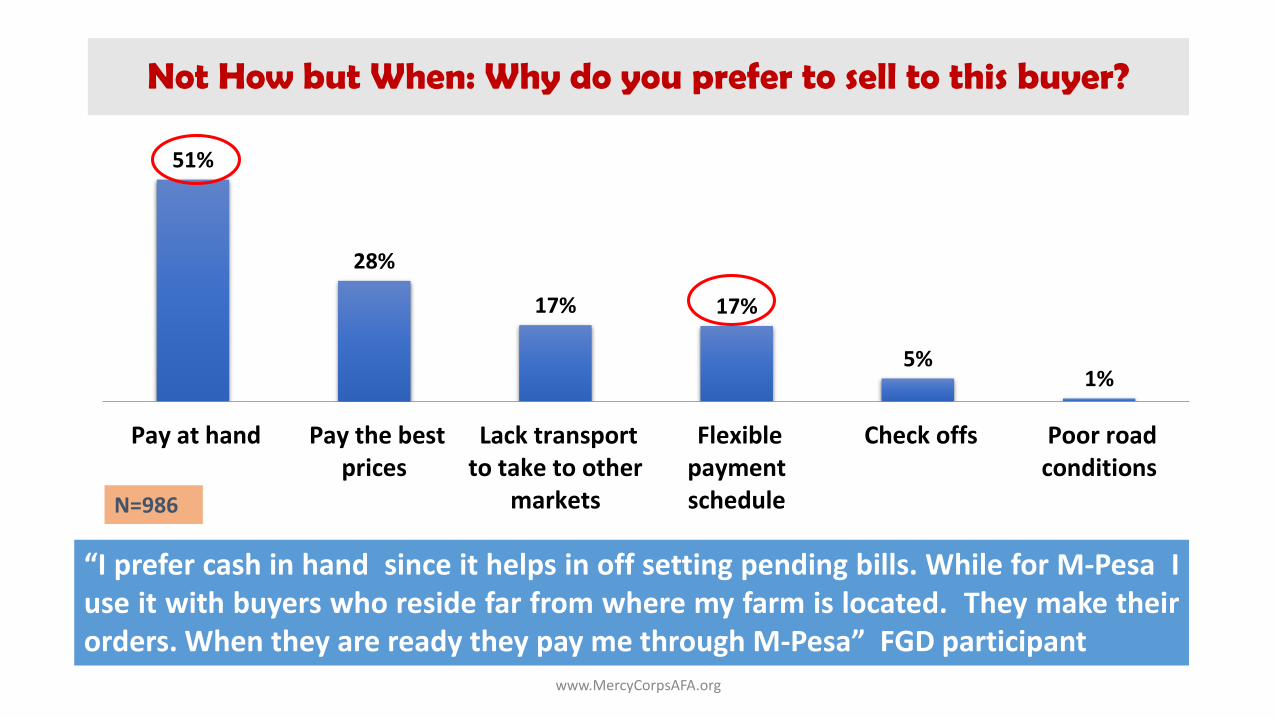
Not How but When: Why do you prefer to sell to this buyer?
51%
28%
17% 17%
5%1%
Pay at hand Pay the bestprices
Lack transportto take to other
markets
Flexiblepaymentschedule
Check offs Poor roadconditions
N=986
“I prefer cash in hand since it helps in off setting pending bills. While for M-Pesa Iuse it with buyers who reside far from where my farm is located. They make theirorders. When they are ready they pay me through M-Pesa” FGD participant

INCOME SOURCESAND REMITTANCES
www.MercyCorpsAFA.org

www.MercyCorpsAFA.org
Dairy farming is one of the major activities and sources of income for the farmers in both regions
26%
74%
Consumed Sold
Milk
N=600

www.MercyCorpsAFA.org
Central farmers earn more from livestock and livestock products than Western farmers
0
20000
40000
60000
80000
100000
120000
Central Western Total
Poultry Cattle
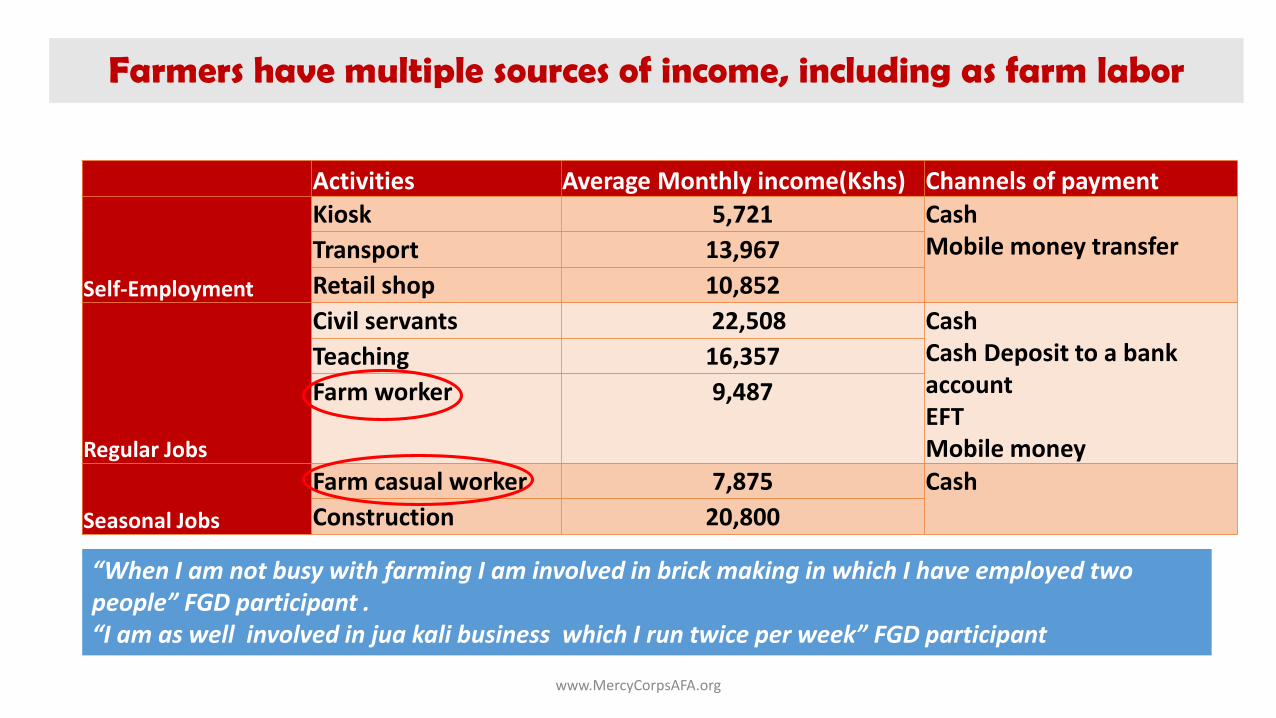
Farmers have multiple sources of income, including as farm labor
www.MercyCorpsAFA.org
Activities Average Monthly income(Kshs) Channels of payment
Self-Employment
Kiosk 5,721 CashMobile money transfer Transport 13,967
Retail shop 10,852
Regular Jobs
Civil servants 22,508 CashCash Deposit to a bank account EFTMobile money
Teaching 16,357
Farm worker 9,487
Seasonal Jobs
Farm casual worker 7,875 Cash
Construction 20,800
“When I am not busy with farming I am involved in brick making in which I have employed two people” FGD participant .“I am as well involved in jua kali business which I run twice per week” FGD participant
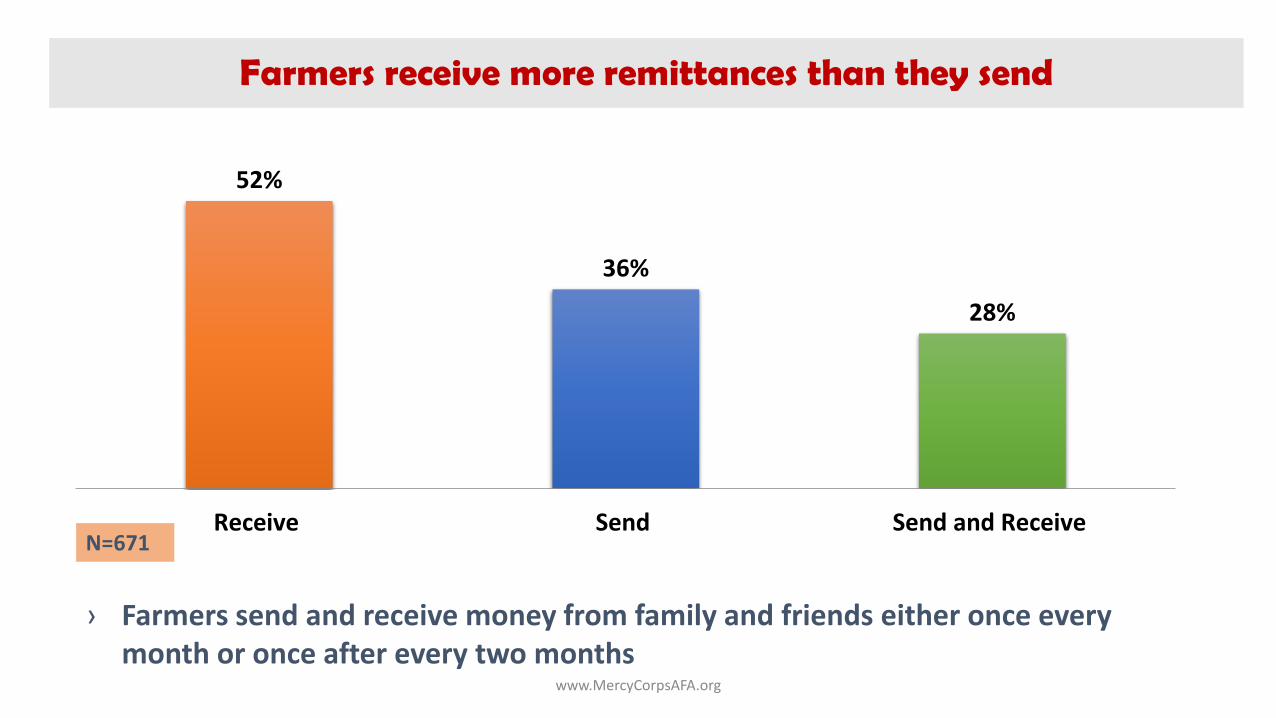
Farmers receive more remittances than they send
www.MercyCorpsAFA.org
52%
36%
28%
Receive Send Send and ReceiveN=671
› Farmers send and receive money from family and friends either once every month or once after every two months

www.MercyCorpsAFA.org
Do you send or receive remittances?
57%
43%
23%
76%
57%
43%
65%
34%
23%
76%
53%47%
Central Western 18-30 Years Above 30 years Male Female
Sending Receiving
› Fewer youth are sending and receiving remittances› Women report sending and receiving fewer remittances than men.

Mobile money is the main channel for sending and receiving money regardless of respondents age
www.MercyCorpsAFA.org
90%
16%
6%
1%
95%
5%
3%
Mobile money
Hand Delivery
Commercial bank
Post office
Receiving Sending
N=671
› About half of the respondents said they retain some of the amount received, and don’t cash out the full amount right away.
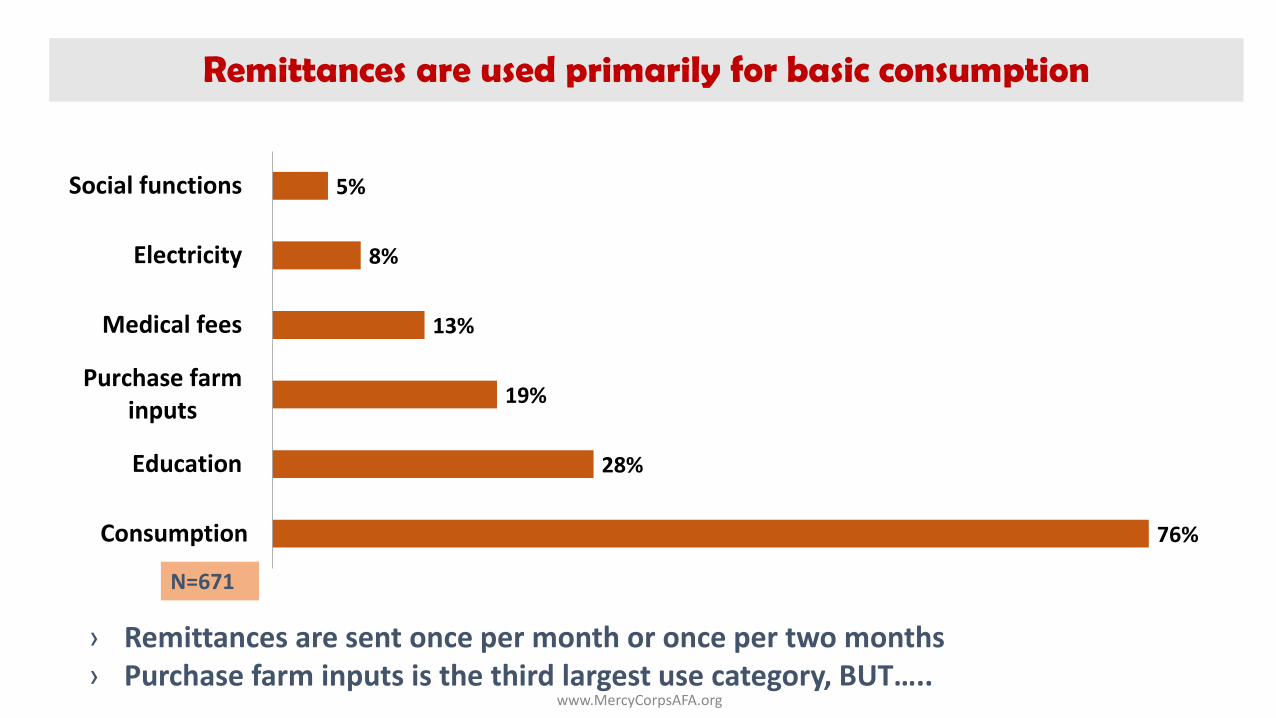
Remittances are used primarily for basic consumption
www.MercyCorpsAFA.org
76%
28%
19%
13%
8%
5%
Consumption
Education
Purchase farminputs
Medical fees
Electricity
Social functions
› Remittances are sent once per month or once per two months› Purchase farm inputs is the third largest use category, BUT…..
N=671
www.MercyCorpsAFA.org
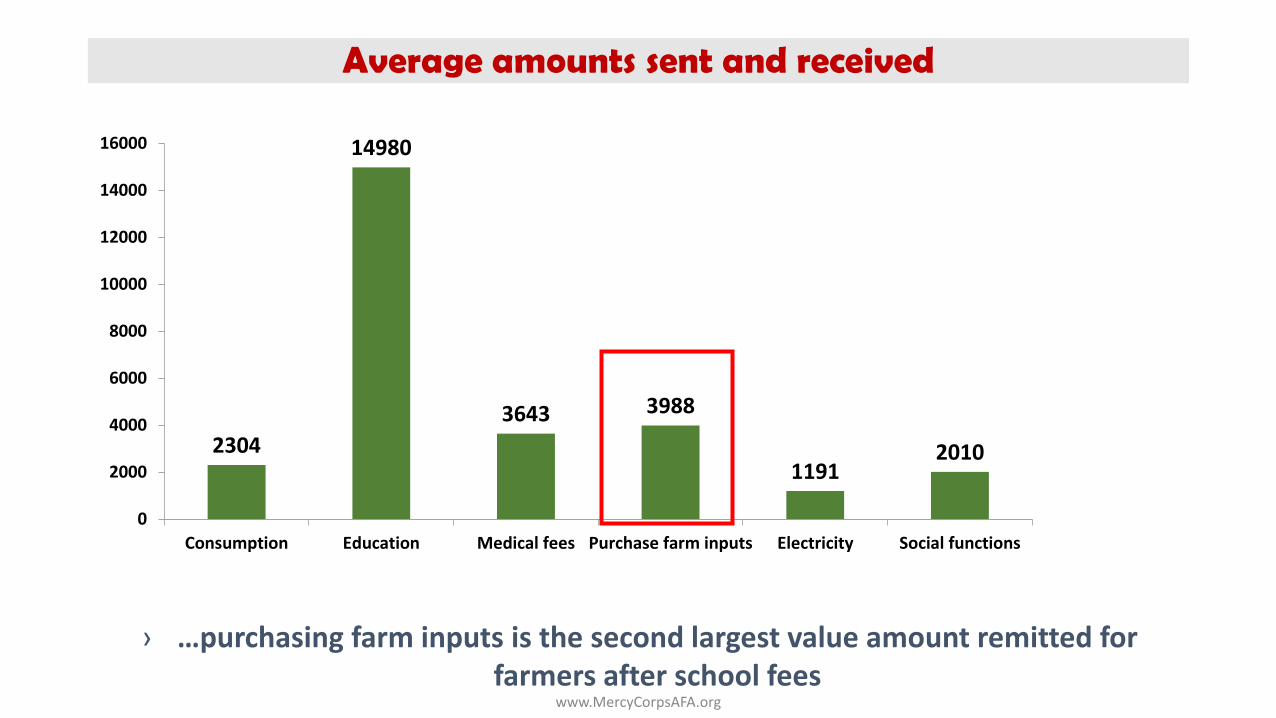
2304
14980
3643 3988
11912010
0
2000
4000
6000
8000
10000
12000
14000
16000
Consumption Education Medical fees Purchase farm inputs Electricity Social functions
Average amounts sent and received
› …purchasing farm inputs is the second largest value amount remitted for farmers after school fees

AGRICULTURAL ADVISORY SERVICES AND THE USE OFMOBILE TECHNOLOGY
www.MercyCorpsAFA.org

www.MercyCorpsAFA.org
Half of the interviewed farmers had access to agricultural advisory services in the last 12 months
N=550
55%
45%
55%
20%
79%
52%48%
Total Central Western 18-30 Years Above 30 Years Male Female
www.MercyCorpsAFA.org
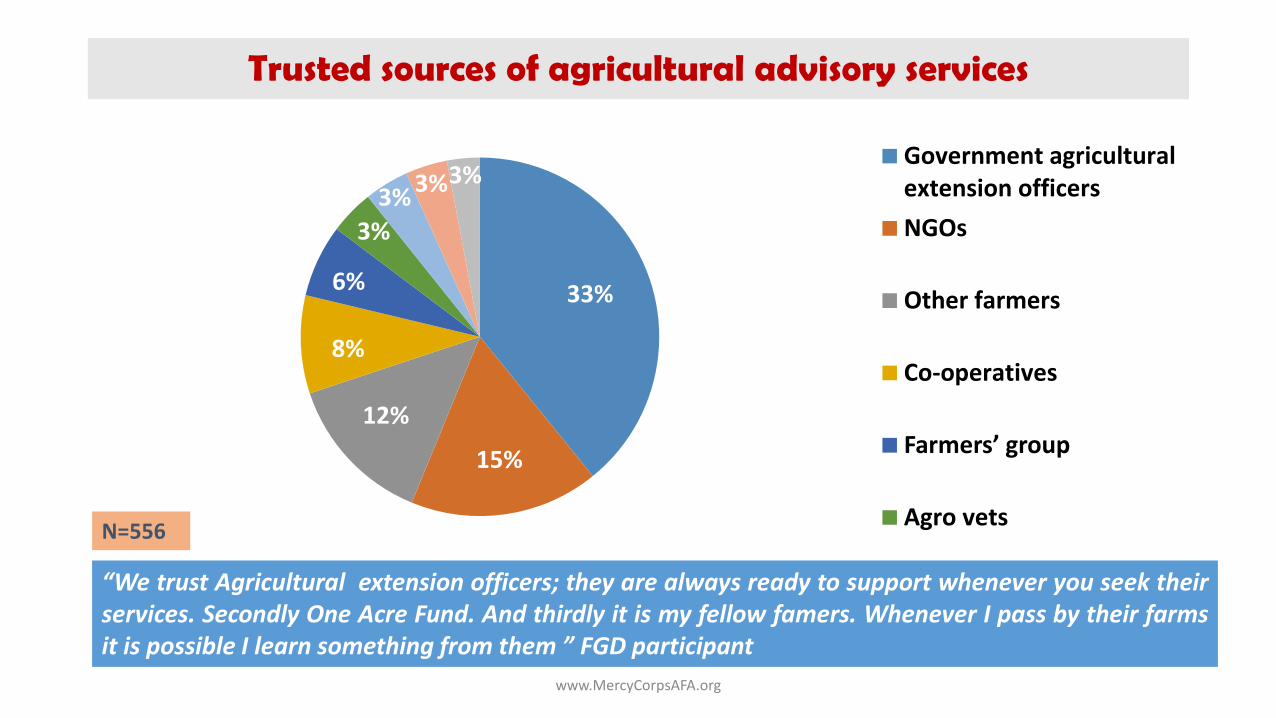
Trusted sources of agricultural advisory services
33%
15%
12%
8%
6%
3%
3%3%3%
Government agriculturalextension officers
NGOs
Other farmers
Co-operatives
Farmers’ group
Agro vetsN=556
“We trust Agricultural extension officers; they are always ready to support whenever you seek theirservices. Secondly One Acre Fund. And thirdly it is my fellow famers. Whenever I pass by their farmsit is possible I learn something from them ” FGD participant

Listen to radio programs Popular radio stations Popular radio programs
Region Central 67% West FM Mugambo wa murimi
Western 60% Inooro FM Ukulima bora
Gender Male 70% Citizen radio Kilimo bora
Female 58% Kameme FM Kilimo biashara
Age 18-30 Years 58% Shamba shape up
Above 30 years 66%
www.MercyCorpsAFA.org
Farmers listen to agricultural radio programs as a source of agricultural information
N=1010
None of the small holder farmers receiving agricultural advisory services mentioned television as a channel of communication.

www.MercyCorpsAFA.org
But which channels are primarily used to convey agricultural advisory services?
97%
1%1%
1%
Face to face
Voice(either recorded voice orphone conversation)
Radio
SMS
N=550
Only 1 percent of small holders reported SMS as a primary channel for advisory services.

www.MercyCorpsAFA.org
Government extension officers are the largest source of agriculturaladvisory services although in Western other farmers and NGOs arealso significant sources.
25%
6%
%
8%
3% 2% 3% 1% 2% 2% 1% 1%
15%13%
17%
2%
6% 5% 4% 5% 3% 2% 2% 2%
Central Western
N=1010
› Face to face is most common channel used to receive the advisory services, and the services arereceived monthly or less than once per month.
› Non governmental organizations mentioned to support Agricultural activities in Western are theOne Acre fund, MOKWO friends, International Community Services, NALEP.
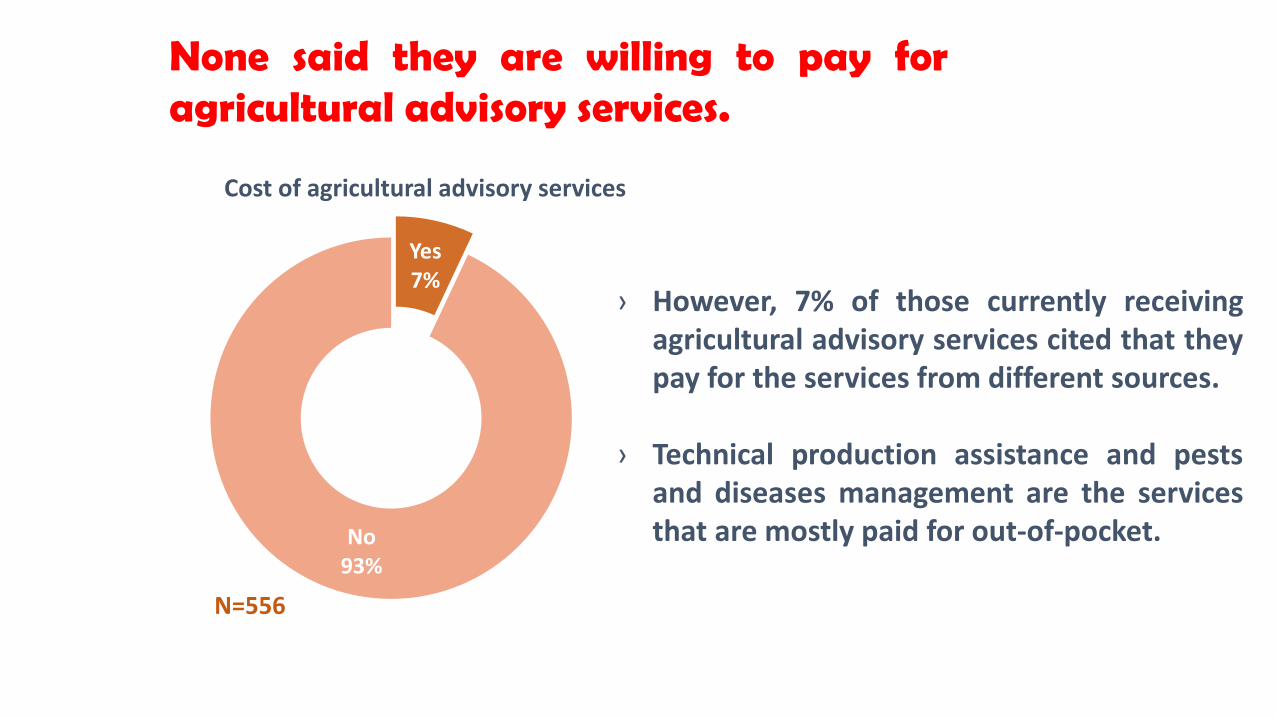
Cost of agricultural advisory services
Yes 7%
No 93%
› However, 7% of those currently receivingagricultural advisory services cited that theypay for the services from different sources.
› Technical production assistance and pestsand diseases management are the servicesthat are mostly paid for out-of-pocket.
N=556
None said they are willing to pay foragricultural advisory services.

www.MercyCorpsAFA.org
25%
17%
14%11% 10% 9% 8%
5%
24%
27%
11% 11%
1%
9%
4% 2%
26%
7%
16%
11%
20%
10%
13%
8%
Pests anddiseases in field
crop
Too little rainfall Unpredictabletiming andamount of
rainfall
Prolongeddrought/ dry
spells
Too muchrainfall
Pests anddiseases inlivestock
Depletion of soilfertility
Poor qualityseeds
Overall Central Western
N=1010
Crop pests and diseases are the main constraint for small holder farmers
This finding suggests that advisory services may want to focus on pests and diseases.
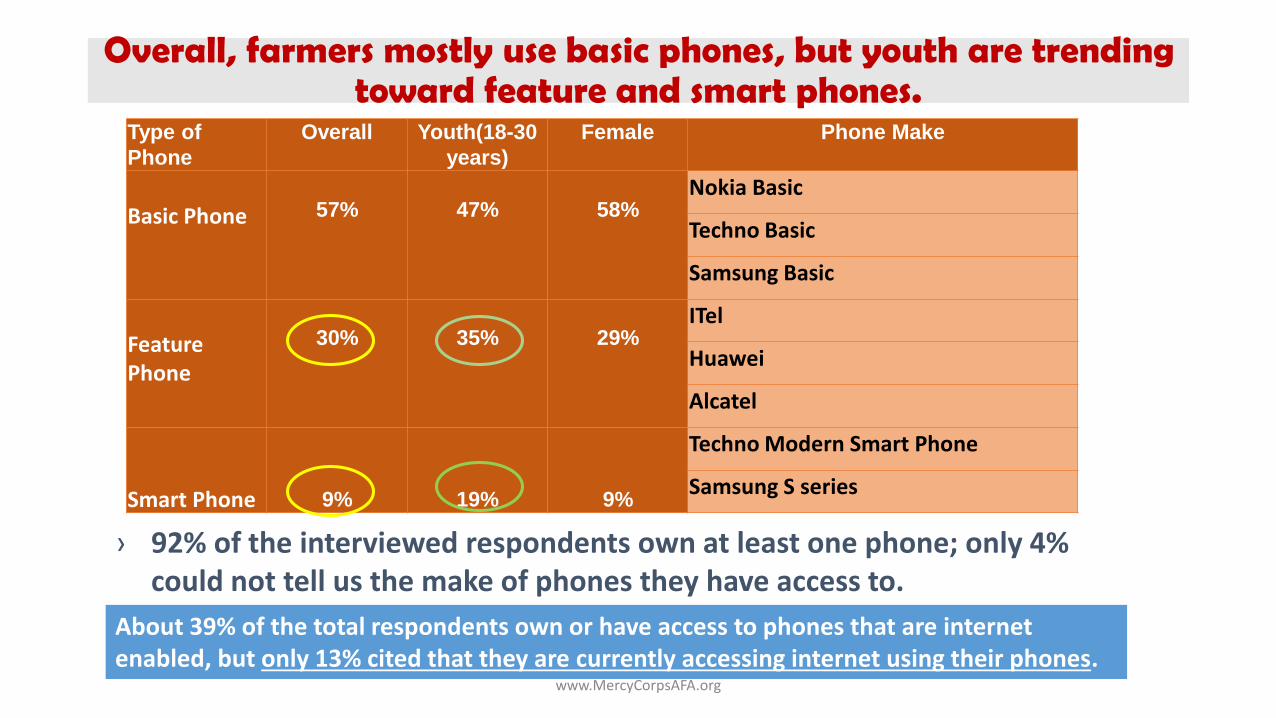
Type of
Phone
Overall Youth(18-30
years)
Female Phone Make
Basic Phone 57% 47% 58%Nokia Basic
Techno Basic
Samsung Basic
Feature Phone
30% 35% 29%ITel
Huawei
Alcatel
Smart Phone 9% 19% 9%
Techno Modern Smart Phone
Samsung S series
www.MercyCorpsAFA.org
Overall, farmers mostly use basic phones, but youth are trending toward feature and smart phones.
› 92% of the interviewed respondents own at least one phone; only 4% could not tell us the make of phones they have access to.
About 39% of the total respondents own or have access to phones that are internet enabled, but only 13% cited that they are currently accessing internet using their phones.

www.MercyCorpsAFA.org
How important would you say your phone is in accessing information about farming?
34%
25%
Very important ImportantN=1010
“I have never tried it (SMS) but if I can get access to information about farming from where I am and the typeof farm inputs accessible in my region; where and how much I can buy them. Which type of fertilizer I can useand generally a lot of information about farming that I can access…..this will be very beneficial for me!” FGDparticipant.

www.MercyCorpsAFA.org
99% 99%
81% 79%70% 66%
34% 33%28%
12% 10% 9%
N=950
Main functions farmers perform on their phones are making/receiving calls, withdrawing/depositing money,
sending/receiving messages and buying airtime
“in our area we use both Safaricom and Airtel but we mostly prefer to use Safaricom because theyhave network across the entire country and have M-Pesa outlets almost everywhere” FGD Participant

FINANCIAL SERVICES Subtitle Goes Here
www.MercyCorpsAFA.org

www.MercyCorpsAFA.org
34% 34% 34%
14% 14%
21%
52%
26%
11%
23%
13%
4%
M-pesa Chama Equity Bank Savings in ahidden place
Mshwari Co-operativeSACCO
Central Western
Which saving instruments do you use?
N=709
› Central respondents tend to use formal saving instruments more than the Western respondents

www.MercyCorpsAFA.org
Farmers report they use numerous savings instruments.
M-P
esa
Ch
ama
Equ
ity
Ban
k
Savi
ngs
in a
h
idd
en
pla
ce
M-s
hw
ari
Co
-op
era
tive
SA
CC
O
A g
rou
p o
f fr
ien
ds
in R
OSC
A
Co
-op
era
tive
Ban
k
Form
al S
AC
CO
KC
B M
-Pe
saA
cco
un
t
Mic
rofi
nan
ce
Ban
k
Farm
ers
’ sa
vin
gs
and
loan
gro
up
Fam
ily b
ank
pe
sap
ap
M-Pesa 303 89 64 43 69 22 33 16 11 12 9 1 4Chama 89 213 45 35 33 19 9 8 8 7 6 1 2Equity Bank 64 45 160 18 32 12 13 8 7 8 4 3 0Savings in a hidden place 43 35 18 130 4 5 31 1 1 0 1 1 1M-Shwari 69 33 32 4 94 5 8 7 7 10 5 2 1Co-operative SACCO 22 19 12 5 5 91 0 7 2 2 2 2 4A group of friends in ROSCA 33 9 13 31 8 0 59 0 0 1 2 0 0Co-operative Bank 16 8 8 1 7 7 0 40 3 2 0 0 0Formal SACCO 11 8 7 1 7 2 0 3 26 1 2 0 1KCB M-Pesa Account 12 7 8 0 10 2 1 2 1 22 1 1 0Microfinance Bank 9 6 4 1 5 2 2 0 2 1 20 0 0Farmers’ savings and loan group 1 1 3 1 2 2 0 0 0 1 0 10 0Family Bank Pesa pap 4 2 0 1 1 4 0 0 1 0 0 0 10
Farmers who report saving on M-Pesa are also more likely to use chamas, Equity Bank and M-Shwari
www.MercyCorpsAFA.org
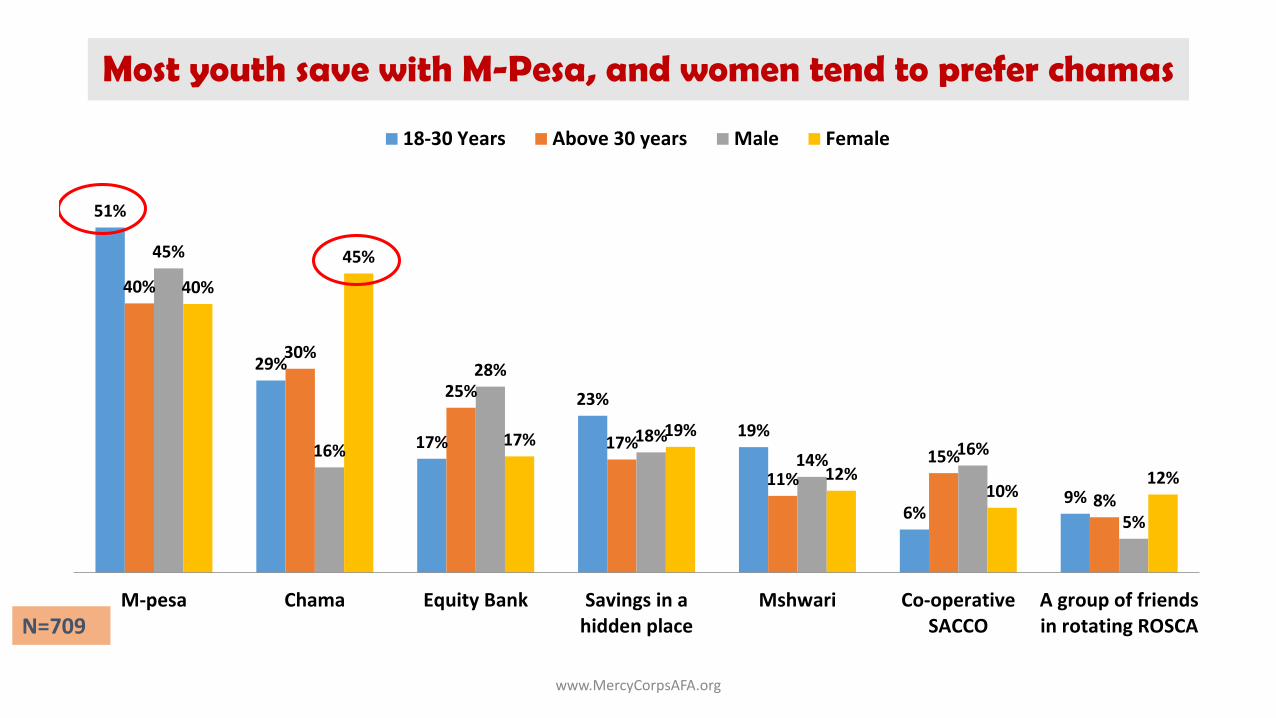
Most youth save with M-Pesa, and women tend to prefer chamas
51%
29%
17%
23%
19%
6%9%
40%
30%
25%
17%
11%15%
8%
45%
16%
28%
18%
14%16%
5%
40%
45%
17%19%
12%10%
12%
M-pesa Chama Equity Bank Savings in ahidden place
Mshwari Co-operativeSACCO
A group of friendsin rotating ROSCA
18-30 Years Above 30 years Male Female
N=709

M-Pesa Chama Equity Bank
Savings in a hidden place
M-shwari
Co-operative SACCO
A group of friends in rotating ROSCA
Easy access to savings
62% 42% 32% 65% 48% 29% 69%
Location 1% 7% 11% 5% 3% 5% 8%
Cost 2% 4% 9% 0% 1% 4% 2%
Accessibility 33% 24% 28% 28% 19% 21% 8%
Easy access to loan/credit
1% 17% 16% 0% 27% 32% 7%
www.MercyCorpsAFA.org
Drivers for saving vary per saving instrument
www.MercyCorpsAFA.org
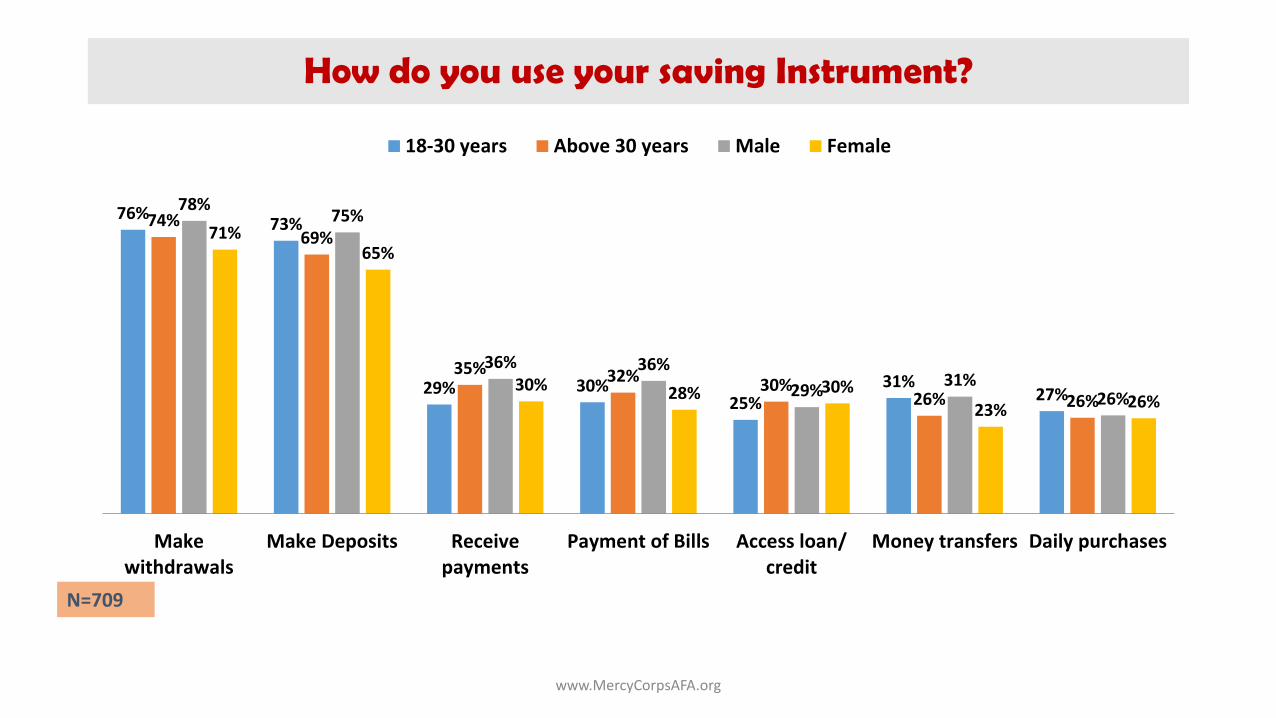
76%73%
29% 30%25%
31%27%
74%69%
35% 32% 30%26% 26%
78%75%
36% 36%
29%31%
26%
71%65%
30% 28% 30%23% 26%
Makewithdrawals
Make Deposits Receivepayments
Payment of Bills Access loan/credit
Money transfers Daily purchases
18-30 years Above 30 years Male Female
How do you use your saving Instrument?
N=709

www.MercyCorpsAFA.org
28% 27%
23% 23%
27%
total central Western Male Female
Farmers are averse to using credit
“We have the money lenders and micro-finance that are illegitimate whose mainaim is to steal from the common man. It is through such experience that havemade many people to shy away from taking loans.” FGD participant
N=283

www.MercyCorpsAFA.org
28%
21%
27%
Total 18-30 Years Above 30 Years
Are you currently servicing a loan?
N=283

www.MercyCorpsAFA.org
19% 17% 14% 8% 6% 3% 3%
45%39% 45%
17%11%
34%
28% 17%
17%
11%
11% 11%
Chama Bank SACCO Mshwari Microfinance family/friends/neighbor Agricultural Inputsupplier
Total Central Western
Which loan instrument do you use?
“I took I loan of kshs. 30,000 from women’s formal group; use it in farming.” FGD participant
“I took a loan from women’s group(KWFT); you know we have to promote women; I took I loan of kshs. 5,000which was charged an interest rate of 5%” FGD participant
N=283

26%
12%14%
Overall Secured unsecured
21%
12%
21%
11%8% 7% 6% 6%
3% 4% 3% 3% 4% 3% 1%
26% 26%
14%
25%
15%
5% 6% 5%7%
3% 4% 3% 2% 1% 2%
Central Western › Education and farm inputs are the primary reasons for taking loan among the surveyed farmers who are currently servicing a loan
› A slightly higher number of farmers are currently servicing an unsecured loan as compared to servicing a secured loan.
N=1010
N=1010
Farmers are borrowing for fertilizer, livestock and seed purchases
www.MercyCorpsAFA.org
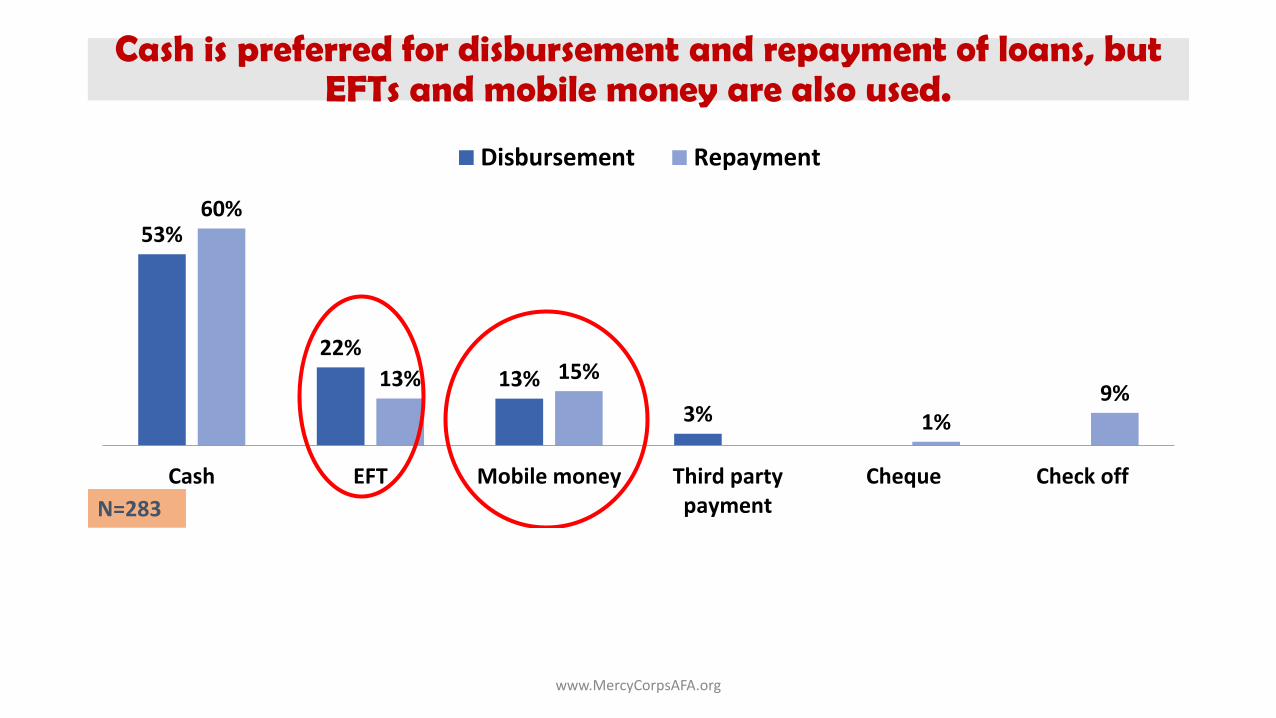
53%
22%
13%
3%
60%
13% 15%
1%9%
Cash EFT Mobile money Third partypayment
Cheque Check off
Disbursement Repayment
N=283
Cash is preferred for disbursement and repayment of loans, but EFTs and mobile money are also used.
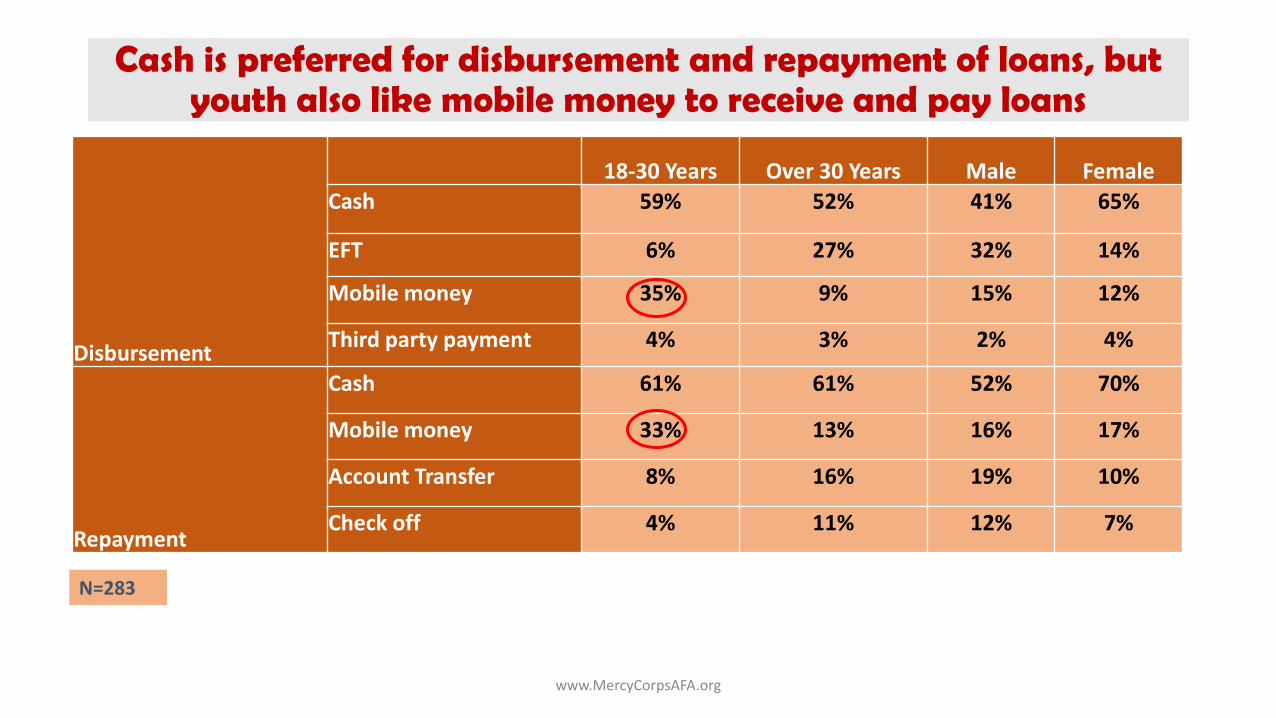
Disbursement
18-30 Years Over 30 Years Male Female
Cash 59% 52% 41% 65%
EFT 6% 27% 32% 14%
Mobile money 35% 9% 15% 12%
Third party payment 4% 3% 2% 4%
Repayment
Cash 61% 61% 52% 70%
Mobile money 33% 13% 16% 17%
Account Transfer 8% 16% 19% 10%
Check off 4% 11% 12% 7%
www.MercyCorpsAFA.org
Cash is preferred for disbursement and repayment of loans, but youth also like mobile money to receive and pay loans
N=283

Counts
How payments are made?
Cash Bank Branch/Agent Mobile money
Others (POS, ATM, in kind)
Pay for farm inputs( seeds, fertilizers, pesticides 75990% 0% 1% 9%
Pay school fee 563 63% 24% 5% 9%
Pay for farm labor 396 71% 0% 3% 26%
Pay for livestock feeds 35595% 0% 1% 4%
Pay a medical bill 333 86% 1% 1% 11%
Pay an electricity bill 238 39% 6% 54% 1%
Pay for water 16076% 7% 16% 2%
Pay TV/cable/satellite bill 81 16% 0% 84% 0%
www.MercyCorpsAFA.org
Most common payments are for farm inputs and school fees
Cash is predominant but mobile money is common for paying certain bills. Payment of labor is mostly by cash or in kind N=1010

www.MercyCorpsAFA.org
Low uptake of insurance among smallholder farmers
N=1010
34%
26%
3%
Awareness Usage Excluding NHIF
› Insurance products used by youth are NHIF and NSSF
www.MercyCorpsAFA.org
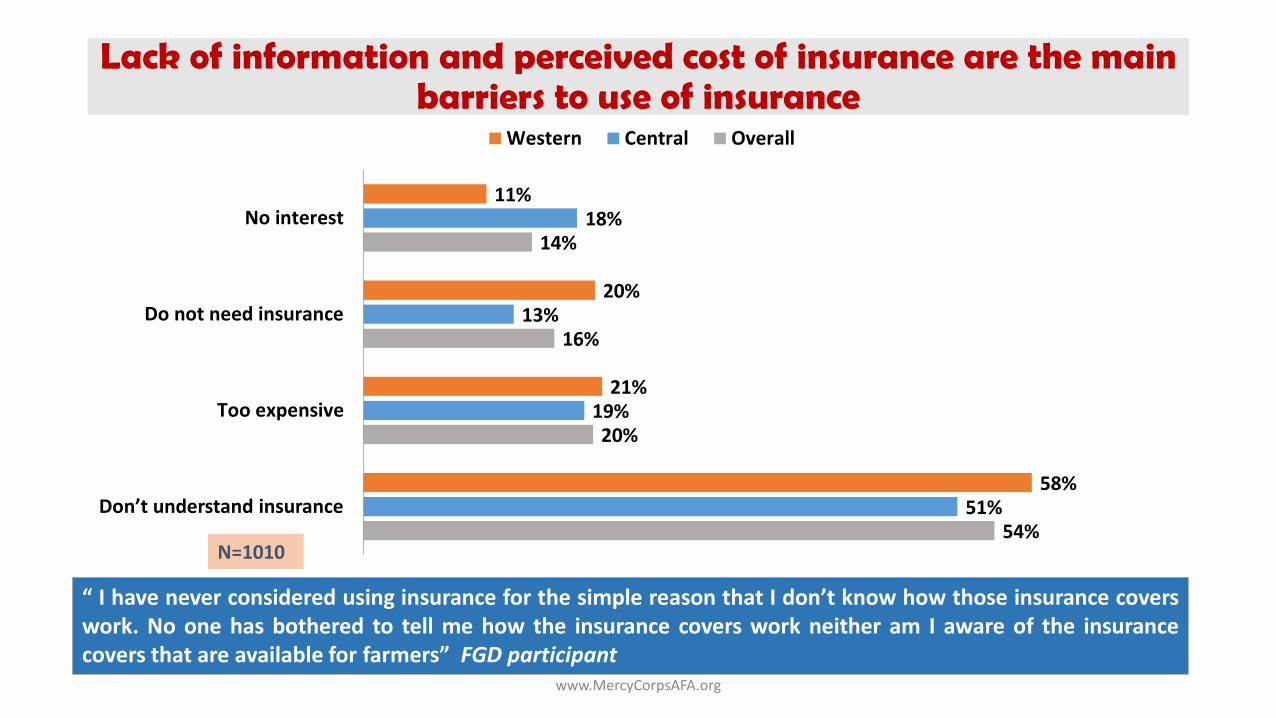
54%
20%
16%
14%
51%
19%
13%
18%
58%
21%
20%
11%
Don’t understand insurance
Too expensive
Do not need insurance
No interest
Western Central Overall
N=1010
“ I have never considered using insurance for the simple reason that I don’t know how those insurance coverswork. No one has bothered to tell me how the insurance covers work neither am I aware of the insurancecovers that are available for farmers” FGD participant
Lack of information and perceived cost of insurance are the main barriers to use of insurance
www.MercyCorpsAFA.org
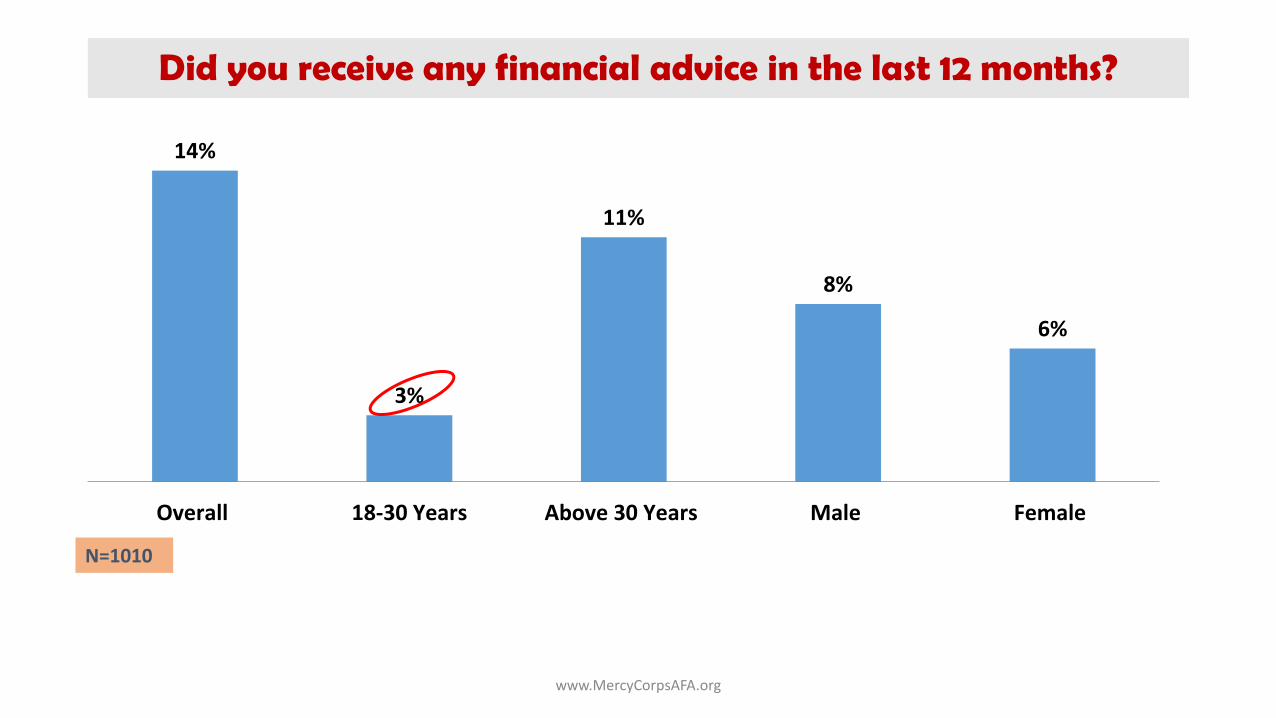
14%
3%
11%
8%
6%
Overall 18-30 Years Above 30 Years Male Female
Did you receive any financial advice in the last 12 months?
N=1010
www.MercyCorpsAFA.org
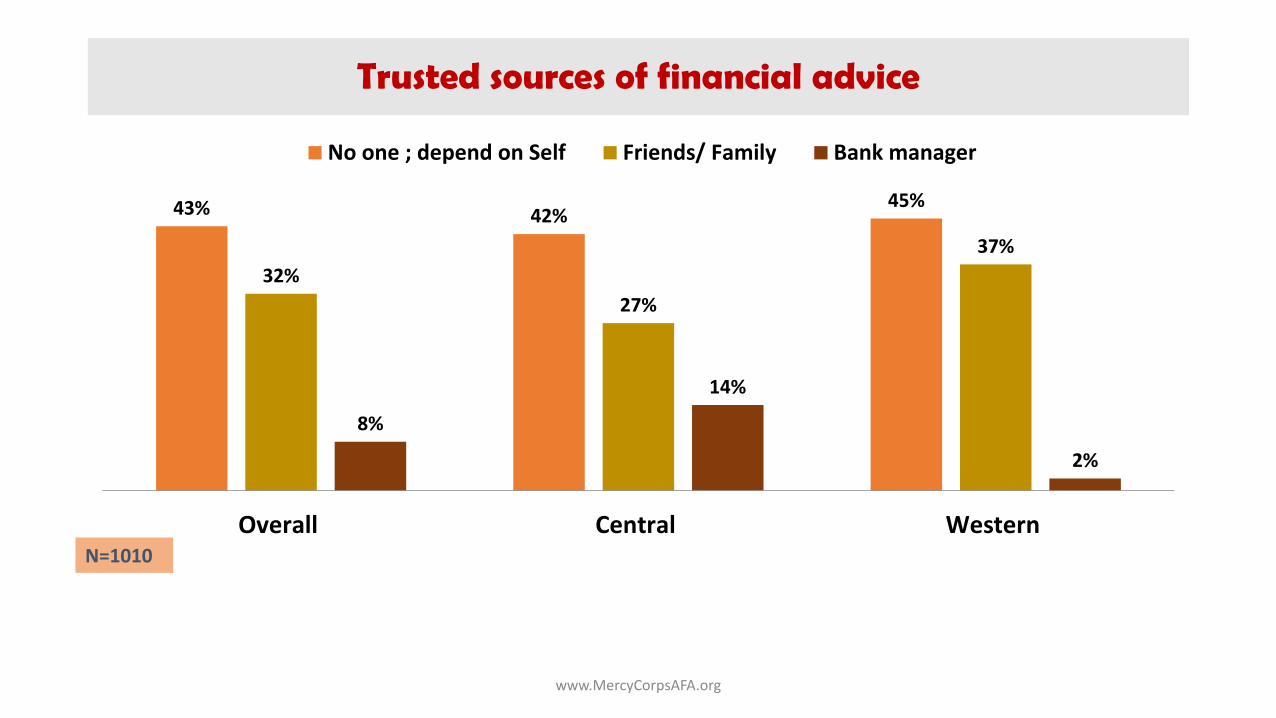
Trusted sources of financial advice
43% 42%45%
32%
27%
37%
8%
14%
2%
Overall Central Western
No one ; depend on Self Friends/ Family Bank manager
N=1010
Find the full report on www.MercyCorpsAFA.org
Email: [email protected]
MercyCorps Offices
ABC PLACE
NAIROBIwww.MercyCorpsAFA.org
supported by


