Characterizing the Effect of Increased Phosphorus and Potassium on Seedling Diseases and Sudden Death Syndrome of Soybean in Ohio THESIS Presented in Partial Fulfillment of the Requirements for the Degree Master of Science in the Graduate School of The Ohio State University By Meredith Milo Eyre Graduate Program in Plant Pathology The Ohio State University 2016 Master's Examination Committee: Dr. Anne E. Dorrance, Advisor Dr. Steve Culman Dr. Terry Niblack Dr. Pierce Paul
Transcript
Characterizing the Effect of Increased Phosphorus and Potassium on Seedling Diseases and Sudden Death Syndrome of Soybean in Ohio
THESIS
Presented in Partial Fulfillment of the Requirements for the Degree Master of Science in the Graduate School of The Ohio State University
By
Meredith Milo Eyre
Graduate Program in Plant Pathology
The Ohio State University
2016
Master's Examination Committee:
Dr. Anne E. Dorrance, Advisor Dr. Steve Culman Dr. Terry Niblack
Dr. Pierce Paul
Copyrighted by
Meredith Milo Eyre
2016
ii
Abstract
Soil fertility may affect the development of soybean diseases, including those
caused by soil borne pathogens. Though increased phosphorus and potassium levels have
the potential to enhance crop productivity and profitability, secondary effects on
pathogens may prove detrimental to overall plant health. Fertility recommendations
serve to define optimum levels and require periodic revision to balance nutrient demands
of modern cultivars and economic yield response with the associated increases in
production costs, environmental considerations, and potential disease development.
Fertility recommendations for soybean in the Tri-State area of Ohio, Michigan, and
Indiana have not been updated in over 20 years, despite dramatic yield increases and
other changes in the industry. As part of a larger collaboration working to re-evaluate
current recommendations, this study assessed the effects of higher than recommended
rates of phosphorus and potassium on seedling disease and sudden death syndrome
disease (SDS) development in soybean through both field and greenhouse trials.
Treatments above the recommended rates in the form of 112 kg/ha diammonium
phosphate (DAP), 112 kg/ha potash, 112 kg/ha DAP and 112 kg/ha potash, and a
nontreated control were applied to 5 field sites with seedling disease history and no
differences in stand nor yield occurred. However, a significantly higher number of plants
affected by damping-off was observed in plots treated with potassium than the other
iii
treatments at one location (p= 0.041). Furthermore, a trend occurred in two intensively
surveyed fields in that higher than recommended rates of phosphorus, potassium, and
phosphorus plus potassium seemed to increase the number of oomycetes, as more isolates
were recovered from plots that had been treated with fertilizer than the nontreated
control. More than 15 different oomycete species were recovered from both fields. In
greenhouse assays, lower root weights occurred in plants which received fertilizer in 2 of
3 greenhouse trials.
When the same treatments were applied to field soils naturally infested
with Fusarium virguliforme, the addition of phosphorus and potassium applied separately
significantly reduced SDS disease index at one of two locations (p= 0.052). The
significant difference detected at this site may be due to lower baseline potassium levels
and higher soybean cyst nematode (SCN) counts. Furthermore, in the presence of SCN
and SDS, phosphorus and phosphorus plus potassium applied at levels higher than
currently recommended enhanced yields, suggesting these additions may decrease disease
pressure or compensate for the biotic stress. Clear trends were not observed in
greenhouse trials with SDS infested soil amended with any of the fertility treatments.
These trends are worth further investigation in continued field trials and
greenhouse trials modified to use inoculated soil with fertility applied incrementally
under consistent conditions. Future field studies which examine the effects of higher
fertility on SDS should prioritize fields with low base levels of potassium and high SCN
counts, as preliminary work suggests applying phosphorus and potassium at rates higher
than currently recommended may enhance yield under these conditions.
iv
For my loving family
and special Matt
v
Acknowledgments
As with any huge endeavor, this project represents the support of many. I’m honored
to have worked with such a dedicated group of people. I’ve learned more than I could have
imagined from this experience and I’m confident these lessons, both realized and yet-
unknown, will continue to manifest themselves in my career and other pursuits for many
years to come. Most importantly, I thank Dr. Anne Dorrance for her patient guidance,
genuine support, and wise insight. I have always trusted her to simultaneously question and
challenge me in ways that provide the most opportunity for growth, and I can only hope my
future adventures will honor her efforts. I also thank members of the Dorrance lab for
providing a comfortable and supportive work environment. I thank Clifton Martin for his
field help and thoughtful insight on long car rides. I thank Damitha Wickramasinghe for the
time she took to patiently teach me the process of isolate identification and develop my skill
set in the lab. I thank Chrissy Balk for her early support. Even in the midst of her
challenging final weeks here, she was careful to only ever encourage me. I thank Linda,
Delores, Taylor, and Savannah for their help and Cassidy, Jaqueline, and Anna for their
guidance. Beyond their respective help, I thank Kelsey and Jonell for the comic relief and
ridiculous stories that kept me grounded. Amilcar, our rooftop adventures, long talks, and
daily laughs and pranks provided encouragement, perspective, and inspiration. May you earn
the rank of professor someday without accidentally hurting yourself in the process. I thank
Bob James for autoclaving an entire truckload of field soil and the heart-felt encouragement
vi
when I needed it most. I thank my committee for their advice, direction, and time. Each
models a career rooted in scientific inquiry driven by genuine curiosity. I thank Dr. Steve
Culman for introducing me to the complexity of soil science and including me in his project.
I thank Dr. Pierce Paul for the statistical help and curiosity that has always demanded I think
a bit farther and a bit deeper. I thank Dr. Terry Niblack for her enthusiasm in my first Plant
Pathology course, which can only be described as inspiring. Her genuine support for my
early proposal drafts meant more than she could imagine. I thank The Ohio State University
Plant Pathology Department for providing an excellent academic home. As a third-
generation Buckeye, my loyalty to the school and this department will always run deep. I
thank the Ohio Soybean Council for the support and can only hope I’ve contributed to the
base of knowledge they’ve requested. Finally, I’d like to thank my Wooster community. I
thank the College of Wooster for providing a place of exploration; where the pursuit of
knowledge is only gained through questioning and adventure. I thank Dr. Richard Lehtinen
for the exposure to field ecology and Dr. Charles Kammer for sharing his compassionate
perspective. Both have shaped me profoundly and their respective legacies will last a
lifetime. I thank my Wooster parents, Bob and Bobbie Randall, for sharing their love, home,
and dogs. I thank my Monday night dinner friends for welcoming me into a network of faith,
children, delicious meals, and peace. I thank Carli Moorfield for the conversations, Emily
Oshinksie for being my buddy, and the Wooster Community Band for providing perspective
and peace throughout my time here. Above all, I thank my family and dear Matt Germaine
for everything.
vii
Vita
June 2009……………………………….Westlake High School
May 2013……………………………….B.A. Biology, College of Wooster
August 2016…………………………….M.S. Plant Pathology, The Ohio State University
Publications
Eyre, M. and R.M. Lehtinen. Fitzgerald’s Marsupial Frog (Flectonotus fitzgeraldi). In: Amphibians
and Reptiles of Trinidad and Tobago. Murphy, J.C. (2 ed.) Spring 2013. In Preparation.
Identification of Widespread Hybridization between Two Terrestrial Salamanders Using Morphology,
Coloration, and Molecular Markers. Copeia, 104(1): 132-139.
Eyre M, Dorrance AE, Michel AP, 2015. Damping-off is not always caused by water molds and fungi;
insects can play a role too. C.O.R.N. Newsletter 15.
Eyre M, Martin C, Balk C, Wickramasinghe D, Dorrance AE, 2015. Cold Spring Rains Brought
Perfect Conditions for Pythium in Ohio and a Few More Surprises. Oomycete Molecular Genetics
Network Annual Meeting Monterey, CA.
Eyre M, Martin C, Culman S, Dorrance AE, 2015. Pathogen Response to Altering Levels of Soil
Fertility in Soybean Fields Across Ohio. American Phytopathological Society Annual Meeting
Pasedena, CA.
Eyre M, Culman S, Dorrance AE, 2016. The Effect of Increased Soil Fertility on Seedling Disease
Development of Soybean in Ohio. American Phytopathological Society Annual Meeting Tampa, FL.
Fields of Study Major Field: Plant Pathology
viii
Table of Contents
Abstract ............................................................................................................................... ii Acknowledgments .............................................................................................................. v
Vita .................................................................................................................................... vii Publications ....................................................................................................................... vii Fields of Study .................................................................................................................. vii Table of Contents ............................................................................................................. viii List of Tables ..................................................................................................................... xi List of Figures ................................................................................................................. xvii Chapter 1: Literature Review ............................................................................................. 1
Significance of Soybean .............................................................................................. 1
This represents a dramatic increase in yield compared with 1986, when farmers in the
United States produced 1.94 billion bushels on 60.4 million acres with a yield of 33.3
bu/acre (National Agricultural Statistics Service, 2014; American Soybean Association,
2015). Though production of soybean in the United States has doubled in the past 30
years, the area dedicated to soybean has increased only 38% while seed yields have
increased by 44%. Growers have come to expect an increase in yield by approximately
1% each year (Wilcox, 2001).
The growth of the soybean industry is a direct result of the increase in popularity
of the soybean itself. The plant is used in a number of ways and can be divided into three
main categories: oil, meal, and hulls. Note that 1 bushel of soybean on average weighs
3
60 lbs and produces 11 lbs of oil and 48 lbs meal (American Soybean Association, 2015).
In 2014, 20.6 billion pounds of oil was produced in the United States. Of this, 70% was
used in human food, 22% was used for biodiesel technology, and the remaining was used
for other industrial purposes (United Soybean Board, 2015). Soybean oil represents 55%
of vegetable oil in the country, followed by canola oil at 16% (American Soybean
Association, 2015). Biodiesel technology has increased from 1.9 million liters in 1999 to
6,615 million liters in 2014 (American Soybean Association, 2015; United Soybean
Board, 2015). The remaining soybean oil is used for industrial purposes. According to
the United Soybean Board, over 800 products have been developed with soy including:
soaps, lotions, paint-strippers, paint, ink, wood adhesives, solvents, surfactants, and
lubricants. Plastic composites from the oil have been used in spray-foam insulation,
hardwood, particle board, boats, cars, and even agricultural equipment. Lecithin is
extracted from soybean oil and can be used for pharmaceuticals, protective coatings,
lubricants, and emulsifiers (American Soybean Association, 2015).
Soybean meal serves as a high source of fiber and includes essential amino acids
for animal feed (United Soybean Board, 2015). In fact, 96.5% of soybean meal
representing 30.5 million short tons was used for animal feed in the US in 2014
(American Soybean Association, 2015). Of this, 55% was fed to poultry, 22% to swine,
11% to beef, 7% to dairy (American Soybean Association, 2015). In addition to meal,
cattle may be fed soybean hulls (crush) (United Soybean Board, 2015).
4
Soil Fertility
Soil fertility is defined as the ability of the soil to provide chemical elements in
quantities and proportions necessary for the growth of specified plants (Havlin et al.,
2005). Though the addition of essential nutrients is crucial for the health and
productivity of the crop, soil fertility represents only one facet of overall soil productivity
and does not solely dictate the yield of the crop. Instead, crop productivity is based on a
number of climatic conditions, crop factors, and soil characteristics (Division of Soil and
Water Conservation, 2005; Rice, 2007) (Appendix A). Climatic conditions include
precipitation, air temperature, humidity, solar radiation, and wind. Crop factors include
genetics, population density, and pests and disease. Soil characteristics also contribute to
overall crop productivity, though the many characteristics form a complex web often
difficult for researchers to tease apart. These characteristics include soil food webs,
organic matter cycling, texture and composition, pH, aggregation, compaction and
drainage, cation exchange capacity, management effects, and soil fertility. Therefore,
soil fertility is only one aspect of a much larger agronomic system. Despite this
perspective, maintaining proper soil fertility is necessary to maximize plant growth and
yield.
Fertilizers typically include nitrogen, phosphorus, and potassium. However,
studies have shown that increasing nitrogen levels has a negligible effect on soybean
yields due to nitrogen fixation by Rhizobium bacteria (Grubinger et al., 1982), so
phosphorus and potassium are the primary inputs. Specific rates of fertilizer application
must be established and updated periodically to balance an increase in crop productivity
5
with environmental and economic losses. Soybean growers in Ohio rely on the Tri-State
Fertilizer Recommendations for application rates (Vitosh et al. 1995). However, these
recommendations are 20 years old. The soybean industry has changed significantly
during this time resulting in relatively dramatic yield increases and many new cultivars,
some of which are considered a high protein variety. Therefore, as part of a larger
collaboration to update these outdated recommendations, the purpose of this study was to
examine the effect of excess phosphorus and potassium on disease development, either
by directly altering pathogen activity or by stressing the plant to favor infection by one or
more pathogens. It should be noted that “excess fertility” indicates fertilizer was applied
at levels higher than recommended by current guidelines.
Pathogens of Soybean
Soybean is affected by a large number of diseases due in part to the diversity of
soybean cultivars and variation in the environmental conditions throughout the crop’s
geographic range. Each pathogen species may be distributed widely or limited
geographically, varying in frequency of occurrence and potential yield loss (Grau et al.,
2004). Though more than 200 pathogens are known to affect soybean around the world,
only 35 are economically important (Hartman, 2015). During the 2009 growing season,
an estimated 484 million bushels were lost to disease in the United States (Bradley et al.,
2015; Koenning and Wrather, 2010). Of these estimated losses, soil borne diseases affect
the crop most dramatically. Soybean cyst nematode, seedling diseases, Phytophthora root
and stem rot, and sudden death syndrome were ranked the top four most influential
6
diseases, respectively, to affect yield in 2006 to 2009 (Bradley et al. 2015; Keonning and
Wrather, 2010). Management has proven difficult for these soil borne diseases, as seed
treatments are limited to managing seedling diseases early in the season, and foliar-
applied fungicides generally do not affect soil borne pathogens.
The most common symptom of seedling disease is reduced stand count (Grau et
al., 2004). Seedlings that have emerged may have lesions on the roots, hypocotyl, or
cotyledons. Often, the stem disintegrates at the base of the newly emerging seedling,
causing damping-off symptoms. Overall root decay with unclear margins may cause the
root to turn pale to deep brown, black, or brick red (Grau et al., 2004).
Several pathogens cause seedling diseases including many species of
Pythium and Fusarium, Rhizoctonia solani, Phytophthora sojae, Ph. sansomeana,
Macrophomina phaseolina, and Mycoleptodiscus terrestrus (Grau et al. 2004; Rizvi and
Yang, 1996; Tachibana et al., 1971, Tachibana, 1971). These pathogens may survive in
the soil for years and infect soybean over a wide range of environmental conditions.
Seedling pathogens may infect individually or in combination (Ellis et al., 2011; Broders
et al., 2007a, Broders et al., 2007b). Studies have shown varying pathogenicity among
the genera. Fields were surveyed in one study and 94% of Pythium isolates, 21% of
Fusarium isolates, and 75% of R. solani isolates were pathogenic (Rizvi and Yang,
1996). In a soil baiting assay which surveyed soil from 3 counties in Ohio, Dorrance et
al. (2004) reported a range of pathogenicity within and between 5 Pythium species.
7
Due to the high pathogenicity of oomycetes, relevant literature addresses oomycete
response to fertility (Canaday and Schmitthenner, 2010; Dirks et al., 1980; Pacumbaba et
al., 1997).
Oomycete pathogens of soybean include Pythium and Phytophthora spp. These
pathogens are favored by cool and wet conditions, though their oospores may survive in
the soil for many years. Infection occurs when zoospores encyst on and germinate into
germinating seeds, seedlings, and young field roots resulting in pre- and post-emergence
damping-off. Soybean pathogenic Phytophthora species include Ph. sojae and Ph.
sansomeana. The Pythium genus includes a much larger number of soybean pathogenic
species. These Pythium species are largely either opportunistic or weakly pathogenic
necrotrophs, and they are often pioneer colonizers. Most Pythium species are considered
generalists due to their wide host range (for example, P. ultimum has 719 documented
hosts) but some species are restricted to certain taxa (for example, P. graminicola and P.
arrhenomaneson are only known to infect Poaceae) (Ellis, 2011; Farr and Rossman,
2012; Schroeder et al., 2013).
Individual fields often contain several different species of Pythium, with varying
levels of virulence on specific hosts. Several species of Pythium are pathogenic to both
corn and soybean, making management difficult (Broders et al., 2009a; Dorrance et al.
2004). Though there are many species known to occur in Ohio, Pythium irregulare is
one of the most widespread species in the state with very high levels of pathogenicity
(Ellis, 2011; Ellis et al. 2012).
8
Table 1.1. Thirty eight species of Pythium and three species of Phytophthora are known to infect soybean. Species found in Ohio are noted. In 2008, Kirk Broders determined the relative pathogenicity for twelve of the most common isolates found in Ohio, and the OSU Soybean Pathology lab is currently working to update this information (Broders, 2008).
Pythium species Susceptible hosta Found in Ohiob
Citation
P. aphanidermatum soybean *Yes Broders, 2008; Rizvi and Yang, 1996 P. arrhenomanes corn and soybean *Yes Lipps and Deep, 1991; Rao et al., 1978; Broders’ excel sheet P. attranthericium corn and soybean *Yes Broders, 2008 P. catenulatum soybean Yes Dorrance et al., 2004 P. conidiophorum soybean? *Yes OSU Soybean Pathology 2015 diagnostic excel sheet P. debaryanum soybean Minnesota Brown and Kennedy, 1965 P. delawarii soybean *Yes Broders et al., 2009b P. dissotocum soybean and corn *Yes Rao et al., 1978; Lipps and Deep, 1991 P. echinulatum corn and soybean Yes Broders, 2008 P. graminicola corn and soybean *Yes Lipps and Deep, 1991; Rao et al., 1978; Broders’ excel sheet P. helicoides soybean *Yes Broders, 2008 P. heterothallicum soybean *Yes Broders’ excel sheet and OSU Soybean Pathology 2015
diagnostic excel sheet P. hypogynum corn and soybean *Yes Broders, 2008 P. inflatum corn and soybean *Yes Broders, 2008 P. irregulare soybean *Yes Dorrance et al., 2004; Rizvi and Yang, 1996 P. longandrum corn and soybean *Yes Broders, 2008 P. middletonii soybean *Yes Broders, 2008 P. myriotylum soybean Iowa McCarter and Littrell, 1970; Rizvi and Yang, 1996 P. nunn soybean *Yes Broders’ excel sheet and OSU Soybean Pathology 2015
diagnostic excel sheet P. oligandrum soybean *Yes Broders, 2008 P. oopapillum soybean *Yes OSU Soybean Pathology 2015 diagnostic excel sheet P. orthogonon soybean *Yes Broders, 2008 P. paroecandrum soybean *Yes Dorrance et al., 2004 P. parvum soybean *Yes Broders, 2008 P. perplexum soybean *Yes Broders, 2008 P. pleroticum soybean *Yes Broders, 2008 P. rostratifingens soybean? *Yes OSU Soybean Pathology 2015 diagnostic excel sheet P. schmitthenneri corn and soybean *Yes Ellis et al., 2012; OSU Soybean Pathology 2015 diagnostic
excel sheet P. selbyi corn and soybean *Yes OSU Soybean Pathology 2015 diagnostic excel sheet P. splendens corn and soybean *Yes Dorrance et al., 2004 P. sylvaticum soybean *Yes Rizvi and Yang, 1996 P. terrestris corn Yes Rao et al., 1978 P. torulosum corn and soybean *Yes Dorrance et al., 2004; Lipps and Deep, 1991; Rao et al., 1978;
Zhang et al., 1998; Zhang and Yang, 2000 P. ultimum corn and soybean *Yes Griffin, 1990; Lipps and Deep, 1991; Rao et al., 1978; Rizvi
and Yang, 1996; Zhang et al., 1998; Zhang and Yang, 2000 P. ultimum var. ultimum
soybean *Yes Rizvi and Yang, 1996
P. ultimum var. sporangiferum
soybean *Yes Rizvi and Yang, 1996
P. vanterpoolii soybean *Yes Broders, 2008 P. vexans soybean *Yes OSU Soybean Pathology 2015 diagnostic excel sheet Phytophthora sojae soybean *Yes Kaufmann and Gerdemann, 1958; Rizvi and Yang, 1996 Ph. medicaginis soybean *Yes Broders’ excel sheet Ph. sansomeana soybean and corn *Yes Dorrance et al., 2004; Zelaya-Molina et al., 2010 aHosts with a question mark indicate isolates were recovered from soybean fields but pathogenicity could not be confirmed. bAn asterisk in the Ohio column indicates the species was found by the OSU Soybean Pathology lab.
9
Traditionally, Pythium species were described morphologically based on sexual
and asexual structures produced in water cultures containing grass blades. Specifically,
the shape of the sporangia, antheridia, and ornamentation of oogonia were considered.
The compilation of Pythium morphological information created by Van der Plaats-
Niterink in 1981 is still considered to be the most complete monograph (Middleton, 1943;
Van der Plaats-Niterink, 1981; Waterhouse, 1968), though many new species have been
added since (Broders et al., 2009b).
The combination of genetic sequence information along with morphological
observation is the recommended approach when identifying Pythium to a species level.
Molecular identification based on amplification and sequencing of the internal
transcribed spacer (ITS) of rDNA. A fairly comprehensive list of primers designed from
this region that are species specific for Pythium species is reported (Schroeder et al.,
2013; White et al., 1990). However, in some species, ITS information alone is not
sufficient due to low divergence between species. Additional loci include the ribosomal
large subunit (LSU) or nuclear encoded β-tubulin of the rDNA (Levesque and De Cock,
2004; Moralejo et al., 2008; Villa et al., 2006) the mitochondrially-encoded cytochrome
oxidase 1 (cox1) or NADH dehydrogenase subunit 1 (nad1) (Martin, 2000; Moralejo et
al., 2008; Villa et al., 2006).
Fusarium species are diverse and widely distributed. Though the genus is
collectively known to infect many hosts, only some species may infect soybean. Of those
species, only a subset is pathogenic. In soybean, pathogenic species cause seed and
seedling disease, Fusarium wilt (F. oxysporum), or sudden death syndrome (F.
10
virguliforme) (Aoki et al., 2003; Armstrong and Armstrong, 1950; Broders et al., 2007b;
Nelson, 1999; Rizvi and Yang, 1996; Schlub et al., 1981) (Table 1.2).
Root rot caused by Fusarium species is common in the United States (Yang and
Feng, 2001). Symptoms of root rot include poor or slow emergence, dark brown lesions
on the root system (especially the lower portion), and decay of the tap root (Arias et al.,
2013b). Root rot is most often caused by F. oxysporum and F. solani (Arias et al., 2013a;
Leslie et al., 1990; Nelson, 1999). Seed and seedling disease is often the result of a
combination of Fusarium species with other soil borne pathogens including oomycetes
(Broders et al., 2007b; Dunleavy, 1961; Schlub et al., 1981). However, some studies
suggest Fusarium species are secondary colonizers (Rizvi & Yang, 1996). Datnoff and
Sinclair (Datnoff & Sinclair, 1988) found F. oxysporum and Rhozoctonia solani were
usually associated in the infection of soybean roots in Illlinois. At least 18 Fusarium
species were isolated from soybean roots (Arias et al., 2013c; Bienapfl et al., 2010;
Bienapfl, 2011; Koning et al., 1995; Leslie et al., 1990; Nelson, 1999; Pioli et al., 2004).
Additional saprophytic Fusarium species often found on plant roots and in soil may
complicate the diagnostic process (Broders et al., 2007b). Broders (2008) found
Fusarium species were isolated from both healthy and diseased plants in approximately
equal frequency (Broders, 2008).
11
Table 1.2. The following species of Fusarium are known to infect soybean. Species found in Ohio are noted.
Fusarium species Susceptible hosta Known to be found in Ohio
Citation
F. acuminatum corn and soybean yes Bienapfl, 2011; Leslie et al., 1990; Rizvi and Yang, 1996
F. anthophilum soybean southern states Leslie et al., 1990 F. armeniacum soybean Arias et al. 2013a F. avenaceum soybean southern states Leslie et al., 1990 F. chlamydosporum soybean? Kansas Leslie et al., 1990 F. compactum soybean? Kansas Leslie et al., 1990 F. equiseti soybean yes Bienapfl, 2011; Leslie et al., 1990; Rizvi and
Yang, 1996 F. graminearum corn and soybean yes Bienapfl, 2011; Leslie et al., 1990 F. merismoides soybean? Kansas Leslie et al., 1990 F. moniliforme corn yes Leslie et al., 1990; Rao et al., 1978 F. nigrum soybean Mississippi Killebrew et al., 1993 F. oxysporum corn and soybean yes Bienapfl, 2011; Griffin, 1990; Leslie et al., 1990;
Rao et al., 1978; Rizvi and Yang, 1996 F. poae soybean Mississippi Killebrew et al., 1993 F. proliferatum corn and soybean yes Arias et al. 2013a; Bienapfl, 2011; Leslie et al.,
1990 F. pseudograminearum soybean Arias et al. 2013a F. redolens soybean Minnesota Arias et al. 2013a; Bienapfl, 2011 F. roseum corn yes Rao et al., 1978 F. semitectum (syn. F. pallidoroseum)
corn and soybean yes Killebrew et al., 1993; Leslie et al., 1990
F. solani corn and soybean yes Bienapfl, 2011; Griffin, 1990; Leslie et al., 1990 F. sporotrichioides soybean Iowa and
Minnesota Arias et al. 2013a; Bienapfl, 2011
F. subglutinans corn yes Bienapfl, 2011; Leslie et al., 1990 F. verticillioides soybean Minnesota Bienapfl, 2011 F. virguliforme soybean yes Gao et al., 2006; Gongora-Canul and Leandro,
2011b; O’Donnell et al., 1998; O’Donnell et al., 2010; Wang et al., 2015
aHosts with a question mark indicate isolates were recovered from soybean fields but pathogenicity could not be confirmed
12
Fusarium graminearum is an especially important seedling pathogen to consider
due to its relatively recent discovery in Ohio as a pathogen of soybean and ability to
produce harmful mycotoxins (Champeil et al., 2004; Pioli et al., 2004; Sella et al., 2014).
This pathogen may cause damping-off, crown rot, or root rot in soybean (Arias et al.,
2013b; Broders et al., 2007b; Pioli et al., 2004).
In contrast to seed and seedling diseases, sudden death syndrome (SDS) is caused
by a single species: Fusarium virguliforme (formerly Fusarium solani f. sp. glycines)
(Aoki et al., 2003). The disease was first reported in Ohio in 1995 and has become
increasingly common in the state ever since (Roy et al., 1997b). SDS poses a significant
threat to soybean yield and though average economic losses are quite significant, disease
severity on a small scale is highly variable. SDS is most likely to occur in fields have
been planted early, exposed to cool temperatures, contain soybean cyst nematode, have
compacted soil, or are heavily irrigated or poorly drained, as these are all factors that
contribute to disease (Roy et al., 1989).
Though infection occurs early in the season, characteristic foliar symptoms are
best seen later in the season, at the R6/R7 growth stage (Navi & Yang, 2008; Njiti et al.,
1997; Roy et al., 1997b). The soil borne pathogen is easily spread through soil
movement and overwinters as chlamydospores; structures that survive in the soil for
years. The pathogen may infect soybean as early as the seedling stage, occurring
approximately two weeks after emergence in the field (Gao et al., 2006). Infection
occurs in the roots and crowns of the seedlings. When the fungus colonizes the roots, a
toxin is produced. This toxin moves up to the leaves through the xylem and results in
13
characteristic foliar symptoms; small yellow interveinal spots on the upper leaves of the
plant that develop into brownish-tan lesions with a yellow halo that expand rapidly
between the veins until the leaflet becomes entirely necrotic (Roy et al., 1997b).
Identification of Fusarium species is similar in methodology to the identification
of oomycete species. Ideally, identification should be based on both morphological
characterizations and molecular sequences. Morphological observations should consider
the macroconidia and microconidia, production of mesoconidia, conidial arrangements,
nature of conidiogenous cells, conidiophore length, formation and arrangement of
chlamydospores, and production and color of sporodochia on carnation leaf agar (Arias et
al., 2013b). Observations should be compared with the system outlined by Leslie and
Summerell (2006) (Leslie et al., 2006). Colony appearance and pigment formation on
potato dextrose agar should also be considered (Arias et al., 2013b).
Molecular identification of Fusarium using conventional PCR is based on the
amplification of several different loci. Arias et al. (2013) amplified and sequenced the
elongation factor 1-α (EF1- α) gene region (Arias et al., 2013b). Primer pairs include
ef1/ef2 and ef1/ef22 (Geiser et al., 2004; O'Donnell et al., 1998). When further analyzing
isolates in the F. oxysporum species complex, Ellis et al. (2014) amplified the translation
elongation (tef1α) gene using the primers EF-1H and EF-2T (O'Donnell et al., 1998; Ellis
et al., 2014). In addition, the mitochondrial small subunit (mtSSU) was amplified using
the primers MS1 and MS2 (White et al., 1990). In order to target F. virguliforme,
Kolander et al. (2012) used the species-specific primers: Fsg1 and Fsg2 (Kolander et al.,
2012; Li & Hartman, 2003; Malvick & Bussey, 2008).
14
Soybean fields with SDS are often associated with soybean cyst nematode (SCN),
Heterodera glycines (Gao et al., 2006; Westphal & Xing, 2011). Though Fusarium
virguliforme can independently infect soybean, the pathogens are often found together.
The relationship between SCN infestation and SDS severity is controversial (Brzostowski
et al., 2014; Gao et al., 2006; Hartman et al., 2015b; Marburger et al., 2014; Roy et al.,
1989). Nematode root feeding weakens the plant and provides wounds for the fungus to
colonize, possibly making the plant more vulnerable (Roy et al., 1989). Fusarium
virguliforme was also found in and on SCN cysts, providing evidence that the pathogens
may travel between locations together (Lawrence et al., 1988).
Soybean cyst nematode has been found in all soybean production areas in Ohio
and may cause substantial yield loss (Niblack 2005). High population densities of SCN
may cause yellowing and stunting, though yield loss may result in asymptomatic fields.
SCN damage is usually most severe in light, sandy soils (Avendano et al., 2004). The
infectious juveniles (second-stage juveniles, or J2) enter the soybean roots and begin to
feed. Though both sexes feed within the roots, the vermiform males leave at the J4 stage
and migrate through the soil to fertilize females. Females develop a feeding site
(syncytium), swell into a white lemon-shaped cyst as eggs develop, and die. Their
melanized bodies continue to protect the developing eggs until environmental conditions
support the hatching of the J2 and subsequent infection (Niblack 2005).
Previous literature documenting the relationship between soil borne disease
development and the alteration of soil fertility levels is complex. However, several
studies have reported changes in incidence and severity of soil borne diseases with
15
increased fertility levels. Specifically, seedling diseases and SDS increased with excess
fertility (Canaday & Schmitthenner, 2010; Pacumbaba et al., 1997; Rupe et al., 2000;
Sanogo & Yang, 2001). Therefore, the effect of soil fertility on soybean pathogens is an
important topic of study.
Phosphorus: Significance and Known Disease Response
After nitrogen, phosphorus is most likely nutrient to limit plant growth (Havlin et
al., 2005). Soybean crops require a relatively large amount of phosphorus, especially as
pods set. The concentration of phosphorus in plants usually ranges from 0.1 to 0.5%
(Havlin et al., 2005). Though it has many roles in the plant, it is primarily associated
with energy transfer and protein metabolism (Datnoff et al., 2007). Specifically,
phosphorus forms phosphate groups that are bound to adenosine diphosphate (ADP) to
form adenosine triphosphate (ATP). The gain or loss of a phosphate group results in an
energy transfer; a process required of all metabolic functions (Havlin et al., 2005).
Phosphorus is also involved in electron transport in oxidation-reduction reactions and
forms the phosphate backbone of DNA and RNA. Phospholipids, coenzymes, and
phosphoproteins also require the element. The nutrient stimulates early plant growth and
hastens maturity (Datnoff et al., 2007). It is necessary for seed production and was found
to increase the number of pods per plant. Phosphorus is also associated with increased
root growth (Datnoff et al., 2007). It is required for nitrogen fixation by B. japonicum,
and application of phosphorus may increase the nitrogen-fixing ability of these bacteria
(Israel, 1987). Additional phosphorus is widely known to increase crop yields, especially
symptoms of phosphorus deficiency include overall stunting of the plant and slow growth
and some leaf cupping may occur. Because the nutrient is mobile, symptoms will first
appear in older leaves. These leaves will turn purple or bluish-green before becoming
chlorotic. Flowering and maturity may be delayed (Datnoff et al., 2007).
A clear association between balanced and adequate fertility and overall crop
health has been reported (Fageria & Baligar, 1997; Krupinsky et al., 2002). Although
highly specialized pathogens may attack vigorous plants, less specialized pathogens are
often only able to infect weak plants (Prabhu et al., 2007). Therefore, proper fertility
may improve physiological resistance by reducing overall plant stress (Fageria & Baligar,
1997; Krupinsky et al., 2002). Furthermore, higher levels of fungistatic substances
(including phenolic compounds and flavonoids in epidermal cells) are present in plants
with adequate fertility, likely due to overall increased vigor (Prabhu et al., 2007).
Though soilborne pathogens may be inhibited by these modified defense responses, it is
likely the only explanation for the altered disease incidence of airborne diseases (Prabhu
et al., 2007). An increased concentration of phosphorus in leaves was also found to be
associated with accelerated time to maturity, thus decreasing the likelihood of infection
by pathogens that attack young plants (Prabhu et al., 2007).
The effect of phosphorus on disease development is inconclusive and reportedly
complex (Datnoff et al., 2007; Prabhu et al., 2007). Phosphorus-specific research was
performed in both the greenhouse and field, sometimes with contradictory results (Prabhu
et al., 2007). It is important to note the effects of phosphorus are usually only seen in
17
cultivars moderately susceptible to a pathogen, as genetics seem to play a larger role in
susceptibility than phosphorus fertility (Datnoff et al., 2007; Prabhu et al., 2007).
Specific studies documenting the effect of phosphorus on soil borne pathogens for a
number of different hosts is outlined in Table 1.3.
18
Table 1.3. The addition of phosphorus affects soil borne disease development across a wide spectrum of hosts (Datnoff et al., 2007). Host Disease Pathogen P system:
deficient or excessa
Pathogen response to added phosphorusb
Citation
Cabbage Yellows Fusarium oxysporum f. sp. conglutinans
Gradient: .5x to 3x. x= recommended rate of application
Increased Walker and Hooker, 1945
Conifer Damping-off Fusarium oxysporum Excess Increased Sinclair et al. 1975
Cotton Root rot Phymatotrichum omnivorum
Not noted Increased Bell, 1989; McClellan and Stuart, 1947; Prabhu et al., 2007
Cotton Wilt Fusarium oxysporum f. sp. vasinfectum
Not noted Conflicting reports
Bell, 1989; Jones et al. 1989; Prabhu et al., 2007; Vanterpool, 1935
Cucumber Damping-off Rhizoctonia solani Not noted Decreased Prabhu et al., 2007
Gladiolus Yellows Fusarium oxysporum f. sp. gladioli
Gradient: 8ppm and 39ppm
Decreased McClellan and Stuart, 1947
Lentil Wilt Fusarium oxysporum f. sp. lentis
not noted Increased Kaushal and Sharma, 1998; Prabhu et al., 2007
Linseed Not specified Fusarium oxysporum Not noted Increased Ghorbani et al., 2008; Singh, 1999
Peas Damping-off Rhizoctonia solani Deficient Decreased Prabhu et al., 2007; Srihuttagum and Sivasithamparam, 1991
Potato Late blight Phytophthora infestans
Not noted Conflicting reports
Keinath, 1989; Prabhu et al., 2007
Soybean Root rot Rhizoctonia solani Not noted Decreased Castano and Kerkamp, 1956
Soybean Root rot Phytophthora sojae Gradient: 20 to 317 ppm
No effect Canaday and Schmitthenner, 2010
Soybean Root knot nematode
Melodogyne incognita Not noted Decreased Carling et al., 1989
Continued on next page
19
Table 1.3 continued
Host Disease Pathogen P system: deficient or excessa
Pathogen response to added phosphorusb
Citation
Spring wheat
Root rot Cochliobolus sativus Both: 0 and 15 kg/ha
Increased Goos et al., 1994
Tomato Wilt Fusarium oxysporum f. sp. lycopersici
Deficient and gradient: 8ppm and 39ppm
Conflicting reports
Förster et al., 1998; McClellan and Stuart, 1947; Woltz and Jones, 1973
Tomato Fusarium wilt Fusarium spp. Not noted Increased Woltz and Jones, 1973
Tomato and green peppers
Phytophthora root and crown rot
Phytophthora spp. Deficient Decreased Förster et al., 1998
Wheat Root rot Pythium spp. Not noted Decrease Huber, 1980
Wheat Root rot Helminthosporium sativum
both Conflicting reports exist
Brennan, 1995; Duffy et al., 1997; Goos et al., 1994; Graham and Menge, 1982; Huber, 1989
aThe study may or may not document whether fertilizers were applied to a deficient system or in excess. Levels of fertility were considered excess if they were above the respective recommendation. bIncrease= an increase in either disease incidence or severity; decrease= a decrease in either disease incidence or severity
20
In summary, although the relationship between phosphorus application and plant
disease is well studied, the literature represents the complexity of the topic. For example,
Canaday and Schmitthenner (2010) did not observe any disease response in soybean in
Ohio when phosphorus salts were added to soil naturally infested with Phytophthora
sojae. After phosphate salts were applied, the phosphorus concentration ranged from 0
ppm to 317 ppm, representing both a deficient system and system exposed to excess
phosphorus. Disease response was measured in germination rates, seedling emergence,
damping-off rates, and ratio of surviving seedlings with lesions. This study documented
an increase in disease incidence when potassium was added, which will be explained
further in the potassium section of this review (Canaday & Schmitthenner, 2010). In
contrast, Gladstone and Moorman (1989) reported a significant increase in the mortality
of geraniums infected with Pythium ultimum when ammonium phosphate was added in
excess levels. Dirks et al. (1980) also reported an increase in Phytophthora root rot
severity in soybean in the field due to increased levels of complete fertilizer (Dirks et al.,
1980).
21
Potassium: Significance and Known Disease Response
Potassium is likely to be the third most deficient nutrient after nitrogen and
phosphorus (Havlin et al., 2005). Potassium is absorbed in the largest quantity, after
nitrogen. It is a mobile nutrient in plants and concentrations range from 1 to 5%.
Potassium primarily functions to regulate solution ionic strength in cells. This is vital for
photosynthesis and metabolism, enzyme activation, translocation of assimilates, and
water regulation. Visual symptoms of deficiency include scorching or firing along leaf
margins, stunted growth and poor root system development, and weak stalks or stems.
The effect of potassium alone or in combination with phosphorus and/or nitrogen
has been documented for several pathogen groups in reviews (Datnoff et al., 2007).
Numerous studies reported there may be a greater pathogen response in deficient plants
supplied with adequate potassium than with adequately supplied plants fertilized with
excess potassium (Datnoff et al., 2007; Huber and Arny, 1985). Intuitively, this seems
logical, as stressed plants are generally more susceptible to disease. Unfortunately, fewer
studies have documented disease response to excess potassium. Collectively, these
studies are inconclusive and many have failed to consider the effects of other anion
concentrations and nutrient balance (Prabhu et al., 2007).
Interactions with other nutrients may play a major role in disease development.
For example, diseases caused by Pythium spp. were shown to decrease in severity with
the addition of potassium, but increase when high levels of nitrogen were present
(Warren et al., 1975). The form or type of fertilizer may also play a role, as the addition
of potassium in the form of KCl reduced sudden death syndrome of soybean while
22
KNO3, K2PO4, and K2SO4 increased the severity of the disease (Sanogo & Yang, 2001).
The incidence of soybean root rot caused by Phytophthora sojae increased with the
addition of KCl but decreased with the addition of complete (20-20-20) fertilizer
(Pacumbaba et al., 1997).
23
Table 1.4. In soybean, additional potassium differentially influenced disease development caused by soil borne pathogens, as summarized from (Datnoff et al., 2007). Disease Pathogen Pathogen response to added potassium Citation Phytophthora stem and root rot
Phytophthora sojae
Increased with added K Canaday and Schmitthenner, 2010
Phytophthora stem and root rot
Phytophthora sojae
Increased with added KCl, but decreased if complete N/P/K was added
Pacumbaba et al., 1997
Seedling disease
Increased Canaday and Mengistu, 2008
Soybean cyst nematode
Heterodera glycines
Increased with added K Luedders et al., 1979
Sudden death syndrome
Fusarium virguliforme
Sometimes decreased with added K, depending on when potassium chloride was applied
Nelson et al., 2010
Sudden death syndrome
Fusarium virguliforme
Inconsistent with added K, but apparently more susceptible in high fertility
Rupe et al., 2000
Sudden death syndrome
Fusarium virguliforme
Sometimes decreased with added K: high rates of Cl reduced incidence, severity, and root infection of SDS, but cultivar dependent
Howard et al., 1999
Sudden death syndrome
Fusarium virguliforme
Fertilizer form determined disease response: severity both increased and decreased depending on the form
Sanogo and Yang, 2001
24
Despite the abundance of literature documenting the relationship between
potassium application and disease development, continued research is necessary in the
context of soil borne soybean pathogens. Canaday and Schmitthenner (2010), Gladstone
and Moorman (1989), Pacumbaba et al. (1997), and Dirks et al. (1980) report the
incidence and severity of disease caused by oomycetes increases with the addition of
excess potassium. Because this is consistent with phosphorus response, information
regarding oomycete pathogens and identification of the species will not be repeated;
however, other studies suggest sudden death syndrome caused by Fusarium virguliforme
may also increase in incidence and severity with the addition of potassium (Rupe et al.,
2000; Sanogo & Yang, 2001).
In summary, the purpose of this study was to evaluate disease development in
soybean fertilized with excess levels of phosphorus and potassium growing in naturally
infested soil with high levels of inoculum and disease history. This research is important
for a number of reasons: (1) soil fertility recommendations for soybean have not been
changed in over 20 years, even though the yield has doubled and modern cultivars may
have slightly different nutrient demands that may require increased fertility levels; (2)
soil borne soybean pathogens have the potential to greatly reduce the stand count of
seedlings and year-end yield of the crop; (3) a properly balanced soil fertility
management strategy is essential for plant health and yield potential. However, the
relationship between soil fertility and pathogen response is not well understood. Though
conflicting reports exist regarding the significance and nature of this response, several
25
studies suggest disease incidence and severity will increase in response to excess fertility
(37,265,435 bu), and Phytophthora stem and root rot (32,224,121 bu). Therefore, a
review of the effect of increased fertility on these pathogens is essential.
28
Comparisons among studies which examined secondary effects of fertility on
plant diseases are often difficult due to variability in experimental designs, base fertility
levels, and environmental conditions. Studies differ in several ways 1) fertility in a
system may be considered deficient, adequate, or applied in excess 2) fertilizer may be
applied in a variety of forms possibly affecting salinity 3) if recorded, base fertility levels
are often in different units and may not be comparable despite unit conversion 4) base
levels (if recorded) rarely differentiate between available and total nutrient availability, as
not all forms are available for the plant to take up and 5) studies may be conducted with
inoculated or naturally infested soil in controlled or field conditions. The diversity of
these studies likely contributes to the diversity of results observed. It should be noted
that “excess fertility” indicates either fertilizer was applied at levels higher than
recommended by the state fertility recommendations or fertilizer was applied at levels
higher than what was considered appropriate by the authors of the respective study.
29
Figure 2.1. Studies which documented secondary effects of fertility on plant diseases were often difficult to compare due to variability in experimental designs, base fertility levels, and environmental conditions.
30
This mini review serves to compile, interpret, and synthesize previous literature
relevant to predicting the effect of soil fertility on soybean disease development.
Specifically, the review will focus on those studies which examined the effects of fertility
on the development of seedling disease and sudden death syndrome.
Influence of Phosphorus and Potassium on Seedling Disease of Soybean
Seedling disease incidence or severity was influenced by the addition of
phosphorus and potassium in several studies (Table 2.1). Collectively, these report
increased fertility levels in soybean fields affect and often enhance the development of
seedling diseases caused by oomycetes.
In a field study in Alabama where base fertility levels were considered adequate
in potassium and deficient in phosphorus, excess potassium treatments and both adequate
and excess phosphorus treatments were applied (Pacumbaba et al., 1997). Phosphorus
applied at excess levels in the form of superphosphate (0-46-0: CaH4P2O8) slightly
increased the incidence of Phytophthora from 7.4 to 9.4%. However, the addition of
potassium applied at excess levels in the form of muriate of potash (0-0-60: K2O)
increased the incidence of Phytophthora sojae significantly from 7.4 to 12.7%. Both
phosphorus and potassium applications, each at half rate of excess, decreased yield
significantly as compared with the application of complete fertilizer (20-20-20) (p<0.05).
Incidence of seedling disease increased with the application of excess potassium
in the form of KCl (Canaday & Schmitthenner, 2010). Field soil, naturally infested with
P. sojae, with adequate base levels of phosphorus and potassium was used in a growth
31
chamber study. Excess fertility was applied in the form of potassium salts (KCl, KNO2,
KNO3, K2SO4, KNO3, K2HPO4, KHCO3), potassium sulfate (K2SO4), and phosphorus
salts (Ca(H2PO4)2, K2HPO4, K2HPO4), each time without an effect on disease
development. However, when potassium chloride was added, the incidence of P. sojae
increased significantly (disease index of control= 12.5%; disease index of both rates of
KCl= 31.2%, 26.5%; p<0.05). The addition of chloride salts (NaCl, MgCl2, CaCl2,
AlCl3, FeCl2, FeCl3, SrCl2) consistently increased disease development while potassium
applied in other forms did not affect incidence. The authors proposed three confounding
factors: salinity stress, electrical conductivity, and calcium concentration.
In another study conducted in a soybean field in Canada, soil fertility applied at
excessive levels also increased seedling disease caused by P. sojae (Dirks et al., 1980).
Though base fertility levels were not noted, one type of complete fertilizer (8-32-16
NPK) was applied at the recommended rate for the area, and in excess levels (2 and 3
times the recommended rate). The incidence of root rot increased significantly as fertility
rates increased (p= 0.052). Plots with treatments of 0, 224, 448, and 672 kg/ha fertilizer
averaged 3.2, 23.0, 32.3, and 41.3% diseased plants respectively. The study also
evaluated disease incidence at varying distances from drainage and reported disease
incidence increased in poorly-drained areas. Within each fertility treatment, disease
incidence increased progressively as distance from drainage increased, but not
significantly at 672 kg/ha suggesting a drain distance x fertilizer interaction. Though
poorly drained soils increased disease incidence caused by P. sojae, disease levels in
plots with highly excessive fertility levels were too high to note any drainage response.
32
Although proper drainage reduces disease, proper fertility rates also play a major role in
disease development.
In contrast, (Sugimoto et al., 2007) found the application of 2.47 to 24.7 mM
potassium nitrate (KNO3) in combination with 0.1 to 10.2 mM calcium chloride (CaCl2)
significantly inhibited P. sojae infection in vitro. A previous study by the same authors
found the release of P. sojae zoospores was significantly decreased with the addition of 4
to 30 mM CaCl2, though a subsequent study found a concentration of 20 to 30 mM KNO3
decreased disease incidence without the application of calcium (Sugimoto et al., 2005;
Sugimoto et al., 2009). An external calcium source also played a role in P. sojae
development, specifically by stimulating direct germination of zoospores while in the
developing sporangia (Xu and Morris, 1998).
33
Table 2.1. Increased fertility levels enhanced seedling disease of soybean caused by oomycetes in three studies.
Study Pacumbaba et al. 1997 Canaday and Schmitthenner 2010 Dirks et al 1980 Base level phosphorus
25 ppm (measured before fertilizers were applied only during the first year)
Vickery: 74 kg/ha Hoytville: 76 kg/ha Van Wert: 75 kg/ha
not noted
Base level potassium
122 ppm (measured before fertilizers were applied only during the first year)
Vickery: 482 kg/ha Hoytville: 473 kg/ha Van Wert: 306 kg/ha
not noted
Soil chemistry
Decatur silty clay loam (Rhodic paleudult), base level of nitrogen (only measured first year): 45 ppm.
Five rates for each of four fertilizers: Fertilizers: complete (20-20-20), ammonium nitrate (34-0-0), superphosphate (0-46-0), muriate of potash (0-0-60) Rates: 0 kg/ha, 50 kg/ha, 100 kg/ha, 150 kg/ha, 200 kg/ha
-potassium salts applied at 150 to 400 µg of K/g soil -phosphorus salts at 20 to 317 µg P/g soil -A variety of sulfate salts, chloride salts, and ammonium salts at multiple rates
One fertilizer (8-32-16 NPK) applied at 3 rates: 224, 448, and 672 kg/ha
Base levels represented a deficient or adequate system before treatmenta
Deficient in phosphorus, adequate in potassium (Auburn University Soil Testing Laboratory recommended application of 101 kg/ha N, 67 kg/ha P, and 0 kg/ha K)
Vickery: adequate P, excess K Hoytville: adequate P, excess K Van Wert: adequate P and K
Unknown base levels, but complete fertilizer was applied at the recommended rate for the area (224 kg/ha), double the recommended rate (448 kg/ha), and triple the recommended rate (672 kg/ha)
Inoculated or natural
Natural Natural with P. sojae
Natural with P. sojae
Field or controlled conditions
Field (Alabama) Growth chamber Field (Ontario, Canada)
Continued on next page
34
Table 2.1 continued Study Pacumbaba et al. 1997 Canaday and Schmitthenner 2010 Dirks et al 1980 Disease response to fertilityb
-Plants fertilized with muriate of potash had higher incidence of PRSR and SMV, followed by plants fertilized with superphosphate. -Complete and superphosphate fertilizers lowered the incidence of SMV at application rates of 0-100kg/ha, then increased up to 200 kg/ha. -BBS incidence and SCN counts were not affected by either type or rate of fertilizer. -Application of any of the treatments reduced SSC incidence.
-Application of KCl at 150-400 µg of K per gram of dry soil increased the incidence of PRSR with Fulton soil. -Other potassium salts at 150 to 400 µg K, phosphorus salts at 20-317 µg P, and sulfate salts of K, Ca, Mg, Na, and Al at 491 µg of sulfate per gram of soil did not affect disease incidence. -Application of chloride salts of K, Na, Mg, Ca, NH4, Al, Fe, and Sr at 250 µg of Cl per gram of soil increased PRSR incidence. Disease was also increased at 304 µg Cl per gram of soil without extra flooding with water. -Application of ammonium salts also increased PRSR incidence.
-The incidence of root rot increased significantly as fertility rates increased (p= 0.0521). Plots with treatments of 0, 224, 448, and 672 kg/ha complete fertilizer (8-32-16 NPK) averaged 3.2, 23.0, 32.3, and 41.3% diseased plants respectively.
Notes -repeated every year for 3 years -fertilizers applied one week before planting -split plot design included two fertilizer application methods: broadcast and hand hoed
-To test salinity effect on plants: the addition of 450 µg Cl per gram of soil applied as NaCl to pasteurized, pathogen-free soil. Increased salinity did not effect germination, emergence, transpiration, height, and dry weight of plants. -The increase of PRSR incidence with the addition of KCl may be due to chloride.
-For all fertility treatments, disease incidence increased progressively as distance from drainage increased, but not significantly at 672 kg/ha. Therefore, there is a drain distance x fertilizer interaction suggesting drainage lowers disease incidence up to twice the recommended fertility rate while fertilizer applied at triple the rate negated drainage response.
aBase levels were considered deficient if they contained less nutrient than recommended by either respective author(s) or Tri-State Fertility Recommendations (Vitosh et al., 1995). If base levels were already within the recommended range, the system was considered adequately supplied and the application of treatments created a system treated with excess fertilizer. bDisease abbreviations include Phytophthora root and stem rot (PRSR), Soybean stem canker (SSC), Bacterial blight of soybean (BBS), Soybean mosaic virus (SMV), and soybean cyst nematode (SCN).
35
Influence of Soil Fertility on Sudden Death Syndrome of Soybean
The development of sudden death syndrome is dependent on cultivar, level of SCN,
and environment, among other factors (Arias et al., 2013a; Gongora-Canul et al., 2012).
Previous literature regarding the effect of soil fertility on SDS is complex and inconsistent,
as both phosphorus and potassium were shown to effect SDS development differently
under a variety of conditions. Several reoccurring themes are described below.
Adequate fertility enhances overall plant health and vigor and decreases SDS incidence
For a number of crops including soybean, a clear association between balanced and
adequate fertility and overall crop health has previously been reported (Fageria & Baligar,
1997; Krupinsky et al., 2002). Higher levels of fungistatic substances (including phenolic
compounds and flavonoids in epidermal cells) are present in plants with adequate fertility,
likely due to increased vigor (Prabhu et al., 2007). Therefore, proper fertility may improve
physiological resistance to a variety of pathogens by reducing overall plant stress (Fageria
& Baligar, 1997; Krupinsky et al., 2002).
In addition to improving overall health, increased fertility levels, specifically
phosphorus, were also shown to accelerate time to maturity (Prabhu et al., 2007). Because
soybean seedlings become less susceptible to infection by F. virguliforme with age
(Gongora-Canul & Leandro, 2011a; Wrather et al., 1995), additional fertility may reduce
disease development.
Cultivars play a larger role in SDS development than soil fertility
36
Cultivar selection played a larger role in SDS susceptibility than fertility treatment
in several studies (Datnoff et al., 2007; Prabhu et al., 2007; Sanogo & Yang, 2001).
Prabhu et al. (2007) reported the effect of phosphorus application (in both adequate and
excess rates) could be measured in moderately susceptible cultivars. Sudden death
syndrome developed inconsistently based on cultivar in multiple studies (Howard et al.,
1999; Rupe et al., 2000), suggesting genetics plays a larger role in susceptibility than soil
fertility (Datnoff et al., 2007; Prabhu et al., 2007). When Howard et al. (1999) used a
highly susceptible variety, significant yield differences occurred between varieties in 2 of 3
years, suggesting fertility affects may be seen differentially based on cultivar. Therefore,
breeding SDS-resistant cultivars remains an important, albeit difficult, management
strategy.
Soybean cyst nematode (SCN) may or may not be affected by soil fertility
Though Fusarium virguliforme can independently infect soybean, SCN and SDS
are often found in combination. The relationship between SCN infestation and SDS
severity is controversial (Brzostowski et al., 2014; Gao et al., 2006; Hartman et al., 2015b;
Marburger et al., 2014; Roy et al., 1989). Despite the status of the potential interaction, the
aforementioned studies all report fields are often infested with both pathogens. Therefore,
the effect of fertility on SCN populations may also influence SDS development and
warrants further investigation (Lawrence et al., 1988; Westphal & Xing, 2011).
Soybean cyst nematode populations decreased significantly (p= 0.01) as potassium
increased in a field study by Luedders et al. (1979). In this study, phosphorus levels were
37
high (over 100 ppm), potassium levels were low (25 to 30 ppm), and potassium was
applied incrementally to reach levels considered excessive (160 ppm) in a system with a
pH of 6.2 and CEC of 7.2. SCN populations were measured as cysts/100 g soil and
cysts/plant and both values decreased significantly as potassium applied in two forms
increased (p= 0.01) (Luedders et al., 1979). In a 7-year field study, Howard et al. (1998)
also reported SCN populations decreased as phosphorus and potassium rates increased
incrementally. In contrast, Rupe et al. (2000) reported an increase in SCN with increasing
KCl levels for some cultivars in a 2-year field study.
In addition to fertility rate, other factors may influence SCN population densities
including but not limited to fertilizer type (Pacumbaba et al., 1997), pH (Pedersen et al.,
2010; Tylka et al., 1998), tillage regime (Howard et al., 1998; Westphal et al., 2009), and
cultivar (Hanson et al., 1988). However, Niblack et al. (2006) stated temperature,
moisture, and host genetics have the greatest impact on SCN population density.
Type of fertilizer may affect SDS development
The type and source of fertilizer may play a major role in SDS development due to
nutrient interactions. Nutrients may be added in a variety of different forms (for example:
potassium chloride, potassium phosphate, potassium sulfate, etc.), and additional elements
within each compound may alter the soil chemistry in a way that effects pH, cation
exchange capacity, or other variables. The role of potassium and phosphorus in SDS
development should be examined in conjunction with other mineral elements.
38
Sanogo and Yang (2001) found fertilizer type affected sudden death syndrome
response in separate growth chamber and lab components. In growth chamber studies with
excess phosphorus and potassium base fertility levels, the addition of KNO3, K2PO4, and
K2SO4 increased SDS severity by 45%, 32%, and 43%, respectively, while the addition of
potassium in the form of KCl decreased the severity by 36% (Sanogo & Yang, 2001). The
dual effects of potassium and phosphorus amendments were studied on F. virguliforme
isolates on media. Mycelial linear growth was enhanced by potassium nitrate (15%),
potassium phosphate (22%), and sodium phosphate (25%), but not with potassium sulfate,
calcium phosphate, or potassium chloride (Sanogo & Yang, 2001). Colony area was
approximately 2.5 times greater in media with a pH of 8.2 than media with a pH of 5.7,
though germination of macroconidia was not affected (Sanogo & Yang, 2001). This study
suggested pH and salinity, in addition to nutrient source, may contribute to SDS disease
development. Howard et al. (1999) also reported a reduction in SDS incidence and
severity when relatively high rates of chloride were applied.
Fertility affects SDS development directly
Studies which evaluated the effect of fertilizer on the pathogen directly were
inconclusive (Datnoff et al., 2007; Hartman et al., 2015b; Howard et al., 1999). A field
study in Iowa showed no association between SDS severity and phosphorus or potassium
application (Scherm et al., 1998). Sudden death syndrome severity was also not
significantly different from the control when pre-plant potassium chloride was applied
(Nelson et al., 2010). Though SDS responded inconsistently to KCl applications in the
39
field, plants appeared more susceptible when potassium chloride was applied at 2240
kg/ha, levels considered excessive (Rupe et al., 2000).
Influence of Soil Fertility on other soybean pathogens
In addition to seedling diseases and sudden death syndrome, previous studies have
shown fertility may affect other diseases of soybean (Table 2.2) or related pathogens of
other hosts (Table 2.3) (Datnoff et al., 2007). Collectively, the literature reported a highly
variable disease response, likely due in part to equally diverse experimental designs.
40
Table 2.2. Previous literature reports several diseases of soybean are affected by soil fertility.
Pathogen Disease Nutrient Base levels represented a deficient or adequate system before treatmenta
Influence on Diseaseb Citation
Cercospora kikuchii
Purple seed stain
Potassium Not noted Decrease Camper and Lutz, 1977
Diaporthe sojae
Pod rot Potassium Not noted No effect Svec et al., 1976
Diaporthe sojae
Pod rot Potassium Varied by study
Decrease Camper and Lutz, 1977; Crittenden and Svec, 1974; Jeffers et al., 1982
Fusarium virguliforme
Sudden death syndrome
Potassium Not noted Sometimes decreased with added K, depended on when KCl was applied. Pre-plant did not reduce disease, application post-planting did
Nelson et al., 2010
Fusarium virguliforme
Sudden death syndrome
Potassium Deficient and adequate
Inconsistent with added K, but appeared more susceptible in high fertility
Rupe et al. 2000
Fusarium virguliforme
Sudden death syndrome
Potassium Deficient and adequate
sometimes decreased with added K: high rates of Cl reduced incidence, severity, and root infection of SDS, but cultivar dependent
Howard et al., 1999
Fusarium virguliforme
Sudden death syndrome
Potassium Deficient and adequate
Increased or decreased depending on potassium form
Sanogo and Yang, 2001
Heterodera glycines
Soybean cyst nematode
Potassium Adequate P, deficient K
Increased with added K
Luedders et al., 1979
Macrophomina phaseolina
Charcoal rot
Potassium Adequate for both P and K
No effect Canaday and Mengistu, 2007
Continued on next page
41
Table 2.2 continued Pathogen Disease Nutrient Base levels
represented a deficient or adequate system before treatmenta
Influence on Diseaseb Citation
Melodogyne incognita
Root knot nematode
Phosphorus Not noted Decreased Carling et al., 1989
Meloidogyne incognita
Root knot nematode
Potassium Not noted Increased Ismail and Saxena, 1977
Phytophthora sojae [sensu P. megasperma var. sojae]
Root rot Potassium Deficient in P, adequate in K
Increased Pacumbaba et al., 1997
Phytophthora sojae
Root rot Phosphorus and potassium
Deficient and adequate
Disease increased with added K, no effect of P
Canaday and Schmitthenner, 2010
Phytophthora sojae
Root rot Phosphorus and potassium
Deficient in P, adequate in K
Increased with added K, but decreased if complete N/P/K was added
Pacumbaba et al., 1997
Rhizoctonia solani
Root rot Phosphorus Not noted Decreased Castano and Kernkamp, 1956
Soybean Mosaic Virus
Soybean Mosaic Virus
Potassium Deficient in P, adequate in K
Increased Pacumbaba et al., 1997
aBase levels were considered deficient if they contained less nutrient than recommended by the respective author(s). If base levels were already within the recommended range, the system was considered adequately supplied and the application of treatments created a system treated with excess fertilizer. bInfluence may be represented in either influence, severity, or disease index (influence x severity).
42
Table 2.3. Soil fertility affects pathogens of other hosts closely related to those that may contribute to seedling disease or sudden death syndrome in soybean.
Host Pathogen Disease Nutrient Base levels represented a deficient or adequate system before treatmenta
Influence on Diseaseb
Citation
Conifer Fusarium oxysporum
Damping-off
Phosphorus Adequate Increased Sinclair et al., 1975
Cucumber Rhizoctonia solani
Damping-off
Phosphorus Not noted Decreased Prabhu et al., 2007
Geranium Pythium ultimum
Root rot Potassium Excess Increased Gladstone and Moorman, 1989
Linseed Fusarium oxysporum
Not specified Potassium Not noted Increased Ghorbani et al., 2008; Sing, 1999
Peas Rhizoctonia solani
Damping-off Phosphorus Deficient Decreased Prabhu et al., 2007; Srihuttagum and Sivasithamparam, 1991
Potato Phytophthora infestans
Late blight Phosphorus Not noted Conflicting reports
Keinath, 1989; Prabhu et al., 2007
Tomato and green peppers
Phytophthora spp.
Phytophthora root and crown rot
Phosphorus Deficient Decreased Förster et al., 1998
Wheat Pythium spp. Root rot Phosphorus Not noted Decreased Huber, 1980 aBase levels were considered deficient if they contained less nutrient than recommended by the respective author(s). If base levels were already within the recommended range, the system was considered adequately supplied and the application of treatments created a system treated with excess fertilizer. bInfluence may be represented in either influence, severity, or disease index (influence x severity).
43
Conclusion
Although the relationship between soil fertility and pathogen response is complex
and not well understood, fertility has been shown through a number of studies to have
secondary effects on soil borne pathogens. This review primarily focuses on work relevant
to soybean diseases, specifically seedling diseases and sudden death syndrome, though it
also introduces several studies of closely related pathogens that may provide additional
valuable insight. The wide diversity of experimental designs likely contributed to the
equally diverse findings. Collectively, these studies suggest soil fertility may significantly
impact disease development in soybean. Specifically, enhanced fertility may enhance
disease, especially for seedling diseases of soybean. However, pathogen response to
fertility is not well understood and warrants future research. In order to compare the
studies more effectively, future research should note base fertility levels, soil chemistry
(including pH, CEC, organic matter %, etc.), whether the fertilizer is applied to deficient or
adequate systems, fertilizer rate and form, and environmental conditions, among other
variables. Ideally, some continuity should exist between future experimental designs and
this review has outlined a structure of factors to consider when designing experiments. The
effect of soil fertility on pathogens causing disease is essential to consider before revising
fertility recommendations for any crop system.
44
Chapter 3: Effects of Increased Fertility on the Development of Seedling Diseases of Soybean
Introduction
Seedling disease has the potential to dramatically reduce soybean stand and is
consistently ranked one of the highest yield-reducing diseases (Bradley et al., 2015;
Koenning and Wrather, 2010). In 2014, seedling disease ranked third most-damaging in
the United States and caused a yield loss of 1,669,317 mt. Only soybean cyst nematode
and sudden death syndrome reduced yield more at 3,406,192 mt and 1,681,047 mt
respectively (Bradley et al., 2015).
Symptoms of seedling disease range from seed rot to damping-off and cause
reduced stand (Grau et al. 2004). If seed rot has not prevented germination entirely,
emerged seedlings may have lesions on the roots, hypocotyl, or cotyledons. Often, the
stem disintegrates at the base of the seedling, causing damping-off symptoms. Overall root
decay may cause the root to turn tan to dark brown, black, or brick red (Grau et al. 2004).
Root necrosis may reduce the number of lateral roots on older seedlings, reducing overall
nutrient and water uptake. Though infected plants may be scattered throughout the field,
infection is most common in areas with poor drainage (Dirks et al., 1980; Grau et al., 2004;
Yang, 1999).
45
Figure 3.1. Symptoms of Pythium or Phytophthora infection may include lesions on the root, stem, or hypocotyls resulting in damping-off or reduced stand.
Seedling disease may be caused by several species, either alone or in combination
(Grau et al., 2004a). It is often caused by a complex of species including Pythium spp.,
3.15). When plant weights were divided by stand, treatment means were only significant in
one assay (p= 0.019) (Table 3.16).
58
Table 3.2. P-values from Analysis of Variance (ANOVA) for stand and yield from a field study that evaluated the addition of phosphorus, potassium, and phosphorus plus potassiuma at 5 locations in Ohio with a history of seedling disease. P-values <0.05 were considered statistically significant, and values <0.15 were considered slightly significant. Van Wert
(2014) Van Wert (2015)
Defiance (2014)
Defiance (2015)
Wayne (2015)
Early stand emergencebc 0.876 0.236 0.930 0.357 0.229 Final stand emergencecd 0.559 0.772 0.189 0.634 0.078 Yield 0.486 0.679 0.183 0.967 0.680 aFertilizers were applied at planting at levels higher than recommended by the Tri-State Fertility Recommendations (Vitosh et al., 1995) in the form of 112 kg/ha DAP, 112 kg/ha potash, 112 kg/ha DAP and 112 kg/ha potash, and a nontreated control. bEarly stand counts were taken at the VC growth stage by counting the number of plants per 9 m row. Emergence was calculated by dividing stand count by seeds planted per row multiplied by 100 (seeding rate for all fields except Wayne: 26.2 seeds/m or 346,000 seeds/ha; Wayne seeding rate: 27.9 seeds/m or 368,000 seeds/ha). cP-values for percent emergence are equivalent to p-values for respective stand counts dFinal stand counts were taken at the R8 growth stage by counting the number of plants per 9 m row.
59
Table 3.3. Mean and standard deviation for stand and yield from a field study that evaluated the addition of phosphorus, potassium, and phosphorus plus potassiuma at Van Wert in 2014.
Treatment Early stand (plants/row)b
Early % emergencec
Final stand (plants/row)d
Final % emergencec
Yield (mt/ha)
Overall 156.8 65.3 155.1 64.6 3.60 (53.6 bu/A) P 158.8 ± 11.7 66.2 ± 4.9 158.0 ± 12.6 65.9 ± 5.3 3.56 ± 0.30 K 152.8 ± 6.5 63.7 ± 2.7 152.2 ± 8.3 63.4 ± 3.4 3.48 ± 0.27 P/K 158.2 ± 9.4 65.9 ± 3.9 160.0 ± 9.4 66.7 ± 3.9 3.71 ± 0.24 None 157.4 ± 17.1 65.6 ± 7.1 150.0 ± 14.3 62.5 ± 6.0 3.64 ± 0.33 P-value 0.876 0.876 0.559 0.559 0.486 LSD (0.05) ns ns ns ns ns aFertilizers were applied at planting at levels higher than recommended by the Tri-State Fertility Recommendations (Vitosh et al., 1995) in the form of 112 kg/ha DAP, 112 kg/ha potash, 112 kg/ha DAP and 112 kg/ha potash, and a nontreated control. bEarly stand counts were taken at the VC growth stage by counting the number of plants per 9 m row. cEmergence was calculated by dividing stand count by seeds planted per row multiplied by 100. The seeding rate was approximately 26.2 seeds/m or 346,000 seeds/ha. dFinal stand counts were taken at the R8 growth stage by counting the number of plants per 9 m row.
60
Table 3.4. Mean and standard deviation for stand and yield from a field study that evaluated the addition of phosphorus, potassium, and phosphorus plus potassiuma at Van Wert in 2015.
Treatment Early stand (plants/row)b
Early % emergencec
Plants with damping- off (plants/row)d
Final stand (plants/ row)e
Final % emergencec
Yield (mt/ha)
Overall 84.3 35.1 47.9 84.6 35.2 1.07 (16.0bu/A) P 89.3 ± 21.8 37.2 ± 9.1 40.0 b ± 26.8 90.0 ± 27.9 37.5 ± 11.6 1.09 ± 0.31 K 87.8 ± 25.2 36.6 ± 10.5 73.3 a ± 55.0 88.3 ± 28.8 36.8 ± 12.0 0.95 ± 0.24 P/K 76.7 ± 9.9 31.9 ± 4.1 41.7 b ± 38.7 78.3 ± 18.1 32.6 ± 7.5 1.09 ± 0.37 None 83.5 ± 17.5 34.8 ± 7.3 36.7 b ± 32.0 81.7 ± 26.8 34.0 ± 11.2 1.15 ± 0.24 P-value 0.236 0.236 0.041 0.772 0.772 0.679 LSD (0.05) ns ns 27.4 ns ns ns aFertilizers were applied at planting at levels higher than recommended by the Tri-State Fertility Recommendations (Vitosh et al., 1995) in the form of 112 kg/ha DAP, 112 kg/ha potash, 112 kg/ha DAP and 112 kg/ha potash, and a nontreated control. bEarly stand counts were taken at the VC growth stage by counting the number of plants per 9 m row. The seeding rate was approximately 346,000 seeds/ha. cEmergence was calculated by dividing stand count by seeds planted per row multiplied by 100. The seeding rate was approximately 26.2 seeds/m or 346,000 seeds/ha. dAt the VC stage, the number of seedlings affected by damping-off were counted for a 1.8 m section of the 9 m row and multiplied by 5 to estimate the number of plants per row. eFinal stand counts were taken at the R8 growth stage by counting the number of plants per 9 m row.
61
Figure 3.2. The number of seedlings with damping-off symptoms differed significantly among additional phosphorus, potassium, phosphorus and potassium, and control treatments at Van Wert in 2015 (p= 0.041, LSD (0.05)= 27.4). Error bars represent standard deviation for each treatment.
b
a
b
b
0
20
40
60
80
100
120
140
P K PK none
Plan
ts a
with
dam
ping
-off
sym
ptom
s(p
lant
s/30
' row
)
Number of Seedlings with Damping-off Symptoms at Van Wert in 2015
62
Table 3.5. Mean and standard deviation for stand and yield from a field study that evaluated the addition of phosphorus, potassium, and phosphorus plus potassiuma at Defiance in 2014.
Treatment Early stand (plants/row)b
Early % emergencec
Final stand (plants/row)d
Final % emergencec
Yield (mt/ha)
Overall 191.8 79.9 200.5 83.5 3.43 (51.1 bu/A) P 189.4 ± 14.5 78.9 ± 6.1 200.0 ± 7.1 83.3 ± 2.9 3.52 ± 0.30 K 192.6 ± 7.8 80.3 ± 3.3 192.0 ± 14.8 80.0 ± 6.2 3.42 ± 0.28 P/K 192.8 ± 8.8 80.3 ± 3.6 210.0 ± 12.2 87.5 ± 5.1 3.30 ± 0.28 None 192.4 ± 10.4 80.2 ± 4.3 200.0 ± 10.0 83.3 ± 4.2 3.50 ± 0.23 P-value 0.930 0.930 0.189 0.189 0.183 LSD (0.05) ns ns ns ns ns aFertilizers were applied at planting at levels higher than recommended by the Tri-State Fertility Recommendations (Vitosh et al., 1995) in the form of 112 kg/ha DAP, 112 kg/ha potash, 112 kg/ha DAP and 112 kg/ha potash, and a nontreated control. bEarly stand counts were taken at the VC growth stage by counting the number of plants per 9 m row. cEmergence was calculated by dividing stand count by seeds planted per row multiplied by 100. The seeding rate was approximately 26.2 seeds/m or 346,000 seeds/ha. dFinal stand counts were taken at the R8 growth stage by counting the number of plants per 9 m row.
63
Table 3.6. Mean and standard deviation for stand and yield from a field study that evaluated the addition of phosphorus, potassium, and phosphorus plus potassiuma at Defiance in 2015. Treatment Early stand
(plants/row)b Early % emergencec
Final stand (plants/row)d
Final % emergencec
Yield (mt/ha)
Overall 129.2 53.8 117.3 48.9 1.29 (19.2 bu/A) P 119.3 ± 15.8 49.7 ± 6.6 106.7 ± 29.4 44.4 ± 12.3 1.28 ± 0.32 K 130.7 ± 20.0 54.4 ± 8.3 125.0 ± 32.6 52.1 ± 13.6 1.26 ± 0.21 P/K 128.3 ± 20.5 53.5 ± 8.5 123.3 ± 54.3 51.4 ± 22.6 1.29 ± 0.19 None 138.5 ± 23.8 57.7 ± 9.9 114.2 ± 31.2 47.6 ± 13.0 1.33 ± 0.13 P-value 0.357 0.357 0.634 0.634 0.967 LSD (0.05) ns ns ns ns ns aFertilizers were applied at planting at levels higher than recommended by the Tri-State Fertility Recommendations (Vitosh et al., 1995) in the form of 112 kg/ha DAP, 112 kg/ha potash, 112 kg/ha DAP and 112 kg/ha potash, and a nontreated control. bEarly stand counts were taken at the VC growth stage by counting the number of plants per 9 m row. cEmergence was calculated by dividing stand count by seeds planted per row multiplied by 100. The seeding rate was approximately 26.2 seeds/m or 346,000 seeds/ha. dFinal stand counts were taken at the R8 growth stage by counting the number of plants per 9 m row.
64
Table 3.7. Mean and standard deviation for stand and yield from a field study that evaluated the addition of phosphorus, potassium, and phosphorus plus potassiuma at Wayneb in 2015.
Treatment Early stand (plants/row)c
Early % emergenced
Final stand (plants/row)e
Final % emergenced
Yield (mt/ha)
Overall 53.6 52.3 47.8 46.6 2.52 (37.5 bu/A) P 50.0 ± 8.9 48.9 ± 8.7 43.1 ± 6.6 42.1 ± 6.4 2.34 ± 0.48 K 67.5 ± 15.1 65.9 ± 14.8 63.7 ± 16.4 62.2 ± 16.0 2.63 ± 0.60 P/K 50.6 ± 20.8 49.4 ± 20.2 41.3 ± 13.3 40.2 ± 13.0 2.39 ± 0.09 None 46.3 ± 6.3 45.1 ± 6.1 43.1 ± 5.5 42.1 ± 5.4 2.70 ± 0.32 P-value 0.229 0.229 0.078 0.078 0.680 LSD (0.05) ns ns ns ns ns aFertilizers were applied at planting at levels higher than recommended by the Tri-State Fertility Recommendations (Vitosh et al., 1995) in the form of 112 kg/ha DAP, 112 kg/ha potash, 112 kg/ha DAP and 112 kg/ha potash, and a nontreated control. bThe 2015 Wayne Co. site was heavily infested with seedcorn maggot. cEarly stand counts were taken at the VC growth stage by counting the number of plants per 4.5 m row. dEmergence was calculated by dividing stand count by seeds planted per row multiplied by 100. The seeding rate was approximately 27.9 seeds/m or 368,000 seeds/ha. eFinal stand counts were taken at the R8 growth stage by counting the number of plants per 4.5 m row.
65
Table 3.8. The number of Pythium and Phytophthora isolates recovered from soybean roots collected at the VC growth stage from Defiance and Van Wert in 2015. Fields were treated with phosphorus, potassium, and phosphorus plus potassiuma in a study to determine fertility effect on the frequency and diversity of oomycete species recovered.
Defiance Van Wert P K P/K None P K P/K None
Total oomycetes 11 24 17 19 19 18 20 12 Species Pythium acanthicum 1 P. attranthericium 1 1 P. diclinum 1 P. dissotocum 4 1 1 1 1 1 P. helicoides 1 1 1 P. heterothallicum 1 1 P. inflatum 1 1 2 3 2 P. longandrum 1 P. lutarium 2 P. middletonii 3 2 1 P. oopapillum 2 2 1 P. pleroticum 1 P. torulosum 1 1 3 1 2 P. ultimum var. ult. 2 2 Ph. sansomeana 2 2 1 3 3 1 Ph. sojae 1 1 1 Total P. and Ph. isolates 6 10 9 8 11 7 12 6 Number of species 2 7 7 5 8 4 7 5 aFertilizers were applied at planting at levels higher than recommended by the Tri-State Fertility Recommendations (Vitosh et al., 1995) in the form of 112 kg/ha DAP, 112 kg/ha potash, 112 kg/ha DAP and 112 kg/ha potash, and a nontreated control.
66
Figure 3.3. Pythium and Phytophthora species were recovered from soybean roots collected at the VC growth stage from Defiance and Van Wert in 2015. Fields were treated with phosphorus, potassium, and phosphorus plus potassium in a study to determine the fertility effect on the frequency and diversity of oomycete species recovered.
0
2
4
6
8
10
12
14
Num
ber o
f sol
ates
col
lect
ed
Pythium and Phytophthora SpeciesRecovered by Field
Defiance
Van Wert
67
Figure 3.4. Pythium and Phytophthora species were recovered from soybean roots collected at the VC growth stage from Defiance and Van Wert in 2015. Fields were treated with phosphorus, potassium, and phosphorus plus potassium in a study to determine the fertility effect on the frequency and diversity of oomycete species recovered.
0
2
4
6
8
10
12
14
Num
ber o
f iso
late
s co
llect
ed
Pythium and Phytophthora Species Recovered by Treatment
none
PK
K
P
68
Figure 3.5. In a field study that evaluated the addition of phosphorus, potassium, and phosphorus plus potassium, isolates were recovered from soybean roots collected at the VC growth stage from a survey conducted in Defiance Co. in 2015. All recovered isolates were observed at 100 to 400x and samples containing oospores were characterized as oomycetes. Although identification through BLAST analysis of the ITS region was attempted for all oomycetes, only a subset were successfully sequenced and subsequently identified as Pythium or Phytophthora. The number of Pythium and Phytophthora species recovered from each treatment is also included.
0
5
10
15
20
25
30
P K P/K None
Num
ber o
f iso
late
s
Oomycete Isolates Recovered from Defiance
Oomycetes
Pythium and Phytophthoraisolates
Number of species
69
Figure 3.6. In a field study that evaluated the addition of phosphorus, potassium, and phosphorus plus potassium, isolates were recovered from soybean roots collected at the VC growth stage from a survey conducted in Van Wert Co. in 2015. All recovered isolates were observed at 100 to 400x and samples containing oospores were characterized as oomycetes. Although identification through BLAST analysis of the ITS region was attempted for all oomycetes, only a subset were successfully sequenced and subsequently identified as Pythium or Phytophthora. The number of Pythium and Phytophthora species recovered from each treatment is also included.
0
5
10
15
20
25
P K P/K None
Num
ber o
f Iso
late
s
Oomycete Isolates Recovered from Van Wert
Oomycetes
Pythium and Phytophthoraisolates
Number of species
70
Table 3.9. In a field study that evaluated the addition of phosphorus, potassium, and phosphorus plus potassiuma, isolates were recovered from soybean roots collected at the VC growth stage from a survey conducted in Defiance and Van Wert in 2015. Five symptomatic plants were selected from each plot (chosen arbitrarily if asymptomatic) and each were plated on both oomycete-selective media (PIBNC) and general growth promoting potato carrot agar (PCA) to provide 10 opportunities for isolate recovery. Pythium or Phytophthorab were recovered from the plots in the following frequencies.
Plot
Replicate
Treatment
Defiance Van Wert # of Pythium or Phytophthora
isolates recovered from
each plot
# of species
recovered from each
plot
# of Pythium or Phytophthora
isolates recovered from
each plot
# of species
recovered from
each plot 1 1 P 1/10 1 4/10 3 2 1 K 4/10 4 2/10 1 3 1 P/K 1/10 1 2/10 2 4 1 none 3/10 3 0/10 0 5 2 P/K 1/10 1 5/10 5 6 2 none 2/10 2 2/10 2 7 2 P 0/10 0 3/10 2 8 2 K 1/10 1 0/10 0 9 3 P 0/10 0 0/10 0 10 3 none 1/10 1 2/10 2 11 3 K 1/10 1 0/10 0 12 3 P/K 0/10 0 3/10 3 13 4 P 0/10 0 2/10 2 14 4 K 0/10 0 1/10 1 15 4 none 2/10 1 0/10 0 16 4 P/K 0/10 0 1/10 1 17 5 none 0/10 0 1/10 1 18 5 P/K 4/10 4 1/10 1 19 5 P 1/10 1 0/10 0 20 5 K 3/10 2 1/10 1 21 6 P 4/10 2 2/10 2 22 6 P/K 3/10 2 0/10 0 23 6 K 1/10 1 2/10 2 24 6 none 0/10 0 1/10 1 aFertilizers were applied at planting at levels higher than recommended by the Tri-State Fertility Recommendations (Vitosh et al., 1995) in the form of 112 kg/ha DAP, 112 kg/ha potash, 112 kg/ha DAP and 112 kg/ha potash, and a nontreated control. bSpecies were identified through BLAST analysis of the ITS region using the primers ITS1 (TCCGTAGGTGAACCTGCGG) and ITS4 (TCCTCCGCTTATTGATATGC) (White et al., 1990).
71
Table 3.10. P-values from Analysis of Variance (ANOVA) for stand, root ratings, and plant weights from a greenhouse study that evaluated the addition phosphorus, potassium, and phosphorus plus potassiuma to field soil collected from Defiance (Def) and Van Wert (VW), each with a history of seedling disease. Three trials were conducted with soil from each field. P-values <0.05 were considered statistically significant, and values <0.15 were considered slightly significant. Variable VW 1 VW 2 VW 3 Def 1 Def 2 Def 3 Stand 0.111 0.054 0.791 0.625 0.254 0.069 Root rot rating 0.092 0.045 0.778 0.403 0.111 0.320 Root weight 0.120 0.028 0.703 0.100 0.112 0.002 Root weight/stand 0.578 0.625 0.193 0.014 0.219 0.779 Plant weight 0.124 0.056 0.466 0.362 0.110 0.002 Plant weight/stand 0.571 0.371 0.376 0.019 0.361 0.363 aFertilizers were applied at planting at levels higher than recommended by the Tri-State Fertility Recommendations (Vitosh et al., 1995) in the form of 112 kg/ha DAP, 112 kg/ha potash, 112 kg/ha DAP and 112 kg/ha potash, and a nontreated control.
72
Table 3.11. Treatment means for stand from a greenhouse study that evaluated the addition of phosphorus, potassium, and phosphorus plus potassiuma to field soil collected from two fields with a known history of seedling disease. Fifteen seeds were planted in each 15 cm pot. Van Wert Defiance Treatment Trial 1 Trial 2 Trial 3 Trial 1 Trial 2 Trial 3 Steamed controlb
13.83 13.25 10.08 12.00 13.8 10.6
Overallc 8.40 0.44 0.94 8.60 2.23 1.96 P 6.92 0.42 ab 1.17 9.50 1.75 1.83 K 8.33 0.17 b 0.75 8.50 2.08 2.67 PK 9.83 0.25 b 0.83 8.25 3.17 0.83 none 8.5 0.91 a 1.00 8.17 1.92 2.50 p-value 0.111 0.054 0.791 0.625 0.254 0.069 LSD (0.05) ns 0.577 ns ns ns ns aFertilizers were applied at planting at levels higher than recommended by the Tri-State Fertility Recommendations (Vitosh et al., 1995) in the form of 112 kg/ha DAP, 112 kg/ha potash, 112 kg/ha DAP and 112 kg/ha potash, and a nontreated control. bSteamed soil control was used to check seed viability and greenhouse conditions. This treatment was not included in ANOVA analysis. cOverall means represent the average of treatments (P, K, PK, none) from the field soil.
73
Table 3.12. Treatment means for root rot ratings from a greenhouse study that evaluated the addition of phosphorus, potassium, and phosphorus plus potassiuma to field soil collected from two fields with a known history of seedling disease. Root rot was rated on a 1 to 5 scale where: 1= healthy roots with no symptoms on any part of root system; 2= 1-20% of root system had lesions on lateral roots; 3= 21-75% of roots had symptoms, some lesions on tap root; 4= 76-100% of roots had symptoms on lateral and tap roots; and 5= complete root rot, no germination of seed (Appendix H: Figure H.1).
Overallc 2.0 3.7 3.6 1.9 3.5 3.7 P 2.7 4.1 a 3.8 1.9 3.8 3.5 K 2.0 3.5 ab 3.5 1.8 3.3 3.7 PK 2.0 4.1 a 3.6 2.1 2.9 3.8 none 1.9 3.2 b 3.5 1.8 3.8 3.9 p-value 0.092 0.045 0.778 0.403 0.111 0.320 LSD (0.05) ns 0.758 ns ns ns ns aFertilizers were applied at planting at levels higher than recommended by the Tri-State Fertility Recommendations (Vitosh et al., 1995) in the form of 112 kg/ha DAP, 112 kg/ha potash, 112 kg/ha DAP and 112 kg/ha potash, and a nontreated control. bSteamed soil control was used to check seed viability and greenhouse conditions. This treatment was not included in ANOVA analysis. cOverall means represent the average of treatments (P, K, PK, none) from the field soil.
74
Table 3.13. Treatment means for root weights from a greenhouse study that evaluated the addition of phosphorus, potassium, and phosphorus plus potassiuma to field soil collected from two fields with a known history of seedling disease. Roots were cut at the crown and weights include all roots in the pot, regardless of stand. Van Wert Defiance Treatment Trial 1 Trial 2 Trial 3 Trial 1 Trial 2 Trial 3 Steamed controlb
6.53 g 12.36 g 4.66 g 4.48 g 10.8 g 6.32 g
Overallc 1.82 0.24 0.18 2.12 0.42 0.37 P 1.40 0.14 b 0.21 2.48 0.25 0.26 bc K 1.82 0.25 ab 0.16 2.15 0.45 0.45 ab PK 2.18 0.16 b 0.20 1.61 0.66 0.16 c none 1.90 0.43 a 0.14 2.23 0.33 0.67 a p-value 0.120 0.028 0.703 0.100 0.112 0.002 LSD (0.05) ns 0.203 ns ns ns 0.243 aFertilizers were applied at planting at levels higher than recommended by the Tri-State Fertility Recommendations (Vitosh et al., 1995) in the form of 112 kg/ha DAP, 112 kg/ha potash, 112 kg/ha DAP and 112 kg/ha potash, and a nontreated control. bSteamed soil control was used to check seed viability and greenhouse conditions. This treatment was not included in ANOVA analysis. cOverall means represent the average of treatments (P, K, PK, none) from the field soil.
75
Table 3.14. Treatment means for root weights per planta from a greenhouse study that evaluated the addition of phosphorus, potassium, and phosphorus plus potassiumb to field soil collected from two fields with a known history of seedling disease. Van Wert Defiance Treatment Trial 1 Trial 2 Trial 3 Trial 1 Trial 2 Trial 3 Steamed controlc
0.471 0.941 0.445 0.377 0.773 0.597
Overalld 0.211 0.339 0.115 0.242 0.186 0.143 P 0.197 0.213 0.119 0.251 a 0.130 0.136 K 0.212 0.400 0.138 0.255 a 0.220 0.149 PK 0.221 0.233 0.105 0.192 b 0.207 0.138 none 0.217 0.438 0.096 0.271 a 0.169 0.154 p-value 0.578 0.625 0.193 0.014 0.219 0.779 LSD (0.05) ns ns ns 0.050 ns ns aRoots were cut at the crown and root weight per plant (g/plant) was calculated as the sum weight of roots in a pot divided by the final plant stand. bFertilizers were applied at planting at levels higher than recommended by the Tri-State Fertility Recommendations (Vitosh et al., 1995) in the form of 112 kg/ha DAP, 112 kg/ha potash, 112 kg/ha DAP and 112 kg/ha potash, and a nontreated control. cSteamed soil control was used to check seed viability and greenhouse conditions. This treatment was not included in ANOVA analysis. dOverall means represent the average of treatments (P, K, PK, none) from the field soil.
76
Table 3.15. Treatment means for plant weights from a greenhouse study that evaluated the addition of phosphorus, potassium, and phosphorus plus potassiuma to field soil collected from two fields with a known history of seedling disease. Plant weight included the entirety of the plant, regardless of stand. Van Wert Defiance Treatment Trial 1 Trial 2 Trial 3 Trial 1 Trial 2 Trial 3 Steamed controlb
26.76 g 42.06 g 14.6 g 19.4 g 33.4 g 18.3 g
Overallc 11.09 1.47 1.27 11.8 2.30 2.50 P 9.00 0.80 b 1.46 13.2 1.43 1.75 bc K 11.02 1.42 ab 0.94 11.3 2.28 3.21 ab PK 13.23 1.13 b 1.90 10.1 3.62 1.04 c none 11.10 2.52 a 1.01 12.5 1.89 4.33 a p-value 0.124 0.056 0.466 0.362 0.110 0.002 LSD (0.05) ns 1.28 ns ns ns 1.51 aFertilizers were applied at planting at levels higher than recommended by the Tri-State Fertility Recommendations (Vitosh et al., 1995) in the form of 112 kg/ha DAP, 112 kg/ha potash, 112 kg/ha DAP and 112 kg/ha potash, and a nontreated control. bSteamed soil control was used to check seed viability and greenhouse conditions. This treatment was not included in ANOVA analysis. cOverall means represent the average of treatments (P, K, PK, none) from the field soil.
77
Table 3.16. Treatment means for weight per planta from a greenhouse study that evaluated the addition of phosphorus, potassium, and phosphorus plus potassiumb to field soil collected from two fields with a known history of seedling disease. Van Wert Defiance Treatment Trial 1 Trial 2 Trial 3 Trial 1 Trial 2 Trial 3 Steamed controlc
1.93 3.20 1.40 1.62 2.41 1.72
Overalld 1.29 1.99 0.796 1.35 0.976 0.930 P 1.26 1.24 0.769 1.34 ab 0.754 0.887 K 1.27 1.70 0.819 1.33 ab 1.01 0.981 PK 1.35 2.07 1.02 1.20 b 1.10 0.825 none 1.28 2.47 0.660 1.51 a 0.988 1.04 p-value 0.571 0.371 0.376 0.019 0.361 0.363 LSD (0.05) ns ns ns 0.190 ns ns aWeight per plant was calculated as the sum weight of whole plants in a pot divided by the final plant stand (g/plant). bFertilizers were applied at planting at levels higher than recommended by the Tri-State Fertility Recommendations (Vitosh et al., 1995) in the form of 112 kg/ha DAP, 112 kg/ha potash, 112 kg/ha DAP and 112 kg/ha potash, and a nontreated control. cSteamed soil control was used to check seed viability and greenhouse conditions. This treatment was not included in ANOVA analysis. dOverall means represent the average of treatments (P, K, PK, none) from the field soil.
78
Figure 3.7. The first replicate of trial 3 from both locations is pictured above. The steamed soil control represents plants from one pot. For all other treatments, plants from both pots for each treatment in the replicate are included.
79
Discussion
Seedling disease was observed in all field trials in 2014 and 2015. However,
excessive rains in 2015 caused severe flooding, especially at Van Wert, where standing
water was observed. This weather created exceptionally conducive field conditions for
pathogenic oomycetes and likely enhanced seedling disease. Fertility treatments did not
affect stand or yield at any the field sites, though flooding may have confounded results.
However, a significantly higher number of plants affected by damping-off were observed
with excess levels of potassium compared with the remaining treatments at one of the five
locations (Figure 3.2). It may be possible that excessive levels of potash lessens seedcorn
maggot infection, as a slightly significant trend occurred in which final stand for potassium
treated plots was higher than all other treatments (p= 0.078) (Table 3.7). Because seedcorn
maggot infection was underway during the initial stand count collection, it seems likely the
full effect of the decimation would best be seen in the final stand count. Barring the
exception of a serious seedcorn maggot infestation, these field studies did not provide
evidence that increased fertility levels enhanced yields (Table 3.2).
Sixteen Pythium and Phytophthora species were recovered from all treatments in a
field survey, confirming previous observations that a large number of Pythium and
Phytophthora species, rather than a few predominant species, are contributing to seedling
disease by causing seed rot and damping-off (Broders et al., 2007a; Dorrance et al., 2004;
Schmitthenner, 1970). Future field surveys should consider the differing methodology
between the soil baiting method used by Broders (2007a) and the VC growth stage root
80
isolation used in this study. More Ohio fields should be surveyed at the VC stage to better
understand which oomycete species are most relevant after emergence.
Though synergistic effects between species were documented by Mao et al. (1998),
this study did not investigate potential synergistic interactions. Instead, the survey
recorded species presence in each plot, occasionally recovering several oomycete species
from a single plot (Table 3.9). In addition to the oomycetes, several distinct morphological
groups were recovered from seedlings at both sites, including a high number of Fusarium
species (Appendix J).
When the study was repeated in the greenhouse with naturally infested soil
collected from both fields treated with the same fertility treatments, there were not any
clear and consistent differences among the treatments for stand, root rot ratings, or plant
weights (Table 3.10). However, the disease pressure in the infested soil and greenhouse
conditions may have been too severe to adequately measure these effects (Table 3.11).
Emergence was rarely over 50% and a high proportion of roots were observed to have
lesions in every trial. Because the soil was taken from the same fields used in the field
component of this study, a diverse population of oomycetes was already documented
(Figure 3.3). The high clay content likely contributed to low emergence as the fine
particles would create a very hard top layer for seedlings to penetrate. Pots were watered
twice daily and often a third time to prevent caking. Although soil composition may have
contributed to low emergence, the high number of root lesions suggested the primary cause
was disease pressure.
81
Naturally infested soil was rarely used in previous studies presumably to avoid
unpredictable disease pressure and interactions between species. However, Canaday and
Schmitthenner (2010) used field soil naturally infested with P. sojae in a study that
evaluated the effect of several types of fertilizers and salts. The study controlled for the
effect of salinity on seedlings by comparing treatment effect on seedlings with and without
disease pressure. Disease was suppressed in two independent trials with thorough steaming
of the infested soil and planting seed treated with metalaxyl. This design provided some
evidence that salinity may contribute to disease development. Future greenhouse assays
should consider similar designs to begin to tease apart other factors affecting soil chemistry
including, but not limited to, CEC, pH, and organic matter. Future work should also
consider using variable rates of fertilizer to better assess seedling disease response to
increasing rates of fertility.
Differences between greenhouse trials may be attributed to several factors including
greenhouse temperatures, time of year, and water regime. Greenhouse temperatures were
highly variable in trial 1 (19 to 27˚C) and trial 2 (13 to 36˚C) due to Selby greenhouse
repairs that were in progress throughout the course of this study (Appendix I: Table I.1).
Consequently, the third trial was carried out at the Williams greenhouse where
temperatures remained more consistent (17 to 18˚C). In addition to greenhouse conditions,
seasonal differences may have affected temperature ranges, as trial 1 was conducted in the
fall under relatively warmer temperatures while trials 2 and 3 were conducted in the winter
and early spring under relatively cooler temperatures. Trial 1 was also flooded 3 days after
planting. Mean values for all variables were roughly comparable between trials 2 and 3.
82
Cooler temperatures seemed to increase disease pressure more than flooding as lower
stand, more root rot, and lower root and plant weights were observed in trial 2 and 3 as
compared to trial 1. Between fields, soil from Defiance seemed to support slightly higher
plant weights and stand count than soil from Van Wert. Although greenhouse assays
provided some evidence that excessive levels of fertilizer may increase seedling disease by
reducing root weights, greenhouse conditions were too variable and disease pressure was
too severe to observe clear and consistent results.
This study provided some evidence of increased seedling disease when phosphorus,
potassium, or phosphorus and potassium were applied to the soil at 112 kg/ha DAP and 112
kg/ha potash, levels above what is recommended by the Tri-State Fertility
Recommendations at these two locations (Vitosh et al., 1995). Although excess fertility
affected neither stand nor yield at any of the five field sites (Table 3.2), a higher number of
seedlings affected by damping-off occurred in plots treated with excess potassium at Van
Wert (Figure 3.2). Furthermore, in both fields, excess fertility seemed to increase the
number of oomycetes, as more oomycete isolates were recovered from plots that had been
treated with fertilizer than in the nontreated control, supporting previous studies in which
seedling disease incidence and severity was enhanced by the addition of fertilizers
(Canaday & Schmitthenner, 2010; Dirks et al., 1980; Pacumbaba et al., 1997) (Figures 3.5
and 3.6), albeit conditions were highly favorable for seedling disease to occur with less
than 50% overall emergence.
In greenhouse assays there was a trend toward lower root weights in 2 of 3
experiments with the addition of excess fertility. Although this trend is worth continued
83
exploration, future work may be more productive if the focus is shifted from observing
differences in oomycete frequency among treatments to identifying all components of this
complex community, even those that are individually nonpathogenic, and working to better
understand how the complex as a whole responds to excess fertilizer (Broders et al., 2007a;
Castano & Kernkamp, 1956). Future investigation of oomycete response specifically
should involve inoculated steamed soil or vermiculite in greenhouse studies with more
consistent greenhouse temperature regulation. This study did not find any evidence of
enhanced yield response with increased fertility.
84
Chapter 4: Effects of Increased Fertility on the Development of Sudden Death Syndrome of Soybean
Introduction
Sudden death syndrome (SDS) poses a significant threat to soybean yield in many
areas of the Midwest. This disease is caused by the fungus Fusarium virguliforme
(formerly Fusarium solani f. sp. glycines) (Roy, 1997). Although its distribution is still
limited in Ohio, this soil borne fungus has continued to spread across the state since its first
detection in 1995 (Roy et al., 1997b). Yield loss associated with SDS may be severe
depending on initial levels of inoculum, timing of infection, subsequent weather conditions,
timing of defoliation, and level of soybean cyst nematode (SCN) in the field. In 2014, SDS
was estimated to cause a yield loss of 1,681,047 mt nationwide, second only to soybean
cyst nematode estimated to cause a 3,406,192 mt loss (Bradley et al., 2015).
Fusarium virguliforme is soil borne and may spread easily through movement of
soil. It overwinters as chlamydospores; structures that survive in the soil for years
(Kolander et al., 2012; Roy, 1997). The pathogen may infect soybean as early as the
seedling stage in the roots and crowns, occurring approximately 2 weeks after emergence
in the field (Gao et al., 2006). When the fungus colonizes the roots, toxins are produced
(Abeysekara & Bhattacharyya, 2014; Hartman et al., 2015b). This toxin moves through the
xylem up to the leaves and results in the characteristic foliar symptoms typically seen in the
middle pod-fill stages (Figure). If infected as a seedling, plants may exhibit foliar
symptoms as early as the V1 growth stage, but fade as the plant matures, only to reappear
85
later in the reproductive growth stages. Pod abortion may result and significantly decrease
yield (Roy et al., 1997b).
In addition to soybean, this pathogen can infect a number of other hosts. Fusarium
virguliforme may also cause root necrosis in alfalfa, pinto and navy beans, white and red
clover, pea, and Canadian milk vetch, and foliar symptoms in alfalfa and red clover
(Kolander et al., 2012). A significant reduction in biomass occurred when sugar beet and
canola were infected with the pathogen (Kolander et al., 2012). Asymptomatic hosts
include corn, wheat, rye grass, pigweed, and lambsquarters (Kolander et al., 2012). An
asymptomatic host supports fungal colonization, reproduction, and growth of survival
structures, without either visible symptoms or impact on yield.
Although soybean fields with SDS are often associated with soybean cyst nematode
(SCN), the relationship between SCN infestation and SDS severity is controversial
(Brzostowski et al., 2014; Gao et al., 2006; Hartman et al., 2015b; Marburger et al., 2014;
Roy et al., 1989). Fusarium virguliforme independently infects soybean; however,
nematode root feeding may make the plant more vulnerable, providing wounds for the
fungus to colonize (Roy et al., 1989). Fusarium virguliforme was found in and on SCN
cysts, providing evidence that the fungus may travel with the nematode between locations
(Lawrence et al., 1988), though Gao et al. (2006) found interactions were seldom
statistically significant.
SDS is most likely to occur in fields that have been planted into poorly drained or
compacted cool soils (<60 F) that contain SCN. Management practices include the use of
86
SDS and SCN resistant varieties, drainage improvement, the reduction of soil compaction,
later planting dates with fast germination, and proper SCN management.
Figure 4.1. The first symptoms of the disease appear as small yellow spots between the veins on the upper leaves of the plant. Spots merge as they increase in size, and develop into brownish-tan lesions with a bright yellow halo. These lesions continue to expand rapidly between the veins until the leaflet becomes entirely necrotic and leaflets drop, leaving the petiole still attached to the stem. A confident field diagnosis depends on the observation of all three symptoms: foliar symptoms, a white pith, and blue spores on the roots or crown.
87
Figure 4.2. Crowns of infected plants are usually decayed and discolored, often becoming necrotic. Characteristic blue-green spores of the fungus are sometimes visible on the tap root, especially in moist conditions after a rainfall.
The effect of fertility on SDS development is inconclusive, complex, and
contradictory (Datnoff et al., 2007). Some field studies suggest SDS severity may be
increased when exposed to high levels of potassium (Rupe et al., 2000). Other studies
suggest adequate fertility may enhance overall plant health and decrease incidence of SDS
(Fageria & Baligar, 1997; Huber & Arny, 1985; Krupinsky et al., 2002), cultivars may play
a larger role in SDS development than soil fertility (Howard et al., 1999; Prabhu et al.,
2007; Rupe et al., 2000; Sanogo & Yang, 2001), SCN may or may not be affected by
fertility (Luedders et al., 1979; Pacumbaba et al., 1997; Rupe et al., 2000), and the type of
fertilizer may affect SDS development (Howard et al., 1999; Sanogo & Yang, 2001). For a
more thorough review of these studies, see Chapter 2.
OSU Soybean Pathology Lab
88
The objective of this study was to evaluate the effects of higher than recommended
rates of phosphorus and potassium on the development of sudden death syndrome of
soybean. Our study included two approaches (i) stand and yield data were collected and
analyzed from Fusarium virguliforme infested fields where fertilizer was added and; (ii)
greenhouse experiments designed to replicate field studies were conducted with infested
field soil and identical fertility treatments.
Materials and Methods
Field Experiments
Two field sites located in Erie and Wood Counties, Ohio with a known history of
SDS and SCN were used in this study during 2014 and 2015, respectively. Four fertility
treatments were applied to the soil surface at planting, including 112 kg/ha diammonium
DAP plus 112 kg/ha potash, and a nontreated control (no fertilizer). It should be noted
these rates are higher than recommended by current recommendations and fertility levels
are thus referred to as being applied in excess. The study was arranged in a randomized
complete block design with 6 replications at each location. One cultivar was used for all
field studies, AGI 31R2Y2 3102N (Pond Seed Co., Scott, OH) which has SCN resistance
and no seed treatment. Prior to planting and fertilizer application, soil was collected from
each field and submitted to the Service Testing and Research (STAR) Laboratory
(OARDC, The Ohio State University, Wooster, OH) (Table 4.1). Soybean cyst nematode
populations were counted from pre and post-season soil sampling. Cysts were extracted
89
from 100 cm3 soil samples with a semiautomatic elutriator (Byrd et al., 1976) and ground
with a motorized pestle to release eggs which were counted under a dissecting microscope
(Faghihi and Ferris, 2000).
Stand data were collected at the VC/V1 and R6/R7 growth stage at all fields by
counting the number of plants in the second 9 m row of the 4-row plot. At the R5/6 stage,
foliar SDS symptoms were rated with the Southern Illinois University Carbondale (SIUC)
SDS scoring method (Schmidt, 2007) (Appendix F). The second and third row of each plot
were harvested for yield and adjusted for moisture content (standardized at 13.5%).
Greenhouse experiments
Soil was collected from Erie and Wood site on 4 November and 16 October 2015,
respectively, from the same locations used for field studies. Soil was collected from twelve
points divided between two areas of the field separated by approximately 30 m and at a
uniform depth of 15 to 20 cm. The soil from each area was used in independent
greenhouse studies representing trial 1 and trial 2. Soil was stored in 10 gallon plastic bins
and allowed to partially dry for 1 week, after which the bins were covered and stored at
room temperature. A soil grinder (Iler Improved, The Fen Machine Co., Cleveland, OH)
was used to grind clay clumps. Two soybean cyst nematode counts were measured and
averaged for each trial (Byrd et al., 1976; Niblack et al., 1993). Population densities for
the Erie trials were 437 and 287 eggs/100 cm3 soil respectively and 60 and 187 eggs/100
cm3 soil for Wood.
90
Five treatments consisted of fertility regimes calculated to match the rate applied in
the field, including 112 kg/ha DAP (18-46-0: 46% P2O5), 112 kg/ha potash (0-0-60: 60%
K2O), 112 kg/ha DAP plus 112 kg/ha potash, a control (no fertilizer), and a steamed
greenhouse soil mix (no fertilizer) as a check for seed viability and general greenhouse
conditions. Coffee filters were placed in the bottoms of 15 cm pots and then filled with
approximately 1.4 kg soil per pot, 2 pots per treatment and 6 replicates. The same cultivar
used in both field and greenhouse studies (AGI 31R2Y2 3102N). Twelve seeds were
planted in each pot and watered twice daily with deionized water. Greenhouse
temperatures were set to favor F. viruguliforme infection and disease development at 14 to
18˚C the first week followed by 20 to 22˚C; however, greenhouse renovations complicated
temperature regulation. Temperatures ranged from 18 to 32˚C in trial 1 and 15 to 41˚C
(Appendix I: Table I.2).
Treatments were arranged in a randomized complete block design. The
experiment was performed twice for both Erie and Wood, in November/December 2015
and February/March 2016.
Data were collected for 7 and 14 day stand and final stand at the V5 growth stage.
The heights of up to five plants were measured at the V4 stage and averaged (Appendix H:
Figure H.4). The plants were removed from the pots at the V5 growth stage, and the roots
gently washed under running tap water. The number of plants with symptomatic roots
were counted. Roots were considered symptomatic if dark brown lesions were visible on
the taproot after washing (Appendix H: Figure H.3). Fresh root and plant weights were
also collected.
91
Statistical analysis
All data were analyzed with Statistical Analysis Software (SAS, version 9.4).
Homogeneity of variance existed for all parameters investigated and analyses of variance
(ANOVA) were carried out for each field or greenhouse trial separately. Residual plots of
the data sets showed major assumptions were satisfied and thus ANOVA could be used
without prior transformations. Treatments were compared with the Fisher’s protected least
significant difference (LSD) test at p ≤ 0.05. For greenhouse trials, the steamed soil control
was removed from the analysis.
92
Table 4.1. Soil test resultsa from samples collected prior to planting from Ohio soybean fields with a known history of sudden death syndrome infested with Fusarium virguliforme. Soybean cyst nematode counts were taken pre-planting and post-harvest.
Soil Characteristics Erie (2014) Wood (2015) Colwood loam and
Bixler loamy fine sand Colwood fine sandy
loam Soil pH 7.1 6.4 Buffer pH 0 7.1 Organic Matter (%) 2.7 1.4 Phosphorus (m3-ppm) 83 37.2 Potassium (m3-ppm) 171 223.4 CEC 6.9 7.1 K Saturation (%) 5.3 6.9 Bray P1 (lbs/A) 71.2 na Bray P1 (ppm) 35.6 na Spring SCN counts (eggs/100cm3) 1696 205 Fall SCN counts (eggs/100cm3) 625 44 SCN Reproduction factor (RF)b 0.37 0.21 aSoil was tested in the Service Testing and Research (STAR) Laboratory through The Ohio State University. bSCN Reproductive factor (RF) was calculated using the formula: RF = Pf/Pi, where Pf = number of eggs and juveniles per 100 cm3 soil at harvest and Pi = number of eggs and juveniles per 100 cm3 soil at planting.
93
Results
Field Experiments
Sudden death syndrome developed at both field locations with similar indices
(incidence x severity). The treatment averages of the disease index for Erie and Wood
were 23.7 and 23.1 respectively. Though no treatment differences at Wood occurred, there
were significant differences at Erie (p= 0.052) (Figure 4.3). At Erie, the addition of
Soybean cyst nematode population counts averaged across treatments were
dramatically higher for both initial and final counts in Erie than Wood (Erie: Pi= 1696 eggs
and juveniles per 100 cm3 soil, Pf= 625, Wood Pi= 205, Wood Pf= 44) but not significantly
different among treatments (Tables 4.5 and 4.6). Although the SCN reproductive factor
was higher at Erie (0.506) than Wood (0.287), populations in both fields decreased with the
use of SCN resistant seed (Tables 4.5 and 4.6).
Greenhouse Experiments
In greenhouse assays with a steamed soil control and comparable fertility treatments
on field soil, lower stands and weights consistently occurred in the field soil compared with
the steamed soil control. Of the 12 seeds planted in each pot, stand in the steamed soil
control ranged from 6.4 to 11.0 while field soil treatment means were 3.2 and 1.5 for Erie
94
and 6.8 and 1.2 for Wood (Table 4.8). Although inconsistent greenhouse temperatures
were not ideal, high emergence in the steamed soil controls indicated conditions were
conducive for plant growth.
Distinct yellow spotting occurred in one of four greenhouse assays and was
primarily observed in pots treated with phosphorus (Figure 4.6). Root sections from all
treatments from the second trial of both Erie and Wood were plated on APDA-SA media
(acidified potato-dextrose agar amended with 100 mg/L streptomycin B sulfate and 2 mg/L
aureomycin) according to the method outlined in Roy et al., (1997a). Purple colonies were
observed on several plates indicating F. virguliforme isolates were recovered from the
plants in the greenhouse trials.
Treatment means for stand were significant in two assays (p= 0.014, p= 0.03854, p=
0.069) suggesting a possible trend in that phosphorus and potassium applied together may
decrease stand in soils naturally infested with F. virguliforme (Table 4.8). This trend was
supported by significantly shorter plants in pots treated with phosphorus plus potassium in
one of four assays (p= 0.017) (Table 4.9). Treatment means for corrected root weights
(root weight per plant) were significantly higher than nonamended controls in greenhouse
studies where phosphorus (Erie trial 2: p= 0.018), potassium (Wood trial 2: p= 0.022), and
phosphorus plus potassium (Wood trial 1: p= 0.0002) were added (Table 4.11). There was
not a consistent trend for plant weight and fertility application (Table 4.7).
95
Table 4.2. P-values from Analysis of Variance (ANOVA) for stand, soybean cyst nematode reproductive factor (RF), sudden death syndrome disease index, and yield from a field study that evaluated the addition of phosphorus, potassium, and phosphorus plus potassiuma at two locations in Ohio with a history of sudden death syndrome. Erie (2014) Wood (2015) Early % emergencebc 0.086 0.968 Final % emergencecd 0.051 0.390 SCN RFe 0.203 0.169 SDS disease indexf 0.052 0.887 Yield 0.020 0.041 aFertilizers were applied at planting at levels higher than recommended by the Tri-State Fertility Recommendations (Vitosh et al., 1995) in the form of 112 kg/ha DAP, 112 kg/ha potash, 112 kg/ha DAP and 112 kg/ha potash, and a nontreated control. bEarly stand counts were taken at the VC growth stage by counting the number of plants per 9 m row. Emergence was calculated by dividing stand count by seeds planted per row multiplied by 100. The seeding rate was approximately 26.2 seeds/m or 346,000 seeds/ha. cP-values for percent emergence are equivalent to p-values for respective stand counts dFinal stand counts were taken at the R8 growth stage. eRF indicates reproductive factor which is calculated using the formula: RF = Pf/Pi, where Pf = number of eggs and juveniles per 100 cm3 soil at harvest and Pi = number of eggs and juveniles per 100 cm3 soil at planting (Byrd et al., 1976; Niblack et al., 1993). fSDS disease index was calculated by multiplying incidence by severity using the SIUC SDS Scoring Method (Schmidt, 2007).
96
Table 4.3. Mean and standard deviation for stand, soybean cyst nematode reproductive factor (RF), sudden death syndrome disease index, and yield from a field study that evaluated the addition of phosphorus, potassium, and phosphorus plus potassiuma at Erie in 2014.
Treatment Early stand (plants/row)bc
Final stand (plants/row)cd
SCN RF (Pf /Pi)e
SDS disease indexf
Yield (mt/ha)
Overall 159.3 164.0 0.506 23.7 3.34 (49.8 bu/A) P 164.8 ± 7.3 170.8 a ± 9.5 0.778 ± 0.80 10.5 b ± 15.1 3.60 a ± 0.61 K 151.2 ± 8.2 162.8 ab ± 5.1 0.478 ± 0.46 13.3 b ± 15.1 3.17 b ± 0.76 P/K 162.5 ± 11.8 156.0 b ± 12.2 0.192 ± 0.12 23.3 ab ± 16.3 3.35 ab ± 0.60 None 160.8 ± 9.3 166.4 a ± 6.3 0.576 ± 0.55 47.5 a ± 36.4 3.25 b ± 0.64 P-value 0.086c 0.051c 0.203 0.052 0.020 LSD (0.05) ns 10.4 ns 28.1 0.27 aFertilizers were applied at planting at levels higher than recommended by the Tri-State Fertility Recommendations (Vitosh et al., 1995) in the form of 112 kg/ha DAP, 112 kg/ha potash, 112 kg/ha DAP and 112 kg/ha potash, and a nontreated control. bEarly stand counts were taken at the VC growth stage by counting the number of plants per 9 m row. cP-values for percent emergence are equivalent to p-values for respective stand counts. Emergence was calculated by dividing stand count by seeds planted per row multiplied by 100. The seeding rate was approximately 26.2 seeds/m or 346,000 seeds/ha. dFinal stand counts were taken at the R8 growth stage. eRF indicates reproductive factor which is calculated using the formula: RF = Pf/Pi, where Pf = number of eggs and juveniles per 100 cm3 soil at harvest and Pi = number of eggs and juveniles per 100 cm3 soil at planting (Byrd et al., 1976; Niblack et al., 1993). fSDS disease index was calculated by multiplying incidence by severity using the SIUC SDS Scoring Method (Schmidt, 2007).
97
Table 4.4. Mean and standard deviation for stand, soybean cyst nematode reproductive factor (RF), sudden death syndrome disease index, and yield from a field study that evaluated the addition of phosphorus, potassium, and phosphorus plus potassiuma at Wood in 2015.
Treatment Early stand (plants/row)bc
Final stand (plants/row)cd
SCN RF (Pf /Pi)e
SDS disease indexf
Yield (mt/ha)
Overall 163.5 184.8 0.287 23.1 3.56 (53.1 bu/A) P 165.2 ± 10.4 185.8 ± 16.6 0.152 ± 0.26 19.2 ± 8.0 3.89 a ± 0.23 K 163.4 ± 7.2 195.8 ± 23.5 0.168 ± 0.19 24.2 ± 19.6 3.38 b ± 0.28 P/K 161.8 ± 16.7 185.8 ± 16.6 0.646 ± 0.72 25.8 ± 18.6 3.65 ab ± 0.55 None 163.6 ± 5.3 171.7 ± 41.7 0.161 ± 0.21 23.3 ± 10.3 3.31 b ± 0.28 P-value 0.968c 0.390c 0.169 0.887 0.041 LSD (0.05) ns ns ns ns 0.42 aFertilizers were applied at planting at levels higher than recommended by the Tri-State Fertility Recommendations (Vitosh et al., 1995) in the form of 112 kg/ha DAP, 112 kg/ha potash, 112 kg/ha DAP and 112 kg/ha potash, and a nontreated control. aRF indicates Reproductive factor which is calculated using the formula: RF = Pf/Pi, where Pf = number of eggs and juveniles per 100 cm3 soil at harvest and Pi = number of eggs and juveniles per 100 cm3 soil at planting (Byrd et al., 1976; Niblack et al., 1993). bDisease index (incidence x severity) was calculated at the R6/R7 growth stage from ratings taken using the SIUC SDS Scoring Method (Schmidt, 2007). cP-values for stand are equivalent to respective p-values for percent emergence.
98
Figure 4.3. Disease index (incidence x severity) differed significantly among phosphorus, potassium, phosphorus and potassium, and control treatments at Erie in 2014 (p= 0.052, LSD (0.05)= 27.4) but not at Wood in 2015 (p= 0.887, LSD (0.05)= 18.6). Ratings were taken at the R6/R7 growth stage according to the SIUC SDS Scoring Method (Schmidt, 2007). Error bars represent standard deviation for each treatment within each location.
99
Figure 4.4. Yield differed significantly at both Fusarium virguliforme infested field sites among phosphorus, potassium, phosphorus and potassium, and control treatments (Erie: p= 0.020, LSD at 0.05= 4.0; Wood: p= 0.041, LSD at 0.05= 6.3). Error bars represent standard deviation for each treatment within each location.
100
Table 4.5. Mean and standard deviation for soybean cyst nematode counts and reproductive factor (RF) from a field study that evaluated the addition of phosphorus, potassium, and phosphorus plus potassiuma at Erie in 2014. An SCN-resistant seed variety was used (AGI 31R2Y2 3102N). Treatment Initial population (Pi)
(# eggs and juveniles per 100 cm3 soil )
Final population (Pf) (# eggs and juveniles
per 100 cm3 soil )
SCN RF (Pf /Pi)b
Overall 1696 625 0.506 P 1693 ± 1220 847 ± 741 0.778 ± 0.803 K 1777 ± 1380 607 ± 624 0.478 ± 0.461 P/K 1727 ± 925 360 ± 341 0.192 ± 0.120 None 1587 ± 1040 687 ± 635 0.576 ± 0.547 P-value 0.989 0.624 0.203 LSD (0.05) ns ns ns aFertilizers were applied at planting at levels higher than recommended by the Tri-State Fertility Recommendations (Vitosh et al., 1995) in the form of 112 kg/ha DAP, 112 kg/ha potash, 112 kg/ha DAP and 112 kg/ha potash, and a nontreated control. bRF indicates reproductive factor which is calculated using the formula: RF = Pf/Pi, where Pf = number of eggs and juveniles per 100 cm3 soil at harvest and Pi = number of eggs and juveniles per 100 cm3 soil at planting (Byrd et al., 1976; Niblack et al., 1993).
101
Table 4.6. Mean and standard deviation for soybean cyst nematode counts and reproductive factor (RF) from a field study that evaluated the addition of phosphorus, potassium, and phosphorus plus potassiuma at Wood in 2015. An SCN resistant seed variety was used (AGI 31R2Y2 3102N).
Treatment Initial population (Pi) (# eggs and juveniles
per 100 cm3 soil )
Final population (Pf) (# eggs and juveniles
per 100 cm3 soil )
SCN RF (Pf /Pi)b
Overall 205 43.9 0.287 P 273 ± 297 15.6 ± 17.7 0.152 ± 0.261 K 167 ± 85 44.4 ± 45.1 0.168 ± 0.192 P/K 187 ± 131 93.3 ± 88.8 0.646 ± 0.715 None 193 ± 211 22.2 ± 32.3 0.161 ± 0.211 P-value 0.807 0.062 0.169 LSD (0.05) ns ns ns aFertilizers were applied at planting at levels higher than recommended by the Tri-State Fertility Recommendations (Vitosh et al., 1995) in the form of 112 kg/ha DAP, 112 kg/ha potash, 112 kg/ha DAP and 112 kg/ha potash, and a nontreated control. bRF indicates reproductive factor which is calculated using the formula: RF = Pf/Pi, where Pf = number of eggs and juveniles per 100 cm3 soil at harvest and Pi = number of eggs and juveniles per 100 cm3 soil at planting (Byrd et al., 1976; Niblack et al., 1993).
102
Figure 4.5. Soybean cyst nematode population densities were counted before planting and after harvest at two locations with sudden death syndrome history and treated with additional phosphorus, potassium, and phosphorus plus potassium. An SCN resistant seed was used (AGI 31R2Y2 3102N). An Analysis of Variance revealed that treatments did not differ significantly at either time of year for both locations (Erie Pi p= 0.989; Wood Pi p= 0.807; Erie Pf p= 0.624; Wood Pf p= 0.062). The reproductive factor (Pf/Pi) was not significantly affected by fertility at either location (Erie p= 0.203; Wood p= 0.169). Error bars represent standard deviation for each treatment.
0
500
1000
1500
2000
2500
3000
3500
P K PK none
SCN
cou
nts
(# o
f egg
s and
juve
nile
s/10
0 cm
3so
il)
Treatment
Soybean Cyst Nematode Populations at Erie and Wood
Erie: Initial population (Pi)
Erie: Final population (Pf)
Wood: Initial population (Pi)
Wood: Final population (Pf)
103
Table 4.7. P-values from Analysis of Variance (ANOVA) for stand, average height, root weights, plant weights, and number of plants with diseased roots divided by stand from a greenhouse study that evaluated the addition of phosphorus, potassium, and phosphorus plus potassiuma to field soil collected from two fields with a history of sudden death syndrome. P-values <0.05 were considered statistically significant, and values <0.15 were considered slightly significant. Erie Wood
aFertilizers were applied at planting at levels higher than recommended by the Tri-State Fertility Recommendations (Vitosh et al., 1995) in the form of 112 kg/ha DAP, 112 kg/ha potash, 112 kg/ha DAP and 112 kg/ha potash, and a nontreated control.
104
Table 4.8. Mean and standard deviation for stand from a greenhouse study that evaluated the addition of phosphorus, potassium, and phosphorus plus potassiuma to field soil collected from two fields with a known history of sudden death syndrome. Twelve seeds were planted in each 15 cm pot.
Overallc 3.23 1.48 6.77 1.17 P 2.92 ± 1.31 1.58 a ± 0.79 6.58 ± 2.19 2.17 a ± 1.99 K 3.17 ± 1.64 1.92 a ± 1.24 7.25 ± 2.67 0.67 b ± 0.78 PK 4.00 ± 1.65 0.67 b ± 0.78 6.75 ± 2.45 0.75 b ± 0.87 none 2.83 ± 1.47 1.80 a ± 1.69 6.50 ± 2.35 1.10 ab ± 1.52 p-value 0.259 0.014 0.856 0.038 LSD (0.05) ns 0.882 ns 1.16 aFertilizers were applied at planting at levels higher than recommended by the Tri-State Fertility Recommendations (Vitosh et al., 1995) in the form of 112 kg/ha DAP, 112 kg/ha potash, 112 kg/ha DAP and 112 kg/ha potash, and a nontreated control. bSteamed soil control was used to check seed viability and greenhouse conditions. This treatment was not included in ANOVA analysis. cOverall means represent the average of treatments (P, K, PK, none) from the field soil.
105
Table 4.9. Mean and standard deviation for plant heights from a greenhouse study that evaluated the addition of phosphorus, potassium, and phosphorus plus potassiuma to field soil collected from two fields with a known history of sudden death syndrome. Heights were determined by averaging five plants. If fewer than five plants emerged, heights of all plants were averaged.
Overallc 7.68 7.57 9.21 9.83 P 7.04 ± 2.48 9.10 a ± 3.20 8.84 ± 1.44 11.30 ± 1.62 K 8.33 ± 1.57 8.23 a ± 2.69 9.19 ± 1.88 9.76 ± 3.00 PK 8.09 ± 1.10 4.57 b ± 4.84 9.58 ± 2.19 9.66 ± 2.50 none 7.27 ± 1.39 8.53 a ± 4.72 9.23 ± 2.08 8.13 ± 3.35 p-value 0.141 0.017 0.836 0.184 LSD (0.05) ns 3.05 ns ns aFertilizers were applied at planting at levels higher than recommended by the Tri-State Fertility Recommendations (Vitosh et al., 1995) in the form of 112 kg/ha DAP, 112 kg/ha potash, 112 kg/ha DAP and 112 kg/ha potash, and a nontreated control. bSteamed soil control was used to check seed viability and greenhouse conditions. This treatment was not included in ANOVA analysis. cOverall means represent the average of treatments (P, K, PK, none) from the field soil.
106
Table 4.10. Mean and standard deviation for fresh root weights from a greenhouse study that evaluated the addition of phosphorus, potassium, and phosphorus plus potassiuma to field soil collected from two fields with a known history of sudden death syndrome. Roots were cut at the crown and weights include all roots in the pot, regardless of stand. Erie Wood Treatment Trial 1 Trial 2 Trial 1 Trial 2 Steamed controlb
26.0 g 32.4 g 50.2 g 21.1 g
Overallc 3.70 5.23 5.63 5.11 P 3.40 ± 1.25 6.14 ± 2.30 4.63 b ± 1.68 7.41 a ± 1.50 K 3.51 ± 1.90 5.15 ± 2.41 5.55 b ± 1.63 5.42 ab ± 1.74 PK 4.38 ± 1.96 3.67 ± 1.37 7.39 a ± 1.97 3.81 b ± 2.82 none 3.46 ± 2.09 5.29 ± 2.85 4.93 b ± 1.37 3.23 b ± 2.90 p-value 0.483 0.368 0.0006 0.028 LSD (0.05) ns ns 1.32 2.86 aFertilizers were applied at planting at levels higher than recommended by the Tri-State Fertility Recommendations (Vitosh et al., 1995) in the form of 112 kg/ha DAP, 112 kg/ha potash, 112 kg/ha DAP and 112 kg/ha potash, and a nontreated control. bSteamed soil control was used to check seed viability and greenhouse conditions. This treatment was not included in ANOVA analysis. cOverall means represent the average of treatments (P, K, PK, none) from the field soil.
107
Table 4.11. Mean and standard deviation for fresh root weights per planta from a greenhouse study that evaluated the addition of phosphorus, potassium, and phosphorus plus potassiumb to field soil collected from two fields with a known history of sudden death syndrome.
Overalld 1.13 2.96 0.884 2.91 P 1.10 ± 0.41 3.72 a ± 0.96 0.718 b ± 0.211 2.68 ab ± 1.19 K 1.21 ± 0.24 2.65 b ± 0.76 0.824 b ± 0.276 4.25 a ± 1.35 PK 1.15 ± 0.43 2.83 ab ± 0.88 1.190 a ± 0.350 3.04 ab ± 2.10 none 1.07 ± 0.68 2.45 b ± 1.05 0.805 b ± 0.212 1.75 b ± 0.92 p-value 0.824 0.018 0.0002 0.022 LSD (0.05) ns 0.909 0.202 1.68 aRoots were cut at the crown and root weight per plant (g/plant) was calculated as the sum weight of roots in a pot divided by the final plant stand. bFertilizers were applied at planting at levels higher than recommended by the Tri-State Fertility Recommendations (Vitosh et al., 1995) in the form of 112 kg/ha DAP, 112 kg/ha potash, 112 kg/ha DAP and 112 kg/ha potash, and a nontreated control. cSteamed soil control was used to check seed viability and greenhouse conditions. This treatment was not included in ANOVA analysis. dOverall means represent the average of treatments (P, K, PK, none) from the field soil.
108
Table 4.12. Mean and standard deviation for plant weights from a greenhouse study that evaluated the addition of phosphorus, potassium, and phosphorus plus potassiuma to field soil collected from two fields with a known history of sudden death syndrome. Plant weight included the entirety of the plant, regardless of stand. Erie Wood Treatment Trial 1 Trial 2 Trial 1 Trial 2 Steamed controlb
62.5 g 75.4 g 109.3 g 53.6 g
Overallc 10.6 11.8 20.4 16.2 P 10.2 ± 2.9 13.5 ± 4.8 17.9 b ± 5.9 24.9 a ± 3.3 K 9.3 ± 5.3 11.6 ± 5.2 21.3 ab ± 5.9 15.5 b ± 5.2 PK 13.2 ± 5.3 9.8 ± 3.3 23.6 a ± 7.1 13.2 b ± 9.2 none 9.3 ± 5.1 11.0 ± 6.4 18.7 b ± 5.6 8.8 b ± 7.5 p-value 0.160 0.679 0.087 0.005 LSD (0.05) ns ns 4.9 8.4 aFertilizers were applied at planting at levels higher than recommended by the Tri-State Fertility Recommendations (Vitosh et al., 1995) in the form of 112 kg/ha DAP, 112 kg/ha potash, 112 kg/ha DAP and 112 kg/ha potash, and a nontreated control. bSteamed soil control was used to check seed viability and greenhouse conditions. This treatment was not included in ANOVA analysis. cOverall means represent the average of treatments (P, K, PK, none) from the field soil.
109
Table 4.13. Mean and standard deviation for weights per planta from a greenhouse study that evaluated the addition of phosphorus, potassium, and phosphorus plus potassiumb to field soil collected from two fields with a known history of sudden death syndrome. Erie Wood Treatment Trial 1 Trial 2 Trial 1 Trial 2 Steamed controlc
7.21 7.15 9.89 7.99
Overalld 3.10 6.68 3.10 9.14 P 3.27 ± 0.72 8.18 a ± 1.86 2.75 b ± 0.40 8.89 ab ± 3.30 K 2.96 ± 1.24 5.96 bc ± 1.59 3.06 b ± 0.49 12.07 a ± 3.47 PK 3.37 ± 0.73 7.53 ab ± 1.77 3.64 a ± 0.55 10.56 a ± 6.70 none 2.84 ± 1.44 4.97 c ± 1.55 2.96 b ± 0.42 4.88 b ± 2.46 p-value 0.532 0.0009 0.0002 0.017 LSD (0.05) ns 1.69 0.377 4.96 aWeight per plant was calculated as the sum weight of whole plants in a pot divided by the final plant stand (g/plant). bFertilizers were applied at planting at levels higher than recommended by the Tri-State Fertility Recommendations (Vitosh et al., 1995) in the form of 112 kg/ha DAP, 112 kg/ha potash, 112 kg/ha DAP and 112 kg/ha potash, and a nontreated control. cSteamed soil control was used to check seed viability and greenhouse conditions. This treatment was not included in ANOVA analysis. dOverall means represent the average of treatments (P, K, PK, none) from the field soil.
110
Table 4.14. Mean and standard deviation for the number of plants with diseased roots divided by the number of plants per pot from a greenhouse study that evaluated the addition of phosphorus, potassium, and phosphorus plus potassiuma to field soil collected from two fields with a known history of sudden death syndrome. Within each pot, the number of plants with diseased roots was counted and divided by stand. Roots were considered diseased if they appeared darker in color than the steamed soil control for the respective replicate (Appendix H: Figure H.3).
Overallc 0.97 2.79 0.926 0.317 P 1.00 ± 0.01 1.87 ± 0.83 0.951 ± 0.08 0.298 b ± 0.045 K 0.94 ± 0.20 2.16 ± 1.13 0.872 ± 0.15 0.350 a ± 0.036 PK 0.98 ± 0.06 2.79 ± 1.00 0.956 ± 0.10 0.278 b ± 0.060 none 0.95 ± 0.15 4.93 ± 8.34 0.925 ± 0.11 0.354 a ± 0.041 p-value 0.652 0.502 0.284 0.006 LSD (0.05) ns ns ns 0.048 aFertilizers were applied at planting at levels higher than recommended by the Tri-State Fertility Recommendations (Vitosh et al., 1995) in the form of 112 kg/ha DAP, 112 kg/ha potash, 112 kg/ha DAP and 112 kg/ha potash, and a nontreated control. bSteamed soil control was used to check seed viability and greenhouse conditions. This treatment was not included in ANOVA analysis. cOverall means represent the average of treatments (P, K, PK, none) from the field soil.
111
Figure 4.6. Distinct yellow spotting occurred primarily in pots treated with phosphorus in one of four assays (Wood trial 2).
Figure 4.7. Distinct yellow spotting occurred in one of four assays. Though each treatment was represented in 12 pots, not all pots germinated.
0
2
4
6
8
10
12
Steamed soil Field control P K PK
Pots
Treatment
Foliar Symptoms Occured in Some Treatments in Wood Trial 2
Asymptomatic
Foliar symptoms
112
Discussion
The addition of phosphorus and potassium applied separately significantly reduced
disease index for sudden death syndrome at Erie in 2014 (p= 0.052), but this trend was not
repeated the following year at Wood (p= 0.887). Although the average disease index for all
treatments was remarkably similar between fields (Erie= 23.7, Wood= 23.1), several
factors may have contributed to the significance detected only at Erie.
First, the base fertility levels were different. Base fertility levels were considered
adequate at both fields before fertility treatments were applied (Vitosh et al., 1995), but the
Erie site had a lower base level of potassium (measured in both m3-ppm and percent
saturation) than the Wood site (Table 4.1). This may have contributed to the significant
reduction of SDS observed when potassium was added to the Erie field. Several studies
suggested there may be a greater pathogen response in deficient plants supplied with
adequate fertility than adequately supplied plants exposed to fertility applied at levels
higher than recommended (Fageria & Baligar, 1997; Huber & Arny, 1985; Krupinsky et
al., 2002).
A more thorough exploration of pathogen response to specific variables such as soil
pH, buffer pH, organic matter %, and CEC may provide additional insight necessary to
understand interactions between the pathogens and their environment on a deeper level.
Though soil chemistry renders the environment complex, facets of the system might
become clearer with further study, as Canaday and Schmitthenner (2010) did to tease apart
salinity effect. Ultimately, this information may be used to update management strategies.
113
In addition to differences in base fertility levels between fields, SCN population
densities also differed. Population densities were higher, with a higher reproductive factor,
at Erie compared with Wood (RF at Erie: 0.506, RF at Wood: 0.287). This may have
contributed to the disease pressure of F. virguliforme at Erie. SCN and SDS are often
found together (Roy et al., 1989), though Gao et al. (2006) found interaction between the
pathogens was rarely significant. There were no significant differences in initial population
densities, final population densities, and reproduction factor between fertility treatments at
both field sites, suggesting excess fertility did not affect SCN population, supporting
research by Pacumbaba et al., (1997) but contradicting the study by Luedders et al., (1979)
reporting that SCN levels decreased as potassium increased. The effects of high and low
SCN on SDS development in fields treated with excess fertilizer should be investigated
further. Base levels of F. viguliforme were not recorded thus SDS/SCN interactions can
only be speculated so far. Future field studies might consider quantifying SDS infection by
F. virguliforme DNA extraction from roots (Weems et al., 2015), to better understand how
much is present in the fields, as this plays a role in determining the severity of the disease
and possible interactions with SCN.
In the presence of SCN and SDS, phosphorus and phosphorus plus potassium
applied at excess levels enhanced yield. However, these results should be kept in
perspective. A larger survey of more than two fields throughout the state over several
years is necessary to assess the consequences of excess fertility on yields at fields with a
history of SDS/SCN. Future work investigating SDS response to fertility should prioritize
114
fields with high SCN populations and investigate the potential for phosphorus to mitigate
some yield loss.
Greenhouse studies did not clearly nor consistently support field results. However,
corrected fresh root weights (root weight per plant) were significantly higher than
population densities, soybean yields, and soil pH. Journal of Nematology 30, 519-
520.
United Soybean Board, 2015. Think Soy: Resourceful, Reliable, Responsible. Retrieved
from <http://soynewuses.org/wp-content/uploads/52724_1_SoyProductsGuide-
2015_LR.pdf> on 1 June 2016.
Van der Plaats-Niterink AJ, 1981. Monograph of the genus Pythium. Centraalbureau voor
Schimmelcultures Baarn.
134
Vanterpool T, 1935. Studies on browning root rot of cereals: III. Phosphorus-nitrogen
relations of infested fields IV. Effects of fertilizer amendments V. Preliminary plant
analyses. Canadian Journal of Research 13, 220-250.
Villa NO, Kageyama K, Asano T, Suga H, 2006. Phylogenetic relationships of Pythium
and Phytophthora species based on ITS rDNA, cytochrome oxidase II and beta-
tubulin gene sequences. Mycologia 98, 410-422.
Vitosh M, Johnson J, Mengel D, 1995. Tri-state Fertilizer Recommendations for Corn,
Soybeans, Wheat and Alfalfa. Retrieved from
<https://www.extension.purdue.edu/extmedia/ AY/AY-9-32.pdf> on 1 June, 2016.
Walker J, Hooker W, 1945. Plant nutrition in relation to disease development. I. Cabbage
yellows. American Journal of Botany, 314-320.
Wang J, Jacobs JL, Byrne JM, Chilvers MI, 2015. Improved diagnoses and quantification
of Fusarium virguliforme, causal agent of soybean sudden death syndrome.
Phytopathology 105, 378-387.
Warren H, Huber D, Nelson D, Mann O, 1975. Stalk rot incidence and yield of corn as
affected by inhibiting nitrification of fall-applied ammonium. Agronomy Journal
67, 655-660.
Waterhouse GM, 1968. Monograph of the genus Pythium. Mycologie 21, 1-242.
Weems J, Haudenshield J, Bond J, Hartman G, Ames K, Bradley C, 2015. Effect of
fungicide seed treatments on Fusarium virguliforme infection of soybean and
development of sudden death syndrome. Canadian Journal of Plant Pathology 37,
435-447.
135
Wei L, Xue AG, Cober ER, Babcock C, Zhang J, Zhang S, Li W, Wu J, Liu L, 2010.
Pathogenicity of Pythium species causing seed rot and damping-off in soybean
under controlled conditions. Phytoprotection 91, 3-10.
Westphal A, Xing L, Pillsbury R, Vyn T, 2009. Effect of tillage intensity on population
densities of Heterodera glycines in intensive soybean production systems. Field
Crops Research 113, 218-226.
Westphal A, Xing L, 2011. Soil suppressiveness against the disease complex of the
Soybean cyst nematode and sudden death syndrome of soybean. Phytopathology
101, 878-886.
White TJ, Bruns T, Lee S, Taylor J, 1990. Amplification and direct sequencing of fungal
ribosomal RNA genes for phylogenetics. In: PCR protocols: a guide to methods and
applications. Academic Press, Inc. 315-322. Retrieved from
<https://nature.berkeley.edu/brunslab/papers/white1990.pdf> on 1 June, 2016.
Wilcox JR, 2001. Sixty years of improvement in publicly developed elite soybean lines.
Crop Science 41, 1711-1716.
Wilcox JR, 2004. World Distribution and Trade of Soybean. In: Soybeans: Improvement,
Production, and Uses. eds: Boerma HR and Specht JE. Madison, Wisconsin, USA:
American Society of Agronomy, Inc., Crop Science Society of America, Inc., Soil
Science Society of America, Inc., 1-14.
Woltz S, Jones JP, 1973. Tomato Fusarium wilt control by adjustments in soil fertility.
Proceedings of Florida State Horticultural Society, 157-159.
136
Wrather J, Kendig S, Anand S, Niblack T, Smith G, 1995. Effects of tillage, cultivar, and
planting date on percentage of soybean leaves with symptoms of sudden death
syndrome. Plant Disease 79, 560-562.
Xu, Chang; Morris, Paul F. 1998. External calcium controls the developmental strategy
of Phytophthora sojae cysts. Mycologia, 269-275.
Yang X, 1999. Pythium damping-off and root rot. In: Compendium of soybean diseases.
4th ed. APS Press, St. Paul, MN, 42-44.
Yang X, Feng F, 2001. Ranges and diversity of soybean fungal diseases in North
America. Phytopathology 91, 769-775.
Zelaya-Molina LX, Ortega MA, Dorrance AE, 2011. Easy and efficient protocol for
oomycete DNA extraction suitable for population genetic analysis. Biotechnology
Letters 33, 715-720.
Zelaya-Molina L, Ellis M, Berry S, Dorrance AE, 2010. First report of Phytophthora
sansomeana causing wilting and stunting on corn in Ohio. Plant Disease 94, 125.
Zhang B, Chen W, Yang X, 1998. Occurrence of Pythium species in long-term maize and
soybean monoculture and maize/soybean rotation. Mycological Research 102,
1450-1452.
Zhang B, Yang X, 2000. Pathogenicity of Pythium populations from corn-soybean
rotation fields. Plant Disease 84, 94-99.
137
Appendix A: Soil Regions of Ohio
Figure A.1. Soil regions are characterized by the names of the soil series that are most common in each region (Division of Soil and Water Conservation, 2005).
138
Appendix B: Media
Table B.1. Several types of media were used in this study. Though each type of media may be used in a variety of ways, the primary function for its use in this study is listed below. Media Purpose Potato Carrot Agar (PCA)
General growth promoter for oomycetes and fungi
PIBNC Oomycete-selecting media. Sample from plant or previous plate should be placed under this media using sterile technique. Bacteria, fungi, etc. is limited to growth below the media and oomycetes will grow through the agar to the surface.
Water Agar (WA) Nutrient-poor media. Used when obtaining single spore colonies of Fusarium.
Carnation Leaf Agar (CLA)
This is the standard media used when observing morphologic characteristics of Fusarium spores. Place dried, sterile piece of carnation leaf on water agar at the time colonies are transferred.
Acidified Potato Dextrose Agar (APDA)
Used to promote mycelial growth while limiting bacterial contamination. When this media is inoculated with Fusarium and placed under fluorescent lights, the fungi may become pigmented. This color may be used to aide diagnostic purposes.
Amended APDA (APDA-SA)
Media used when isolating Fusarium virguliforme (the cause of sudden Death Syndrome in soybean) from the plant. Place under fluorescent lights and plates containing F. virguliforme will appear blue/purple after 2 weeks (Roy et al., 1997a).
NASH Fusarium-selecting media (Arias et al., 2013b). V8 broth Nutrient broth used when growing oomycetes for identification.
Approximately 5 days after inoculation with an oomycete isolate, the mycelium is vacuumed and ground with liquid nitrogen for DNA extraction.
Potato Dextrose Broth (PDB)
Fusarium may be stored long term in 1 mL PDB at 4˚C (Arias et al., 2013b).
Fusarium nutrient broth
Nutrient broth used when growing Fusarium for identification. Approximately 5 days after inoculation with a Fusarium isolate, the mycelium is vacuumed and ground with liquid nitrogen for DNA extraction (Ellis et al., 2014).
139
Sampling for Oomycetes
Figure B.1. Though this chart may be used to guide oomycete recovery, alternative methodology may also be successful.
140
Sampling for Fusarium
Figure B.2. Though this chart may be used to guide Fusarium recovery, alternative methodology may also be successful.
141
Appendix C: Isolate identification through DNA sequencing
Overview of process:
1. Obtain clean isolates approximately 5 days old.
2. Transfer approximately ten 5 mm plugs to V8 broth and grow for several days until mycelium covers about two-thirds of the surface (isolates later identified as Pythium may reach desired size around 4-5 days while Phytophthora isolates may require about 7).
3. Vacuum mycelium, grind in liquid nitrogen, and add extraction buffer.
4. Extract DNA.
5. Run a 1.5% gel to visualize bands, ensuring DNA was successfully extracted.
6. Nanodrop extracted DNA and dilute to 50 ng/µL.
7. Run PCR under program titled “ITS_DNA”
8. Run a 2% gel to visualize bands, ensuring PCR worked.
9. Clean PCR products with Exozap.
10. Nanodrop (no more than 1.5 µL because there should only be 14 µL product). Dilute to 50 ng/µL. (Though the MCIC directions call for a concentration of 5 ng/µL, Damitha always recommended 50 ng/µL. On occasion, sequences failed and adding an even higher concentration of product has solved the issue in the past.)
11. Prepare for sequencing by adding 3 µL of primer (concentration: 1 µM) to 6 µL of post enzyme cleanup product. Each sample will be submitted twice: once with the forward primer and once with the reverse. Submit to MCIC and include email attachment.
12. Prepare sequence output from MCIC by assembling contigs in CodonCode. Perform BLAST analysis through the NCBI database.
142
Appendix D: Digestion and Extraction Buffers
Pythium/Phytophthora/Fusarium Digestion Buffer: (from Zelaya-Molina et al. 2011 and Ellis et al. 2014) Buffer: 10 mM Tris/HCl pH 8.0, 50 mM EDTA, 0.5% SDS, 0.5% Triton X-100, 0.5% Tween 20 (Procedure for making stock solutions of the following components is described below.) 25 mL of 1 M EDTA (or 50 mL of 0.5 M EDTA) 5 mL of 1 M Tris-HCl 2.5 mL of 100% Triton X-100 (Stored on top chemical shelf in lab 116 above water bath to left of sink) 2.5 mL of 100% Tween 20 (Stored on top chemical shelf in lab 116 above water bath to left of sink) 25 mL of 10% SDS solution Mix above components in sterile d. water and bring up to 500 mL by adding additional sterile d. water. Do NOT autoclave. Preparing stock solutions for this buffer: 1 M Tris-HCl [pH=8]:
1. Dissolve 12.11 g Tris in approximately 30 mL d. water (Note: Tris is stored in bucket below counter under pH meter in lab 116)
2. Titrate solution with 1 M HCl until pH=8 3. Bring to volume of 100 mL by adding d. water 4. Autoclave to sterilize 5. Store at 4˚C
1 M EDTA: 1. Dissolve 29.22 g in 100 mL d. water and stir vigorously. (Note: EDTA is found on
chemical shelf in lab 116 near Dextrose. EDTA is also known as “Ethylenediaminetetraacetic acid 99%”). May need to adjust pH to dissolve.
2. Autoclave to sterilize 3. Store at room temperature
Note: Probably best to make 0.5 M so it will dissolve easier.
(Continued on next page)
143
10% SDS: 1. Add 10g SDS to 80 mL sterile distilled water, bring up to 100 mL in volumetric
flask by adding sterile d. water. (Note: SDS is stored on top chemical shelf in lab 116 above water bath to left of sink)
2. Do NOT autoclave. 3. Store at room temperature
Fusarium Elution Buffer: (from Ellis et al. 2014)
(Note: stock solution preparation for the following components is described in the Fusarium Digestion Buffer procedure) Add 100 µL of 1 M Tris-HCl [pH=8] and 20 µL of 0.5 M EDTA into sterile 10 mL volumetric flask and raise to 10 mL by adding sterile d. water.
144
Appendix E. Field Notes
A
B Photographs for Soybean Pathology (OSU)
Figure E.1. Standing water was recorded at the Van Wert field site. A) Picture taken 12 June, 2015 after approximately 1.7 in. of rain in 30 min. B) Picture taken 26 June, 2015.
145
Figure E.2. A) Seedcorn maggot causes characteristic tunnels as it burrows through plant material above the soil line. B) The maggots are small, yellowish-white, and legless. C) Pupae resemble brown rice in appearance and size. D) Maggots may cause mild to severe damage to the cotyledons (Eyre et al., 2015a).
146
Appendix F: SIUC Method of SDS Scoring
147
Appendix G: Greenhouse Protocols
For seedling disease assay:
1. Grind and thoroughly mix soil. 2. Add 12 pots worth of soil into clean plastic bin (approximately 1.4 kg/pot). Add
2.4 g of DAP, 2.4 g potash, or 2.4 g DAP plus 2.4 g potash, depending on the treatment. Thoroughly mix.
3. Put coffee filter in bottom of pot, add treated soil to approximately 3 cm below rim. Add stakes to label.
4. Put pots in large white tray and flood with deionized water overnight. 5. Drain pots for approximately 24-36 hours or until the moist soil formed cracks
when a pot was squeezed slightly and decompressed. 6. Put in plastic bags and incubate at room temperature for 2 weeks. 7. Plant 15 seeds 3 cm into the soil. (Sloan 2014 was used.) 8. Flood after 3 days for 24 hours. (Note: this step was ONLY done for the first trial.) 9. Record stand counts at 7 and 10 days. 10. Record remaining data when plants have reached the VC growth stage
(approximately 2 weeks in the fall and 3 weeks in the winter/early spring). For sudden death syndrome assay:
1. Grind and thoroughly mix soil. 2. Add 12 pots worth of soil into clean plastic bin (approximately 1.4 kg/pot). Add
2.4 g of DAP, 2.4 g potash, or 2.4 g DAP plus 2.4 g potash, depending on the treatment. Thoroughly mix.
3. Put coffee filter in bottom of pot, add treated soil to approximately 3 cm below rim. Add stakes to label.
4. Plant 12 SDS-susceptible seeds 3 cm into the soil. (untreated AGI 31R2Y2 3102N from Pond Seed Co. was used.)
5. Record stand counts at 7 and 10 days. 6. Record heights when plants have reached V4 growth stage. 7. Record remaining data when plants have reached the V5 growth stage
(approximately 5 weeks in the fall and 6 weeks in the winter/early spring).
148
Appendix H: Greenhouse data collection
Figure H.1. Root rot was rated on a 1 to 5 scale where (left to right) 1= healthy roots with no symptoms on any part of root system; 2= 1-20% of root system had lesions on lateral roots; 3= 21-75% of roots had symptoms, some lesions on tap root; 4= 76-100% of roots had symptoms on lateral and tap roots; and (not pictured) 5= complete root rot, no germination of seed.
Photo from Christine Balk
149
Figure H.2. Sporangia and oospores provide evidence of oomycete infection.
150
Figure H.3. In greenhouse assays with Fusarium virguliforme infested soil, the number of plants with diseased roots were counted and divided by the stand. Roots were considered diseased if dark brown lesions were visible on the taproot after a thorough washing. A) Asymptomatic roots B) The plant on the left was considered asymptomatic and the plant on the right was considered symptomatic. Thus, the pot was rated ½, or 0.5 C) Arrows indicate symptomatic roots and the pot was rated 5/7, or 0.71.
A B
C
151
Figure H.4. In sudden death syndrome disease greenhouse assays, plants were measured from the soil to the base of the V2 petiole at the V4 growth stage. Up to five plants were measured and averaged.
152
Appendix I: Greenhouse Temperatures Table I.1. For seedling disease greenhouse assays conducted with soil from Defiance and Van Wert, temperatures were set to remain between 17 to 18˚C (62 to 64˚F). However, greenhouse renovations in Selby complicated temperature regulation and temperatures fluctuated outside the ideal range frequently. Greenhouse conditions for each trial were recorded. The maximum and minimum temperature was recorded every weekday and some weekends for each greenhouse. The maximum and minimum temperature each trial was exposed to is recorded below, in addition to the average range. This range was calculated by separately averaging the available maximum and minimum values.
Van Wert Trial 1 Trial 2 Trial 3
Dates and Greenhouse
11/9-11/23 in Selby G008 2/5-3/2 in Selby G005 3/21-4/14 in Williams 060
when greenhouse lights were installed -Flooded for 24 hours three days after planting -Vermiculite used to cover seed
-Moved to growth chamber on 3/7 for better temperature regulation. Growth chamber set to remain at 17-18 ˚C (62-64˚F).
153
Table I.2. For sudden death syndrome greenhouse assays with soil from Erie and Wood, temperatures were set to remain between 17-18˚C (62-64˚F) for the entirety of the first trial and the first week of the second trial. After 7 days, these second trials were moved to a warmer greenhouse set to remain at 20-21˚C (68-70˚F) in the effort to induce foliar symptoms of sudden death syndrome. However, greenhouse renovations in Selby complicated temperature regulation and temperatures fluctuated outside the ideal range frequently. The maximum and minimum temperature was recorded every weekday and some weekends for each greenhouse. The maximum and minimum temperature each trial was exposed to is recorded below, in addition to the average range. This range was calculated by separately averaging the available maximum and minimum values.
Erie Trial 1 Trial 2
Dates and Greenhouse
11/10-12/16 in G008 2/2-2/9 in G005 set at 17-18˚C (62-64˚F) 2/10-3/20 in G025 set at 20-21˚C (68-70˚F)
Max. temp. 32˚C (89˚F) First week: 26˚C (79˚F) After first week: 41˚C (106˚F)
Min. temp. 11˚C (52˚F) First week: 16˚C (60˚F) After first week: 18˚C (64˚F)
Avg. range 19-24˚C (67-76˚F) First week: 16-22˚C (61-71˚F) After first week: 18-27˚C (65-81˚F)
Notes -Watered with chlorinated water for 6 days (11/10-11/16) -only natural light from 11/10-11/18, when greenhouse lights were installed
Wood Trial 1 Trial 2 Dates and Greenhouse
10/26-11/10 in Selby G003 11/10-12/2 in Selby G008
2/22-2/29 in G005 set at 17-18˚C (62-64˚F) 3/1-4/14 in G025 set at 20-21˚C (68-70˚F)
Max. temp. 32˚C (89˚F) First week: 32˚C (91˚F) After first week: 33˚C (92˚F)
Min. temp. 18˚C (65˚F) First week: 15˚C (59˚F) After first week: 18˚C (65˚F)
Avg. range 21-27˚C (69-80˚F) First week: 18-27˚C (64-81˚F) After first week: 21-29˚C (69-84˚F)
Notes -Watered with chlorinated water for 6 days (11/10-11/16) -only natural light from 11/10-11/18, when greenhouse lights were installed
154
Appendix J: 2015 Survey at VC growth stage
# Sample code Field Plot Trt Plant Media Preliminary ID 1 MWa1.1a Wood 1 P 1 PCA Fusarium sp. 2 MWa1.1b Wood 1 P 1 PBNC lost 3 MWa1.1c Wood 1 P 1 PDA Fusarium sp. 4 MWa1.2a Wood 1 P 2 PCA Fusarium sp. 5 MWa1.2b Wood 1 P 2 PBNC lost 6 MWa1.2c Wood 1 P 2 PDA Fusarium sp. 7 MWa1.3a Wood 1 P 3 PCA Fusarium sp. 8 MWa1.3b Wood 1 P 3 PBNC lost 9 MWa1.3c Wood 1 P 3 PDA Fusarium sp.
10 MWa1.4a Wood 1 P 4 PCA Fusarium sp. 11 MWa1.4b Wood 1 P 4 PBNC lost 12 MWa1.4c Wood 1 P 4 PDA black 13 MWa1.5a Wood 1 P 5 PCA double oospore 14 MWa1.5b Wood 1 P 5 PBNC lost 15 MWa1.5c Wood 1 P 5 PDA Fusarium sp. 16 MWa2.1a Wood 2 K 1 PCA Fusarium sp. 17 MWa2.1b Wood 2 K 1 PBNC lost 18 MWa2.1c Wood 2 K 1 PDA Unknown 19 MWa2.2a Wood 2 K 2 PCA Unknown 20 MWa2.2b Wood 2 K 2 PBNC lost 21 MWa2.2c Wood 2 K 2 PDA Macrophomina phaseolina 22 MWa2.3a1 Wood 2 K 3 PCA Fusarium sp. 23 MWa2.3b Wood 2 K 3 PBNC lost 24 MWa2.3c Wood 2 K 3 PDA Fusarium sp. 25 MWa2.4a Wood 2 K 4 PCA Fusarium sp. 26 MWa2.4b Wood 2 K 4 PBNC lost 27 MWa2.4c Wood 2 K 4 PDA Fusarium sp. 28 MWa2.5a Wood 2 K 5 PCA Unknown 29 MWa2.5b Wood 2 K 5 PBNC lost 30 MWa2.5c Wood 2 K 5 PDA large white sclerotia 31 MWa3.1a Wood 3 PK 1 PCA Fusarium sp. 32 MWa3.1b Wood 3 PK 1 PBNC lost 33 MWa3.1c Wood 3 PK 1 PDA likely Trichoderma or Gliocadium 34 MWa3.2a Wood 3 PK 2 PCA lost 35 MWa3.2b Wood 3 PK 2 PBNC lost 36 MWa3.2c Wood 3 PK 2 PDA likely Trichoderma or Gliocadium 37 MWa3.3a Wood 3 PK 3 PCA Fusarium sp. 38 MWa3.3b Wood 3 PK 3 PBNC lost 39 MWa3.3c Wood 3 PK 3 PDA Fusarium sp. 40 MWa3.4a Wood 3 PK 4 PCA Fusarium sp. 41 MWa3.4b Wood 3 PK 4 PBNC lost 42 MWa3.4c Wood 3 PK 4 PDA Fusarium sp. 43 MWa3.5a Wood 3 PK 5 PCA Fusarium sp. 44 MWa3.5b Wood 3 PK 5 PBNC lost 45 MWa3.5c Wood 3 PK 5 PDA likely Trichoderma or Gliocadium 46 MWa4.1a1 Wood 4 None 1 PCA Fusarium sp.


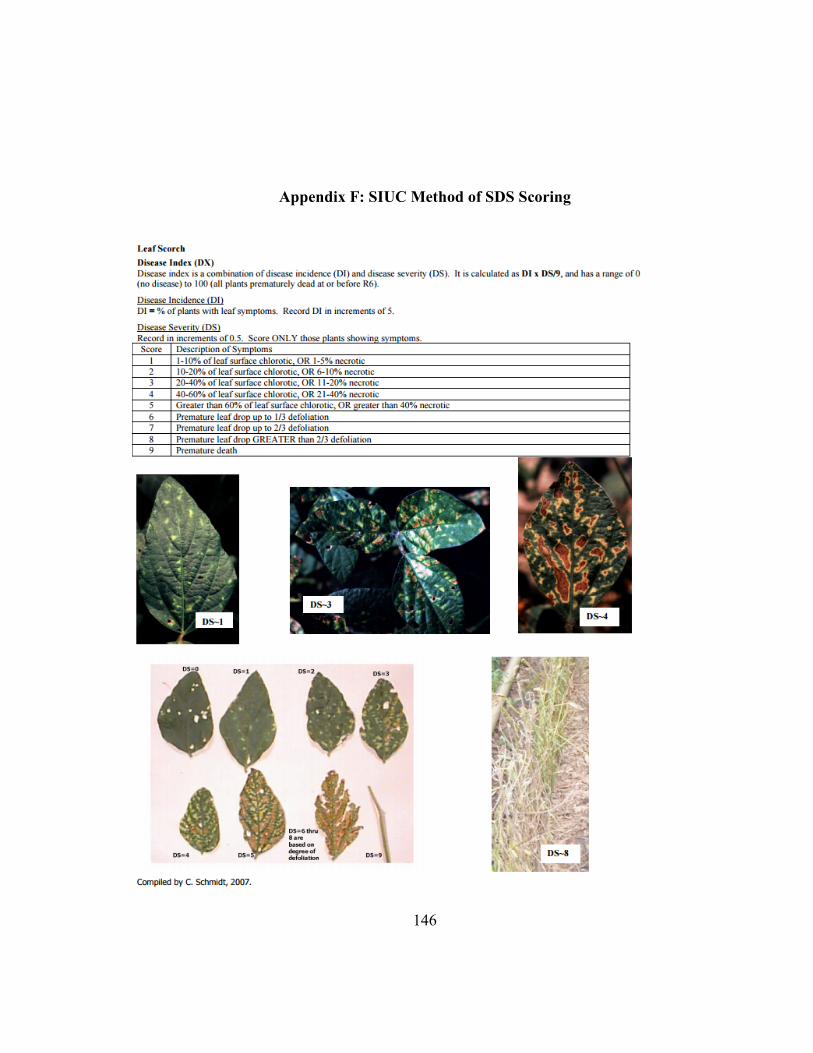


![1 $SU VW (G +LWDFKL +HDOWKFDUH %XVLQHVV 8QLW 1 X ñ 1 … · 2020. 5. 26. · 1 1 1 1 1 x 1 1 , x _ y ] 1 1 1 1 1 1 ¢ 1 1 1 1 1 1 1 1 1 1 1 1 1 1 1 1 1 1 1 1 1 1 1 1 1 1 1 1 1 1](https://static.documents.pub/doc/80x56/5fbfc0fcc822f24c4706936b/1-su-vw-g-lwdfkl-hdowkfduh-xvlqhvv-8qlw-1-x-1-2020-5-26-1-1-1-1-1-x.jpg)


![1 1 1 1 1 1 1 ¢ 1 , ¢ 1 1 1 , 1 1 1 1 ¡ 1 1 1 1 · 1 1 1 1 1 ] ð 1 1 w ï 1 x v w ^ 1 1 x w [ ^ \ w _ [ 1. 1 1 1 1 1 1 1 1 1 1 1 1 1 1 1 1 1 1 1 1 1 1 1 1 1 1 1 ð 1 ] û w ü](https://static.documents.pub/doc/80x56/5f40ff1754b8c6159c151d05/1-1-1-1-1-1-1-1-1-1-1-1-1-1-1-1-1-1-1-1-1-1-1-1-1-1-w-1-x-v.jpg)


![[XLS] · Web view1 1 1 2 3 1 1 2 2 1 1 1 1 1 1 2 1 1 1 1 1 1 2 1 1 1 1 2 2 3 5 1 1 1 1 34 1 1 1 1 1 1 1 1 1 1 240 2 1 1 1 1 1 2 1 3 1 1 2 1 2 5 1 1 1 1 8 1 1 2 1 1 1 1 2 2 1 1 1 1](https://static.documents.pub/doc/80x56/5ad1d2817f8b9a05208bfb6d/xls-view1-1-1-2-3-1-1-2-2-1-1-1-1-1-1-2-1-1-1-1-1-1-2-1-1-1-1-2-2-3-5-1-1-1-1.jpg)


