14
| Date post: | 16-Jul-2015 |
| Category: |
Business |
| Upload: | tushar-warang |
| View: | 159 times |
| Download: | 5 times |


DFPCL- Timeline
1979: Incorporation Of
Company, start to
manufactures anhydrous
liquid ammonia as well as
fertilizer
1985: Start to
Manufacture
concentrated & dilute
nitric acid, low
density ammonium
nitrate
1986: Start to Manufacture
Ammonium Nitro
phosphate
1989: Start to Manufacture of various
resins based on Methanol
1990: Fertilizers sold under
brand name “Mahadhan”. Start
to manufacture dry carbon di
oxide
1994: Undertook debottlenecking
of ammonia plant to raise
capacity by 20%
1996: Add bulk fertilizers &
Specialized agro products
2000: Setting up a new nitric acid plant with
annual capacity of 1 lakh tonnes
2003: Inducts Knight Frank as real estate
consultant, setting up 6MW captive power
plant
2004: Start to manufacture of
70000 MT per annum
Isopropyl Alcohol
2011: Acquisition of 49 %
equity stake in Desai fruits &
Vegetables Pvt. Ltd.
2012: New plant of Bentonite
sulphur at Haryana, with
capacity of 32000 MTPA.
Start to manufacture Nitro
Phosphate 24:24:0
2014: Start to acquire
Mangalore chemical
fertilizers .
Source: Annual Report, Company Website

Strength• Expected to grow at significant phase• Good experienced management• Diversified Product Basket• Market leader in Indian water soluble,
Speciality fertilizers• With high end technologies increased
productivity• Healthy Balance sheet
Weakness• Company has to depend on natural
gas supply• Fertilizers use depends on monsoon &
irrigation facilities
Opportunities• Need to move from bulk fertilizers to
speciality fertilizers• To become Holistic agriculture player• Moving from domestic to global TAN
player• Moving from commodity to high value
chemicals
• Expand the market in southern region of India
Threats• Many foreign players coming in
speciality fertilizer industry, that’s why margin will get hurt in the future
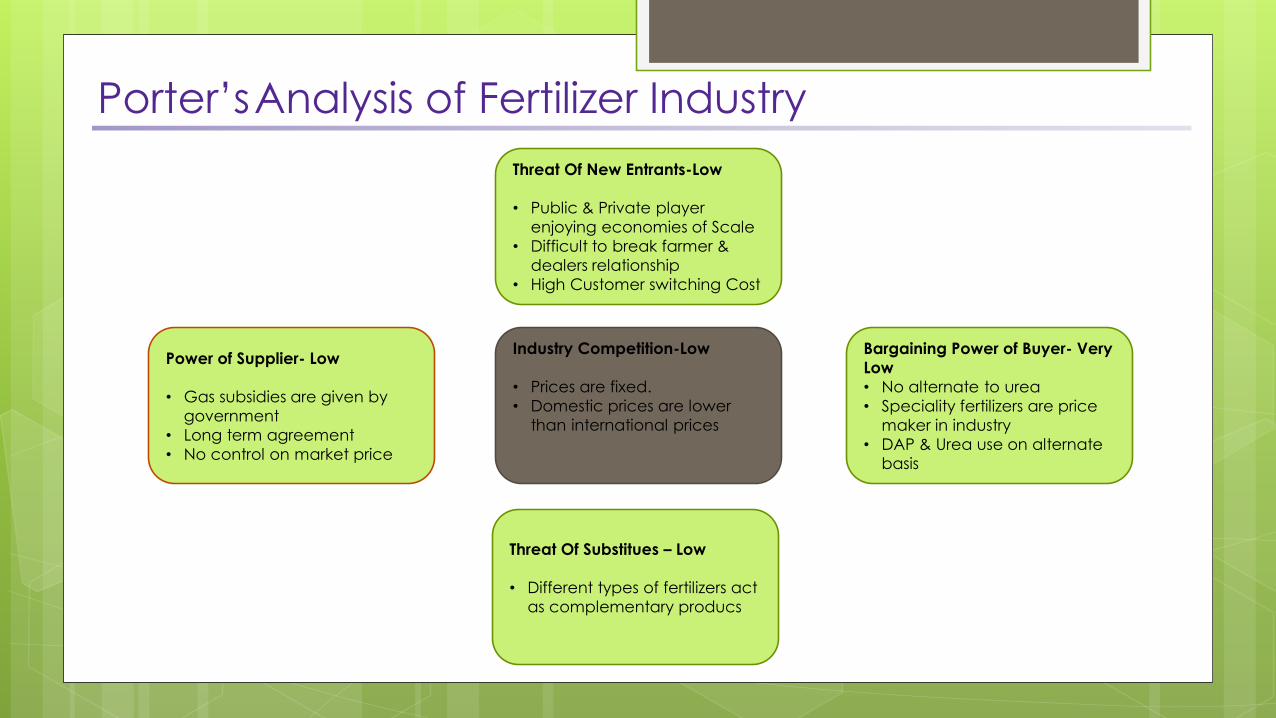
Porter’sAnalysis of Fertilizer Industry
Threat Of New Entrants-Low
• Public & Private player
enjoying economies of Scale
• Difficult to break farmer &
dealers relationship
• High Customer switching Cost
Power of Supplier- Low
• Gas subsidies are given by
government
• Long term agreement
• No control on market price
Bargaining Power of Buyer- Very
Low
• No alternate to urea
• Speciality fertilizers are price
maker in industry
• DAP & Urea use on alternate
basis
Industry Competition-Low
• Prices are fixed.
• Domestic prices are lower
than international prices
Threat Of Substitues – Low
• Different types of fertilizers act
as complementary producs

Urea , 53%
DAP & Complex
Fertilizers, 15%
Ammonium Bi-
carbonate, 2%
Sulphonated
Naphthalene
Formaldehyde,
1%
Plant Protection
Chemicals, 4%
Plant Nutrition
Products, 3%
Trading of
complex
fertilizer, 20%
Revenue Contribution-FY2014
Products MT (As on 2014)
Urea 3.8 Lac
DAP & Complex Fertilizers 2.8 Lac
Ammonium Bi-carbonate 24750
Sulphonated NaphthaleneFormaldehyde 21450
Plant Protection Chemicals 22000
Plant Nutrition Products 200
Trading of complex fertilizer NA
* MCFL was the ideal acquisition target preliminarily in terms of size (market share) and ease
since DPFCL already had a stake in MCFL.

0
5000
10000
15000
20000
FY12 FY13 FY14
(Rs mn)
Subsidy -% of debt
Total Debt Subsidy Pending
0
20000
40000
60000
FY12 FY13 FY14
5350 5350 5350
32850 37069 40665
Urea subsidy & farm
price breakup
Urea Price Subsidy
MCFL’s urea plant faces plant closure:• GOI issues plant closure notice to high
cost naphtha plant.• Company's sales & profit will hit by big
margin as Urea contributes approx. 50% of sales
Stress on working capital & interest cost• MCFL has witnessed significant delays in
fertilizer subsidy payment from GOI.• Due to high cost of Naphtha, subsidy
account 90% of urea cost• MCFL as strong balance sheet as most
of debt is working capital• On time subsidy payment will decrease
interest payment
Gas connectivity to its urea plant is still far away:• MCFL converted its
naphtha based plant to gas based plant.
• Expected gas connectivity to plant is in 2016-17
Source: Annual Report MCFL, www.faidelhi.org

Enhancement in Product basket:
• MCFL has diversified product basket which
includes urea, DAP and other complex fertiliser
• DFPCL’s product basket primarily includes
Ammonium Nitrate Phosphate (ANP) with
capacity of 2.3 lac MT
• DPFCL get access to the commodity product-
Urea
• Increase competitiveness in import pricing for
traded fertilizer
• DPFCL get access to the non fertilizers
speciality agriculture inputs such as soil
conditioners, Micro Nutrients, water soluble
fertilizers. (Higher margins & growth potential)
DAP, 18%
NPK, 9%
MOP,
12%
Urea,
61%
MCFL Product Portfolio
DAP, 29%
ANP, 25%
MOP,
46%
DFPCL Product Portfolio
(Fertilizer)
Source: Annual report of MCFL & DPFCL

Geographical diversification helps to
increase market share:
• MCFL enjoys strong presence in
southern region primarily Karnataka
which contributes ~75% to its fertiliser
sales.
• Other key markets include Tamilnadu
(10%) and Andhra Pradesh (8%)
• DFPCL on other hand enjoys strong
presence in western region.
• We can expect significant synergies
as DFPCL will be able to enter into
southern region
• These two companies can cross sale
their products to achieve maximum
market share
• Presently, Market shares of MCFL &
DPFCL are 4.5% and 4.9% respectively
in fertilizers.
Source: Annual report of MCFL & DPFCL
75%
10%
8%6% 1%
MCFL: Geographical Distribution
Karnataka Tamilnadu Andhra Pradesh Kerala Maharashtra
87%
6%5% 2%
DPFCL (Fertilizers): Geographical
Distribution
Maharashtra Karnataka Gujarat UP

Strong brand and farmers connect
Both the companies enjoy strong farmers connect and distribution strength in their respective
markets
MCFL’s Mangala brand & DFPCL’s Mahadhan brand has strong presence in their respective zones
Both the companies connects directly with the farmers by educating them right use of various
crop
Proximity with ports offers significant advantage
MCFL offers significant opportunity for fertiliser trading primarily DAP and MOP due to its close
proximity to the Mangalore port
MCFL’s plant is well connected, both by rail and road
It will also facilitate import of raw material / intermediates like ammonia and phosphoric acid
which will facilitate production of complex fertiliser.
Future opportunity for brownfield expansion
MCFL has surplus land of 50 acres which is sufficient to build plant with 1 MT capacity in the future
The New Mangalore Port is an all-weather port capable of handling ships up to 30 feet draft.
Other agricultural synergies
Maharsahtra & Karnataka produce similar kind of crops. Hence cross- selling of fertilizers becomes
a possibility.
Karnataka is the largest producer of coarse cereals, for which DFPCL has speciality products.
Similarly DFPCL’s product portfolio includes mining and industrial chemicals.

Valuation (INR Crore) Except per share price
EBIT 223.454
NOPAT 169.447
add: dep 31.636
less: inc wkg cap 27
Capex 87.9
86.2
Agg. DCF 77.1
FCFF 87.9
Terminal Value 893.0
PV of Terminal Value 798.3981103
Total Enterprise value 875.45
Shares 11.86
Price/share 73.82
By our estimates, intrinsic value of MCF is Rs 73.82 per share.However, considering the probable synergies, we offer a premium of 26% to Rs 93 per share.

Balance Sheet (INR Crore) FY 2015e On Cash Deal
Source of Fund
Share Capital 88.20
Reserve 1432.06
Shareholder's Funds 1520.26
Secured Loans 1594.71
Unsecured Loans 182.01
Total Debts 1776.72
Current Liabilities 2759.52
Provisions 104.11
Total Current Liabilities 2840.82
Total Liabilities 6137.79
Good Will 107.55
Gross Block 3706.72
Less: Accumulated Depreciation 1560.92
Net Block 2145.81
Capital Work in Progress 236.69
Investments 561.66
Current Assets, Loans & Advances 0.00
Inventories 688.45
Sundry Debtors (Debotrs) 835.26
Cash and Bank 139.01
Other Current Assets 1406.01
Loans and Advances 176.57
Total Current Assets 3245.30
Deferred Tax Assets / Liabilities -159.73
Total Assets 6137.27
P&L (INR Crore) FY 2015 On Cash Deal
Gross Sales 8315.36
Less: Excise 281.72
Net Sales 8033.65
EXPENDITURE :
Increase/Decrease in Stock 17.99
Raw Materials Consumed 5556.39
Power & Fuel Cost 540.36
Employee Cost 3075.37
Other Manufacturing Expenses 210.74
General and Administration
Expenses 245.25
Selling and Distribution Expenses 151.02
Miscellaneous Expenses 115.96
Total Expenditure 7200.88
PBIDT (Excl OI) 832.76
Other Income 53.57
Operating Profit 788.27
Interest 286.15
PBDT 502.12
Depreciation 159.63
Profit Before Taxation &
Exceptional Items 342.49
Profit Before Tax 342.49
Provision for Tax 119.87
PAT 222.62
Assumptions:
• DPFCL is
buying
MCFL on
26% ao the
intrinsic
value .
• Deal has
been taken
place on
the basis of
all cash
DPFCL will
raise long term
debt of 738
Crore at an
average of
10% interest
rate
CASE 1 : ALL CASH DEAL

Balance Sheet (INR Cr) FY 2015 Shares offered 1:1
Source of Fund
Share Capital 177.15
Reserve 1432.06
Shareholder's Funds 1609.21
Share Premium 738.29
Secured Loans 767.47
Unsecured Loans 182.01
Total Debts 949.48
Current Liabilities 2759.52
Provisions 104.11
Total Current Liabilities 2840.82
Total Liabilities 6137.79
Good Will 107.55
Gross Block 3706.72
Less: Accumulated Depreciation 1560.92
Net Block 2145.81
Capital Work in Progress 236.69
Investments 561.66
Current Assets, Loans & Advances 0.00
Inventories 688.45
Sundry Debtors (Debotrs) 835.26
Cash and Bank 139.01
Other Current Assets 1406.01
Loans and Advances 176.57
Total Current Assets 3245.30
Deferred Tax Assets / Liabilities -159.73
Total Assets 6137.27
P&L (INR Cr) FY 2015 As share offered 1:1
Gross Sales 8315.36
Less: Excise 281.72
Net Sales 8033.65
EXPENDITURE :
Increase/Decrease in Stock 17.99
Raw Materials Consumed 5556.39
Power & Fuel Cost 540.36
Employee Cost 3075.37
Other Manufacturing
Expenses 210.74
General and Administration
Expenses 245.25
Selling and Distribution
Expenses 151.02
Miscellaneous Expenses 115.96
Total Expenditure 7200.88
PBIDT (Excl OI) 832.76
Other Income 53.57
Operating Profit 788.27
Interest 203.43
PBDT 584.84
Depreciation 159.63
Profit Before Taxation &
Exceptional Items 425.21
Profit Before Tax 425.21
Provision for Tax 148.82
PAT 276.39
Assumptions:
• DPFCL is
buying
MCFL on
26%
premium
of the
intrinsic
value .
• Deal has
been
taken
place on
the basis
of 1:1
exchange
ratio
CASE 2 : SHARES 1:1

Ratios DPFCL Post Merger DPFCL - All cash Post Merger DPFCL - Shares 1:1
D/E 6.71 10.08 4.33
Interest Coverage 3.96 2.35 3.31
ROE 16.55% 14.64% 17.18%
In the near term, improvement in key ratios is observed in the post merger scenario.
Post Merger DPFCL - All cash Post Merger DPFCL - Shares 1:1
No of Shares
(Crore) 8.82 17.72
Total Earnings
(Crore) 264.39 276.39
EPS 29.98 15.60
Market Value (Crore) 2289.73
PE 8.66 8.28

Thank You


