Page 1
MERGERS AND ACQUISITION EFFECTS TO COMPETITIVE
ADVANTAGE WITHIN INFORMATION TECHNOLOGY
COMPANIES: A CASE STUDY OF DELL EMC CENTRAL, EAST
AFRICA
BY
MBURU DAN GAIKU
UNITED STATES INTERNATIONAL UNIVERSITY-AFRICA
SUMMER 2018
Page 2
MERGERS AND ACQUISITION EFFECTS TO COMPETITIVE
ADVANTAGE WITHIN INFORMATION TECHNOLOGY
COMPANIES: A CASE STUDY OF DELL EMC CENTRAL, EAST
AFRICA
BY
MBURU DAN GAIKU
A Research Project Report Submitted to the Chandaria School of
Business in Partial Fulfilment of the Requirement for the Degree of
Master of Business Administration (MBA)
UNITED STATES INTERNATIONAL UNIVERSITY-AFRICA
SUMMER 2018
Page 3
ii
STUDENT’S DECLARATION
I, the undersigned, declare that this is my original work and has not been submitted to any
other college, institution or university other than United States International University in
Nairobi for credit.
Signed: Date:
Mburu, Dan Gaiku (647339)
This project report has been presented for examination with my approval as the appointed
supervisor
Signed: Date:
Newa, Fred
Signed: Date:
Dean, Chandaria School of Business
Page 4
iii
COPYRIGHT
© 2018 Dan Gaiku Mburu
All rights reserved including rights of reproduction in whole or part in any form without
the prior permission of the author or United States International University or Office of
the Deputy Vice Chancellor Academic Affairs.
Page 5
iv
ABSTRACT
The purpose of this study was to analyze competitive advantage (or lost) gained due to
mergers and acquisitions: A Case of Dell EMC Central East Africa (CEA). To achieve
this objective, the study was guided by three specific objectives which sought to establish
the effects of M&A on product competitive advantage, effect of M&A on supply chain
competitive advantage and the effects of M&A on business model competitive advantage.
A descriptive research was adopted to aid in the data collecting from respondents on their
perceptions on competitive advantage (or lost) gained due to mergers and acquisitions.
Further, a correlational approach was adopted to establish the relationship between the
M&A and product competitive, supply chain and business model competitive advantage.
The target population for this study was 40 mid-level managers and 8 top level managers.
A structured questionnaire was the tool adopted to gather the required information. The
sampling technique was stratified random sampling method. From the initial target
population of 48 questionnaires awarded only 35 were filled and returned giving a
response rate of 73%. After collection, the data was then analyzed using a computer
analytical program with inferential and descriptive statistics to test the hypotheses.
The study revealed that respondents were satisfied with the post-merger product offerings
which gave the company more competitive advantage. Majority also agreed that the
product offerings existed at various price points although the pre-merger product
offerings had the right messaging. A Paired sample t test was done to compare products
competitive advantage before and after the merger and pre-merger product competitive
advantage. The difference revealed that there is a significant difference between the mean
of products competitive advantage before and after the merger.
Focusing on the effects of mergers on supply chain competitive advantage, the results
established that they were more satisfied with the facets of the supply chain interacted
with in the pre-merger. A Paired sample t test was done to compare supply chain
advantage before and after the merger. The difference revealed that there is no significant
difference between the mean of supply chain competitive advantage before and after the
merger.
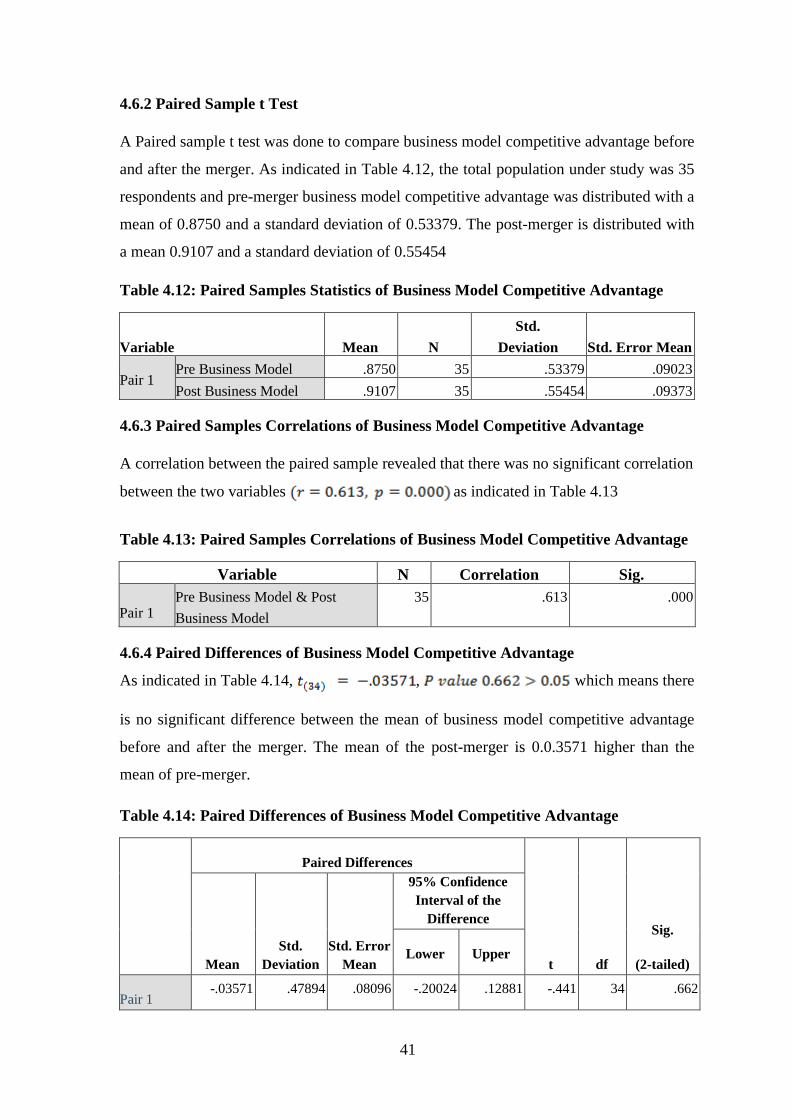
The study sought to establish the effects of mergers on business model competitive
advantage, by comparing the results before and after the merger. The finding revealed
that respondents were satisfied with the business model however the pre-merger was
Page 6
v
higher. It was however revealed that the post-merger business model gave the company
more competitive advantage and the business model led to limited reach. A Paired sample
t test was done to compare business model competitive advantage before and after the
merger. The results revealed that there is no significant difference between the mean of
business model competitive advantage before and after the merger.
The study concluded that post-merger product offerings has the capability of offering the
company more competitive advantage. The product offerings are usually in a wide
variety at various price points. The findings also reveal that after the merger, products are
widely known. There is a significant difference between a products competitive
advantage before and after the merger. Secondly, supply chain after the merger gives the
company more competitive advantage as well as add the reach of the partner network and
skill set of the Partner network therefore result into increased competitiveness. Lastly,
post-merger business model offers institutions with a more competitive advantage as it
allows for an effective communication and implementation of the go to market Strategy.
The study recommends that after undergoing an M&A the product offerings needs to be
able to satisfy the customers’ needs to ensure the exercise results into gain of competitive
advantage. The facets of the supply chain should be stable to ensure products reach the
consumers conveniently. This aids the firm in gaining a competitive advantage. Partner
network should always be maintained and this will ensure the firm can connect with other
partners and therefore share the skill set of the partner network. Lastly, business model
used before and after the mergers should be one that ensures the firm enjoys a
competitive advantage. The business model also need to be one that is very simple and
capable of adaptation to the market needs. They should also be training if need be to
ensure that the business model is well understood by partner network.
Further research should be done on other firms that have experiences mergers in the same
industry in order to be able to compare the results and therefore generalize the findings.
There is also a need for further research to establish the challenges and risks faced before
and after the merger.
Page 7
vi
ACKNOWLEDGMENT
I would like to thank the almighty Lord for seeing me through this chapter in my
academics, for the wisdom, financial provision, support and good health. My profound
appreciation goes to my best friend, classmate and wife Ann Wamaitha for her undying
support and encouragement in my academic endeavors. To my parents and siblings for
their prayers and love. My special thanks goes to my supervisor Dr. Fred Newa for
impacting the right skills necessary to undertake the project, for guiding me through the
entire project, and for always being available for the reviews and guidance.
Page 8
vii
DEDICATION
To my loving wife Ann Wamaitha, for her unwavering support, encouragement and love
as we conquer the world.
Page 9
viii
TABLE OF CONTENTS
STUDENT’S DECLARATION ........................................................................................ ii
COPYRIGHT ................................................................................................................... iii
ABSTRACT ....................................................................................................................... iv
ACKNOWLEDGMENT .................................................................................................. vi
DEDICATION.................................................................................................................. vii
LIST OF TABLES ............................................................................................................ xi
LIST OF FIGURES ......................................................................................................... xii
CHAPTER ONE ................................................................................................................ 1
1.0 INTRODUCTION........................................................................................................ 1
1.1 Background of the Study ............................................................................................... 1
1.2 Statement of the Problem ............................................................................................... 5
1.3 Purpose of the Study ...................................................................................................... 6
1.4 Research Questions ........................................................................................................ 6
1.5 Importance of the Study ................................................................................................. 6
1.6 Scope of the Study ......................................................................................................... 7
1.7 Definition of Terms........................................................................................................ 7
1.8 Chapter Summary .......................................................................................................... 8
CHAPTER TWO ............................................................................................................... 9
2.0 LITERATURE REVIEW ........................................................................................... 9
2.1 Introduction .................................................................................................................... 9
2.2 Effect of M&A on Product Competitive Advantage ..................................................... 9
2.3 Effect of M&A on Supply Chain Competitive Advantage .......................................... 16
2.4 Effect of M&A on Business Model Competitive Advantage ...................................... 20
2.5 Chapter Summary ........................................................................................................ 25
Page 10
ix
CHAPTER THREE ......................................................................................................... 26
3.0 RESEARCH METHODOLOGY ............................................................................. 26
3.1 Introduction .................................................................................................................. 26
3.2 Research Design........................................................................................................... 26
3.3 Population and Sampling Design ................................................................................. 27
3.4 Data Collection Methods ............................................................................................. 29
3.5 Research Procedures .................................................................................................... 29
3.6 Data Analysis Methods ................................................................................................ 30
3.7 Chapter Summary ........................................................................................................ 30
CHAPTER FOUR ............................................................................................................ 31
4.0 RESULTS AND FINDINGS ..................................................................................... 31
4.1 Introduction .................................................................................................................. 31
4.2 General information ..................................................................................................... 31
4.3 Merger Outlook ............................................................................................................ 34
4.4 Products Competitive Advantage ................................................................................ 35
4.5 Supply Chain Competitive Advantage......................................................................... 37
4.6 Business Model Competitive Advantage ..................................................................... 39
4.7 Correlation Analysis .................................................................................................... 42
4.8 Chapter Summary ........................................................................................................ 43
CHAPTER FIVE ............................................................................................................. 44
5.0 DISCUSSION, CONCLUSIONS AND RECOMMENDATIONS ........................ 44
5.1 Introduction .................................................................................................................. 44
5.2 Summary ...................................................................................................................... 44
5.3 Discussion .................................................................................................................... 46
5.4 Conclusion ................................................................................................................... 51
5.5 Recommendation ......................................................................................................... 52
Page 11
x
REFERENCES ................................................................................................................. 53
APPENDIX I: INTRODUCTORY LETTER ............................................................... 65
APPENDIX II: QUESTIONNAIRE .............................................................................. 66
Page 12
xi
LIST OF TABLES
Table 3.1: Population Size ................................................................................................. 27
Table 3.2: Sample Size ...................................................................................................... 28
Table 4.1: Response Rate ................................................................................................... 31
Table 4.2: Descriptive of Merger outlook.......................................................................... 35
Table 4.3: Descriptive of Products Competitive Advantage ............................................. 36
Table 4.4: Paired Samples Statistics of Products Competitive Advantage ........................ 36
Table 4.5: Paired Samples Correlations of Products Competitive Advantage .................. 37
Table 4.6: Paired Differences of Products Competitive Advantage .................................. 37
Table 4.7: Descriptives of Supply Chain Competitive Advantage .................................... 38
Table 4.8: Paired Samples Statistics of Supply Chain Competitive Advantage ................ 38
Table 4.9: Paired Samples Correlations of Supply Chain Competitive Advantage .......... 39
Table 4.10: Paired Differences of Supply Chain Competitive Advantage ........................ 39
Table 4.11: Business Model Competitive Advantage ........................................................ 40
Table 4.12: Paired Samples Statistics of Business Model Competitive Advantage .......... 41
Table 4.13: Paired Samples Correlations of Business Model Competitive Advantage ..... 41
Table 4.14: Paired Differences of Business Model Competitive Advantage .................... 41
Table 4.15: Correlation of Merger Objective and Pre-merger Co Factors ........................ 42
Table 4.16: Correlation of Merger Objective and Post-merger Co Factors ....................... 43
Page 13
xii
LIST OF FIGURES
Figure 4.1: Respondents Gender ........................................................................................ 31
Figure 4.2: Respondents Age Group .................................................................................. 32
Figure 4.3: Years of Experience in the IT Fiel .................................................................. 32
Figure 4.4: Role in the Firm ............................................................................................... 33
Figure 4.5: Company Worked............................................................................................ 33
Figure 4.6: Years worked in Dell or EMC ......................................................................... 34
Page 14
1
CHAPTER ONE
1.0 INTRODUCTION
1.1 Background of the Study
Charles Darwin the father of the theory of evolution espoused that all species of
organisms arise and develop through the natural selection of small, inherited variations
that increase the individual's ability to compete, survive, and reproduce (Darwin, 1998).
This theory has an uncanny resemblance to the actual evolution of businesses in the
modern world. Companies and organizations that seek to thrive and retain relevance must
evolve and adapt to the markets they serve and the environment they reside in.
Companies that refuse to evolve find themselves in decline and obsolescence over a
period of time (Senior & Swailes, 2010).
The eye opening article by Levitt (1960), titled Marketing Myopia clearly lays out the
lack of vision of any firm that forgets that they exist only to meet the consumers’ needs
and that the consumers’ needs change and so should the goals of the firm and the
technologies employed. Consumer orientation with well employed technology is a sure
philosophy and a way to keep a firm afloat and miles away from being obsolete. In his
article, he projected that businesses widen marketing myopia since they not succeed to
inquire themselves "what is our business?”. They recurrently take for granted that they
recognize the solutions of such important questions as the idea of the time was that the
solutions to such queries were obvious. Levitt (1960) recommended that the solutions to
these queries are not apparent and that by discovering them, a business could add up
sufficiently grow its business and serves its consumers effectively.
Change is constant in life and so it is in business. With a focus on for profit
organizations, evolution is necessary to remain profitable in an ever turbulent
environment. Turbulence by definition refers to a phenomenon that is non-linear, erratic
and irregular (Drucker, 1994). Turbulence has been witnessed through rapid technological
changes, market fragmentation, industry convergence, shorter product life-cycles and
tools such as the internet and telecommunication leading to globalization, making the
competitive environment more turbulent than ever before (Goldhar, Hitt, & Lei, 1996).
Customers, technology and their preferences are consistently changing and businesses
must be mindful of these changes and adapt to remain profitable (Simonet & Tett, 2012).
Page 15
2
Proactivity and innovation have become the outcome of successful organizations that are
under strain of this turbulence. They need to find ways to relate the market landscape and
align this to their products, positioning and processes. The goal of such firms goes
beyond responding to current landscape but in shaping it to their own advantage
(Sompong, Igel, & Helen, 2014). As necessary as evolution is, it needs to be guided, it
needs to be shaped to yield competitive advantage, and this has been narrowed down to
two components, reduction of business cost structure and differentiation from
competitors (Robinson & Pearce, 2009). Of the two components only one can be scaled
and has no limitation; differentiation also known as competitive advantage. This exists
only when a firm must offer services or goods that are superior to its rivals (Walker,
2015).
Competitive advantage via use of various technologies, in the 21st century, has come in
and made things much easier, breaking down walls and removing barriers yet some
companies seem to have their head in the sand on matters such as these finding
technology as a cost center rather than their competitive crutch (Van-Oudenhoven &
DeBoer, 2009). Nonetheless, only the successful companies have managed to put
alignment of evolution and customer orientation into actual practice where it counts – at
every customer interface, every day (Lammerts, et al., 2001).
A corporation has diverse options to choose from when it comes to growth strategies.
Growth is an important aspect for any companies, either individual owned, listed
companies or even multinational companies. (Picardo, 2014) On the various option for
growth are to grow organically by increasing sales personnel, new product developments
and by expanding into new geographical areas. Alternative options such as inorganic
growth are external revenue growth which is for example strategic alliances, joint
ventures and franchising. Another option is to merge and acquire (M&A) which is an
inorganic example of how a company can grow (Gaughan, 2005).
A merger can be defined as two corporations coming together to form one; a new entity
void of the existence of the former two. (Boateng & Bjørtuft, 2008). Other authors and
scholars view it as an integration of legacy cultures blended from the two original
companies (Alistair & Mclean, 2010). An acquisition is the process of taking ownership
of a second company, integrating it into the first, to build on strengths or weaknesses of
the acquiring company. The targeted end result for both mergers and acquisitions is to
Page 16
3
grow the business in a quicker and more profitable manner than normal organic growth
would allow (Sheang, Hua, & Tai, 2000). Examples of mergers and acquisitions is
Lenovo’s acquisition of IBM brands and HP’s acquisition of the Compaq brand. Majority
of the M&A’s in the IT industry favor the acquisitions as the larger companies buy out
the smaller growing ones or buy divisions of another company (Riad, Vaara, & Zhang,
2012).
Scholars believe that M&A’s only occur for two reasons, which are explained in the
theories; disciplinary merger theory and synergistic merger theory. Disciplinary theory
suggests that mergers and acquisitions are used to increase operational efficiency in firms
that lack focus on that sector at the detriment of the firm’s performance (Weston, Hoag,
& Chung, 2003). Synergistic merger theory espouses that both firms are to gain in
operational efficiencies by coming together and jointly leveraging their resources and
strengths to improve their joint performance (Weston, Hoag, & Chung, 2003).
Despite seeming very appealing due to the speed of gaining new competencies or
enhancing those already there most mergers and acquisitions fail because of poor
mechanism for change management. Due to the complex nature of the former existing
firm’s culture, leadership structure and resources, integration and change management are
challenges faced by all firms undergoing M&A (Meaney & Pung, 2008). Mergers have
been observed in waves that begun in the turn of the 20th Century, in the USA. These
waves were experienced and observed in the form of horizontal mergers for monopolistic
purposes, in the first wave, and vertical mergers for oligopolistic reasons in the
manufacturing industry. A third wave took place of which was mostly conglomerate
mergers formed for diversification purposes into new industries (Karagiannidis, 2010).
This case study focused on the merger of Dell EMC which took effect on August 2016.
A horizontal merger between two competing IT companies, namely, Dell Corporation
and EMC Corporation. The general motive behind the merger as put by analysts is Dell
formerly a PC only manufacturer, needs to continue transforming itself into an IT
services company. A Goldman Sachs’s analyst stated that, “The two businesses are
largely complementary. Combining them could yield a company with about $80 billion in
annual revenue and free cash flow of about $7.7 billion” (CXOtoday, 2015).
Page 17
4
In 1984, the current owner of DELL EMC, Michael Dell founded Dell Computers, to sell
custom-made personal system directly to customer. The company itself had seen
immense growth, from $6 million to almost $40 billion in 25 years as of 2014. In the PC
World manufacturer industry, Dell Computers later branded Dell Inc. is 2nd and as a
company ranked #44 in the Fortune 500 as of 2012 (Primack, 2014). The headquartered
of Dell Inc. is in Austin, Texas. Dell is a leading provider of product and services for
customer. The main strategy of Dell was to focus on deliver the best possible customer
computing product and service. The revenue of company (pre-merger) in last four
quarters totaled $55.43 billion and about 96,000 employees work in solution like
technical support and corporate data center. As per press briefings, it was said that by
fiscal 2014 the company enterprise business might be reach $30 billion (Dell, 2017).
EMC has been one of the best-kept secrets of technology. Even in the years 1990, when it
was the second most powerful title on Wall Street, just behind Dell, it remained relatively
unknown (Smith, 2017). Yet it has had a profound impact on the computer industry for
some time by concentrating its efforts exclusively on the development and sale of data
storage and data management hardware and software and by persuading its Customers to
buy their products (Smith, 2017). EMC was founded in August 1979 in Massachusetts
and went through three distinct eras: The Dick Egan and Roger Marino era when it
successfully developed and sold computer memory systems; the Moshe Yanai and Mike
Ruettgers era, when it developed (Yanai) and sold (Ruettgers) high-end, disk-based
computer storage systems (hardware and software); and the Joe Tucci era, continuing
EMC’s tradition of focused execution and sales excellence, while relying mostly on a
long string of acquisitions for innovation and diversification (Press, 2016).
EMC over the years had a profound impact on the IT industry, for a while making
enterprise data big with its exclusive focus on developing and selling data storage and
data management hardware and software and convincing its customers to buy its products
independent of their other IT buying decisions (Smith, 2017). In doing so, it has joined a
handful of other “best-of-breed” vendors driving the restructuring during the 1990s of an
IT industry previously dominated by a few vertically integrated, “one-stop-shopping”
vendors (Press, 2016).
Page 18
5
At the turn of the century, computing improved and data exponentially grew started, and
shaping the world, leading to the rise of digital natives (especially Google, Amazon and
Facebook) which led to a shift in the nature of IT buying decisions and the type of IT
buyers, which in turn led to a restructuring of the IT industry (Govindarajan, 2018). In
response to these changes, EMC agreed to be acquired by Dell in the largest-ever tech
merger.
1.2 Statement of the Problem
Without M&A, Joint Ventures, Alliances in a globalized world, it has become
exceedingly difficult for companies to gain competitive advantage. To remain
competitive firms must use one or several of these options in order to succeed (Brannen
& Peterson, 2009). Recent corporate history is littered with examples of Goliaths that
were felled by nimble, more flexible David(s) who hammered a gap in the market where
no gap existed. In in order to remain agile and responsive to market needs, Dell EMC had
to merge. The new company, Dell EMC has been running a campaign know as Dell +
EMC = Better Together, which intrinsically attempts to enlighten all stakeholders that
Dell EMC has gained new competitive advantage (Pavone, 2016). The effects though
have not been studied and furthermore, there’s little visibility into how mergers and
acquisitions affects stakeholders in developing countries.
Scholarly works such as Singla, Sain & Sharma (2012), a performance evaluation of
acquired Indian IT companies by Western corporations and Diwan Njoki (2015) who
elaborated on Competitive Advantage gained due to M&A’s in BRITAM; Effects of
change management on M&A’s in L’Oreal. While the above studies compare well with
the current study, there is still a knowledge gap in the IT industry, in that there is limited
literature in and on the effects of M&A’s. Moreover, the effects of large multinational
M&A’s as affecting or effected in developing markets is also scantily found.
This study therefore aims to examine the effects of a merger and acquisition to a
company, whose primary business is the provision of technology and in this case in
developing countries. With firms on the lookout for the newest means to combat high
volatility environments, they need to seek competitive advantage for sustainable
profitability. This knowledge gap presents an opportunity for research, which this paper
aims to study.
Page 19
6
1.3 Purpose of the Study
The purpose of this study was to analyze competitive advantage (or lost) gained due to
mergers and acquisitions: A Case of Dell EMC Central East Africa (CEA).
1.4 Research Questions
The study was guided by the following research questions:
1.4.1 What is the effects of M&A on Product Competitive Advantage
1.4.2 What is the effect of M&A on Supply Chain Competitive Advantage
1.4.3 What is the effects of M&A on Business Model Competitive Advantage
1.5 Importance of the Study
The study sought to uncover the benefits Dell EMC CEA has drawn from mergers and
acquisition. This information will be useful to the following stakeholder groups;
1.5.1 DELL EMC and MEA Management
The material acquired from this study will help DELL EMC to advance knowledge of the
benefits that the company has gained, especially in developing countries, from this
merger and acquisition. The company will be well informed when entering into such
acquisitions in the future.
1.5.2 Strategists
Strategists will be able to appreciate how DELL EMC has constantly persisted ahead in
the market and appreciate the benefits firms can accrue from strategic alliances. Using
this information, they can be able to replicate the same in their organizations.
1.5.3 Regulators
The study will be useful to the government regulators namely the Central Bank of Kenya
(CBK) and the Kenya Revenue Authority (KRA). It will help them in understanding
multinational mergers and acquisitions especially when they are building industry policy
resolutions.
Page 20
7
1.5.4 Academicians and Researchers
The research will contribute to the body of knowledge to academicians and researchers
who would want to further their studies in understanding the competitive advantage
arising from mergers and acquisitions.
1.6 Scope of the Study
The research was limited to the organization of study which is DELL EMC Central East
Africa and the subject of study limited to the employees located at the Nairobi, Kenya
and Lagos, Nigeria. The research was carried out in the month of February 2018. There
was lack of responsiveness from the targeted respondents which had been foreseen as
constraint. This constraint was overcome by providing a pledge to the respondents that
there shall be confidentiality on the feedback they provide and same time anonymity. The
researcher provided a letter of introduction so as to firm up the legitimacy of the study.
1.7 Definition of Terms
1.7.1 Acquisition
An acquisition is the process of acquiring a company to build on strengths or weaknesses
of the acquiring company (Ansoff, 2007).
1.7.2 Mergers
A merger is an absorption of one company by another, with the corporation being
absorbed losing its separate identity and governance (Wittmann, Hunt, & Arnett, 2009).
1.7.3 Organic Growth
According to Ansoff (2007) organic growth is the process of business expansion by
increased output, customer base expansion, or new product development, as opposed to
mergers and acquisitions, which is inorganic growth.
1.7.4 Competitive Advantage
According to Porter (1985), competitive advantage occurs when a company is able either
to operate at a lower cost or price its products at a premium or both resulting in superior
performance.
Page 21
8
1.8 Chapter Summary
This chapter has covered an overview of the research by covering background of the
study which explains on why firms go into acquisitions and mergers and the benefits that
they stem from such strategies. The problem statement has been recognized as deficiency
of adequate knowledge pool on mergers and acquisition in Central East African market.
The drive of the study is to launch the benefits that arise from mergers and acquisitions
which is established through three objectives namely; to determine the benefits of
strategic alliances, the challenges that firms face and to strategies employed to sustain
strategic alliances.
The research is anticipated to be of value to the management of DELL EMC, industry
regulators and researchers. Chapter two will cover literature review with regards to the
specific objectives. The third chapter will cover the research methodology. Chapter four
presents results and findings while chapter five will present summary of findings as well
as discussion and conclusions.
Page 22
9
CHAPTER TWO
2.0 LITERATURE REVIEW
2.1 Introduction
This section evaluates the various views and perspectives of different scholars by the
three specific objectives that are introduced in chapter one. The literature review
comprises of the research objectives. We begin with a theoretical introduction to the
independent variables, Mergers and Acquisitions, and then move on to describe each of
the dependent variables as posed in the research questions. We also look at the critique
raised from each perspective and their limitations. Finally, we present our conclusion to
the research questions, and this forms the first part of our theoretical framework which is
applied in later chapters of the study. At the end of this section, a chapter summary will
be provided.
2.2 Effect of M&A on Product Competitive Advantage
2.2.1 Mergers & Acquisitions
Global changes in technology, communication, transportation, the scope of the market,
forms and intensity of competition have led to the increase in Mergers & acquisitions.
They are used as a faster means of acquiring skills and strength that was lacking in the
organization initially (Gupta, 2010). The term, Mergers and Acquisitions is used in a
manner that leads to a lack of differentiation between each word. We can find distinction
in the works of (Melanie, Minna, & Tuija, 2011; Sherman & Milledge, 2006). A Merger
is a transaction when two companies decide to combine their assets & operations. As a
result of a merger transaction, two individual companies cease to exist and a new
combined company is created (Sherman & Milledge, 2006).
An Acquisition, on the other hand, is when a company purchases a sufficient amount of
an established company to provide control over the acquired company (Melanie, Minna,
& Tuija, 2011). One may also consider an acquisition as a transaction where one
company takeovers the operation of another company. The company, which is acquired,
is called “Target Company” and the company, which acquires the other company, is
called the “Acquirer.” The target company is, therefore, become a part of the acquirer
(Sherman & Milledge, 2006).
Page 23
10
Melanie et al. (2011) classified M&A as one of the strategic options in planning new
business creation with the remaining two being organic investments and Research and
development investment. Ma & Pagán (2009) breaks it down even further viewing M&A
deals like those that the controlling interest amount to 50% of voting shares plus one in
the newly formed business. Ma et al. (2009) also define controlling interest as the case
where a shareholder (or a group of shareholders) holds a sufficient number of voting
shares so that no coalition of shareholders can thwart a motion. In a practical aspect, a
controlling interest is much less than that because it is hardly that 100% of shareholders
will be in elections when shareholding is dispersed.
Moeller et al. (2004) define Mergers and Acquisitions as a transaction in which two
individual business entities are having separate ownership combine and operate as one
entity after the deal. Because of that, M&A’s in this thesis will be used interchangeably
as indicating all transactions in which the businesses of any two companies will be
combined through the purchase the majority of shares or a merged activity. The history of
mergers and acquisitions started in the United States and can be traced back to the 19th
century and this has evolved in different dimensions. According to Zabiholla (2011),
technology, pharmaceutical, financial services and energy resources industries are
predicted to experience an increasing level of M&A at the beginning of 21st century.
Africa is however not an exception to the wave of M&A activities due to activities by
local and global companies. In recent years, mergers and acquisitions (M&A) activities
have become a vital investment channel in Africa for global and regional market players.
The mergers and acquisitions agreements have enabled companies to consolidate their
positions in African markets, thereby helping to improve market access and
competitiveness. (AfDB, 2012). The African Market remains to be a small fraction of the
global market, with North and South Africa having the highest economic activities.
Despite the facts above, the rate of M&A’s in Africa remains steady and resilient because
the attractiveness of the African continent for M&A deals is mainly underpinned by the
high economic growth and the vibrant energy, mining and utility sectors (AfDB, 2012).
Page 24
11
2.2.1.1 Horizontal Mergers and Acquisition
The Federal Trade Commission classified, Mergers and Acquisitions into three main
categories: Horizontal, Vertical, and Conglomerate (Gaughan, 2005). Below is a brief
explication of the kinds of M&A’s possible, though this thesis shall only dig deeper in
Horizontal M&A’s due to the nature of the case study being undertaken. (McCune,
2011).
Horizontal Mergers and Acquisitions are a merger usually between two companies in the
same business sector. Thus these two companies are in direct competition and share the
same product lines and markets. BPP Publishing (2012), stressed that this type of M&A
occurs between company that were formerly competitors and who manufacture products
that are considered substitutes by their buyers with the aim of achieving horizontal
integration. (Brealey, Myers, Allen, & Mohanty, 2007). These mergers can also be called
Strategic Mergers and Acquisition. A strategic acquisition is one in which the acquiring
company can gain operating synergies, which means that the two companies are more
profitable combined than separate within operating areas (Grinblatt & Titman, 2006). It is
important to be aware that not all strategic mergers are legal and therefore some have
been blocked by antitrust regulators (Brealey, Myers, Allen, & Mohanty, 2007).
In this case, synergy can be obtained through many forms including such as; increased
market share, cost savings and exploring new market opportunities. According to
UNCTAD (2006) Horizontal M&A’s are approximately 80 percent of the total M&A’s
transactions. An example of horizontal M&A was the business combination of two
pharmaceutical companies- Pfizer acquired Lipitor, both firms are in the pharmaceutical
industry, and this helped Pfizer to sustain the first position of pharmaceutical company in
the world (Onashile, 2016).
2.2.2 Product Competitiveness leading to Competitive Advantage
In this section, we shall be outlining Product differentiation and the resultant competitive
advantage, and we shall begin by descriptively breaking down the term product
differentiation.
Page 25
12
The product is the central element of a technology company’s compensation logic. The
product, computer hardware, and software, as well as the associated services form an
offer to a company, an individual or a trader. The concept of "product" can be defined in
various ways. Doyle (1998) defines a product as "everything a company can offer to
satisfy customers ' needs or desires." It may be a physical object such as a soft drink or
print paper, but it can also be an intangible service such as technical advice or just-in-
time delivery. The critical point is that the products are not purchased for themselves but
to satisfy a need or need. The product offer may, for example, contain the entire service
product including the technical service, product training, payment terms, promotion, and
distribution, in addition to the physical attributes of the product.
According to Kotler (1998), a product is "anything that can be offered to a market to
attract attention, acquisition, use or consumption, which could satisfy a need or need."
The product is the first and most crucial element of the marketing mix. Kotler (1998)
identifies two levels in a product, which it names the base product and the increased
product. The primary product refers to the minimum benefit provided to meet the basic
needs of the buyer. He answers the question: What does a buyer really buy? These
qualities of products or services usually are considered as acquired and are also the
easiest to copy for competitors. The expanded product provides a range of basic ancillary
services that are not associated with the base product (Haarla, 2003). These include
guarantees, credits, purchasing conditions, customer service, installation, training, advice,
and delivery. These distinguish the offer of the enterprise from competing offers.
Porter argues that companies and their products must be competitive to become an
industry leader (Murdoch, 1999), succeed nationally and internationally (Suutari, 1999).
This benefit applies to all industries in most countries (Median & Chin, 1995). While
various types of organizational strategies have been identified over the years, generic
strategies remain the most commonly supported and identified in key strategic
management manuals (David, 2000) and in the literature (Miller & Dess, 1993).
The competitiveness of the product can be achieved through differentiation. When using
this strategy, an enterprise focuses its efforts on providing a single product or service
(Cross, 1999). Since then, the product or service is unique; this strategy promotes
customer loyalty (Cross, 1999). The differentiation strategy is implemented effectively
Page 26
13
when the enterprise provides a single or higher value to the customer through product
quality, functionality, or after-sales service. Companies that follow a differentiation
strategy can charge a higher price for their products depending on the characteristics of
the product, the delivery system, the quality of the service or the distribution channels.
(Nobel, 2013) The quality can be real or perceived depending on the fashion, the brand or
the image. The differentiation strategy is aimed at an informed or informed consumer,
interested in a single product or quality and willing to pay a higher price (Miller & Dess,
1993).
Cost leadership is also a method by which product competitiveness can be achieved
(Malburg, 2000). This strategy aims to achieve a competitive advantage by having the
lowest costs in the industry (Davidson, 2001). In order to obtain a low-cost advantage, an
organization must have a low-cost leadership strategy, low-cost manufacturing, and a
labour force involved in the low-cost strategy. The organization must be prepared to
terminate all activities for which it does not have a cost advantage and consider
subcontracting activities to other organizations with financial advantage (Malburg, 2000).
For an effective cost leadership strategy, a company must have a significant market share
(Hyatt, 2001). Mass production, mass distribution, economies of scale, technology,
product design, input costs, resource utilization and access to raw materials are cost
factors (Malburg, 2000).
In the concentration strategy, a company targets a specific segment of the market for
product competitiveness (Porter, 1985). The company can choose to focus on a group of
customers, a range of products, a geographic area or a range of services selected (Hyatt,
2001). For example, some European companies only focus on the European market
(Stone, 1995). The emphasis is also placed on the adoption of a narrow competitive field
of application within an industry. It aims to increase its market share by operating in a
niche market or in markets that are not attractive or neglected by large competitors. These
niches are a result of a number of factors, including geography, buyer characteristics and
product specifications or requirements (Porter, 1985).
A combination of different strategies can be used. An organization can also choose a
combination policy by mixing generic policies. For example, a company may choose to
have a targeted differentiation strategy. This means that the organization has a unique
Page 27
14
product offered to a targeted market segment. An organization can also choose to have a
targeted cost management strategy. In this case, an organization would use a targeted cost
leadership strategy on a specific market segment. There is a lot of debate about whether
or not a business can have a low-cost differentiation and leadership strategy at the same
time (Helms, Clay, & Peter, 1997). Porter considered that differentiation and cost control
were mutually exclusive (Porter, 1985).
2.2.3 Mergers and Acquisitions effects on Product Competitive Advantage
A merger or acquisition can have a significant effect on the competitiveness of a
company's products, its prospects for growth and its long-term prospects. But if an
acquisition can transform the acquiring company overnight, there is a significant degree
of risk, as mergers and acquisitions transactions are overall estimated at only 50% chance
of success. In the sections below, we will provide empirical studies that explore the
effects of mergers and acquisitions on mergers and acquisitions on product
competitiveness (Investopedia, 2017).
Studies show that many companies use M&A to develop their product offerings and
surpass their competitors. If it takes years or decades to double the size of a business
through organic growth, it can be done much more quickly through mergers or
acquisitions. They also show that companies can use the above strategy to achieve the
dominance of the sector. Studies also show that integration is a major risk for products
resulting from M&A. In many cases, the integration of the activities of two companies is
proving to be a much more difficult task in practice than it seemed in theory. This could
result in a company's inability to achieve the desired objectives in terms of cost savings
resulting from synergies and economies of scale. A potentially accretive transaction could
be dilutive (Picardo, 2014).
Sheen (2013) states that, on average, research has shown that merging is a good thing in
that profits and stock prices go up. It also notes that mergers have a positive effect on the
competitiveness of products over time, because of the downward trend in product prices,
which leads to lower prices compared to the competition. On average, it takes two to
three years for product convergences and price decreases to take effect (Nobel, 2013).
Quality after fusion does not lead or does not affect the competitiveness of the product.
Page 28
15
After the merger, brand consolidation occurs, companies are most likely to prune brands
if the market is crowded with similar products (Sheen, 2013). This leads to pre-existing
product lines that start acting like an old married couple; They are gradually approaching
each other regarding characteristics and relative reliability, at least in cases where both
companies manufacture the same type of product (Nobel, 2013). For example, "if one
brand of vacuum cleaner had a retractable cord and the other, eventually, after the
merger, they would both have retractable cords," explains Sheen. The reviews conducted
over the years indicated that the overall quality of the products remained constant after
the merger. Although the products become more similar, they do not increase or decrease
constantly regarding quality (Sheen, 2013).
In his study, Cassiman (2006) found that the impact of mergers and acquisitions on
research and product development plus innovation depends on the technological
similarities between the companies involved in a given merger or acquisition and
similarities between the markets in which they operate. Companies operating in
complementary technology sectors have a higher likelihood of achieving long-term
synergies and savings in their R&D as a direct result of their merger. The future
competitiveness of products is established by the competence developed in new
technological fields, the achievement of a critical mass in new technological fields and a
deeper commitment to reuse of technological resources ( Wharton School, 2006).
To make their products more competitive firms merge, and this as well results in growth.
Mergers give the acquiring company the opportunity to gain market share without having
to earn it by doing the job itself-instead, they buy a competitor's business at a price. A
great example of this is HP and 3PAR Inc. Both companies in September, 2010,
announced that they have entered into a definitive agreement under which HP purchased
3PAR (HP, 2010). Combining 3PAR’s leading-edge utility storage products with HP’s
existing storage solutions strengthened HP’s unparalleled storage, server and networking
portfolio. 3PAR accelerated HP’s highly successful converged infrastructure strategy by
driving growth in the fast-growing virtual data center and cloud computing markets
(HPE, 2016).
Disney and Pixar is an example that product quality can go up post-merger. The merger,
which occurred in 2006, not only allowed both to collaborate, but also helped to breathe
Page 29
16
new air into other Disney divisions. First Tangled and more recently frozen have attracted
a lot of attention to the box office and beyond, with Frozen becoming the fifth biggest
operating film globally! (Ruesink, 2015).
2.3 Effect of M&A on Supply Chain Competitive Advantage
2.3.1 Supply Chain Competitive Advantage
The improvement of flexibility and speed of reaction has become increasingly important
to obtain a competitive advantage (Upton, 1997). Responsiveness to the customer is
essential to gain a competitive advantage (Martin & Grbac, 2003). Ellinger (2000) argues
that competitive advantage lies with businesses that meet the needs of customers.
Lummus et al. (2003) argue that in the future, while supply chains compete with other
supply chains, organizations need to understand that reactive supply chains will surpass
those that are less receptive. The creation of reactive supply chains has become a source
of competitive advantage (Lau & Hurley, 2001).
Firms with more responsive supply chains will better adapt to fluctuations in demand and
manage this uncertainty at a lower cost due to the shorter turnaround time (Martin &
Grbac, 2003). Yusuf et al. (1999) argue that lean manufacturing compromises
responsiveness to cost-effectiveness, but agile manufacturers give as much importance to
cost as to responsiveness. Cost and quality have long been integrated into agile,
competitive bases (Yusuf et al., 1999). Gunasekaran and Yusuf (2002) point out that
reactivity without cost-effectiveness is not a real competitive strategy. However, Yusuf et
al. (1999) found that costs and responsiveness do not go hand-in-hand. However, because
of the opposing arguments, we maintain here that, on the whole, the responsiveness of the
supply chain and the competitive advantage are linked positively. Yusuf et al. (1999)
found a strong correlation between responsiveness and time-to-market, reliability,
product innovation and quality.
Towill (1996) suggests that efficient engineering of cycle time reduction will lead to
significant improvements in manufacturing costs and productivity. Towill (1996) further
argues that the reduction of delivery times is the necessary condition for a reactive supply
chain and which also reduces the marketing time. Sharifi and Zhang (2001) stresses that
responsiveness in the supply chain is a source of competitive advantage. A study carried
Page 30
17
out in 1997 Allnoch (1997) from 225 manufacturers revealed that the average companies
needed much more time to respond to the changes in customer demand compared to the
major manufacturers. In some cases, it took up to eight times more time. The study also
found that while the larger manufacturers needed two weeks to meet the increased
production requirements per customer demand, medium businesses required four weeks
to four months. The result? These leading companies have outperformed their peers and
achieved enormous cost savings and other competitive advantages. We are therefore
proposing that the responsiveness of the supply chain reduce costs while creating a
competitive advantage for businesses on other dimensions.
Operational responsiveness will enable companies to compete by costs, quality, time to
market and reliability of delivery. The reactivity of a company's logistical process
(transport and distribution) will allow companies to introduce new products faster than
their main competitors (thus increasing the time to market) and improve the ability of a
company to provide timely the type and volume of product required by customers. (i.e.,
increase the reliability of delivery). The responsiveness of a company's network of
suppliers will improve the company's ability to rapidly introduce new products and
features to the market (competitiveness based on product innovation and marketing) and
Improve delivery times (i.e., increase its delivery reliability) as these companies will have
reactive suppliers. A supply chain characterized by rapid responsiveness to customers
will be competitive regarding time and quality (Li, 2002).
An effective SCM produces a competitive advantage for an enterprise in that it reduces
costs (Martin & Grbac, 2003). It was found that GCA's practices were linked positively
to the competitive advantage (price, quality, reliability of delivery, product innovation
and time to market) in previous documentation (Li, Ragu-Nathan, Rao, & Subba, 2006).
It was pointed out that the practice of supply chain management has become an essential
requirement to remain competitive and to grow economically in the current world race
(Allnoch, 1997).
Larson and Kulchitsky (1998), in an empirical study, discovered that the development of
strategic partnerships with suppliers also led to the profitability of the core business.
Christopher (1992) argues that the higher the collaboration between the supplier and the
customer, the greater the likelihood that the organizations can achieve a competitive
advantage. The extensive coordination with suppliers and their involvement in the
Page 31
18
process of developing new products enhances the ability of firms to develop new high-
performance products and thus gain a competitive advantage over the Market. Ragatz et
al. (2002) have found that integrating suppliers can reduce the costs and quality of
materials, the time and cost of product development and manufacturing costs while
improving functionality. The benefits of supplier participation in the development of new
products include reducing project costs Kessler (2000) and Clark (1989) and improving
the perceived quality of the product (McGinnis & Vallorpa, 1999). A long-term
relationship with the supplier will have a lasting effect on the competitiveness of the
entire supply chain (Larson & Kulchitsky, 1998).
Sharing information (and data) with other parts of the supply chain can be used as a
source of competitive advantage (Jones, 1999). Moreover, Tompkins and Ang (1999)
consider the effective use of relevant, timely and accurate information by members of the
supply chain as a critical factor in competition. Sharing information with vendors has
allowed Dell Corp. To benefit from shorter cycle time (involving faster marketing),
reduced stock (involving cost reduction), and better forecasting. For their part, customers
benefited from a better quality product at a lower price (Magretta, 1998).
Dell’s (pre-merger) initial strategy for Supply chain competitive advantage was to
integrate its direct distribution channel with the new retail distribution. Dell's approach
can be called a push-pull strategy (Smith, 2017). The company offered several options to
customers, business-controlled opportunities but allowing customers to choose a
personalized product. The customer's choice then attracts the computer manufacturer's
request by dictating the necessary parts, components, and consumables in its supply chain
and assembly line. The customer makes a decision, and this decision then determines the
drawn inventory through the supply chain (Chaudhary, 2015). The Dell value chain was a
string that brought value from the vendor to the customer and provides Dell with a
competitive edge. Dell was collaborating with more than 165 000 incoming logistics
distribution partners each year. The company used the Just - in Time (JIT) philosophy in
the processing of input logistics, so Dell could save on the substantial inventory costs and
maintain cost control for the majority of its products and services (Chaudhary, 2015).
EMC's pre-merger supply chain journey started on a steep slope when it suffered its first
annual loss in 1988 (7.8 million USD) when its first disk-based storage product for the
IBM mainframe market failed several Times. It took 18 months (and another 18.5 million
Page 32
19
loss in 1989) before the problem was attributed to disk drives shipped to EMC with face
powder particles (the assemblers were not properly trained) (Press, 2016). In response,
EMC implemented quality and continuous improvement programs at the enterprise level
and became ISO certified. Since then, EMC's supply chain has focused on quality and not
quantity, charging a high price for resilient and innovative technology (Press, 2016).
2.3.2 Mergers and Acquisitions effect on Supply Chain Competitive Advantage
Each merger has significant consequences within supply chains, and the severity of these
consequences can profoundly affect success rates. Mergers and Acquisitions is one of the
most popular expansion strategies in the business world. Like many other strategies,
mergers and acquisitions have their fair share of success and failures (Kogut, 1988).
The Wall Street Journal contributor, Foster Finley, noted that any company that has a
strong focus on manufacturing or distribution should pay particular attention to the
effects of its merger on its supply chain. Finley, who works as general manager of
AlixPartners's "Enterprise improvement" practice, emphasized that supply chains have an
impact on all facets of a company's overall performance. As such, mergers and
acquisitions must report on supply chains in a very direct and targeted manner (Finley,
2015).
The synergy of the supply chain (for example, in terms of the management and/or
distribution of stocks) that merging firms can extract is a particularly important factor in
determining the success or eventual failure of a Merger-acquisition (Zhu, 2012).
Transactions such as Intel Corp. for 16.6 billion of Altera Corp., 17.2 billion of Pfizer
Inc. for Hospira Inc. and the merger of 44.5 billion of HJ Heinz Co. With Kraft Foods
Group all carry important competitive supply-chain considerations. For example, the
acquisition of Adams by Banbury in 2002 was very successful in this regard, with the
merger exceeding 14% of the original performance estimates (Herd, Steger, & Saksena,
2008). On the other hand, after the acquisition of Snappe by Quaker Oats in 1994, it was
not able to consolidate the two operational systems effectively, resulting in a significant
loss for Quaker (Chopra & Meindl, 2010).
The above examples are not isolated incidents. A number of surveys clearly demonstrate
that mergers and acquisitions have a significant positive impact on operations,
particularly inventory management (Saraan & Srai, 2008). It is not surprising that supply
Page 33
20
chain management has a significant effect on the success of mergers since a typical
company owns about 30% of its current assets and perhaps up to 90% of its operating
capital in the Supply Chain (Stevenson and Hojati 2004). More importantly, according to
practitioners, inventory-related supply chain functions account for 30 to 50% of the
savings generated by a successful M&A (Herd et al., 2008).
Finley offered a handful of suggestions as to what needs to be identified and addressed in
order to successfully integrate supply chain management into your overall merger plan
(Finley, 2015). To begin with, a company should spend a lot of time reviewing and
working to understand the intricacies of all the new supply chain structures that were
born as a result of the merger. Leaders should also assess whether there are points in the
supply chain that are duplicated. This allows the elimination of repeated distributors (Li,
Ragu-Nathan, Ragu-Nathan, Rao, & Subba, 2006). More importantly, Finley advised all
amalgamated companies to ensure that employees are assigned to the implementation of
the supply chain plan. This will allow for a transparent and relatively fast transition
(Strategic Sourceror, 2015).
The management of the supply chain of the merger does not stop there. There should be a
series of follow-up evaluations to ensure that the system works well and effectively.
According to Dr. Harpal Singh, in an article for Supply Chain Quarterly, post-merger
supply chain assessments should focus on three major aspects: integration, optimization
and acceptance. The three positions are designed to ensure that supply chain systems
exist at all levels, are in their best light and are widely accepted by the company's supply
chain policy (Harpal, 2009).
2.4 Effect of M&A on Business Model Competitive Advantage
2.4.1 Business Model Competitive Advantage
All authors writing in the field of literature on business models deem it necessary for the
company to have a business model or claim that even if managers cannot express it in
words, all companies have a Business model.
But what kind of business model should the company adopt? What type of business
model leads to success, or in the terminology of this thesis: What kind of business model
leads to a sustainable competitive advantage? (Linder & Cantrell, 2000). Several authors,
Page 34
21
although far from each contributor on the ground, explicitly address this topic-but from
different perspectives. We will set out below these perspectives and allow ourselves to
deal with them under the general term ' success,' although we cannot say whether this
abstraction is necessarily faithful to the intentions of all the authors.
"How do Companies succeed?", asked Linder & Cantrell (2000) and replied: They
choose an effective business model and perform it superbly. And then they renew it when
the competitors threaten the distinctive character. According to the authors, there is no
guarantee of financial success. However, there are three characteristics of a successful
business model: it offers unique value, it is difficult to imitate, and it is rooted in reality?
(Linder & Cantrell, 2000). Walters (2004) also mentions specific attributes of the
business model that the company should focus on. These five characteristics are Cash
flow, ROI, distributed assets (low capital intensity), primary assets and distinctive
capabilities, and firm position in the industry value chain.
Other authors define specific and generic business models and discuss the most
successful model. Zott & Amit (2007) noted that the economic model of "novelty-
oriented," whereby the business model of a company creates a new market or innovates
transactions in existing markets, has an impact on the performance of businesses. In a
subsequent article, they associate this specific economic model with the product market
strategy and argue that the economic model focused on novelty combined with
differentiation, cost control or early entry into the market Improves business performance
(Zott & Amit, 2007).
Schweizer (2005) draws two conclusions on the three most successful economic models.
The first is the Layer Player model, in which a company specializes in a crucial and
value-added step in the value chain of an industry, and the Market Maker model, in
which firms use informational benefits for creating a new layer set in the value chain, can
be profitable for some companies in a specific industry. However, the models also have
enormous risks if competitors catch up because they are based on a technology of skill
enhancement combined with legal protection or tacit/implicit knowledge, which Indeed
function as solid appropriation regimes. Therefore, as a second conclusion, the model
called Orchestrator model, in which a company focuses on one or a few steps in the value
Page 35
22
chain while outsourcing and coordinating others, may have the best long-term potential
Term and the greatest likelihood of becoming a dominant business model design.
Open business models in which companies actively seek, acquire and exploit external
ideas and enable other companies to take advantage of unused internal technology to
allow an organization to create better and Capture Value (Chesbrough, 2007). It fashions
a complete business model Framework (BMF), which will enable you to sequence
possible business models, from basic and invaluable models to advanced and very
valuable models. The most significant achievement is a Level 5 and 6 model, where the
company integrates its innovation process with the business model and where the leading
suppliers and customers are business partners with which the company can share the risks
technical and commercial. However, even if companies reach these levels where the
business model is likely to be very profitable and difficult to imitate, no economic model
lasts forever, according to the author (Chesbrough, 2007).
Remodeling a business model can be characterized as a learning process and facilitates
mapping, which can contribute significantly to success (Chesbrough, 2007). According to
Mitchell and Coles (2003), this process of pursuing innovation in business models is also
a way to upgrade competition. According to the authors, the most successful companies
often bring fundamental improvements to their business models, and the most efficient
companies change models every two or four years. These companies regularly combine
effective and continuous strategies with business model innovations.
Linder & Cantrell (2000) also propose that companies control the ability to change. They
argue that for businesses to thrive, it is essential to experiment with new business models
(Linder & Cantrell, 2000). The best way to do this is to go through the organizational
mindset rather than change the organizational structure, and this "mindset," according to
the authors, is equivalent to the business model of the company. Companies that learn to
manage and integrate different mindsets instead of different organizational blocks can
reap enormous benefits as they avoid the trauma that can be caused by repeated structural
changes.
Davenport et al. (2006) argue that for businesses to be competitive, they must
continuously create and destroy their business models. This means the authors explain
Page 36
23
that companies have to manage a portfolio of multiple business models to avoid fixation
on the existing business model. Also, companies should be able to "unlearn" past
successes and strategic mindsets to prevent historical dependence. It is this process of
systematic reinvention that companies should aim for (Davenport et al., 2006).
Morris et al. (2005) distinguish between generic and unique elements, all of which are
involved in the real economic model. The authors divided the business model into three
levels and the first level, which is dubbed the primary level, contains the essence of the
business model and is generic. The next level, the exclusive level, is where the
application of unique approaches to the fundamental components creates a lasting
advantage. The level of ownership is specific to the strategy, the authors say. The last
level, the level of the rules, is also closely linked to the success of the business model
because that is where certain guidelines are ensured. Systematic adherence to these
fundamental principles can distinguish companies with similar business models (Morris
et al., 2005).
Other authors argue that what constitutes a successful business model depends on the
situation. The choice of an appropriate economic model is based on the context and
business-specific factors according to Mahadevan (2000). The business model is a
contingency model with an optimal operating mode for a specific situation in a particular
market, say Mansfield and Fourie (2004). Kraemer et al. (2000) are studying the case of
Dell and suggest that this is an illustration of how a business model can have inherent
advantages in particular market conditions. Also arguing that it is the context that gives
meaning to the business model (Chaharbaghi et al. 2003). They propose that a change of
context requires a change of economic model. Companies can increase the possibility of
"surviving and thriving" by creating their own formulas for success. The most effective
tool to do this is not the business model itself, but by working with a meta-model and
acknowledging the relationship between the meta level and the micro level (Chesbrough,
2007).
2.4.2 Empirical Studies M&A’s effect on Business Model Competitive Advantage
There is no magic formula for successful M&A’s. Like any other business process, they
are not intrinsically good or bad, just as marketing and R&D are not. Each transaction
must have its own strategic logic. Purchasers in the most successful transactions have
Page 37
24
specific ideas for creating well-articulated value. For less successful transactions, the
strategic reasons-such as pursuing the international scale, filling the gaps in the portfolio
or building a third part of the portfolio-tend to be vague (Goedhart, Koller, & Wessels,
2017).
The empirical analysis of specific competitive advantage acquisition strategies offers
limited vision, largely because of the wide variety of types and sizes of acquisitions and
the objective absence of classification by Strategy (Goedhart, Koller, & Wessels, 2017).
What's more, the announced strategy may not even be the real one: companies generally
talk about all kinds of strategic benefits from acquisitions that are entirely cost-cutting. In
the absence of empirical research, our suggestions for value-creating strategies reflect our
acquisitions with companies (Smith, 2017).
Goedhart states that the strategic rationale for a value-creating acquisition is generally
consistent with at least one of the following six archetypes: improving the performance of
the target company, eliminating excess capacity of an industry, market access for
products, acquiring skills or technologies more quickly or at lower cost than could be
built internally, leveraging enterprise-specific scalability, selecting winners Quickly and
helping them to develop their activities (Goedhart, Koller, & Wessels, 2017).
The news that Dell acquired EMC is déjà vu all over again in the tech industry. Twenty
years ago, IBM purchased Lotus and Compaq bought Digital Equipment Corporation
(DEC). These two stories turned out differently-the first was a success, the second a
failure. As history repeats, what lessons should we remember from the last agreement?
(Gomes-Casseres, 2015). The years 1990 saw a wave of fusion similar to todays. The
result of these waves is always the same-the assets of the companies are remixed.
Increasingly, the competitive advantage arises from the way corporations combine and
recombine resources-theirs and those of their merger and alliance partners. Sometimes,
however, this remixing takes a complicated path (Smith, 2017).
IBM has acquired Lotus to launch into the software business and gain a new orientation.
It was successful for the most part. While the Lotus product suite itself has declined
under Microsoft's pressure, IBM has been able to use the agreement to evolve its own
business into software and services. IBM has transferred its mature material activities to
Page 38
25
focus on new growth sectors; for example, its PC activity was sold to Lenovo (Gomes-
Casseres, 2015).
Compaq has acquired DEC to get into high-end computing and gain in size. They failed,
except that HP bailed them with its even greater acquisition of COMPAQ, again pursuing
the ladder in a mature enterprise (PCs) (Gomes-Casseres, 2015). This second merger has
also failed, according to most accounts, and is back in the news due to the presidential
run by Carly Fiorina. In a reversal of the merger trend, HP is now decomposing to
separate its high-end PC activity. In hindsight, this ‘double’ merger followed by a rupture
seems a convoluted way of accessing a set of viable businesses (Smith, 2017).
There are at least three views one can collude on based on the arguments above. The
strategy behind the agreement is more critical than the details of the deal itself (Gomes-
Casseres, 2015). An acquisition, in itself, is neither good nor bad for the purchaser. (It is
almost always good for the seller, regarding value transferred-otherwise, they would not
sell.) It matters more about what you do with the newly acquired resources. IBM used
Lotus as a springboard in software and was ready to abandon mature businesses.
Compaq, however, tried in vain to use the size to push its hardware into profitability
(Smith, 2017).
2.5 Chapter Summary
This chapter has provided a literature review based on three research questions of the
study. The chapter evaluated the views of various scholars on the effects and benefits of
Product, supply chain, and business-model competitive advantage brought about in
Mergers and acquisitions. Empirical studies were also conducted on Dell EMC’s merger.
The next chapter will discuss the research methodology and design to be used in
conducting the research.
Page 39
26
CHAPTER THREE
3.0 RESEARCH METHODOLOGY
3.1 Introduction
This chapter will provide a discussion on the methodology used to carry out the study
and the choice of research design that was used to undertake the study. It shows the
population of the study and the sampling design which was a description of the sample
size and sampling technique. The chapter further elaborates the rationale for the selection
of the population, sample, sampling design and sampling technique.
3.2 Research Design
Cooper & Schindler (2014) wrote regarding research methodology and espoused that research
design was the plan and structure that was used to analyse the subject matter under study
with the intention of answering the research questions. Burns and Groove (2003) as well,
depict research design as a well-defined plan to navigate your research with a great
amount of control, planning to avoid factors that can negatively impact the study and the
validity of the research. Furthermore, Burns and Bush (2010) define descriptive research
as the set of tools and methods that can be used to describe variables. The descriptive
research design explains the behaviour and characteristics of a population (Sloman,
2010).
Authors and scholars have argued and view this form of research design as mere
description. Good descriptive research was fundamental to the research endeavor and
has contributed greatly to the knowledge of society as a whole (Creswell, 2007). The
advantage of using a descriptive research model was that the data can be easily accessed
through surveys, and therefore can be relatively inexpensive compared to the causal
research model, which was due to the fact that it’s trying to answer the question. "what"
as opposed to”how, when and why” (Shields & Rangarajan, 2013). Employing this
research design, the researcher will conduct a survey on the sample derived from the
population of choice, namely employees of Dell EMC CEA with the dependent
variable being the effect of mergers and acquisitions in organwasations. The
independent variables were the benefits of the mergers and acquisition, the challenges
and critical success factors necessary to sustain the acquisitions and mergers.
Page 40
27
3.3 Population and Sampling Design
3.3.1 Population
According to Cooper & Schindler (2014) a population as applied in research, is the
collection of total elements that one wishes to study and make inferences in a bid to
make derive insight. In this study the population was 40 mid-level managers and 8 top
level managers. These were employees who were directly involved in strategy
formulation and implementation.
Table 3.1: Population Size
Employee Role Number Percentage
Senior Management 8 16.67%
Sales & Pre-Sales Team 20 41.67%
Ancillary Team 20 41.67%
TOTAL 48 100%
3.3.2 Sampling Design
Sampling Design was the procedure that guides the researcher towards selecting the
appropriate sample or as the means by which one selects the primary elements of data
selection and analysis appropriately for research questions (Shields & Rangarajan, 2013).
3.3.2.1 Sampling Frame
The sampling frame was the list of elements from which the sample was drawn from
(Cooper & Schindler, 2014). This definition was further supported by Saunders, Lewis
and Thornhill (2007) which define a survey basis as the complete list of population cases
from which the sample was selected. The sampling framework for this study included all
DELL EMC CEA employees affected in the integration and implementation of the
strategy. These are employees who are in the senior management and intermediate level.
The list of these employees was provided by the Human Resources department at DELL
EMC.
Page 41
28
3.3.2.2 Sampling Technique
This was the method of selecting a sample from the population that was
representative of the characteristics of the total population (Cooper & Schindler, 2014).
This study used the stratified random sampling technique. Stratified random sampling
was a method by which members of a homogeneous group are segmented into different
subgroups, and random samples were taken from subgroups (Saunders, Thornhill, &
Lewis, 2007). Mugenda and Mugenda (1999) define this technique as a process of
dividing members of a population into homogenous subgroups before sampling. The
population will be segmented on level of seniority and role description, as each of these
differ from the other in terms of responsibilities and nature of work. That is a researcher
employed into the organization will have a different experience in comparison to a seller
who directly interacts with the customers.
3.3.2.3 Sample Size
According to Roxy, Olsen and Devore (2008), a sample size was the number of elements
or people in the sample to be studied. Based on the sample size determination formula
by Raosoft Inc (2004),
In this study 100% of the total population was involved. This in turn translated to 48
respondents. According to Mugenda and Mugenda (2003) a sample size of greater than
30% of the population was considered sufficient for the study. The sample size was
distributed across the divisions in the same percentage as the population.
Table 3.2 Sample Size
Department
Role No. Of
Top Level
No. Of Mid-
Level
Total
Sample
Size
Management Management 8 0 8 8
Sales & Presales Pre-Sales 0 7 7 7
Sales 3 11 16 2
Ancillary BDM 0 3 3 3
Services 0 3 3 3
Support 0 3 3 3
Facilities 0 4 4 4
Marketing 0 2 2 2
Channel 0 4 4 4 TOTAL 11 37 48 48
Page 42
29
3.4 Data Collection Methods
Data collection began with the researcher obtaining all the necessary documents,
including a letter of introduction from the university. The researcher also sought to obtain
a hearing from the human and legal resource teams of the selected business units in order
to obtain access to the participants required to acquire the primary data needed to meet
the Research objectives of the study. A structured questionnaire was the tool adopted to
gather the required information. The questions posed in the questionnaires were based on
the research questions raised in the first chapter. The questionnaire built out on Google
Forms were used to collect specific information from the respondents. This approach was
very advantageous as it provided immediate feedback and clarification on the questions
posed to respondents. The questionnaire was comprised of both open ended and close
ended questions. It made use of the five Richter scale i.e. from strongly agree to strongly
disagree.
The questionnaire was composed of four parts; The general information of the
respondents, the level of disturbance, the level of uncertainty, the extent of the short life
cycles of the products in the technological environment as well as the strategic responses.
After obtaining the authorization, the researcher emailed the link to the questionnaires to
the sampled individuals in the selected business units. The use of online questionnaires
should facilitate the data collection process since all selected respondents were contacted
on time. During the distribution of the instruments the goal of the research was explained.
3.5 Research Procedures
A pre-test of the questionnaire was undertaken to certify that the questions was effective
for data collection. A pre-test was conducted using a strategic management professor and
later with three employees of Dell EMC. The comments were based on the quality of the
questionnaire, the length of the questionnaire, the time required to complete the
questionnaire, the clarity of the questions and the relevance of the questions to the
organization. The method used to distribute the questionnaires was email, which had a
link to the Google forms application. After the respondent spent five days with the tool to
ensure that they had enough time to respond, the researcher went forward to collect the
questionnaires. The researcher made follow ups with reminders and calls to ensure that
Page 43
30
the response rate was high. The respondents were assured of the confidentiality and
anonymity of their feedback.
3.6 Data Analysis Methods
Data analysis involves the process of reducing the accumulated information to a
manageable size, summarize the data, and outline the patterns by applying various
statistical techniques with the aim of identifying useful information that can be used for
decision making purposes (Surhone, 2009). The data was prepared for analysis by
editing, coding, transcribing and cleaning the data. Descriptive statistics and dispersion
were used to analyze the data. Inferential statistics in form of correlation analysis was
used to examine the relationships between variables. Data was presented in the form of
figures and tables. Statistical Package for Social Sciences (SPSS) and Microsoft Excel
were the tools used to analyze the data.
3.7 Chapter Summary
The chapter has described the research methodology used to carry out the research. The
research design was descriptive in nature focusing on technology companies operating in
East Africa. The sampling technique, sample size, population and questionnaire as a
primary data collection tool were described. Data collection was carried out via
questionnaires and analyzed through the descriptive statistics while using Microsoft
Excel and SPSSS as the analysis tools from which illustrations shall be obtained in forms
of tables and figures.
Page 44
31
CHAPTER FOUR
4.0 RESULTS AND FINDINGS
4.1 Introduction
This chapter presents the results established from the data analysis done. This included
results relating to the demography and specific research objectives aimed at establishing
the factors affecting strategy implementation at chase Bank.
4.1.1 Response Rate
The research issued a total of 48 questionnaires and a total of 35 were filled and returned
giving a response rate of 73%. This was sufficient for the study as indicated in table 4.1
Table 4.1: Response Rate
Variable Frequency Percentage
Filled and returned 35 73
Non-response 13 27
Total 48 100
4.2 General information
4.2.1 Respondents Gender
An analysis of respondent’s gender indicated that male were the majority at 71%, while
female accounted for 29% as indicated in figure 4.1. This implies that the IT sector is
male dominated.
Figure 4.1: Respondents Gender
Page 45
32
4.2.2 Respondents Age Group
The results established that respondents of the age group 27 - 33 years accounted for
37%, while those of the age group 34 - 40 years were the majority at 43%, it was also
noted that the age group 41 - 47 years had a 17% representation, while those aged above
48 years had a 3% representation as indicated in Figure 4.2. This implies that the sector
has employees with varied ages thus vast experience in the sector.
Figure 4.2: Respondents Age Group
4.2.3 Years of Experience in the IT Field
On evaluating the years of experience in the sector, the findings indicated that
respondents with 0 - 5 years’ experience were 11%, those of 6-10 years were 37%, and
those of 11-15 years, and 15-20 years were 23% respectively. Respondents with over 21
years’ experience accounted for 6%.
Figure 4.3: Years of Experience in the IT Field
Page 46
33
4.2.4 Role in the Firm
Analysis of the role played by the respondents indicated that individuals in management
were 17%, those in ancillary were 14% and the majority were in Sales and Pre-Sales who
accounted for 69% as indicated in Figure 4.4
Figure 4.4: Role in the Firm
4.2.5 Previous Work History
Analysis to investigate respondents work history revealed that 40% of the respondents
had worked at DELL before, while those who had worked at EMC were 54%, and only
6% had worked on either of the firms as indicated in Figure 4.5
Figure 4.5: Company Worked
4.2.6 Years worked in Dell or EMC
Analysis to investigate respondents’ years worked in Dell or EMC revealed that 69% of
the respondents had 0-5 years’ work experience, while those who had worked 6-10 were
Page 47
34
26%, and only 3% had 11-15 years, and 15-20 years’ experience respectively. It was also
revealed that no one had over 21 years’ experience as indicated in Figure 4.6
Figure 4.6: Years worked in Dell or EMC
4.3 Merger Outlook
The study sought to establish the outlook of mergers and to achieve this, the respondents
were required rate the statements and the results are as follows.
4.3.1 Descriptive of Merger Outlook
The study revealed that 49% agreed that merger/acquisition was
necessary . It was also revealed that 37% admitted that the role has
changed (expanded/shrunk/shifted) , in addition, 37% were
uncertain if the like the new role while 29% were uncertain of
benefits having improved (m=.20, sd=1.256). The findings also indicated that 46%
perceived market view is better with the merger . It was also
revealed that the 60% acknowledged that the market lack the understanding about the
value of the new company . On the other hand 49% agreed that the
partners have benefited from the merger . At the same time, 54%
strongly agreed that the merger/acquisition has made Dell EMC competitive
.
In the table below, SD to SA represents Strongly Disagree to Strongly Agree.
Page 48
35
Table 4.2: Descriptive of Merger Outlook
Variable N SD D U A SA Mean SD
The merger/acquisition was
necessary.
35 0% 11% 14% 49% 26% .89 .932
Your role has changed
(expanded/shrunk/shifted)
35 6% 14% 17% 37% 26% .63 1.190
I like the new role. 35 3% 3% 37% 34% 23% .71 .957
The benefits have improved. 35 11% 17% 29% 26% 17% .20 1.256
Perceived market view is that
were better together.
35 3% 3% 11% 46% 37% 1.11 .932
Market understands the value
of the new company.
35 3% 9% 9% 60% 20% .86 .944
Partners have benefited from
the merger.
35 0% 9% 17% 49% 26% .91 .887
The merger/acquisition has
made Dell EMC competitive
35 0% 9% 6% 31% 54% 1.31 .932
4.4 Products Competitive Advantage
The study sought to establish the effects of mergers on products competitive advantage,
by comparing the results before and after the merger. To achieve this, the respondents
were required rate the statements and the results are as follows.
4.4.1 Descriptive of Products Competitive Advantage
The study revealed that they were satisfied with the post-merger product offerings
(m=1.46, sd=.657). The post-merger product offerings gave the company more
Competitive Advantage (m=1.60, sd=.604). Majority also agreed that post-merger
product offerings led/lead to limited reach (m=.91, sd=1.292), and the product offerings
existed at various price points (m=1.09, sd=.702). It was however indicated that pre-
merger product offerings had the right messaging (m=1.26, sd.611). It was also revealed
that after the merger product offerings were limited (m=1.03, sd=1.175). It was also
established that products were more aesthetically designed before the merger (m=1.29,
sd=.860) although after the merger, products were widely known (m=1.46, sd=. 657).
Page 49
36
Table 4.3: Descriptive of Products Competitive Advantage
Variable STAT SD D U A SA Mean SD
I was/am satisfied with the
Product Offerings.
Pre 0% 3% 14% 57% 26% 1.06 .725
Post 0% 0% 9% 37% 54% 1.46 .657
Product offerings gave/give
the company Competitive
Advantage.
Pre 0% 3% 11% 77% 9% .91 .562
Post 0% 0% 6% 29% 66% 1.60 .604
Product offerings led/lead to
limited reach.
Pre 0% 14% 29% 49% 9% .51 .853
Post 0% 3% 11% 60% 26% .91 1.292
Product offerings
existed/exist at various price
points.
Pre 0% 11% 20% 49% 20% .77 .910
Post 11% 3% 9% 37% 40% 1.09 .702
Product offerings had/have
the right messaging.
Pre 0% 0% 9% 57% 34% 1.26 .611
Post 0% 6% 14% 43% 37% 1.11 .867
Product offerings were/are
limited.
Pre 3% 14% 29% 49% 6% .40 .914
Post 6% 6% 14% 29% 46% 1.03 1.175
Products were/are
Aesthetically Designed
Pre 0% 3% 17% 29% 51% 1.29 .860
Post 0% 3% 14% 46% 37% 1.17 .785
Products were/are widely
known.
Pre 0% 3% 11% 51% 34% 1.17 .747
Post 0% 0% 9% 37% 54% 1.46 .657
4.4.2 Paired Sample t Test
A Paired sample t test was done to compare products competitive advantage before and
after the merger. As indicated in Table 4.4, the total population under study was 35
respondents and pre-merger product competitive advantage was distributed with a mean
of 0.54622 and a standard deviation of 0.0924. The post-merger is distributed with a
mean 1.2286 and a standard deviation of 0.0966.
Table 4.4: Paired Samples Statistics of Products Competitive Advantage
Variable Mean N
Std.
Deviation
Std. Error
Mean
Pair 1 Pre product .9214 35 .54662 .09240
Post product 1.2286 35 .57161 .09662
Page 50
37
4.4.3 Paired Samples Correlations of Products Competitive Advantage
A correlation between the paired sample revealed that there was a significant correlation
between the two variables (r=0.431, p=0.010) as indicated in Table 4.5
Table 4.5: Paired Samples Correlations of Products Competitive Advantage
Variable N Correlation Sig.
Pair 1 Pre product & Post product 35 .431 .010
4.4.4 Paired Differences of Products Competitive Advantage
As indicated in Table 4.3, t (34) = -3.045, P value 0.004< 0.05 which means there is a
significant difference between the mean of products competitive advantage before and
after the merger. The mean of the post-merger is 0.30714 higher than the mean of pre-
merger.
Table 4.6: Paired Differences of Products Competitive Advantage
Paired Differences
t df
Sig.
(2-tailed) Mean
Std.
Deviation
Std. Error
Mean
95% Confidence
Interval of the
Difference
Lower Upper
Pair 1 -.30714 .59667 .10086 -.51211 -.10218 -3.045 34 .004
4.5 Supply Chain Competitive Advantage
The study sought to establish the effects of mergers on supply chain competitive
advantage, by comparing the results before and after the merger. To achieve this, the
respondents were required to rate the statements and the results are as follows.
4.5.1 Descriptive of Supply Chain Competitive Advantage
The results established that they were more satisfied with the facets of the supply chain
interacted with in the pre-merger (m=1.03, sd=.785). The supply chain after the merger
gives the company competitive advantage (m=1.03, sd=.822). It was also established that
respondents were satisfied with post-merger reach of the partner network (m=.83,
sd=1.150) and skill set of the Partner network (m=.11, sd=1.157). The respondents also
indicated that the partner network was satisfied with the pre-merger partner program
(m=63, sd=.808). They were also satisfied with the pre-merger expediency of the
Logistics team (speed/delays/ responsiveness) (m=.69, sd=.993) and accuracy of the
Page 51
38
Logistics team (m=74, sd= .919) and the simplicity of the ordering system (m=.74,
sd=.980).
Table 4.7: Descriptive of Supply Chain Competitive Advantage
Variable STAT SD D U A SA Mean SD
I was/am satisfied with
the facets of the Supply
Chain I interacted with.
Pre 0% 6% 11% 57% 26% 1.03 .785
post 0% 11% 20% 51% 17% .74 .886
The Supply Chain
gave/gives the company
Competitive Advantage.
Pre 0% 0% 26% 49% 26% 1.00 .728
post 0% 3% 23% 43% 31% 1.03 .822
I was/am satisfied with
the reach of the Partner
network.
Pre 0% 20% 17% 54% 9% .51 .919
post 6% 9% 14% 40% 31% .83 1.150
I was/am satisfied with
the skill set of the
Partner network.
Pre 6% 26% 37% 29% 3% -.03 .954
post 11% 17% 29% 34% 9% .11 1.157
The Partner Network
was/is satisfied with the
Partner Program.
Pre 0% 9% 31% 49% 11% .63 .808
post 0% 17% 34% 37% 11% .43 .917
I am satisfied with the
expediency of the
Logistics team. (speed/
responsiveness)
Pre 3% 9% 26% 43% 20% .69 .993
post 3% 14% 40% 34% 9% .31 .932
I am satisfied with the
accuracy of the Logistics
team.
Pre 0% 9% 31% 37% 23% .74 .919
post 3% 11% 31% 43% 11% .49 .951
I was/am satisfied with
the simplicity of the
Ordering system.
Pre 3% 6% 29% 40% 23% .74 .980
post 6% 14% 31% 31% 17% .40 1.117
4.5.2 Paired Sample T-test
A Paired sample t test was done to compare supply chain advantage before and after the
merger. As indicated in Table 4.8, the total population under study was 35 respondents
and pre-merger supply chain competitive advantage was distributed with a mean of
0.6643 and a standard deviation of 0.1051. The post-merger is distributed with a mean
0.5429 and a standard deviation of 0.12094
Table 4.8: Paired Samples Statistics of Supply Chain Competitive Advantage
Variable Mean N
Std.
Deviation Std. Error Mean
Pair 1 Pre supply chain .6643 35 .62188 .10512
Post supply chain .5429 35 .71547 .12094
Page 52
39
4.5.3 Paired Samples Correlations of Supply Chain Competitive Advantage
A correlation between the paired sample revealed that there was a significant correlation
between the two variables (r=0.745, p=0.000) as indicated in Table 4.9
Table 4.9: Paired Samples Correlations of Supply Chain Competitive Advantage
Variable N Correlation Sig.
Pair 1 Pre supply chain & Post
supply chain
35 .745 .000
4.5.4 Paired Differences of Supply Chain Competitive Advantage
As indicated in Table 4.10, , which means there
is no significant difference between the mean of supply chain competitive advantage
before and after the merger. The mean of the post-merger is 0.12143 lower than the mean
of pre-merger.
Table 4.10: Paired Differences of Supply Chain Competitive Advantage
Paired Differences
t df
Sig.
(2-tailed) Mean
Std.
Deviation
Std. Error
Mean
95% Confidence
Interval of the
Difference
Lower Upper
Pair 1 .12143 .48553 .08207 -.04536 .28821 1.480 34 .148
4.6 Business Model Competitive Advantage
The study sought to establish the effects of mergers on business model competitive
advantage, by comparing the results before and after the merger. To achieve this, the
respondents were required to rate the statements and the results are as follows.
4.6.1 Descriptive of Business Model Competitive Advantage
The finding revealed that respondents were satisfied with the business model however the
pre-merger was higher . It was however revealed that the post-
merger business model gave the company more competitive advantage
Page 53
40
and the business model led to limited reach
. Despite this the go to market Strategy was/is well
communicated in the pre-merger , and is well implemented
. It was however revealed that majority disagreed that the
business Model was complex and in the post-merger it was
revealed that the business model adapted to market needs . The
business model was more understood by partner network in the pre-merger
.
Table 4.11: Business Model Competitive Advantage
Variable STAT SD D U A SA Mean SD
I was/am satisfied with
the Business Model
Pre 0% 3% 6% 49% 43% 1.31 .718
Post 0% 3% 9% 63% 26% 1.11 .676
Business Model
gave/gives the
company Competitive
Advantage
Pre 0% 3% 9% 54% 34% 1.20 .719
Post 0% 3% 3% 51% 43% 1.34 .684
Business Model
led/leads to limited
reach.
Pre 3% 14% 26% 31% 26% .63 1.114
Post 6% 6% 11% 37% 40% 1.00 1.138
Go to market Strategy
was/is well
communicated
Pre 0% 3% 11% 51% 34% 1.17 .747
Post 0% 9% 14% 51% 26% 1.03 .891
Go to market Strategy
was/is well
implemented.
Pre 0% 6% 11% 51% 31% 1.09 .818
Post 0% 9% 11% 49% 31% .94 .873
Business Model was/is
complex.
Pre 9% 34% 23% 29% 6% -.11 1.105
Post 0% 34% 23% 26% 17% .26 1.120
Business Model
adapted to market
needs.
Pre 0% 6% 17% 57% 20% .91 .781
Post 0% 3% 23% 46% 29% 1.00 .804
Business Model was/is
well understood by
Partner Network.
Pre 0% 9% 14% 66% 11% .80 .759
Post 0% 14% 31% 34% 20% .60 .976
Page 54
41
4.6.2 Paired Sample t Test
A Paired sample t test was done to compare business model competitive advantage before
and after the merger. As indicated in Table 4.12, the total population under study was 35
respondents and pre-merger business model competitive advantage was distributed with a
mean of 0.8750 and a standard deviation of 0.53379. The post-merger is distributed with
a mean 0.9107 and a standard deviation of 0.55454
Table 4.12: Paired Samples Statistics of Business Model Competitive Advantage
Variable Mean N
Std.
Deviation Std. Error Mean
Pair 1 Pre Business Model .8750 35 .53379 .09023
Post Business Model .9107 35 .55454 .09373
4.6.3 Paired Samples Correlations of Business Model Competitive Advantage
A correlation between the paired sample revealed that there was no significant correlation
between the two variables as indicated in Table 4.13
Table 4.13: Paired Samples Correlations of Business Model Competitive Advantage
Variable N Correlation Sig.
Pair 1 Pre Business Model & Post
Business Model
35 .613 .000
4.6.4 Paired Differences of Business Model Competitive Advantage
As indicated in Table 4.14, , which means there
is no significant difference between the mean of business model competitive advantage
before and after the merger. The mean of the post-merger is 0.0.3571 higher than the
mean of pre-merger.
Table 4.14: Paired Differences of Business Model Competitive Advantage
Paired Differences
t df
Sig.
(2-tailed) Mean
Std.
Deviation
Std. Error
Mean
95% Confidence
Interval of the
Difference
Lower Upper
Pair 1 -.03571 .47894 .08096 -.20024 .12881 -.441 34 .662
Page 55
42
4.7 Correlation Analysis
4.7.1 Correlation of Merger Objective and Pre-merger Co Factors
A Pearson correlation analysis was done to establish the relationship between the merger
objective and pre-merger co factors and the result established a positive and significant
relationship between merger objective and product competitive advantage
; supply chain competitive advantage ;
and Business Model . All the variables were significant as
indicated in table 4.15. Therefore, an increase in combined variables of product
competitive advantage, supply chain competitive advantage and Business Model lead to
achievement of merger objective.
Table 4.15: Correlation of Merger Objective and Pre-Merger Co Factors
Merger
Objective
Pre
Product
Pre
Supply
Pre Business
Model
Merger Objective Pearson Correlation 1
Sig. (2-tailed)
Pre Product Pearson Correlation .379* 1
Sig. (2-tailed) .025
Pre Supply Pearson Correlation .593** .410* 1
Sig. (2-tailed) .000 .015
Pre Business Model Pearson Correlation .462** .502** .588** 1
Sig. (2-tailed) .005 .002 .000
N 35 35 35 35
*. Correlation is significant at the 0.05 level (2-tailed).
**. Correlation is significant at the 0.01 level (2-tailed).
4.7.2 Correlation of Merger Objective and Post-Merger Co Factors
A Pearson correlation analysis was done to establish the relationship between the merger
objective and post-merger co factors and the result established a strong positive and
significant relationship between merger objective and product competitive advantage
; supply chain competitive advantage ;
and business model . All the variables were significant as
indicated in table 4.16. Therefore, an increase in combined variables of product
Page 56
43
competitive advantage, supply chain competitive advantage and business model lead to
achievement of post-merger objective.
Table 4.16: Correlation of Merger Objective and Post-merger Co Factors
Merger
Objective
Post
Product
Post
Supply
Post Business
Model
Merger Objective Pearson Correlation 1
Sig. (2-tailed)
Post Product Pearson Correlation .525** 1
Sig. (2-tailed) .001
Post Supply Pearson Correlation .575** .339* 1
Sig. (2-tailed) .000 .046
Post Business Model Pearson Correlation .586** .694** .552** 1
Sig. (2-tailed) .000 .000 .001
N 35 35 35 35
**. Correlation is significant at the 0.01 level (2-tailed).
*. Correlation is significant at the 0.05 level (2-tailed).
4.8 Chapter Summary
This chapter has highlighted results and findings as established from the data analysis
done. The first section provided an analysis of demographic data of the respondents, the
second section dealt with data on product competitive advantage, the third section looked
at the data on supply chain competitive advantage, and the fourth section covered issues
of business model competitive advantage. In chapter five this results will be discussed
and relevant conclusions and recommendations made with regard to mergers.
Page 57
44
CHAPTER FIVE
5.0 DISCUSSION, CONCLUSIONS AND RECOMMENDATIONS
5.1 Introduction
This section will seek to analyse the findings and this will be done by comparing and
contrasting with previous literature related to mergers and acquisitions. This will be
organized based on the specific research questions which sought to establish the effects
of M&A on product competitive advantage, effect of M&A on supply chain competitive
advantage and effects of M&A on business model competitive advantage.
5.2 Summary
The purpose of this study was to analyze competitive advantage (or lost) gained due to
mergers and acquisitions: A Case of Dell EMC Central East Africa (CEA). To achieve
this objective, the study was guided by three specific objectives which sought to establish
the effects of M&A on product competitive advantage, effect of M&A on supply chain
competitive advantage and the effects of M&A on business model competitive advantage.
A descriptive research was adopted to aid in the data collecting from respondents on their
perceptions on competitive advantage (or lost) gained due to mergers and acquisitions.
Further, a correlational approach was adopted to establish the relationship between the
M&A and product competitive, supply chain and business model competitive advantage.
The target population for this study was 40 mid-level managers and 8 top level managers.
These are employees who are directly involved in strategy formulation and
implementation. A structured questionnaire was the tool adopted to gather the required
information. The questions posed in the questionnaires were based on the research
questions raised in the first chapter. The questionnaire built out on Google Forms were
used to collect specific information from the respondents.
The sampling technique was stratified random sampling method. This entailed dividing
the population into mutually exclusive groups, in this case heads of department, managers
and assistant managers. Then random samples were drawn from each group. From the
initial target population of 48 questionnaires awarded only 35 were filled and returned
giving a response rate of 73%.
Page 58
45
The study revealed that respondents were satisfied with the post-merger product offerings
which gave the company more competitive advantage. Majority also agreed that the
product offerings existed at various price points although the pre-merger product
offerings had the right messaging. It was also revealed that after the merger product
offerings were limited and the products were more aesthetically designed before the
merger although after the merger, products were widely known. A Paired sample t test
was done to compare products competitive advantage before and after the merger and
pre-merger product competitive advantage. The difference revealed that
which means there is a significant difference
between the mean of products competitive advantage before and after the merger.
The study sought to establish the effects of mergers on supply chain competitive
advantage, by comparing the results before and after the merger. The results established
that they were more satisfied with the facets of the supply chain interacted with in the
pre-merger. The supply chain after the merger gives the company competitive advantage.
It was also established that respondents were satisfied with post-merger reach of the
partner network and skill set of the Partner network. The respondents also indicated that
the partner network was satisfied with the pre-merger partner program. They were also
satisfied with the pre-merger expediency of the Logistics team
(speed/delays/responsiveness) and accuracy of the Logistics team and the simplicity of
the ordering system). A Paired sample t test was done to compare supply chain advantage
before and after the merger. A correlation between the paired sample revealed that there
was a significant correlation between the two variables . The
difference revealed that which means there is
no significant difference between the mean of supply chain competitive advantage before
and after the merger.
The study sought to establish the effects of mergers on business model competitive
advantage, by comparing the results before and after the merger. The finding revealed
that respondents were satisfied with the business model however the pre-merger was
higher. It was however revealed that the post-merger business model gave the company
more competitive advantage and the business model led to limited reach. Despite this the
go to market Strategy was/is well communicated in the pre-merger, and is well
implemented. It was however revealed that majority disagreed that the business Model
Page 59
46
was complex and in the post-merger it was revealed that the business model adapted to
market needs. The business model was more understood by partner network in the pre-
merger. A Paired sample t test was done to compare business model competitive
advantage before and after the merger. A correlation between the paired sample revealed
that there was no significant correlation between the two variables
.
The difference revealed that which means
there is no significant difference between the mean of business model competitive
advantage before and after the merger. The mean of the post-merger is 0.0.3571 higher
than the mean of pre-merger. A Pearson correlation analysis was done to establish the
relationship between the merger objective, and factors before and after the merger and the
result established a positive and significant relationship between pre-merger and post-
merger. Therefore, an increase in combined variables of product competitive advantage,
supply chain competitive advantage and business model lead to achievement of a firm
before and after the merger.
5.3 Discussion
5.3.1 Effects of M&A on Product Competitive Advantage
The study revealed that respondents were satisfied with the post-merger product offerings
which gave the company more competitive advantage. Picardo (2014) agrees that
companies use M&A to develop their product offerings and surpass their competitors. If
it takes years or decades to double the size of a business through organic growth, it can be
done much more quickly through mergers or acquisitions. They also show that companies
can use the above strategy to achieve the dominance of the sector. Majority also agreed
that the product offerings existed at various price points although the pre-merger product
offerings had the right messaging.
It was also revealed that after the merger product offerings were limited. Quality after
fusion does not lead or does not affect the competitiveness of the product. Sheen (2013)
expounds that after the merger, brand consolidation occurs, companies are most likely to
prune brands if the market is crowded with similar products. Sheen (2013) adds that this
leads to pre-existing product lines that start acting like an old married couple; They are
gradually approaching each other regarding characteristics and relative reliability, at least
Page 60
47
in cases where both companies manufacture the same type of product. Nobel (2013) adds
that past reviews conducted over the years indicate that the overall quality of the products
remained constant after the merger. Although the products become more similar, they do
not increase or decrease constantly regarding quality (Sheen, 2013).
The findings indicated that the products were more aesthetically designed before the
merger although after the merger, products were widely known. Picardo (2014) studies
also show that integration is a major risk for products resulting from M&A. In many
cases, highlights that the integration of the activities of two companies is proving to be a
much more difficult task in practice than it seemed in theory. This could result in a
company's inability to achieve the desired objectives in terms of cost savings resulting
from synergies and economies of scale. A potentially accretive transaction could be
dilutive (Picardo, 2014).
A Paired sample t test was done to compare products competitive advantage before and
after the merger it was revealed that there was a significant difference between the mean
of products competitive advantage before and after the merger. Sheen (2013) states that,
on average, research has shown that merging is a good thing in that profits and stock
prices go up. It also notes that mergers have a positive effect on the competitiveness of
products over time, because of the downward trend in product prices, which leads to
lower prices compared to the competition. On average, it takes two to three years for
product convergences and price decreases to take effect (Nobel, 2013).
In his study, Cassiman (2006) found that the impact of mergers and acquisitions on
research and product development plus innovation depends on the technological
similarities between the companies involved in a given merger or acquisition and
similarities between the markets in which they operate. Companies operating in
complementary technology sectors have a higher likelihood of achieving long-term
synergies and savings in their R&D as a direct result of their merger. The future
competitiveness of products is established by the competence developed in new
technological fields, the achievement of a critical mass in new technological fields and a
deeper commitment to reuse of technological resources ( Wharton School, 2006).
Page 61
48
5.3.2 Effect of M&A on Supply Chain Competitive Advantage
The results established that supply chain after the merger gives the company competitive
advantage. Empirical literature suggest that the improvement of flexibility and speed of
reaction has become increasingly important to obtain a competitive advantage (Upton,
1997). Responsiveness to the customer is essential to gain a competitive advantage
(Martin & Grbac, 2003). Ellinger (2000) argues that competitive advantage lies with
businesses that meet the needs of customers. Zhu (2012) states that the synergy of the
supply chain (for example, in terms of the management and/or distribution of stocks) that
merging firms can extract is a particularly important factor in determining the success or
eventual failure of a Merger-acquisition.
It was also established that respondents were satisfied with reach of the partner network
and skill set of the Partner network. Firms with more responsive supply chains will better
adapt to fluctuations in demand and manage this uncertainty at a lower cost due to the
shorter turnaround time (Martin & Grbac, 2003). Yusuf et al. (1999) argue that lean
manufacturing compromises responsiveness to cost-effectiveness, but agile
manufacturers give as much importance to cost as to responsiveness. Cost and quality
have long been integrated into agile, competitive bases (Yusuf et al., 1999).
The findings indicated that the partner network was satisfied with the partner program.
Larson and Kulchitsky (1998), in an empirical study, discovered that the development of
strategic partnerships with suppliers also led to the profitability of the core business.
Christopher (1992) argues that the higher the collaboration between the supplier and the
customer, the greater the likelihood that the organizations can achieve a competitive
advantage. The extensive coordination with suppliers and their involvement in the
process of developing new products enhances the ability of firms to develop new high-
performance products and thus gain a competitive advantage over the Market. Ragatz et
al. (2002) have found that integrating suppliers can reduce the costs and quality of
materials, the time and cost of product development and manufacturing costs while
improving functionality. The benefits of supplier participation in the development of new
products include reducing project costs (Kessler, 2000; Clark, 1989) and improving the
perceived quality of the product (McGinnis & Vallorpa, 1999). A long-term relationship
with the supplier will have a lasting effect on the competitiveness of the entire supply
chain (Larson & Kulchitsky, 1998).
Page 62
49
Majority of the respondents were satisfied with the pre-merger expediency of the
Logistics team, accuracy of the logistics team and the simplicity of the ordering system.
Towill (1996) suggests that efficient engineering of cycle time reduction will lead to
significant improvements in manufacturing costs and productivity. Towill (1996) further
argues that the reduction of delivery times is the necessary condition for a reactive supply
chain and which also reduces the marketing time. Sharifi and Zhang (2001) stresses that
responsiveness in the supply chain is a source of competitive advantage. A study carried
out by Allnoch (1997) from 225 manufacturers revealed that the average companies
needed much more time to respond to the changes in customer demand compared to the
major manufacturers. In some cases, it took up to eight times more time. The study also
found that while the larger manufacturers needed two weeks to meet the increased
production requirements per customer demand, medium businesses required four weeks
to four months.
A Paired sample t test revealed that there is no significant difference between the mean
of supply chain competitive advantage before and after the merger. An effective SCM
produces a competitive advantage for an enterprise in that it reduces costs (Martin &
Grbac, 2003). It was found that GCA's practices were linked positively to the competitive
advantage (price, quality, reliability of delivery, product innovation and time to market)
in previous documentation (Li, Ragu-Nathan, Ragu-Nathan, Rao, & Subba, 2006). It was
pointed out that the practice of supply chain management has become an essential
requirement to remain competitive and to grow economically in the current world race
(Allnoch, 1997).
5.3.3 Effects of M&A on Business Model Competitive Advantage
The finding revealed that respondents were satisfied with the business model however the
pre-merger was higher. According to Mitchell and Coles (2003), this process of pursuing
innovation in business models is also a way to upgrade competition. According to the
authors, the most successful companies often bring fundamental improvements to their
business models, and the most efficient companies change models every two or four
years. These companies regularly combine effective and continuous strategies with
business model innovations.
It was however revealed that the post-merger business model gave the company more
competitive advantage and the business model led to limited reach. It takes time to learn
Page 63
50
and Chesbrough (2007) explains that modeling a business model can be characterized as
a learning process and facilitates mapping, which can contribute significantly to success.
Linder & Cantrell (2000) also propose that companies control the ability to change. They
argue that for businesses to thrive, it is essential to experiment with new business models
(Linder & Cantrell, 2000). The best way to do this is to go through the organizational
mindset rather than change the organizational structure, and this "mindset," according to
the authors, is equivalent to the business model of the company. Companies that learn to
manage and integrate different mindsets instead of different organizational blocks can
reap enormous benefits as they avoid the trauma that can be caused by repeated structural
changes.
It was however revealed that majority disagreed that the business model was complex.
Davenport et al. (2006) argue that for businesses to be competitive, they must
continuously create and destroy their business models. This means the authors explain
that companies have to manage a portfolio of multiple business models to avoid fixation
on the existing business model. Also, companies should be able to "unlearn" past
successes and strategic mindsets to prevent historical dependence. It is this process of
systematic reinvention that companies should aim for (Davenport et al., 2006).
The study revealed that the business model adapted to market needs. Other authors also
acknowledge that what constitutes a successful business model depends on the situation.
The choice of an appropriate economic model is based on the context and business-
specific factors according to Mahadevan (2000). The business model is a contingency
model with an optimal operating mode for a specific situation in a particular market, say
Mansfield and Fourie (2004). Kraemer et al. (2000) are studying the case of Dell and
suggest that this is an illustration of how a business model can have inherent advantages
in particular market conditions. Also arguing that it is the context that gives meaning to
the business model (Chaharbaghi et al. 2003). They propose that a change of context
requires a change of economic model. Companies can increase the possibility of
"surviving and thriving" by creating their own formulas for success. The most effective
tool to do this is not the business model itself, but by working with a meta-model and
acknowledging the relationship between the meta level and the micro level (Chesbrough,
2007).
A Paired sample t test was done to compare business model competitive advantage before
and after the merger. The findings revealed that there is no significant difference between
Page 64
51
the mean of business model competitive advantage before and after the merger. Linder
and Cantrell (2000) explain that institutions choose an effective business model and
perform it superbly. And then they renew it when the competitors threaten the distinctive
character. According to the authors, there is no guarantee of financial success. However,
a successful business model offers unique value, it is difficult to imitate, and it is rooted
in reality (Linder & Cantrell, 2000).
5.4 Conclusion
5.4.1 Effects of M&A on Product Competitive Advantage
Post-merger product offerings have the capability of offering the company more
competitive advantage. The product offerings are usually in a wide variety at various
price points although pre-merger product offerings had the right messaging. After a
merger product offerings become limited as compared to the pre-merger where products
are more aesthetically designed. The findings also reveal that after the merger, products
are widely known. There is a significant difference between a products competitive
advantage before and after the merger.
5.4.2 Effect of M&A on Supply Chain Competitive Advantage
The facets of the supply chain interacted with in the pre-merger are more preferred by
respondents although it is correct to indicate that the supply chain after the merger gives
the company more competitive advantage. Mergers add the reach of the partner network
and skill set of the Partner network therefore result into increased competitiveness.
Merger at Dell have incorporate existing pre-merger partner program, expediency of the
logistics team and accuracy of the logistics team and the simplicity of the ordering system
thus there is no significant difference between the mean of supply chain competitive
advantage before and after the merger.
5.4.3 Effects of M&A on Business Model Competitive Advantage
Post-merger business model offers institutions with a more competitive advantage as it
allows for an effective communication and implementation of the go to market Strategy.
Business model are also adapted to market needs. The business model was more
understood by partner network in the pre-merger. As a result, there means no significant
difference between the mean of business model competitive advantage before and after
the merger.
Page 65
52
5.5 Recommendation
5.5.1 Recommendation for Improvement
5.5.1.1 Effects of M&A on Product Competitive Advantage
After undergoing an M&A the product offerings needs to be able to satisfy the
customers’ needs to ensure the exercise results into gain of competitive advantage. To
capture more market, the product offerings should exist at various price points, possess
the right messaging and are aesthetically designed to meet the customer’s needs. This
ensures continuity as the products become widely known.
5.5.1.2 Effect of M&A on Supply Chain Competitive Advantage
The facets of the supply chain should be stable to ensure products reach the consumers
conveniently. This aids the firm in gaining a competitive advantage. Partner network
should always be maintained and this will ensure the firm can connect with other partners
and therefore share the skill set of the partner network. There is a need to maintain a
synergy between the key departments after the mergers.
5.5.1.3 Effects of M&A on Business Model Competitive Advantage
Business model used before and after the mergers should be one that ensures the firm
enjoys a competitive advantage. There is also a need to communicate the market strategy
adopted, and this helps the institution in the implementation. The business model also
need to be one that is very simple and capable of adaptation to the market needs. The
should also be training if need be to ensure that the business model is well understood by
partner network.
5.5.2 Recommendation for Further Research
Further research should be done on other firms that have experiences mergers in the same
industry in order to be able to compare the results and therefore generalize the findings.
There is also a need for further research to establish the challenges and risks faced before
and after the merger.
Page 66
53
REFERENCES
AfDB. (2012). Mergers and Acquisitions in Africa. Retrieved from African Development
Bank Group: https://www.afdb.org/en/blogs/afdb-championing-inclusive-growth-
across-africa/post/mergers-and-acquisitions-in-africa-10163/
Alistair, M., & Mclean, A. (2010). Merger as Conversation. Leadership and Organization
Development Journal, 33, 534-550.
Allnoch, A. (1997). Efficient Supply Chain Practices Mean Big Savings to Leading
Manufacturers. IIE Solutions, 8-9.
Amorós, L. A., & Dalmau , J. R. (2012). The Impact Of Mergers And Acquisitions On
Brand Value In The Hotel Sector During The Economic Crisis In Spain. A Case
Study Of Nh Hoteles & Hesperia. Halmstad: Halmstad University.
Ansoff, I. (2007). Strategic Management. London, UK: Palgrave Macmillan.
Boateng, A., & Bjørtuft, V. (2008). Firm characteristics and Motives for Mergers and
Acquisitions in Norway. Leeds: Leeds Metropolitan University.
BPP Learning Media. (2012). Advanced Financial Management. London: BPP Learning
Media Ltd.
Brannen, M., & Peterson, M. (2009). Merging Without Alienating: Intervention
Promoting Cross-Cultural Organization, Intergration and their Limitations.
Journal of International Business Studies, 40, 468-489.
Brealey, R. A., Myers, S. C., Allen, F., & Mohanty. (2007). Principles of corporate
finance. NJ: McGraw Hill.
Burns, A. C., & Bush, R. F. (2010). Marketing Research, 6th Edition, textbook and
instructor’s Manual. New Jersey; NY: Prentice Hall.
Burns, N., & Groove, S. K. (2003). Understanding Nursing Research. 3rd Ed.
Philadelphia, PA: West Publishers. Philadelphia, PA: West Publishers.
Cassiman, B., & Colombo, M. G. (2006). Mergers & Acquisitions: The Innovation
Impact. Madrid: Edward Elgar.
Page 67
54
Cattanach, S. (2007, June 11). Desert News. Retrieved from Dell to sell computers at
Sam's Club stores: https://www.deseretnews.com/article/660228073/Dell-to-sell-
computers-at-Sams-Club-stores.html
Chaharbaghi, K., Fendt, C., & Willis, R. (2003). Meaning, legitimacy and impact of
business models in fast-moving environments. Management Decision, 372.
Chaudhary, A. (2015, December 19). DELL Supply Chain Management. Retrieved from
Slideshare: https://www.slideshare.net/pari4ash/dell-supply-chain-management-
56296715
Chesbrough, H. (2007). Why Companies Should Have Open Business Models. MIT
Sloan Management Review, 22-28.
Chopra, S., & Meindl, P. (2010). Supply Chain Management: Strategy, Planning and
Operations. Prentice Hall.
Christopher, M. G. (1992). Logistics and Supply Chain Management. London, UK:
Pitman Publishing.
Cooper, D. R., & Schindler, P. (2014). Business Research Methods. New York, NY:
McGraw- Hill.
Cooper, D. R., & Schindler. (2014). Business Research Methods. New York, NY:
Mcgraw- Hill.
Creswell, J. (2007). Quantitative Inquiry and Research Design. New York; NY: Sage.
Cross, L. (1999). Strategy drives marketing success. Graphic Arts Monthly, 96.
CXOtoday. (2015, October 09). 4 Reasons Dell-EMC Deal Makes Sense; One Reason It
Doesn't. Retrieved from CXOtoday: http://www.cxotoday.com/story/3-reasons-
dell-emc-deal-makes-sense-and-one-reason-why-it-doesnt/
Darrow, B. (2015, October 30). Bye-bye HP, it's the end of an era. Retrieved from
Fortune: http://fortune.com/2015/10/30/bye-bye-hp/
Darwin, C. (1998). The Origin of Species (Classics of World Literature). London, UK:
Wordsworth Editions.
Das, B., Raskhit, D., & Debasish, S. S. (2009). Corporate Restructuring: Mergers,
Acquisition and Other Forms. Mumbai: Himalaya Publishing.
Page 68
55
David, F. (2000). Strategic Management Concepts and Cases. New Jersey, NJ: Prentice-
Hall, Englewood Cliffs.
Davidson, S. (2001). Seizing the Competitive Advantage. Community Banker, 32-34.
Dell. (2016, September 7). Historic Dell and EMC Merger Complete; Forms World’s
Largest Privately Controlled Tech Company. Retrieved from Dell:
http://www.dell.com/learn/us/en/uscorp1/secure/2016-09-07-historic-dell-emc-
merger-complete
Dell. (2017). Company Information. Retrieved from Dell: www.dell.com
Devanport, T., Leibold, M., & Voelpel, S. (2006). Strategic management in the
innovation economy : strategy approaches and tools for dynamic innovation
capabilities. Erlangen ; Great Britain: Publicis.
Doyle, D. P. (1998). Adding value to marketing: the role of marketing in today's profit-
driven organization. London: Kogan Page.
Drucker, P. F. (1994). Managing in Turbulent Times. Boston, USA: Butterworth
Heinemann.
Ellinger, A. E. (2000). Improving Marketing/Logistics Cross-Functional Collaboration in
Supply Chain. Industrial Marketing Management, 29, 85-96.
Finley, F. (2015, October 5). Guest Voices: Overcoming the Challenges of Merging
Supply Chains. Retrieved from The Wall Street Journal:
https://www.wsj.com/articles/guest-voices-overcoming-the-challenges-of-
merging-supply-chains-1444070054
Gaughan, P. A. (2005). Mergers, acquisitions and corporate restructuring. John Wiley &
Sons.
Goedhart, M., Koller, T., & Wessels, D. (2017, May). The six types of successful
acquisitions. Retrieved from McKinsey: https://www.mckinsey.com/business-
functions/strategy-and-corporate-finance/our-insights/the-six-types-of-successful-
acquisitions
Goldhar, J. D., Hitt, M. A., & Lei, D. (1996). Advanced Manufacturing Technology:
Organizational Design and Strategic Flexibility. Organization Studies, 501-523.
Page 69
56
Gomes-Casseres, B. (2015, November 30). 3 Lessons From Tech Mergers, for Dell-
EMC. Retrieved from HuffPost: https://www.huffingtonpost.com/ben-
gomescasseres/3-lessons-from-tech-merge_b_8683026.html
Gort, M. (1969). An economic disturbance theory of mergers. Quarterly Journal of
Economics(83), 624-642.
Govindarajan, V. (2018, February 2). Can Anyone Stop Amazon from Winning the
Industrial Internet? Retrieved from Harvard Business Review:
https://hbr.org/2018/02/can-anyone-stop-amazon-from-winning-the-industrial-
internet?utm_campaign=hbr&utm_source=facebook&utm_medium=social
Grinblatt, M., & Titman, S. (2006). Financial Markets and Corporate Strategy. Boston,
MA: McGraw-Hill.
Gunasekaran, A., & Yusuf, Y. Y. (2002). Agile Manufacturing: A Taxonomy of Strategic
and Technological Imperatives. International Journal of Production Research,
1357-1385.
Gupta, M. (2010). Contemporary Issues in Mergers and Acquisition. Himalaya
Publishing: Mumbai.
Haarla, A. (2003). Product Differentiation: Does It Provide Competitive Advantage For
A Printing Paper Company? Helsinki: Helsinki University of Technology,
Laboratory of Paper Technology.
Harpal, S. (2009, April). When supply chains merge: 5 mistakes to avoid. Retrieved from
Supply Chain Quarterly:
http://www.supplychainquarterly.com/print/scq200902merger/
Helms, M., Clay, D., & Peter, W. (1997). Competitive strategies and business
performance: evidence from the adhesives and sealants industry. Management
Decision, 689-703.
Herd, T., Steger, T. W., & Saksena, A. K. (2008). Improving the odds of M&A success.
Harvard Business Review Newsletter.
Hesseldahl, A. (2015, Novermber 2). Hewlett-Packard Splits in Two Today. Now What?
Retrieved from Recode: https://www.recode.net/2015/11/2/11620238/hewlett-
packard-splits-in-two-today-now-what
Page 70
57
HP. (2010, September 2). HP to Acquire 3PAR. Retrieved from HP:
http://www8.hp.com/us/en/hp-news/press-
release.html?id=597925#.WnUCBaiWZEY
HPE. (2016, November). Gartner reports HPE an all-flash leader. Retrieved from HPE:
https://www.hpe.com/h30683/ww/en/hpe-technology-now/Gartner-reports-HPE-
an-all-flash-leader_1626152.html
Hyatt, L. (2001). A simple Guide to Strategy. Nursing Homes, 12-13.
Investopedia. (2017). Investopedia. Retrieved from How does a merger affect the
customer?: Https://www.investopedia.com/ask/answers/040815/how-does-
merger-affect-customer.asp#ixzz55zvjFacj
Jones. (1999). Purchasing and Supplier Involvement: Issues and Insights Regarding New
Product Success. Journal of Supply Chain Management, 4-15.
Karagiannidis, S. (2010). Mergers and Acquisitions in Australia : Reason and Timing.
Melbourne: Victoria University.
Kim, W. C., & Maubourgne, R. (2006). Blue Ocean Strategy. Boston: Harvard Business
School Press.
Kogut, B. (1988). Joint ventures: Theoretical and empirical perspectives. Strategic
Management Journal, 319–332.
Kotler, P. (1998). Marketing management – analysis, planning, implementation and
control. New Jersey, NJ: Prentice Hall.
Lammerts, A., Pferdekämper, T., Holzmüller, H. H., Nijssen , E., Sirdeshmukh, D., &
Singh, J. (2001). A Tale of Two Orientations - Market Orientation and
Consumers’ Orientation Revisited. Dortmund: Universität Dortmund.
Larson, P. D., & Kulchitsky, J. D. (1998). Single Sourcing and Supplier Certification:
Performance and Relationship Implications. Industrial Marketing Management,
73-81.
Lau, R. S., & Hurley, N. M. (2001). Creating Agile Supply Chains for Competitive
Advantage. Business Review, 60(1), 1-5.
Levitt, T. C. (1960). Marketing Myopia. Harvard Business Review, 38(4), 45-56.
Page 71
58
Li, S. (2002). An Integrated Model for Supply Chain Management Practice, Performance
and Competitive Advantage, (Doctoral Dissertation). Toledo, OH: University of
Toledo.
Li, S., Ragu-Nathan, B., Ragu-Nathan, T. S., Rao, & Subba, S. (2006). The Impact of
Supply Chain Management Practices on Competitive Advantage and
Organizational Performance. Omega, 107-124.
Lin, C. (2014). Saic with Geely Cross-Border M&A Case Analysis. Jilin: Jilin University.
Linder, J., & Cantrell, S. (2000). Changing Business Models: Surveying the Landscape.
Cambridge, MA: Accenture Institute for Strategic Change.
Lummus, R. R., Duclos, L. K., & Vokurka, R. J. (2003). Supply Chain Flexibility:
Building a New Model. Global Journal of Flexible Systems Management, 1-13.
Ma, J., & Pagán, J. A. (2009). Abnormal returns to Mergers and Acquisitions in ten Asian
Stocks Markets. International Journal of Business, 14(3), 236-250.
Magretta, J. (1998). The Power of Virtual Integration: An Interview with Dell
Computers’ Michael Dell. Harvard Business Review, 72-84.
Mahadevan, B. (2000). Business Models for Internet-Based E-Commerce: AN
ANATOMY. California Management Review, 55-69.
Malburg, C. (2000). Competing on costs. Industry Week, 31.
Mars. (2013, December 6). Competitive strategies in operational excellence, customer
intimacy and product leadership. Retrieved from Mars:
https://www.marsdd.com/mars-library/competitive-strategies-in-operational-
excellence-customer-intimacy-and-product-leadership/
Martin, J. H., & Grbac, B. (2003). Using supply chain management to leverage a firm's
market orientation. Industrial Marketing Management, 32(1), 25-38.
Mburu, D. G. (2011). Test 123. Nairobi: Me.
McCune, H. (2011, Dec). Building Brand Value Through Mergers and Acquisitions.
Brand Building, pp. 50-51.
Page 72
59
McGinnis, M. A., & Vallorpa, R. M. (1999). Purchasing and Supplier Involvement:
Issues and Insights Regarding New Product Success. Journal of Supply Chain
Management, 4-15.
Meaney, M., & Pung, C. (2008). McKinsey global results: creating organizational
transformations. The McKinsey Quarterly.
Median, A., & Chin, A. (1995). Mortgage-pricing determinants: a comparative
investigation of national regional and local building societies. International
Journal of Bank Marketing, 3-11.
Melanie, H., Minna, R., & Tuija, R. (2011). M&A as a Strategic Option: From
Opportunities to New Business Creation. Helsinki: Tampere Teknologiainfo
Teknova Oy.
Miller, A., & Dess, G. (1993). Assessing Porter's (1980) model in terms of its
generalizability, accuracy, and simplicity. Journal of Management Studies, 553-
585.
Miller, R. (2015, October 12). Dell Buys EMC For $67B In Largest Deal In Tech
History. Retrieved from TechCrunch: https://techcrunch.com/2015/10/12/dell-
buys-emc-for-67b-in-largest-deal-in-tech-history/
Mitchell, D., & Coles, C. (2003). The ultimate competitive advantage of continuing
business model innovation. Journal of Business Strategy, 15.
Morris, M., Schindehutte, M., & Allen, J. (2005). The entrepreneur's business model:
toward a unified perspective. Journal of Business Research, 726-735.
Mugenda, O. M., & Mugenda, A. G. (2003). Research methods: Quantitative and
qualitative Approaches. Nairobi: African Centre for Technology Studies.
Mulhern, F. J., & Leone, R. (1991). Implicit Price Bundling of Retail Products: A
Multiproduct Approach to Maximizing Profitability Store. Journal of Marketing,
55(4), 63-76.
Murdoch, A. (1999). Future Indicative. Accountancy, 48-49.
Page 73
60
Niccolai, J. (2015, October 13). Four questions about the Dell-EMC merger. Retrieved
from Computer World: https://www.computerworld.com/article/2992027/it-
industry/four-questions-about-the-dell-emc-merger.html
Njoki, D. (2015). An Analysis of Competitive Advantage Gained Due to Mergers And
Acquisitions: A Case Of British-American Investments Company Limited
(BRITAM). Nairobi: USIU Africa.
Nobel, C. (2013, September 30). Do Mergers Hurt Product Quality? Retrieved from
Harvard Business School: https://hbswk.hbs.edu/item/do-mergers-hurt-product-
quality
Onashile, G. A. (2016). Operational and Financial Consequences of Merger and
Acquisitions. Lagos: Seinäjoki University.
Pavone, T. (2016, Spetember 15). Dell + EMC = Better Together. Retrieved from DELL
EMC: https://blog.dellemc.com/en-us/dell-emc-better-together/
Petersen, S. (2017, May 11). Dell EMC's 'Embrace and Extend' Cloud Strategy Coming
into Focus. Retrieved from eWeek: http://www.eweek.com/cloud/dell-emc-s-
embrace-and-extend-cloud-strategy-coming-into-focus
Picardo, E. (2014, October). How Mergers and Acquisitions Can Affect A Company.
Retrieved from Investopedia:
Https://www.investopedia.com/articles/investing/102914/how-mergers-and-
acquisitions-can-affect-company.asp
Porter, M. E. (1985). Competitive Advantage: Creating and sustaining superior
performance. New York: NY: Free Press.
Press, G. (2016, September 6). A Very Short History Of EMC Corporation. Retrieved
from Forbes: https://www.forbes.com/sites/gilpress/2016/09/06/a-very-short-
history-of-emc-corporation/#5d215d65c4a2
Primack, D. (2014, June 2). Dell departs the Fortune 500. Retrieved from Fortune:
http://fortune.com/2014/06/02/dell-departs-fortune-500/
Ragatz, G. L., Handfield, R. B., & Petersen, K. J. (2002). Benefits Associated With
Supplier Integration into New Product Development under Conditions of
Technology Uncertainty. Journal of Business Research, 389-400.
Page 74
61
Riad, S., Vaara, E., & Zhang, N. (2012). The Intertextual Production of International
Relations in Mergers and Acquisitions. Sage Journals, 33, 121-148.
Robinson, B. R., & Pearce, A. J. (2009). Formulation, Implementation, and Control of
Competitive Strategy (11 ed.). New York, USA: McGraw-Hill Irwin.
Rosenberg, Y. (2015, October 12). Dell Buys EMC: The 11 Biggest Tech Industry Deals
Ever. Retrieved from The Fiscal Times:
http://www.thefiscaltimes.com/2015/10/13/Dell-Buys-EMC-11-Biggest-Tech-
Industry-Deals-Ever
Roxy, P., Olsen, C., & Devore, J. L. (2008). Introduction to Statistics and Data Analysis.
Dallas, TX: Duxbury Press.
Ruesink, M. (2015, September 28). Top Corporate Mergers: The Good, The Bad & The
Ugly. Retrieved from Rasmussen College:
http://www.rasmussen.edu/degrees/business/blog/best-and-worst-corporate-
mergers/
Sakac, C. (2016, September 28). We’re days old as Dell Technologies… but already
adding new #1’s – now #1 in servers. Retrieved from DellEMC Blog:
https://blog.dellemc.com/en-us/days-old-dell-technologies-already-adding-new-
1s-now-1-servers/
Saunders, M. N., Thornhill, A., & Lewis, P. (2007). Research Methods for Business
Students. New York; NY: FT Prentice Hall.
Schweizer, L. (2005). Concept and evolution of business models. Journal of General
Management, 37-56.
Senior, B., & Swailes, S. (2010). Organizational Change. Harlow: Pearson Education.
Sharifi, H., & Zhang, Z. (2001). Agile Manufacturing in Practice. International Journal
of Operations & Production Management, 772-805.
Sheang, K., Hua, L., & Tai, L. (2000). Feasibility of Strategic Alliance as an Entry
Strategy into Markets Dominated by Major Ccompetitors. Journal of Small
Business and Enterprise.
Page 75
62
Sheen, A. (2013). The Real Product Market Impact of Mergers. Boston, MA: Harvard
Business School.
Sherman, A. J., & Milledge, H. A. (2006). Mergers and Acquisitions from A to Z.
Mishawaka, IN: American Management Association.
Shields, P. M., & Rangarajan. (2013). A Playbook for Research Methods: Integrating
Conceptual Frameworks and Project Management. Cambridge, MA: MIT Press.
Simonet, D., & Tett, P. (2012). Five Perspectives on the Leadership - Management
Relationship. A Competency Based Evaluation and Integration. International
Journal for Humanities and Social Sciences, 102-114.
Sloman, J. (2010). Essentials of Economics. New York; NY: Prentice Hall.
Smith, S. (2017, September). TechTarget. Retrieved from Dell and EMC merger poses a
challenging transformation: http://searchitchannel.techtarget.com/feature/Dell-
and-EMC-merger-poses-a-challenging-transformation
Sompong, K., Igel, B., & Helen, L. S. (2014). Mergers and Acquisitions motivation for
technology commercialization and product development. Management Research
Review, 37(6), 518-537.
Stone, M. (1995). Strategic development related to Europeanization of UK logistics and
distribution service suppliers. European Business Review, 9-14.
Strategic Sourceror. (2015, October 8). How Mergers And Acquisitions Affect Supply
Chains. Retrieved from Strategic Sourceror:
http://www.strategicsourceror.com/2015/10/how-mergers-and-acquisitions-
affect.html
Surhone, L. M. (2009). Sampling (statistics). Bergisch Gladbach: Betascript Publishers
Dez 2009.
Suutari, R. (1999). Tale of two strategies. CMA Management, 12-13.
Tompkins, J., & Ang, D. (1999). What are Your Greatest Challenges Related to Supply
Chain Performance Measurement? IIE Solutions, 66.
Towill, D. R. (1996). Time Compression and Supply Chain Management - A Guided
Tour. Supply Chain Management, 15-27.
Page 76
63
Trautwein, F. (1990). Merger Motives and Merger Prescriptions. Strategic Management
Journal, 11(4), 283-295.
Treacy, M., & Wiersma, F. (1997). The Discipline of Market Leaders: Choose Your
Customers, Narrow Your Focus, Dominate Your Market. Massachusetts:
Addison-Wesley.
United Nations Conference on Trade and Development. (2006). World Investment Report
2006. New York and Geneva: United Nations.
Upton, D. M. (1997). Process Range in Manufacturing: An Empirical Study of Flexibilit.
Management Science, 43(8), 1079-1093.
Van-Oudenhoven, J. P., & DeBoer, P. (2009). Complementarity and Similarity of
Partners in International Mergers. Basic and Applied social Psychology(77), 345-
356.
Walker, G. (2015). Modern Competitive Strategy (4th ed.). New York, USA: McGraw-
Hill Education.
Walters, D. (2004). A Business Model for the New Economy. International Journal of
Physical Distribution & Logistics Management, 346-357.
Wang, Y. (2012). Enterprise Transnational Merger and Acquisition Risk Identification
and Prevention. Chengdu: Southwest University of Finance and Economics.
Weston, J. F., Hoag, S. E., & Chung, K. S. (2003). Mergers, Restructuring, and
Corporate Control. New Jersey: Prentice Hall, Inc.
Wharton School. (2006, May 3). Will Mergers and Acquisitions be Beneficial or Harmful
to Innovation? Retrieved from Knowledge @ Wharton School of the University
of Pennsylvania: http://knowledge.wharton.upenn.edu/article/will-mergers-and-
acquisitions-be-beneficial-or-harmful-to-innovation/
Wittmann, M. C., Hunt, S. D., & Arnett, D. B. (2009). Explaining alliance success:
Competences, resources, relational factors, and resource-advantage theory.
Industrial Marketing Management, 38(7), 743–756.
Page 77
64
Womack, B. (2017, September 7). Dell Benefits in First Year After EMC Merger With
Sales Up. Retrieved from Bloomberg:
https://www.bloomberg.com/news/articles/2017-09-07/dell-reports-sales-of-19-
billion-on-anniversary-of-emc-deal
Yusuf, Y., Sarhadi, M., & Gunasekaran, A. (1999). Agile Manufacturing: The Drivers,
Concepts and Attributes. International Journal of Production Economics, 33-43.
Zabihollah, R. (2011). Financial Institutions, Valuations, Mergers and Acquisitions: The
Fair Value Approach. Boston, MA: John Wiley & Sons Inc.
Zhu, J. (2012). Impact of Mergers and Acquisitions on Supply Chain Performance.
Montreal: McGill University.
Zott, C., & Amit, R. (2007). Business Model Design and the Performance of
Entrepreneurial Firms. Organization Science, 181-199.
Page 78
65
APPENDIX I: INTRODUCTORY LETTER
Page 79
66
APPENDIX II: QUESTIONNAIRE