Merging Cultures * Glenn R. Carroll † , J. Richard Harrison ‡ May 9, 2004 1 Introduction Corporate mergers and acquisitions usually occur because of the strategic or financial imperatives of one or both partner firms. For example, the recent merger between computer makers Hewlett-Packard and Compaq was an- nounced as “creating an absolute powerhouse in the market place”(Williams, 2001). Similarly, when DaimlerBenz and Chrysler merged in 1999, the CEO’s of both companies cited as motivation the increasing role of scale economies in a globalizing industry as well as complementarities between the companies’ products (Vlasic and Stertz, 2000). And, the merger of hos- pitals between Stanford University and the University of California at San Francisco (UCSF) was supposed to “not only offer superior patient care but would provide financial stability that would ensure the medical centers’ sur- vival in a brutallycompetitive health care industry. Together, Stanford and UCSF would bargain more aggressively with insurance companies and sup- pliers, boosting revenues and saving money” (Feder, 2000). Indeed, a recent academic review suggests enhanced efficiency is the most common general motivation for mergers and acquisitions (Holmstrom and Kaplan, 2000). Despite these market-based motivations, the success or failure of a merged corporation often depends on its ability to integrate effectively the two pre- viously independent organizations and to operate as a coherent entity. Al- though integration may be thwarted by any number of factors, extant cul- tural differences between the organizations involved in a merger often prove * This draft of a chapter is taken from a book-in-progress. We have tried to make it self-contained by reproducing the basic model in the Appendix. Please excuse any inconvenience over the formatting. Do not quote without prior permission but citation is fine. † Stanford University ‡ University of Texas at Dallas 1
Transcript
Merging Cultures∗
Glenn R. Carroll†, J. Richard Harrison‡
May 9, 2004
1 Introduction
Corporate mergers and acquisitions usually occur because of the strategic orfinancial imperatives of one or both partner firms. For example, the recentmerger between computer makers Hewlett-Packard and Compaq was an-nounced as “creating an absolute powerhouse in the market place”(Williams,2001). Similarly, when DaimlerBenz and Chrysler merged in 1999, theCEO’s of both companies cited as motivation the increasing role of scaleeconomies in a globalizing industry as well as complementarities betweenthe companies’ products (Vlasic and Stertz, 2000). And, the merger of hos-pitals between Stanford University and the University of California at SanFrancisco (UCSF) was supposed to “not only offer superior patient care butwould provide financial stability that would ensure the medical centers’ sur-vival in a brutally competitive health care industry. Together, Stanford andUCSF would bargain more aggressively with insurance companies and sup-pliers, boosting revenues and saving money” (Feder, 2000). Indeed, a recentacademic review suggests enhanced efficiency is the most common generalmotivation for mergers and acquisitions (Holmstrom and Kaplan, 2000).
Despite these market-based motivations, the success or failure of a mergedcorporation often depends on its ability to integrate effectively the two pre-viously independent organizations and to operate as a coherent entity. Al-though integration may be thwarted by any number of factors, extant cul-tural differences between the organizations involved in a merger often prove
∗This draft of a chapter is taken from a book-in-progress. We have tried to makeit self-contained by reproducing the basic model in the Appendix. Please excuse anyinconvenience over the formatting. Do not quote without prior permission but citation isfine.
†Stanford University‡University of Texas at Dallas
1
problematic. For instance, the business press opined about Compaq’s ear-lier merger with Digital Equipment Corporation that: “The two culturesclashed as Compaq’s high-volume, high-speed approach ran into Digital’slow-volume system in which sales of big computers took time. The com-pany was so distracted by the merger that it lost its long-standing crown asthe largest seller of PCs to rival Dell” (McWilliams, 2001). Likewise, thedismal performance of DaimlerChrysler has been attributed to the difficul-ties of combining Daimler-Benz’s “hierarchical bureaucratic” culture withChrysler’s “free wheeling creative” culture (Vlasic and Stertz, 2001). And,after losing $176 million in 28 months, the Stanford-UCSF hospital mergerwas dismantled because “the two hospitals had radically different cultures,which made the merger impossible in the end”(Pyati, 2000).
Moreover, the increasing prevalence of cross-border mergers and acqui-sitions suggests that post-merger cultural conflict may be on the rise asnational cultural differences may reinforce organizational differences. Cer-tainly, the disappointing performance of contemporary high-profile cross-border mergers such as DaimlerChrysler suggests this possibility. Some ob-servers also predicted a similar fate for the European units involved in theHP-Compaq merger (Delaney and Woodruff, 2001).
Analyses such as these, which assess the compatibility or fit between twocultures to explain outcomes, focus on what we call in Chapter 1 the contentof culture. Cultural content may, in fact, be behind a broader set of reasonsoften offered for post-acquisition success and failure. For instance, a recentdetailed economic analysis of two large mergers concludes that “in bothcases, post-acquisition difficulties resulted because managers of the acquir-ing company did not understand deeply the target company. [For example,]despite the fact that [the acquirer] Cooper Industries had operations in [thetarget] Cameron Iron Work’s industry (the petroleum equipment business),Cooper’s management did not understand that its expertise in manufac-turing technology and internal control would not translate into success forCameron. As Cameron managers described it, Cooper did not understandthat ’Cameron’ was not a manufacturing business. It was a service businesswith a manufacturing component” (Kaplan et al., 1997). An objective posthoc analysis of this merger might regard its difficulties as arising from non-complementary lines of business, which is true superficially, but ignores thefact that failure to understand something so basic likely reflects an impen-etrable or deeply ingrained cultural difference.
Clearly, content-based cultural assessment is the dominant way thatmany observers, including social scientists, analyze the cultural aspect ofmergers and acquisitions. In fact, this way of thinking is so engrained that
2
some progressive firms such as Johnson & Johnson and Cisco Systems nowuse such analysis proactively: they systematically analyze cultural fit inassessing potential merger targets.
Although it is not widely recognized, the post-merger integration of twocultures is a function of organizational demography as well as cultural con-tent. To see the potential impact of demography, imagine a merger betweentwo hypothetical organizations with dissimilar and highly incompatible cul-tural contents. In the first merger, all members of both organizations possesslifetime job security; they cannot be terminated and they are basically ex-pected to remain in their positions until retirement. In the second merger,organizational membership is fluid: members come and go with high fre-quency. In general, cultural integration should be easier to achieve in thesecond merger. Why? In our view, the cultural differences in the firstmerger will likely persist because they can be overcome only by transform-ing previously enculturated individuals. By contrast, the second merger can‘wash out’ extreme cultural differences through the departure of alienatedindividuals and their replacement with fresh ones more susceptible to encul-turation. Underlying this conjecture is the presumption that it is easier toselect and to socialize new organizational members than it is to resocializeexisting members. Nonetheless, it should be clear from this stylized scenariothat post-merger cultural integration involves personnel demographic flowsand associated socialization processes as much as it does the contents of thecultures being merged.
This chapter addresses the issue of cultural integration following merg-ers. It does so by using the synthetic model, using content as well as de-mographic distribution, developed in Chapters 1, 3 and 4. In particular,we focus on demographic factors related to post-merger cultural integrationand examine their implications for content-based factors such as culturalcompatibility or fit. The analysis again relies on a computer simulation,using the basic model of cultural transmission described in Chapter 4 (seeAppendix). To apply the model to the cultural integration problem, wefirst simulate two separate organizations and then combine them into onepost-merger organization. We next observe how the culture of the post-merger organization evolves over time. Simulation experiments vary thegrowth rate, hiring practices, socialization processes, and turnover rates ofthe post-merger organization. We also look at the effects of cultural inertiain the acquired organizations as well as the layoff policy used in dealingwith the newly acquired employees. The primary outcomes of concern arethe time paths of mean enculturation and cultural heterogeneity of the post-merger organization. Of particular interest are the conditions under which
3
the post-merger organization quickly develops homogeneously and in the di-rection of management’s preferred culture, or fails to do so in a reasonabletime interval. In the conclusion, we consider the implications of our findingsfor the management of corporate mergers.
2 Post-Merger Cultural Integration
The prevalence of unsuccessful corporate mergers presents a problem formany efficient market theories, because strong versions of these theories holdthat firms’ officials and others involved in assessing the transaction (e.g., fi-nancial analysts, underwriters) can make (basically) accurate cost-benefitcalculations of the likelihood of success of the projected mergers and thenbehave accordingly. That is, an efficient markets view might interpret a po-tential merger as a market opportunity that executives and financial peoplerecognize, move to take advantage of it, and then reap ample rewards afterentering the market. Decisions and actions in this view of the world areforward-looking: current behavior is explained as a result of future expec-tations, which (in interpretations) are often assumed to be accurate (March1978).
Many reasons lie behind merger failure and the inability of markets tomake full adjustments (see Holmstrom and Kaplan 2000). Difficulties ofcultural integration seem likely to be increasingly important as a cause ofboth problems.1 As discussed in Chapter 1, more and more firms todayattempt to manage with their cultures and to develop “strong” cultures.This implies that randomly chosen merger partners are more likely to includea strong culture firm, which would presumably be more resistant to thechanges required by integration than would a firm with a weaker culture.
Many observers note that despite the occasional lip service paid to cul-tural integration issues in a proposed merger, rarely do these concerns weighheavily in decision making and firm valuation. A major factor behind suchinsufficient consideration is the lack of a sound theory about cultural con-tent. Accordingly, there is no widely agreed upon way to assess contentcompatibility or incompatibility; and any kind of projected content combi-
1By searching the texts of business periodicals, we found some indirect evidence thatculture is increasingly recognized as a major issue in recent years. We searched for arti-cles containing the two words “merger” and “culture” in the Dow Jones list of selectedpublications, which includes major news and business publications, as well as the top 50newspapers and wires. We found 1.95% of all articles contained these words in all yearsavailable. But from 1995 to 2003, 2.12% did, from 2000 to 2003, 2.50% did and from 2002to 2003, 2.83% did.
4
nation can be plausibly argued as likely to bring about better performance(Weber, 1996). For instance, cultures assessed to be ‘compatible’ can bepointed to in order to allay questions about integration difficulties, and cul-tures assessed to be ‘incompatible’ can be seen as strengths of the mergerbecause they will complement each other after integration.
Weber and Camerer (2003)emphasize a different potential problem ofcultural integration. In their view, culture is local convention, wherebyindividuals develop highly idiosyncratic but efficient tacit communicationskills, language and knowledge (Kreps, 1990b). When persons followingtwo such conventions are grouped together and required to communicatein a common way, those subscribing to at least one of the conventions willbe required to drop their own (efficient) process and to learn another one.Moreover, the individuals who already know the dominant convention willbe called upon to spend time and energy teaching it to the others. So, evenif the cultural learning goes smoothly—and it may not—the process involvesa transition period resulting in a temporary loss of efficiency, regardless ofcontent compatibility. Weber and Camerer (2003) also argue that individ-uals will be more likely to ignore (or weight less heavily) hard-to-measurecultural factors than tangible and easily quantifiable features of a firm. Thisasymmetry in cognition means that integration fails to get fully costed and“leads to overestimaton of the value of a merged firm at the time of themerger” (Weber and Camerer, 2003: 401).
An implicit assumption of almost all analyses of cultural integrationis that individuals experience some sort of cultural inertia, in that theycannot instantaneously shed themselves of the values, norms, beliefs etc. ofthe prior culture and adopt those of the new one. Engrained habits andinternalized values persist some time, even when the context changes andincentives are amplified. Many observers report that identities and otherprior cultural differences remain in merged companies years after the actualmerger event. For instance, the cultural integration effort in the SmithKlineBeecham merger of 1989 was still clearly in progress two years later (Burkeand Jackson, 1991) Moreover, if the two cultures involved are homogeneous,intensely held, and display visible markers identifying respective members(with, say, different dress codes or speaking norms), the merger combinationmay be reactive itself, creating conflict and generating greater solidarityamong members of the original culture. For instance, one observer attendingan HP reception after the HP/Compaq merger is reported by Tam (2003:A1) to have commented that he “’could tell the H-P folks from the Compaqfolks right away.’ The former Compaq employees, in suits and ties, huddledon one side of the room. Polo-shirted H-P staffers stood on the other.”
5
Of course, structural conditions shape the extent to which integrationmight be problematic. Organizational size differences, in particular, seem toset the stage for the social interaction that drives much integration. Assum-ing random interaction among members of a post-merger organization meansthat the relative sizes of the two merger partners determine which group in-fluences which the most, the members of the acquiror or those of the target.2
With equal-sized partners, peer-based cultural influence would not necessar-ily move in any direction. With unequal-sized partners, peer-based influencewould be stronger from the larger group, creating a majority-minority influ-ence pattern (Blau 1977). Given that authority also rests with the acquiror,who can presumably use management-based influence tactics as well, theobvious expectation is that the greater the relative size of the acquiror, theeasier and faster cultural integration should proceed in the combined unit.
Managers possess several direct levers that can be used to try to preventcultural backlash and to facilitate integration. On the positive side, social-ization efforts from management can be intensified, reducing peer-to-peerinfluence and increasing management influence. Managerial socializationactivities might include seminars, cultural and behavioral training, incen-tives for desired behaviors, social activities such as beer blasts and parties,regular executive addresses and feedback sessions, personnel evaluations,and the like. On the negative side, managers can amplify the discomfortfelt by those with did not fit into the preferred culture well, thereby makingthem more likely to leave the organization.
Anecdotes from the business world suggest that a period of confusionand uncertainty often plagues the integration problem follow a merger, cre-ating delays and long-lasting problems of resentment and identity as culturesclash. Currently touted best practice examples suggest that quick and de-cisive action regarding any post-merger reorganization, consolidation andcultural change strongly facilitates integration. For instance, in the HP-Compaq merger the CEOs involved each appointed a senior executive tolead integration a month before the deal was even announced. These exec-utives then assembled an integration team of 30 persons. The team studiedpast mergers, both successful and failed, to determine best practice.
The lessons: Offer rich retention plans and bonuses as Citigroupdid to executives the company wanted to keep and create a uni-
2We do not intend to suggest that random interaction is likely to occur in a newlymerged, or for that matter any, organization. Rather we find this assumption useful inthinking about and isolating relative size effects. Obviously, other structural features suchas geographic and hierarchical location need to be taken into account in any real setting.
6
fied culture to avoid the kind of divisions that have plagued AOLTime Warner. The H-P executives also realized that the theyhad to choose swiftly between competing assets—departments,products and executives.(Tam, 2003: A1)
When the deal closed, the team had already identified the stronger productsin almost all categories. They also anointed 650 part-time internal “culturalconsultants” to facilitate the integration of the culture. Although a definitiveassessment on the integration process has yet to appear, the business pressseems to think that H-P has done a better job than most companies.
3 Modeling Framework
To use the basic model of Chapter 4 to study cultural integration (see Ap-pendix), we begin by considering two separate organizations with differentcultural ideals. We designate one of these organizations as the acquiringfirm—its cultural ideal dominates after the merger—and the other the ac-quired, or target, organization. Because we are primarily interested in thecultural integration process, we designed a framework for the experimentswhere the cultural ideals of the two organizations involved in the mergerare essentially incompatible. Since the cultural representation scheme weuse specifies cultural fit according to some arbitrary organizationally definedscale, comparing across organizations requires positing a transformation rulebetween scales. Rather than tackle this issue generally, we focused on thecondition of greatest substantive interest—high difference in content (a sortof “inverse” relationship between scales where a high score on one impliesa low score on the other). We designed the experiments to allow for thecontent differences of the two organizations to be at the same fairly highlevel for all experiments; thus, content differences are high but controlled.To simulate this context, we reset the enculturation scores of all individualsin the target organization following the merger as follows: each individual inthe target organization is randomly reassigned a new score drawn from a dis-tribution with a pre-set mean and standard deviation. We use this randomreassignment process because we not want to build in an exact relationshipbetween the two culture scores of every individual in the target.
In many of our simulated organizations, we posit cultural inertia—aslow responsiveness of individuals in the target organization to the newlyimposed cultural regime. We do this by specifying the socialization functionso that the base of peers operating through the peer socialization parameteris composed disproportionately of individuals from the target organization.
7
In the case of strong, or full cultural inertia, we restrict the peer base ofprevious target members to only those individuals who were also members ofthe target organization. In other words, despite the merger, these individualsare influenced only by their fellow travelers from the target organization. Inanother condition, we let the peer influence be proportional to the percentageof survivors from the target organization.
We treat the combined post-merger organization as a single organizationand observe how its culture evolves over time. We pay special attention tothe process of cultural integration in the three years (36 elapsed months)following the merger. In particular, we examine two outcomes reflecting theextent of cultural integration: (1) average cultural fit of employees,indicatingby the mean level of enculturation (with respect to the acquiror’s ideal) inthe merger organization; and (2) heterogeneity in the culture, indicated bythe standard deviation of enculturation for the merged organization.
Because enculturation scores are immediately and accurately revised fol-lowing the merger event, the modeling framework implies that individualsexperience a swift and clear understanding of cultural issues. So, the bestpractice advice of quick and decisive action to reduce confusion and uncer-tainty is essentially implemented in all conditions. The framework thereforesimulates conditions with great content differences in culture but no ambi-guity about individuals’ cultural standing.
4 Experimental Design
Simulation experiments started by allowing each pre-merger organizationto develop strong cultures independently for 120 simulation periods (tensimulation years), using hiring and management enculturation strategies toachieve these outcomes. In these runs, the mean enculturation levels variedfrom .79 to .90 after ten simulation years, depending on cultural strategy.However, because enculturation is assumed to be based on different criteriain different organizations, the values are not comparable across organiza-tions. Thus, we used a rule to reassign all values of one organization to thescale of the other. As explained above, our goal was to make the cultureof the target unit “incompatible” or very different from the acquiring orga-nization (in terms of assessment of fit based on content). So, we re-set themean enculturation level of the target unit at .2 (with random assignmentof enculturation scores to individuals based on a normal distribution); thetenures of the individuals in the target organization were preserved. We thencombined the two organizations and let the new “combined” organization
8
follow the previously set hiring practices, management enculturation prac-tices, strength of alienation, and turnover rates of the acquiring organizationbefore the merger.
In these experiments, we attempt to identify the conditions under whichthe post-merger organization quickly develops a management-preferred ho-mogeneous culture. The first outcome we examine is the mean level ofenculturation ( ¯C(t))in the post-merger organization. The second outcomewe examine is cultural heterogeneity, measured as the standard deviation ofthe enculturation levels of the individuals (σct) in the organization. Giventhe general structure of the simulation experiments, the lower the culturalheterogeneity, the higher the level of cultural integration of the merged or-ganization.
Experimental design choices here extend multiplicatively beyond ourusual simulation setup. At least three possible sets of possibly varying pa-rameters come to mind: those of the acquiror, those of the target and thoseof the combined post-merger entity, which can contain new hires as well.To keep the analysis tractable, we use only several variations of basic modelparameters such as the turnover rate, and we set these to be the same forthe acquiror and the combined post-merger organization.3
We do, however, introduce variations for factors not in the basic modelthat potentially seem most important for cultural integration. These in-clude: (1) the layoff policy of the combined post-merger entity with respectto individuals from the target; (2) the extent and form of post-merger cul-tural inertia among individuals in the target organization; and (3) the or-ganizational sizes of both acquiror and target, generating differences in thesize ratio.
To be more specific, we examine the following variations:Layoff policy. We simulate two different layoff policies imposed on the
members of the target organization. In the baseline condition, there areno layoffs and target members are treated the same as other individualswith respect to turnover. In the layoff condition, we impose layoffs amongtarget members such that six months after the merger event only 50% ofthese individuals will still be present in the post-merger organization. Theselayoffs occur to randomly chosen individuals from the target organizationand are implemented monthly for six months in roughly equal batches.
Cultural inertia in target. Recall from Chapter 4 that the basic model3These settings are all consistent with previous research using the model reported in
above chapters and elsewhere. The settings for the variations used in the simulation aregiven in Appendix B.
9
of cultural transmission sets socialization-change intensity as
where e is a normally distributed error term with mean zero and αmgt,αpeer , αdecay are parameters representing the pulls toward ideal socialization(from management), mean socialization level (from peer pressure), and zerosocialization (from decay), respectively. Note that C̄t in the peer influencecomponent is calculated from all individuals in the post-merger organization,regardless of origin. We regard this specification as the baseline conditionof no cultural inertia.
In the condition we call full inertia, we specify the peer influence com-ponent for individuals from the merger target as consisting only of othersurviving members from the target and no management influence. That is,socialization-change intensity for these individuals becomes
A∗i (t) = (C̄kt − Ci,t−1) + e (2)
where C̄kt is the mean enculturation of all k surviving individuals from thetarget organization.
In the condition we call proportional inertia, we specify the peer influencecomponent for individuals from the merger target as pulled by both the fullinertia process and the baseline process, with weights dependent on theproportion of target members surviving. Specifically, we let pt representthe proportion of target members surviving at t. In order to preserve thedistribution of the error term in the ultimate socialization-change intensityfunction, we then redefine Ai(t) and A∗
i (t) to be exactly as above but withoutthe error terms e added. Individuals from the target in this condition thenexperience socialization-change intensity as
A∗∗i (t) = (1− pt)Ai(t) + ptA
∗i (t) + e (3)
where e is a normally distributed error term with mean zero.Organizational sizes. We vary the sizes of the two organizations at the
time of merger. Each organization is simulated with merger sizes of 50, 200,or 800, generating nine possible size combinations for the merger. In theanalysis, we use the size ratio by dividing the merger size of the acquiringorganization by the merger size of the acquired organization (target), so thesize ratio varies from .0625 to 16.4
4We also analyzed the simulation output data using dummy variables for each sizesetting and using logs of size and their interactions; the findings did not differ substantivelyfrom the analysis using the size ratio, so we report only the size ratio findings.
10
Hiring selectivity. Hiring selectivity is fixed for the target at an inter-mediate level by setting the mean of the hiring pool at C̄h = .50. For theacquiror and post-merger organization, hiring selectivity varies simultane-ously across three conditions: high selectivity (C̄h = .80.); medium selectiv-ity (C̄h = .50.); and low selectivity (C̄h = .20). In all cases, the recruitmentrate varies simultaneously with the hiring pool mean, rr = −log(C̄h).
Socialization. In the target organization, socialization is fixed for allexperiments as a mixed management-peer process with αmgt = .49 andαpeer = .49. In the acquiror and post-merger organizations, socializationvaries simultaneously at three levels: management dominated (αmgt = .80and αpeer = .18); mixed (αmgt = .49 and αpeer = .49) and peer dominated(αmgt = .18 and αpeer = .80).
Turnover. Baseline turnover in the target organization is fixed at γ0 =.015. For the acquiror and post-merger organizations, we vary baseline turnoversimultaneously from a low setting of γ0 = .005 to a high setting of γ0 = .015.
Alienation. The alienation level of the target is fixed with γ1 = .10. Wevary the alienation level simultaneously in the acquiror and the post-mergerorganization by setting the γ1 parameter to either .15 or .6 for weak orstrong alienation effects, respectively.
Growth rates. Before the merger, the growth rate for both organizationsis set to zero. After the merger, we simulate three conditions for growthof the post-merger entity: (1) negative growth, a stochastic growth rate ofrg = −.04 per simulation period (month); (2) no growth, a growth rateof zero; and (3) positive growth, a stochastic growth rate of rg = .04 perperiod.
Trials Each simulation begins by running the two separate organizationsfor 120 periods. Then the cultural mean for the acquired organization is re-set by generating new cultural scores from a normal distribution with a meanof .2 and a standard deviation of .1 (with a minimum of zero), the two or-ganizations are merged, and the evolution of the merged organization usingthe pre-merger background conditions of the acquiring organization is ob-served for an additional 12 periods. The simulation is run separately for eachof 5832 different conditions, corresponding to all possible combinations ofthree growth settings, three cultural inertia settings, two alienation settings,two base turnover settings, two layoff policy settings, three management so-cialization settings, three hiring selectivity settings, and nine size settings(three for each pre-merger organization).5 Each condition is simulated 10
5In the full cultural inertia setting, the variations for socialization apply only to thoseindividuals not from the target.
11
Acquiree
people
Acquiror
people
Post
Merger
people
Departures
Departures
Departures
Vacancies
and hiringGrowth
rate
Figure 1: Demographic flows after merger.
times and the findings we present are averages across the 10 runs. So, thetotal number of possible observations of 5832 conditions for 36 periods is209,952.
5 System Dynamics
Figure 10-1 helps to comprehend the demographic system generated by thesimulation. It depicts visually the demographic flows in the combined post-merger organization. The post-merger organization consists of the unionof three sets of people, defined by their relationship to the merger: thosesurvivors originally from the acquiror; those survivors originally from thetarget; and those hired after the merger. Each of these sets is representedby a circle on the right hand side of the figure. In terms of demographicflows of personnel, all three will experience outflows or departures after themerger. The levels of these departures depends on the base turnover rate ofthe model as well as the alienation rate. The number of people departingbecause of alienation is also affected directly by the enculturation mean ofthe post-merger organization and indirectly by the characteristics of thebase of people available to socialize their peers. In addition to these effects,departures from the target people or acquirees also depends uniquely on the
12
Figure 2: Cultural heterogeneity after merger.
layoff policy of the merger as well as the degree and form of cultural inertiaamong the target people. When a person departs from any of the three sets,it generates a vacancy so long as the organization is not contracting due tonegative growth. Vacant slots would be filled more or less quickly dependingon the hiring selectivity policy in effect. Newly hired individuals enter intothe set of post-merger people; they may also depart at any time.
It should be obvious that if the system operates long enough the post-merger people will dominate the newly merged organization and eventuallybe exclusively represented. Such an eventuality, however, may take a verylong time. Among other things, peer socialization in the newly mergedorganization draws from the base enculturation of individuals in all threesets. This means that newly hired post-merger people may serve to slow thedepartures of people from the other two sets, if they are hired selectively.
The figure helps to appreciate how the dynamics of the system mightlead to some unexpected occurences, Consider, for instance, a condition ofzero growth, layoffs in the target and low selectivity in hiring. Here the manypeople laid off from the target will be balanced by new hires to keep the sizeof the organizational stable. The remaining target people may have higherenculturation scores than the newly hired people, however, implying that itis possible the people in target will contribute positively to the socialization
13
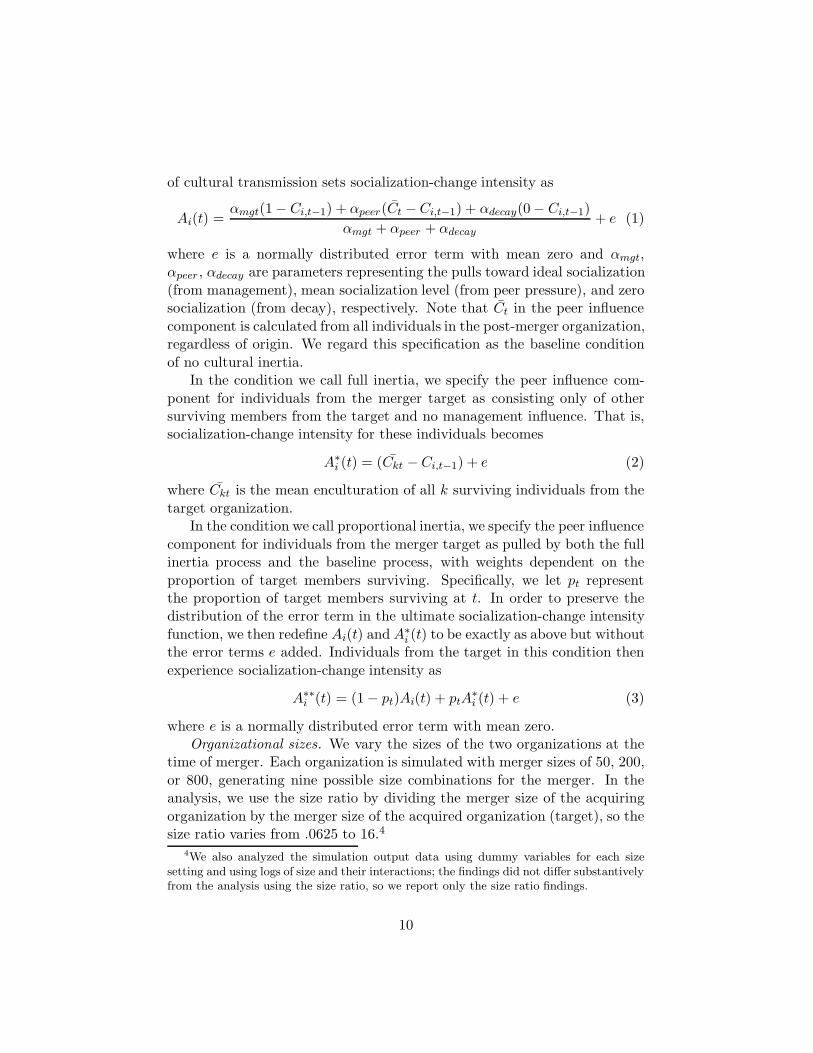
of the post-merger set.A detailed examination of the sample paths of the post-merger organiza-
tion for various conditions shows, surprisingly, that in a number situationsthe cultural heterogeneity of the merged organization actually rises.6 Thistendency can be glimpsed in Figure 10-2, which graphs the cultural het-erogeneity (standard deviation of Cit within an organization) of the originaltarget organization members across time for all conditions. Obviously, manysets of target individuals increase in heterogeneity, especially in the first 12months. As we will see below, this can lead to increased heterogeneity inthe whole post-merger organization. Note also that, in many instances, theheightened heterogeneity persists to month 36. Nonetheless, the dominantpattern in the simulations is of decreasing heterogeneity among the sets oftarget individuals. This can be seen in the figure by the solid line drawnthrough the points, which charts the median trajectory of heterogeneityamong all the simulated conditions. Understanding the difference betweenthese cases and those where heterogeneity rises may provide some clues asto when mergers go awry culturally. So, after analyzing the basic patternsin the simulated merged organization, we return to this issue by isolatingthese cases and examining the behavior of the three sets of people withinthem.
6 Findings
The dynamics of demographic processes can be as important as the eventualequilibrium distribution (Sorenson, 2004). So, we analyzed the time pathsof the cultural distributions in the simulated organization in depth.
We started by looking at plots of both mean enculturation and culturalheterogeneity in the combined post-merger over time by selected specificconditions. We then contrasted the differences simulated for each param-eter one at a time, looking at the median trajectory for a condition andcollapsing the data across all other conditions (that is, not controlling forany other variations). These plots revealed that some within-parametervariations produce big effects while others can hardly be detected. Amongthose showing small discernible effects: layoff policy, cultural inertia mecha-nism, growth, and turnover. We find it especially surprising that layoffs andinertia show such little impact. By contrast, we saw big effects across varia-tions in size ratio, hiring selectivity, socialization and alienation. Although
6By contrast, the mean level of enculturation in the merged organization rises steadilythroughout the simulation.
14
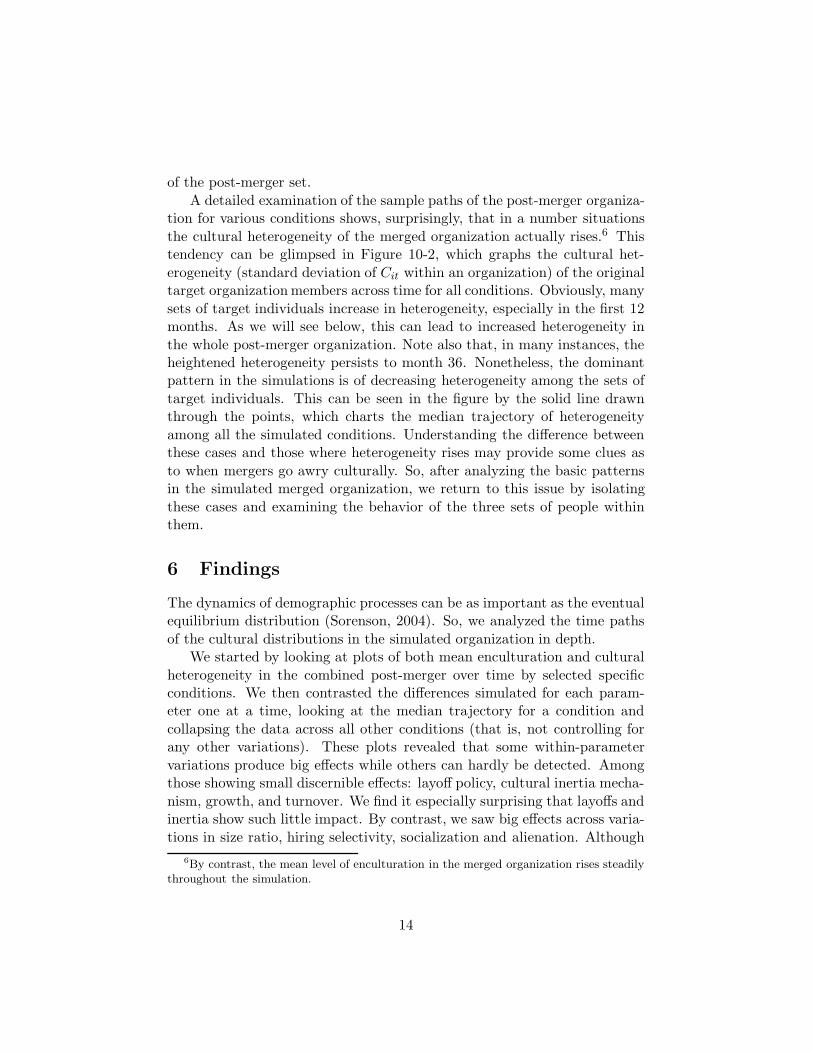
Figure 3: Post-merger enculturation by alienation condition.
there are complications, these generally show the intuitively expected ef-fects: increasing the mean and reducing heterogeneity when the size ratio isbig, hiring selectivity is high, socialization is management based and alien-ation is strong. Figures 10-3 and 10-4 presents these plots for variations inthe alienation parameter. Obviously, for both the mean and the standarddeviation of enculturation, the median for the low and high alienation con-ditions start at the same point and then diverge over time, only to comeback together some near the end of the simulation. The maximal divergenceappears in both plots to be between 9 and 21 months. So, these variationsin the alienation parameter produce effects in the outcomes as well as theirdynamics.
Of course, the patterns seen in such uncontrolled plots might be mislead-ing, since the model processes are highly interdependent. In an attempt toisolate the effects of variations net of such interdependencies, we estimatedregression models from the simulated data. In doing this, we first used allthe data and introduced control variables for both the value of the depen-dent variable at time of merger, and the time elapsed since the merger (alog month variable works best). For ease of interpretation, with one excep-tion we also constructed dummy variables for each set of within-parametervariations and entered each set, minus an omitted contrast condition, into
15
Table 1: Regressions of cultural outcomes in merged organizationMean Mean Standard
level of level of deviation inenculturation enculturation enculturation
C̄t C̄t σct
Constant .102* .049* .285*Dep. var. at merger .448* .448* .056*Ln. month since merger .073* .093* -.055*Selectivity
R squared .848 .873 .699N 209,952 209,952 209,952∗p < .05.
Note: Data are across all conditions and times.
16
the equation. The exception is the size ratio variable, which contains nineconditions and is straightforward to interpret. Table 10-1 shows estimatedequations for both outcome variables.
The regression estimates show that the basic effects of higher hiring se-lectivity, management-based socialization, strong alienation, a big size ratio,and layoffs in the target all serve to increase the mean level of enculturation,although the size ratio effect attenuates with time since the merger (see in-teraction effect in the middle equation). Higher turnover, growth (positive ornegative) and cultural inertia exhibit opposing effects. Cultural heterogene-ity is reduced with higher hiring selectivity (although in non-linear fashion),strong alienation, negative growth and a big size ratio. Heterogeneity riseswith (surprisingly) management-based socialization, higher turnover, posi-tive growth, layoffs in the target and both mechanisms of cultural inertia.Overall, the most consistent straightforward effect consistent with manage-rial goals of increasing mean enculturation and reducing heterogeneity asquickly as possible comes from the high alienation condition. Other variablesproduce either undesirable effects on the two outcomes (turnover, growth,inertia), or inconsistent effects across the two outcomes (e.g., management-based socialization,layoffs), or possibly time-dependent nonlinearities (e.g.,hiring selectivity, size ratio).
Although all effects are significant because of the large sample size, theseestimates also generally reenforce the impressions gleaned from the plots.
17
Relatively small coefficients are associated with the turnover, growth, lay-off policy and inertia variables. Larger effects are associated with hiringselectivity, management-based socialization, alienation, and size ratio.
Table 10-2 shows estimates of very similar models for the simulated datacut into cross-sections at two different points in time, 6 months and 36months. The only difference in the models is that the elapsed time sincemerger variable has been dropped and its interaction with size ratio. Com-paring estimates across the two cross-sections allows us to see more con-cretely how any time-dependent effects might be operating. For the mostpart, the estimates in this table agree with those reported in Table 10-1.However, the source of the non-linear effect of hiring selectivity seen abovenow seems clear: high hiring selectivity actually increases heterogeneity inshort run. Undoubtedly, this is because the immediate post-merger is gen-erally characterized by a low mean level of enculturation and hiring veryselectively (from a pool with a high mean) introduces more variability. Notealso that the effects of hiring selectivity are greatest in the later period, oncethe transition has eased. Also, note that again the single effect consistentlyproducing managerially desirable effects on the outcomes at both times ishigh alienation.
Regressions estimates track the central (mean) tendencies in the data, ofcourse.7 But as we see in Figure 10-2, considerable variation occurs aroundthe mean trajectories. Of special substantive interest for post-merger cul-tural integration are those conditions where cultural heterogeneity actuallyrises over time, because this pattern reflects a situation where integrationlikely appears to organizational participants as failing. In order to identifythese conditions and the ways in which they cause cultural heterogeneity toincrease, we selected all observations where the standard deviation of en-culturation rises between two points in time and calculated mean values foreach of the covariates for each subset of people shown in Figure 10 1. Thesemeans are shown in Table 10-3.
The first thing to note about Table 10-3 is that rising heterogeneity is nota rare occurence. This can be seen by comparing the number of observations(shown in the last row) across the columns.8 In fact, in over 20% of the
7Although we do not report the estimates here, we have run regressions similar to thosein Table 10-1 with variables measuring directly the demographic flows of individuals intoand out of the various sets of people demarcated in Figure 10-1. We regard this as anattempt to control for the “disruption” effect identified in Chapter 6. These demographicflow variables do show significant effects on the trajectories of both the mean of encultur-ation and its standard deviation. However, after controlling for these flows, we still seethe same general pattern of effects for the experimental conditions shown in Table 10-1.
8The number of observations in the full sample here is larger than in the previous tables
18
Table 2: Regressions for merged organization at months 6 and 36
Mean Standard Mean Standardlevel of deviation in level of deviation in
enculturation enculturation enculturation enculturationat month t=6 at month t=6 at month t=36 at month t=36
C̄t σct C̄t σct
Constant .141* .142* -.435* .124*Dep. var. at merger .710* .199* .238* -.057*Selectivity
simulated observations, cultural heterogeneity among the individuals fromthe target increases. In over 6% of the observations, heterogeneity in thewhole post-merger organization rises.
The first column in Table 10-3 shows the means for the full sample. Itreflects exactly the experimental design of the simulation. For example,each of the three selectivity conditions shows a mean of .333 because thesevariations were run in equal installments across all other conditions. Thenext three columns of means are calculated for each of the three subsets ofpeople only for cases where cultural heterogeneity rises. By comparing themeans in these columns with those in the first (the full sample), the over-or under-representation of a condition in the rising heterogeneity cases canbe inferred. By comparing the means of these columns with each other, thelocation of greatest increases in heterogeneity can be inferred. For instance,when selectivity is high, heterogeneity rises in all three sets of people, be-cause the means of .407, .366 and .860 all are greater than the design factorof .333. Also, in cases where the heterogeneity of the acquiror rises, highselectivity is especially prevalent.
Among the more interesting findings in Table 10-3 is the comparisonfor management-based socialization, which shows that strong managerialsocialization can lead to rising heterogeneity in the post-merger organizationbecause of its effects on those individuals from the target. Likewise, we findit interesting that the no cultural inertia condition makes it less likely thatheterogeneity will rise in the post-merger entity but more likely to rise amongtarget-based people but not those from the acquiror, while full inertia tendsto produce the opposite effects. Finally, note that high alienation also tendsto lessen overall heterogeneity in the post-merger organization but that itdoes induce higher heterogeneity in the group from the target. Obviously,even when heterogeneity is declining in the whole post-merger organization,it may be rising among the target people, suggesting that they are often infor a rocky experience.
7 Discussion
It is widely recognized that achieving cultural integration in a newly mergedorganization is difficult and sometimes even impossible. Prior cultural dif-ferences between two merged entities often persist for months and years,possibly generating conflict and rendering the organization less effective.Indeed, the widespread inability of mergers to accomplish their goals fre-
because in comparing values at t and t + 1 we were able to use the wave at t = 0.
21
quently gets blamed on the failure to integrate the cultures of the mergingorganizations.
Cultural integration following a merger is almost always analyzed interms of the contents of the organizational cultures involved. The basicquestion raised is, “Are the cultures compatible or consistent?” Analysesthen focus on how the various elements of the cultures might be reconciled,compromised or emboldened in an organization’s operation. Both popularand scholarly assessments tend to use this mode of reasoning.
While clearly insightful, the content-based approach to studying culturalintegration following a merger also has limitations (see Chapter 1). First,these analyses are often conducted at a high level of abstraction and itis difficult to know how much of an organization’s culture is captured bysimple characterizations such as “hierarchical” or “free-wheeling.” Second,there is no developed theory guiding the assessments of cultural elements ascompatible or not; the assessments tend to be intuitive and ad hoc (or posthoc) in most instances. Third, since many cultural phenomena are tacitin nature, judging how people will react to their alteration is a dauntingtask for social science. It seems to us that such reactions likely depend onthe particular phenomena involved as well as the process by which theiralteration is attempted.
A complementary way to assess cultural integration following a merger isto examine the distributive systems underlying the organizational cultures.When the demographics of two merger partners show fluid movement ofindividuals into and out of the organizations, then it seems that culturalintegration might be achieved more quickly than if the two partners showstagnant demographics with little movement in and out. The primary as-sumption behind such a conjecture is that it is easier to recruit and socialize“new” individuals to the cultural ideals of the merged organization than itis to re-socialize and re-train incumbents already inculcated in the ways ofone or the other partner.
Using the model of organizational cultural transmission from Chapter 4,we examined post-merger cultural integration in a synthetic way, using bothcontent and distributive approaches. We began by setting up the researchproblem by assuming that the content differences among merging organiza-tions are very strong. We then investigated how quickly cultural integrationmight be achieved under a variety of commonly seen demographic condi-tions. We concentrated on variations in organizational growth rate and inthe size ratio of the acquiring organization relative to the acquisition tar-get, conditions readily observable to a number of real world cases. We usedsimulation methods to control other factors in the integration process.
22
In terms of outcomes, our simulation experiments looked at both culturalpreferredness to management, measured by the mean enculturation level ofindividuals in the merged organization, and cultural heterogeneity, measuredas the standard deviation of the enculturation levels of the individuals inthe merged organization.
The findings suggest that while post-merger cultural integration is influ-enced by many demographic processes, the strongest effects are associatedwith hiring selectivity, management-based socialization, high alienation, anda large size ratio. Moreover, among these conditions only high alienationconsistently across time produced the managerially desired goals of highmean enculturation and lowered cultural heterogeneity. Other conditionseither showed small or inconsistent effects in terms of likely managerial goalsfor post-merger cultural integration. These included the commonly used tac-tic of laying off individuals who came from the acquired target organizationas well as positive reenforcement mechanisms such as high management-based socialization. Furthermore, comparative examination of the caseswhere heterogeneity rises suggests that conditions, such as high alienation,that reduce overall heterogeneity in the post-merger unit often increase het-erogeneity among the target people while accomplishing this task.
The implications of these findings for managerial policy are straightfor-ward. The fastest and most consistent way to achieve cultural integrationconsists of ramping up the alienation effects, that is, making individualswho are a long distance from the cultural ideal feel so uncomfortable thatthey will leave. In the process, we expect that cultural heterogeneity amongthose from the acquired target organization will rise, likely because some ofthem respond quickly while other do not. A transitory period of turmoilwould not be surprising.
23
Appendix: A Model of Cultural Transmission
Representing Culture
We assume that an individual’s propensity to embrace the values and normsof a particular organizational culture can be meaningfully represented by asingle measure indicating the degree to which an employee fits management’scultural ideal. We refer to this measure of cultural fitness as the encultura-tion level; it represents a very specific conception of organizational culture,a certain fitness measure of an individual to the culture. Enculturation canoccur before an individual joins an organization (for example, in a profes-sional school), and employees can be further enculturated through social-ization (Chatman, 1991). Although management teams will differ in typesof factors they use to assess the level of enculturation, it includes knowl-edge, qualification, and willingness to embrace and comply with the cultureand may reflect such factors as work experience and education. Encultur-ation can occur before an individual joins an organization (for example, ina professional school) and employees can be further enculturated throughsocialization.
Formally, we designate an employee’s enculturation level, or fitness score,as Ci, and measure this on the unit interval; that is, if Ci is the fitness scorefor employee i, then Ci ∈[0, 1], where the ideal employee would have a fitnessscore of 1.
Representing culture by a single variable does not imply that it is in-herently unidimensional but, rather, that in a specific organizational con-text some overall managerial assessment about one’s cultural predispositionand acceptance is possible. That is, we assume that all relevant culturalcharacteristics of an employee can be combined to produce a single scoremeasuring the extent to which the employee conforms to the ideal employeefrom the perspective of management. This is analogous to the way in whicheconomists use the concept of utility to measure the desirability of multi-dimensional decision alternatives; for example, a consumer might combinemultiple characteristics of a product to assign a single utility score indicatingthe product’s value to the consumer.
Technically, the validity of measuring cultural fitness (from manage-ment’s perspective) on a single scale —Ci for person i—rests on two simpleassumptions. First, individuals must be rankable in terms of their culturaldesirability to management, i.e., it is meaningful to say that person i actu-ally is preferred to person j. Implicit here is assumption that managementas a group has consistent preference orderings for the cultural desirability
24
of employees. This is justified either if a superordinate cultural ideal is im-posed on management–for example, by the CEO or the board of directors–orif the variation in managerial preferences is trivial compared to the culturalvariation among employees (March, 1962), which is a sensible view, giventhe filtering process that tends to select individuals with similar preferencesfor managerial positions (March and March, 1977).
Second, the preference ordering needs to be transitive. That is, if i
is preferred to j and j is preferred to k, then i is preferred to k. Thesetwo assumptions are sufficient to prove Ci>Cj if and only if i is culturallypreferred to j (Coombs, Dawes, and Tversky, 1970). This representationtheorem justifies the use of a single scale (Ci) to measure cultural desirability,even though an individual’s cultural characteristics are multidimensional.
A major attraction of the enculturation measure is that it allows us tobe analytical without abstracting too far away from the phenomenon. Wethus retain a degree of naturalism about culture, as advocated by Barth(1993). A member of an organization would likely not know what to thinkabout a factor analysis reporting multi-dimensional scores describing thecontent of his or her organization. But that same person could clearly relateto a measure of how well he or she fits in, as could his or her peers andboss. In other words, the fitness-based enculturation variable we use is verymeaningful socially.
The Cypress Semiconductor company, discussed briefly in Chapter 1,formalizes assessments of overall cultural fit during the employee interviewand evaluation process, using a single scale. CEO T.J. Rodgers (1990: 88)describes the techniques they use as the last step in a rigorous interviewprocess:
Check for cultural fit. Most companies claim to do this, butfew are systematic. We probe work attitudes and career goalsthrough a questionnaire that requires brief but direct answersto open-ended questions. The questionnaire forces candidates tobe as specific as possible about hard-to-quantify issues that areaddressed only obliquely, if at all, in most evaluation processes.Among the questions are: How is the morale in your companyor department? Why? What do you expect Cypress to offer youin the way of a work environment that your employer doesn’toffer? What would your boss say is your best attribute? Whatwould the ’needs improvement’ section of your performance re-view address? Can you describe your personal experience witha difficult boss, peer or subordinate? (Rodgers, 1990: 88)
25
Organizations typically are not so formal in their cultural assessments;in fact, they may not even be able to articulate fully the evaluation cri-teria in use. Neither issue presents a problem for the representation ofculture, so long as the conditions of rankability and transitivity in prefer-ences hold. And, we think that this is usually the case, as cultural andsocial criteria manifest themselves systematically in interactions, interviewsand evaluations driven explicitly by organizational routines and implicitlyby homophily.
Model Specification
The cultural transmission model consists of three mathematical functionsand a set of embedded parameters. The functions give: (1) the number ofpersons hired in a period of time; (2) the process of change in the encultur-ation level of each person within the organization; and (3) the number ofpersons departing from the organization in a period of time. The parametersof the model control the growth rate of the organization, the recruitmentrate to vacancies, the selectiveness of the recruitment process with respectto cultural criteria, the intensity of socialization, the natural decay rate ofsocialization, and the components of the turnover rate. We discuss brieflyeach function in turn, using the relevant parameters as necessary.
Hiring function
Organizations hire employees to fill vacancies created by departures andto staff new positions generated by growth. Recruitment is not, however,usually matched perfectly to positions available, since search processes taketime and effort. Realizing this, firms can project labor needs and “over-recruit” to the immediate situation, or they can fill positions sequentially,accepting that there will always be a gap between labor needs and staffing.
Let the number of persons hired in a time period be denoted by NB(t),and the number of vacancies by V (t). Organizational hiring can be modeledas
and rg is the organizational growth rate associated with stochastic changes inthe number of positions, ND(t) represents the number of persons departingthe organization at time t, N(t) is the number of members of the organizationat time t, and a stochastic rate of recruitment to vacant positions (rr) is usedto find values of Hi(t).
Hiring can be selective, in that a particular type of person can be definedas needed and then sought after, or it can be more opportunistic, in the senseof using a wider segment of the population for the recruitment pool. Selec-tivity usually requires more time and resources than opportunism. But thispresumably is balanced to some extent by the reduced socialization require-ments and lower turnover associated with selectivity. In either case, hiringdecisions will be imperfect, because noise is likely to obscure some relevantinformation about potential employees. So even under high selectivity, someindividuals will require substantial efforts in socialization (or removal fromthe organization) if a strong culture is to be maintained.
To simulate, individual hiring can be conceived as drawing individualsfrom a pool of candidates. The hiring pool has a distribution of values onthe desired characteristics and the distribution is known for the pool, butthe choice of any particular individual is somewhat random. In fact, thecharacteristics of the hiring pool are determined by the selectiveness of thehiring policies of the organization. The candidate hiring pool can be moreor less centered on the desired characteristics, and more or less noise can betolerated in the information.
To keep things simple, imagine that there is only a single culture measureof interest and that it can be represented on a continuous scale from zeroto one. The hiring pool of candidates can then be defined by its mean andvariance on this variable. In the case of high selectivity, this would imply arelatively high mean, say .8, and a fairly low variance, say .1. By contrast,an opportunistic hiring policy implies a much lower mean for the candidatepool and a high variance.
As explained in Chapter 3, in our modeling efforts we assume that anindividual’s propensity to embrace the values and norms of a particular orga-nizational culture can be meaningfully represented by such a single measureindicating the degree to which an employee fits management’s ideal. Werefer to this measure of cultural fit as the enculturation level. For a givenindividual i, we denote his or her enculturation level at time t by the vari-able Cit, which is defined to vary between 0 and 1. Distributional measures
27
0.2 0.4 0.6 0.8
20
50
80
Enculturation Mean for New Hires
Perc
ent V
acan
cies
Fille
d pe
r Tim
e Pe
riod
Figure 4: Behavior of simulated hiring process.
of these Cit scores characterize the organizational culture at any particularpoint in time. In particular, the mean level of enculturation C̄ representsthe degree to which the culture conforms to the management ideal and ameasure of dispersion, such as the standard deviation of enculturation (σc)across all individuals, indicates cultural heterogeneity.
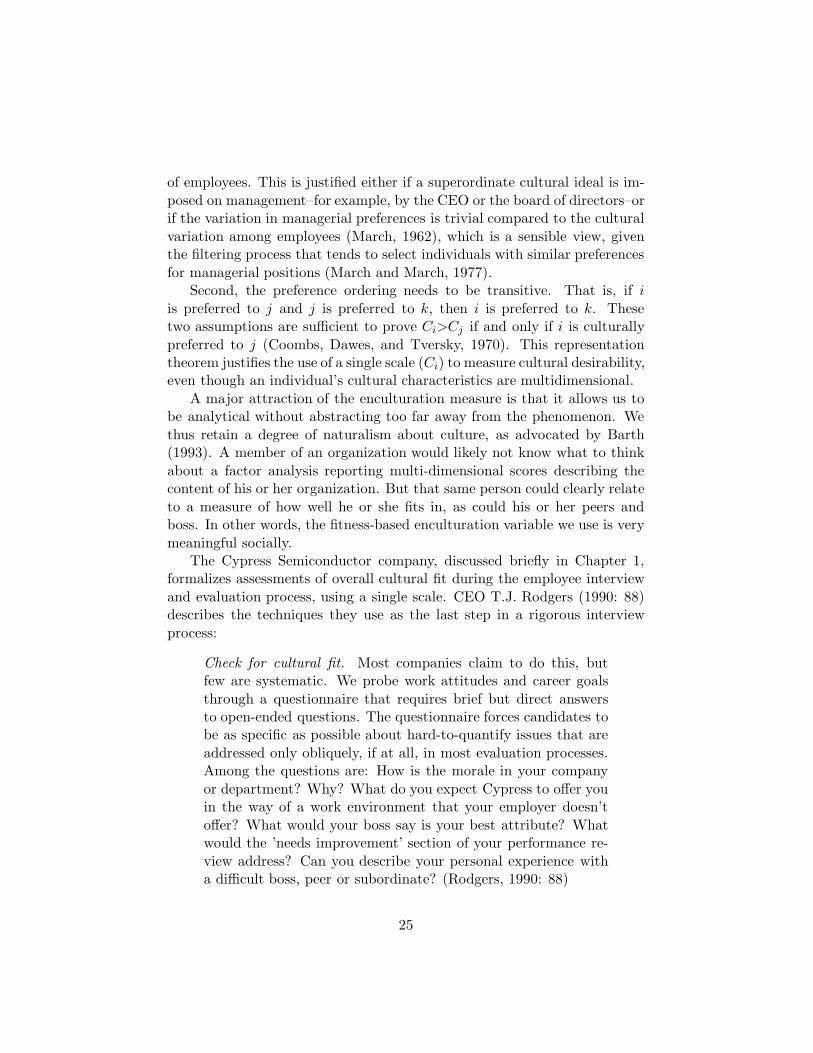
We simulate hiring on the basis of cultural criteria by drawing randomlyvalues of Cit from distributions parameterized to yield a mean of C̄h and astandard deviation of σch. The parameters of the distribution are definedby the hiring policies simulated. The average number of persons hired isdriven by the NB(t) equation given above. At each time period, therefore,a number of persons with a variety of dispositions toward the culture of theorganization is hired.
Figure 4.1 shows the behavior of the simulated hiring process, depictingthe percentage of vacancies filled per time period by enculturation mean ofthe new hires. So, selectivity slows the hiring process in the model, as wewould expect in a real organization. Obviously, the more selective the hiringpolicies, the fewer positions filled per vacancy.
28
Socialization function
Once an individual is hired, he or she is subject to a variety of influenceswith respect to the culture of the organization. Management attempts toinculcate the new employee fully in the aims, ways, and whims of the orga-nization. This might take the form of explicit orientation programs and ac-tivities or reward and punishment systems, or it might be produced throughmore subtle means. In any case, management has a conception of the idealemployee on the cultural dimensions it considers relevant, and the objectivefrom its point of view is to produce a person socialized to within some ac-ceptable distance of this ideal. Obviously, management’s clarity of thoughtabout what constitutes an ideal employee may be more or less specific, andits efforts to produce such a person may be more or less successful.
Another important source of cultural socialization arises from the ex-isting employees. Group and peer pressure effects are some of the best-documented phenomena in the social science world (e.g., Sherif, 1935; Asch,1951; Kiesler and Kiesler, 1969; O’Reilly and Caldwell, 1979). So, if anindividual enters an organization filled with persons more highly socializedto the norms of the culture, then it is reasonable to expect that, in the nor-mal course of interaction and work with these persons, the individual willbecome more socialized. Likewise, if an individual enters an organizationwhere the existing employees are only weakly socialized, then he or she willtend to become weakly socialized even if he or she entered in a state moreaccepting of the norms encouraged by management. In other words, in asimple model neglecting social distances and innate individual differences,individuals get pulled toward the mean level of socialization among others.
There is also apparently a “natural” source of desocialization. Labora-tory studies have shown that socialization decays over time in the absenceof other stimuli (Jacobs and Campbell, 1961). So in addition to the othertwo pulls–toward the group mean and toward the management ideal–thereis also a pull toward “zero” socialization.
Any individual’s change over time with respect to socialization is a com-bination of the pulls from three sources: management, peers, and decay.The three forces likely vary in their relative strengths. The expected changein socialization is modeled as a function of the individual’s current distancefrom a target for each source (one, the maximum value of C, for manage-ment; C̄ , the group enculturation mean for peers; and zero, the minimum ofC, for decay), multiplied by a parameter. The use of the mean socializationlevel of peers in the specification asssumes that all peers are in communica-tion with each other and are equally influential (French 1956). We use this
29
0
0.5
10
0.5
1
−0.5
0
0.5
C(mean)=.2
Mgmt Soc
Soc
ializ
atio
n−
cha
nge
Inte
nsi
ty
0
0.5
10
0.5
1
−0.5
0
0.5
C(mean)=.8
Enculturation
Figure 5: Socialization-change intensity.
assumption here in developing a baseline model, recognizing that it may beimplausible in many organizational settings. In Chapter 8, we extend andrefine this aspect of the model, letting influence be dynamic and unequalacross an individual’s social network.
The model also introduces an error term to allow for noise in the process.We posit socialization-change intensity as
where e is an error term and αmgt, αpeer, αdecay are parameters representingthe pulls toward ideal socialization (from management), mean socializationlevel (from peer pressure), and zero socialization (from decay), respectively.In effect, the denominator normalizes the function Ai(t) to ensure that anindividual’s Cit score remains between 0 and 1. The error e is constructedto be normally distributed with mean zero and adjustable variance.
Figure 4.2 shows the response of the socialization-change intensity func-tion when mean enculturation is at a low (.2, the figure on the left) anda high level (.8, the figure on the right). In both figures, the vertical axisshows socialization change intensity, Ai(t), the leftmost horizontal axis gives
30
the management socialization parameter, αmgt, and the rightmost axis de-picts an individual’s enculturation level, C(i,t). An important insight of bothfigures is that the lower a person’s enculturation, C(i,t), the greater his/hersocialization-change intensity for any given level of management socializa-tion, αmgt; that is, less enculturated individuals get pulled up more for agiven effort from management. Moreover, this effect is stronger when theoverall enculturation mean is lower, as comparing the slopes of the shadedsurfaces of the two figures indicates.
Individuals can be more or less susceptible to socialization, whatever itssource. Susceptibility is greatest at the time of entry into the organizationand then declines with tenure (Louis, 1980). We simulate susceptibility tosocialization forces with the following equation:
Bi(t) = β0 + exp [−β1 − β2Ui,t−1] (7)
where Ui,t−1 is individual i’s tenure with the organization at t − 1. Withthe parameter values used here (β0=.02; β1=.60; β2=.30), susceptibilitybegins with a value less than unity and declines exponentially with tenuretoward a non-zero asymptote. (See Figure 4.3 for a visual representationof susceptibility, Bi(t).) It is important for the value of the function toremain between 0 and 1 because it will be used below as a multiplier. Inthis specification, β0 is associated with the asymptotic level of susceptibility,β1 with the level of susceptibility at entry (tenure equals zero), and β2 withthe speed of the decline in susceptibility with increasing tenure from theentry level to the asymptotic level.
The socialization function is completed by taking an individual’s priorenculturation level Ci,t−1 and adding to it the effect of socialization-changeintensity Ai(t) multiplied by its influence Bi(t). That is,
Ci,t = Ci,t−1 + Ai(t)Bi(t) (8)
Turnover function
Individuals leave organizations for a wide variety of reasons, including betterjobs, dissatisfaction, and family concerns. For present purposes, it makessense to divide the causes of turnover into two separate factors, one associ-ated with the culture of the organization and the other summarizing all otherfactors. The number of persons departing in any given time period resultsfrom the application of these factors to each person in the organization.
Turnover might be connected to organizational culture for at least tworeasons. First, individuals who do not accept the culture might be motivated
31
12 24 36 48 600
0.2
0.4
0.6
Tenure (months)
Susc
eptib
ility
Figure 6: Susceptibility to socialization by tenure.
to leave voluntarily (Chatman, 1991). Second, those who do not fit in andwho fail to change might be forced to leave involuntarily. In both cases,the issue may be thought of as one of alienation, related to the distancebetween an individual’s embodiment of the culture and the managementideal (Wanous, 1980). We formalized the alienation process with the termγ1(1 − Ci)3, where γ1 is a parameter allowing greater or less sensitivity toalienation as a cause of turnover. The value of this expression increasesrapidly as Ci approaches zero, but in general the effect of alienation onturnover in the model is much smaller than the effect of other (noncultural)factors.
Allowing all other reasons for leaving an organization (Chatman andJehn, 1994) to be captured in an adjustable base-turnover factor (associatedwith the parameter γ1), the number of persons departing the organizationin time period t is then given by
ND(t) =N(t−1)∑
i=1
Ei(t) (9)
32
0
.5
10
0.3
0.60
0.25
0.5
EnculturationAlienation
Pro
babi
lity
of T
urno
ver
Figure 7: Behavior of the turnover function.
where
Ei(t) =
{1 if individual i leaves the organization in period t,
0 otherwise.
The stochastic rate of departure for individual i, used to find ND(t), is
rit = γ0 + γ1[1− Ci,t−1]3 (10)
where both γ0 and γ1 are parameters of the rate.Figure 4.4 shows the behavior of the simulated turnover function for two
different base rates, γ0=.005 (left graph) and γ0=.03 (right graph). In bothplots, the vertical axis gives the probability of turnover, the leftmost hori-zontal axis the parameter associated with alienation, γ1, and the rightmostaxis an individual’s enculturation level, Ci,t−1. As the shaded surfaces ofthe plots show, turnover rises sharply when enculturation is low and thealienation parameter,γ1, is high.
As a conceptual overview, Figure 4.5 shows a visualization of the model.The graph summarizes the main processes of the model, as seen from thepoint of view of an individual. It depicts the order of processes that operateon an individual during each time period.
33
Layoff
Mgmt Peers Decay
SocializationIntensity
SocializationSusceptibility
Change inEnculturation
Alienation Turnover
Ci
Ui
YesExit
No
Figure 8: The cultural transmission model.
References
Asch, Solomon E. 1951. “Effects of Group Pressure Upon the Modificationand Distortion of Judgments.” In H. Guetzkow (ed.), Groups, Leader-ship and Men: 117-190. Pittsburgh: Carnegie Press.
Barth, Frederik. 1993. Balinese Worlds. Chicago: University of ChicagoPress.
Blau, Peter M. 1977.“A MacrosociologicalTheory of Social Structure.” Amer-ican Journal of Sociology, 83: 26-54
Burke, W. Warner and Peter Jackson. 1992. “Making the SmithKline Beechammerger work.” Human Resource Management, 30: 69-87.
Chatman, Jennifer A. 1991. “Matching People and Organizations: Selectionand Socialization in Public Accounting Firms,” Administrative ScienceQuarterly, 36: 459-484.
Chatman, Jennifer A. and Karen Jehn. 1994. “Assessing the Relationship be-tween Industry Characteristics and Organizational Culture: How Dif-ferent Can You Be?” Academy of Management Journal, 37: 522-553.
34
Coombs, Clyde H., Robyn M. Dawes, and Amos Tversky. 1970. MathematicalPsychology. Englewood Cliffs, NJ: Prentice-Hall.
Delaney, K.J. and D. Woodruff. 2001 “In Europe H-P and Compaq FaceTougher Merger Task,” Wall Street Journal (September 6, 2001).
Feder, B. 2000. “Ill-Fated Merger Costs California Universities’ Medical CareCenters 176 Million,” San Jose Mercury News (December 14, 2000).
French, J. R. P., Jr.. 1956. “A Formal Theory of Social Power.” PsychologicalReview, 63: 181-194.
Holmstrom, B. and S.N. Kaplan. 2000. “Corporate Governance and MergerActivity in the U.S.: Making Sense of the 80s and 90s.” Unpublishedms, U. of Chicago Graduate School of Business.
Jacobs, R.C., and P.T. Campbell. 1961. “The Perpetuation of an ArbitraryTradition Through Successive Generations of a Laboratory Microcul-ture.” Journal of Abnormal and Social Psychology, 62: 644-658.
Kaplan, S.N., M.L. Mitchell, and K.H. Wruck. 1997. “A Clinical Explorationof Value Creation and Destruction in Acquisitions: Organziational De-sign, Incentives and Internal Capital Markets,” Unpublished ms, U. ofChicago Graduate School of Business.
Kiesler, C.A., and S.B. Kiesler. 1969. Conformity. Reading, MA: Addison-Wesley.
Louis, Meryl Reis. 1980. “Surprise and Sense Making: What NewcomersExperience in Entering Unfamiliar Organizational Settings.” Adminis-trative Science Quarterly, 25: 226-251.
March, James G.. 1978. “Bounded Rationality, Ambiguity, and the Engi-neering of Choice.”Bell Journal of Economics, 9: 587-608.
March, James C., and James G. March. 1977. “Almost Random Careers: TheWisconsin School Superintendency, 1940-1972.”Administrative ScienceQuarterly, 22: 377-409.
McWilliams, G. 2001. “Computer Megamerger: Will Bigger be Better?”Wall Street Journal September 5.
O’Reilly, Charles, A. III and David Caldwell. 1979. “Information Influenceas a Determinant of Perceived Task Characteristics and Job Satisfac-tions.” Journal of Applied Psychology, 64: 157-165.
Pyati, A. 2001. “UCSF/Stanford: Marriage was Rough; Divorce is Expen-sive,” San Francisco Business Times April 21, p. 25.
35
Rodgers, T.J.. 1990. “No Excuses Management,” Harvard Business Review(July-August): 84-98.
Sherif, Muzafir. 1935. “A Study of Some Social Factors in Perception.”Archives of Psychology, 187.
Tam, Pui-Wing. 2003. “Merger by Numbers.”Wall Street Journal, April 28,A1.
Vlasic, B. and B.A. Stertz, 2000. Taken for a Ride: How Daimler-Benz Droveoff with Chrysler. William Morrow: New York.
Weber, Yaakov. 1996. “Corporate cultural fit and performance in mergersand acquisitions.” Human Relations, 40: 1181-1202.
Weber, Roberto A. and Colin F. Camerer. 2003. “Cultural conflict andmerger failure: An experimental approach.” Management Science, 49:400-415.
Williams, M. 2001. “H-P’s Deal for Compaq Has Doubters as Value of PlanFalls to 20.52 Billion,” Wall Street Journal (September 5, 2001).