70
© 2016 Vizient and AAMC Page 1 Merit-Based Incentive Payment System Proposed Rule CY 2016 June 1, 2016 powered by Vizient & AAMC

© 2016 Vizient and AAMC Page 1
Merit-Based Incentive Payment System Proposed Rule CY 2016
June 1, 2016
powered by Vizient & AAMC

© 2016 Vizient and AAMC Page 2
Slides on the Proposed Rule Prepared by:
• Gayle Lee, [email protected]
• Tanvi Mehta, [email protected]
• Ivy Baer, [email protected]
Analysis Slides Prepared by:
• Jake Langley, [email protected]
• Kathy Yue, [email protected]

© 2016 Vizient and AAMC Page 3
1. Quality Payment Program (QPP)
2. Merit-based Incentive Payment System (MIPS) Overview
3. MIPS Eligibility
4. Identifiers and Data Submission
5. Performance Categories & Scoring
6. MIPS Reporting under APMs
7. Payment Adjustments
8. Other Topics Related to MIPS
Agenda

© 2016 Vizient and AAMC Page 4
“Tolerance of Uncertainty”

© 2016 Vizient and AAMC Page 5
January 2015--HHS Goes BIG on Quality & Value
© 2016 Vizient and AAMC Page 6
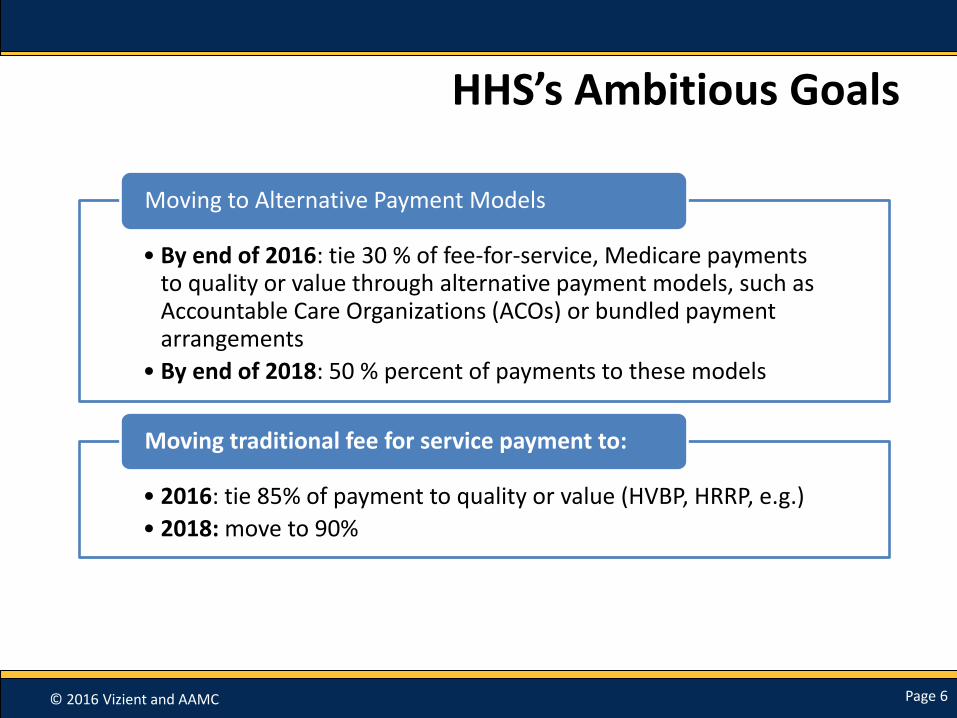
HHS’s Ambitious Goals
• By end of 2016: tie 30 % of fee-for-service, Medicare payments to quality or value through alternative payment models, such as Accountable Care Organizations (ACOs) or bundled payment arrangements
• By end of 2018: 50 % percent of payments to these models
Moving to Alternative Payment Models
• 2016: tie 85% of payment to quality or value (HVBP, HRRP, e.g.)
• 2018: move to 90%
Moving traditional fee for service payment to:

© 2016 Vizient and AAMC Page 7
April 2015: MACRA Is Enacted; MIPS/APMs Rule
The Current System: Volume Based The Future State: Value Based
Provide a service, get paid. Provide a service and your payment will vary depending on such factors as:• Meeting quality measures• Participating in alternative payment models• Being in a primary care medical home that meets
the standards set out by the Center for Medicare and Medicaid Innovation (CMMI)
The more services you provide, the more revenue you get
Starting in 2019 (based on performance in 2017) payments will be linked to quality and value under a Merit-based Incentive Payment System (MIPS) or Advanced Alternative Payment Model (APMs). Payment can be increased or decreased based on performance.
© 2016 Vizient and AAMC Page 8
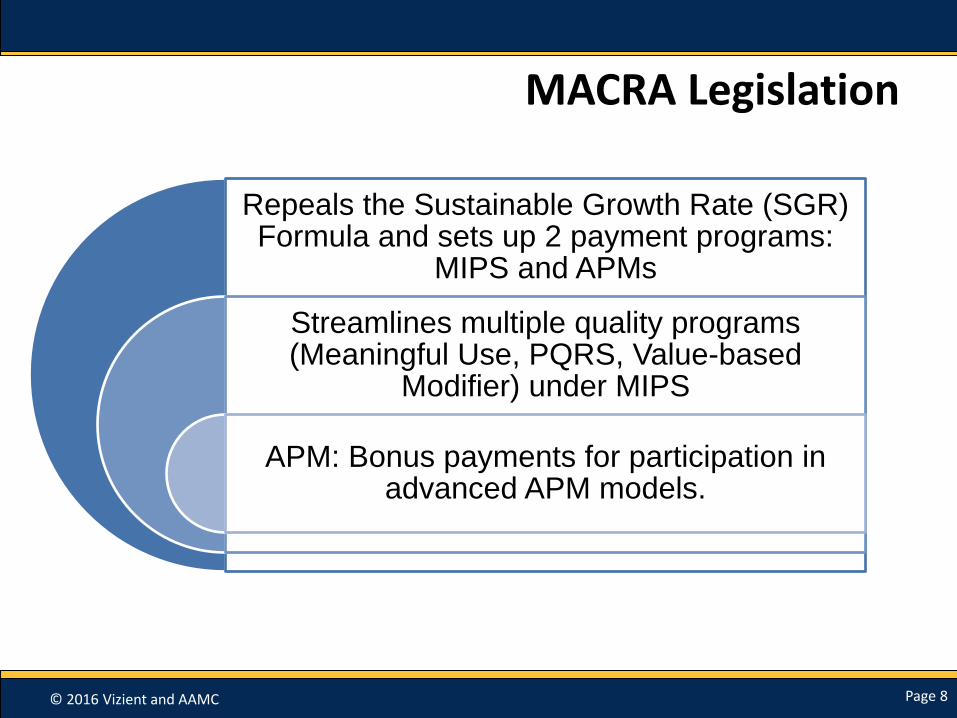
MACRA Legislation
Repeals the Sustainable Growth Rate (SGR) Formula and sets up 2 payment programs:
MIPS and APMs
Streamlines multiple quality programs (Meaningful Use, PQRS, Value-based
Modifier) under MIPS
APM: Bonus payments for participation in advanced APM models.

© 2016 Vizient and AAMC Page 9
Fee Schedule Remains Bedrock of Payment…
Fee Schedule
© 2016 Vizient and AAMC Page 10
…What changes is how much you get paid and why
© 2016 Vizient and AAMC Page 11
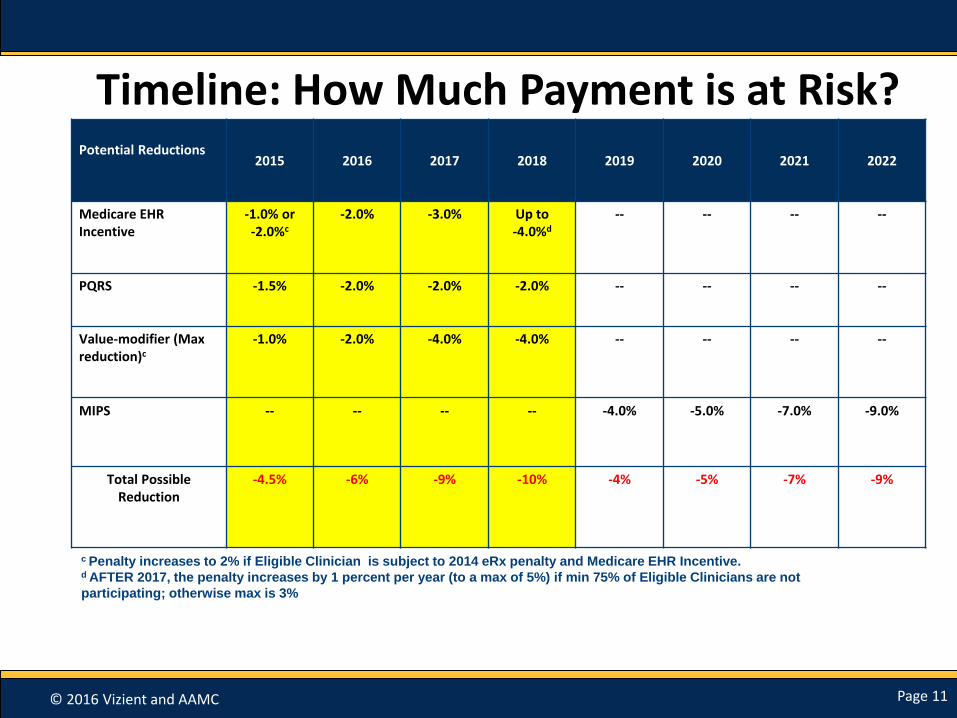
Timeline: How Much Payment is at Risk?Potential Reductions
2015 2016 2017 2018 2019 2020 2021 2022
Medicare EHR Incentive
-1.0% or-2.0%c
-2.0% -3.0% Up to-4.0%d
-- -- -- --
PQRS -1.5% -2.0% -2.0% -2.0% -- -- -- --
Value-modifier (Maxreduction)c
-1.0% -2.0% -4.0% -4.0% -- -- -- --
MIPS -- -- -- -- -4.0% -5.0% -7.0% -9.0%
Total Possible Reduction
-4.5% -6% -9% -10% -4% -5% -7% -9%
c Penalty increases to 2% if Eligible Clinician is subject to 2014 eRx penalty and Medicare EHR Incentive. d AFTER 2017, the penalty increases by 1 percent per year (to a max of 5%) if min 75% of Eligible Clinicians are not
participating; otherwise max is 3%

© 2016 Vizient and AAMC Page 12
MACRA Timeline2016 2017 2018 2019 2020 2021 2022 2023 2024 2025
2026 and later
Fee
Schedule
Updates
0.5 0.5 0.5 0.5 0 0 0 0 0 0 .75 for
QAPMS
.25 for
MIPS/
partial
QAPMS
QAPMS
5% Incentive Payment
MIPS 1st
MIPS
perfor-
mance
year
+4% +5% +7%
+9%
*QAPMS: qualifying alternative payment models based on Medicare payment/patient threshold requirements and excluded from MIPS
*MIPS: Merit-based Incentive Payment System, a consolidated pay-for-performance program, $500M annual pool is allocated for exceptional performers for
CY 2019-2023

© 2016 Vizient and AAMC Page 13
MACRA Crossroads: Quality Payment Programs
MIPS
+/- 4% in 2019
+/-9% in 2022
CMS estimates 687,000-746,000 clinicians
APMs
+5% for 2019-2024
CMS estimates 30,658-90,000 Eligible Clinicians would become QPs

© 2016 Vizient and AAMC Page 14
Placeholder for Polling Question #1
Are you participating or considering participating in one or more of the following models:
• Medicare Shared Savings Program-Track 2
• Medicare Shared Savings Program-Track 3
• Oncology Care Model 2-sided Risk
• Comprehensive Primary Care Initiative
• Next Generation ACO
• Other
• Not Applicable
© 2016 Vizient and AAMC Page 15
MIPS Overview and Eligibility

© 2016 Vizient and AAMC Page 16
Overview of MIPS
A New Consolidated
Pay-for-Performance
Program
Merit-Based Incentive Payment System (MIPS)
Value Modifier Program
Meaningful Use
Program
PQRS

© 2016 Vizient and AAMC Page 17
Who Does MIPS Apply To? Eligible Clinicians (starting in 2019)
• Physician
• Physician assistant (PA)
• Nurse practitioner (NP)
• Clinical nurse specialist
• CRNA
Starting 2021, this category can be expanded: Proposed rule mentions OTs, PTs, clinical social workers
© 2016 Vizient and AAMC Page 18
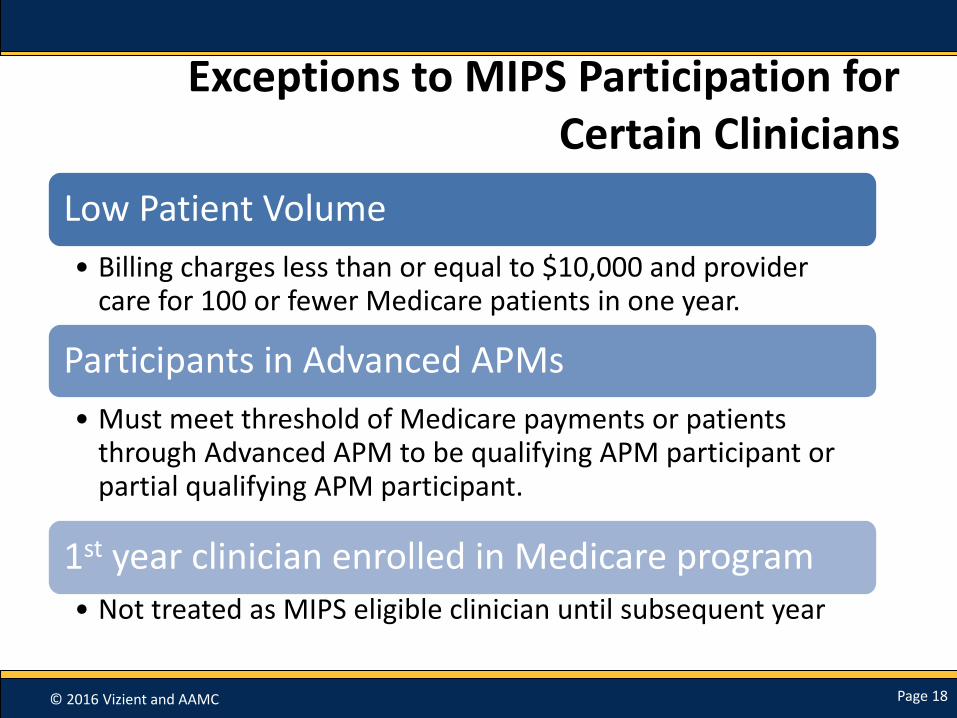
Exceptions to MIPS Participation for Certain Clinicians
Low Patient Volume
• Billing charges less than or equal to $10,000 and provider care for 100 or fewer Medicare patients in one year.
Participants in Advanced APMs
• Must meet threshold of Medicare payments or patients through Advanced APM to be qualifying APM participant or partial qualifying APM participant.
1st year clinician enrolled in Medicare program
• Not treated as MIPS eligible clinician until subsequent year

© 2016 Vizient and AAMC Page 19
MIPS Identifiers and Reporting Mechanisms

© 2016 Vizient and AAMC Page 20
Eligible Clinician Identifiers in MIPS: Two Options
Individuals
• Defined by Unique TIN/NPI
• Similar reporting mechanisms as current programs
Groups
• Defined by TIN
• Similar reporting mechanisms as current programs
• Also an option for MIPS/APM program

© 2016 Vizient and AAMC Page 21
How to Identify as a Group Under MIPS
MIPS General MIPS APM
• Single TIN of 2+ clinicians that have reassigned billing rights to the TIN
• All MIPS eligible clinicians in group must use same TIN
• Unique APM identifier for each eligible clinician who is part of APM entity
• Could include more than 1 TIN as long as the MIPS eligible clinicians identified as participants by unique APM participant identifiers
• Not all eligible clinicians in TIN need to be APM participants
• Must be APM participant on 12/31 of performance period

© 2016 Vizient and AAMC Page 22
Data Submission Mechanisms: Individual Reporting
Performance Category Individual Reporting
Quality QCDRQualified RegistryEHRAdministrative Claims (no submission required)Claims
Resource Use Administrative Claims (no submission required)
Advancing Care Information AttestationQCDRQualified RegistryEHR
CPIA AttestationQCDRQualified RegistryEHRAdministrative claims (if technically feasible, no submission required)

© 2016 Vizient and AAMC Page 23
Data Submission Mechanisms: Group Reporting
Performance Category Group Reporting
Quality QCDRQualified RegistryEHRCMS Web Interface (groups of 25 or more)CMS-approved survey vendor for CAHPS for MIPS (must be reported with another data submission mechanism)Administrative Claims (no submission required)Claims
Resource Use Administrative Claims (no submission required)
Advancing Care Information AttestationQCDRQualified registryEHRCMS Web Interface (groups of 25 or more)
CPIA AttestationQCDRQualified RegistryEHRCMS Web Interface (groups of 25 or more)Administrative Claims if feasible

© 2016 Vizient and AAMC Page 24
Placeholder for Polling Question #2
What mechanism are you currently using for reporting PQRS?
• QCDR
• Registry
• EHR
• GPRO Web Interface
• Claims

© 2016 Vizient and AAMC Page 25
Making a Choice
• Must use the same identifier (individual or group) across all 4 performance categories
• Reporting
– Every measure within the performance category must be reported using the same mechanism
– Each performance category may be reported using a different mechanism
© 2016 Vizient and AAMC Page 26
MIPS Performance Categories

© 2016 Vizient and AAMC Page 27
Composite Performance Score: Four Categories
Composite Performance Score (CPS)
QualityResource
Use
Clinical Practice
Improvement Activities (CPIA)
Advancing Care
Information (ACI)
(formerly MU)
© 2016 Vizient and AAMC Page 28
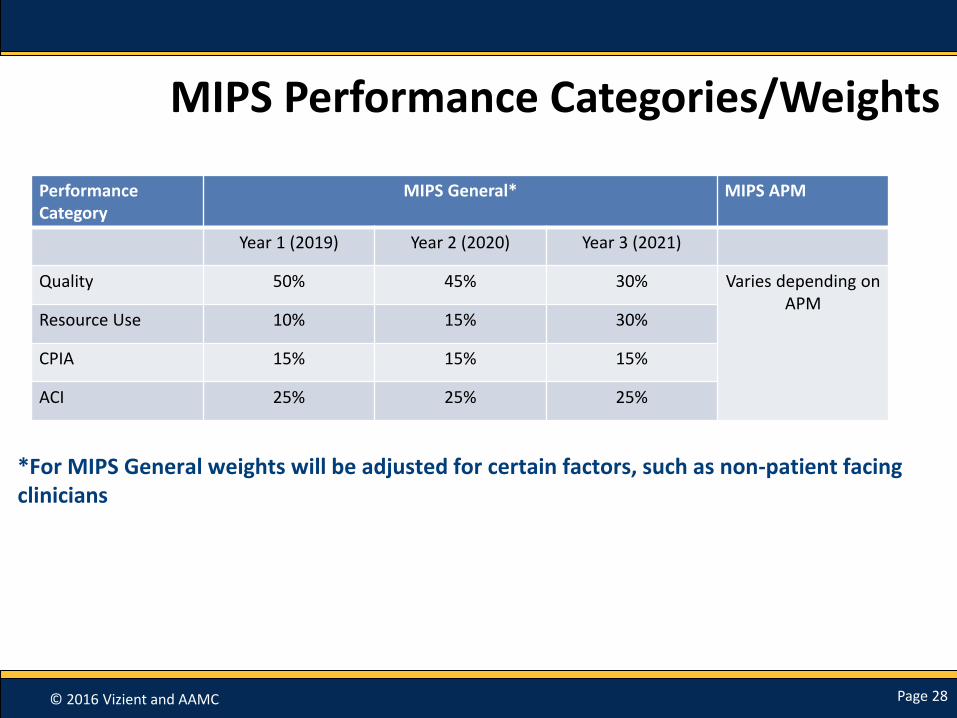
MIPS Performance Categories/Weights
Performance Category
MIPS General* MIPS APM
Year 1 (2019) Year 2 (2020) Year 3 (2021)
Quality 50% 45% 30% Varies depending on APM
Resource Use 10% 15% 30%
CPIA 15% 15% 15%
ACI 25% 25% 25%
*For MIPS General weights will be adjusted for certain factors, such as non-patient facing clinicians

© 2016 Vizient and AAMC Page 29
Composite Score Calculation
Performance Category Points Need to Get a Full Score Per Performance Category
Percentage Weight per Performance Category
Quality 80 to 90 points (varying on group size)
50 percent (decreases in later years)
Advancing Care Information (ACI) 100 points 25 percent
Clinical Practice Improvement Activities (CPIA)
60 points 15 percent
Resource Use Average score of all resource measures that can be attributed
10 percent (increases in later years)
If Secretary determines an Eligible Clinician does not have enough measures, then CMS may change weight distribution. (e.g. non-patient facing clinicians, hospital-based clinicians, significant hardship)
© 2016 Vizient and AAMC Page 30
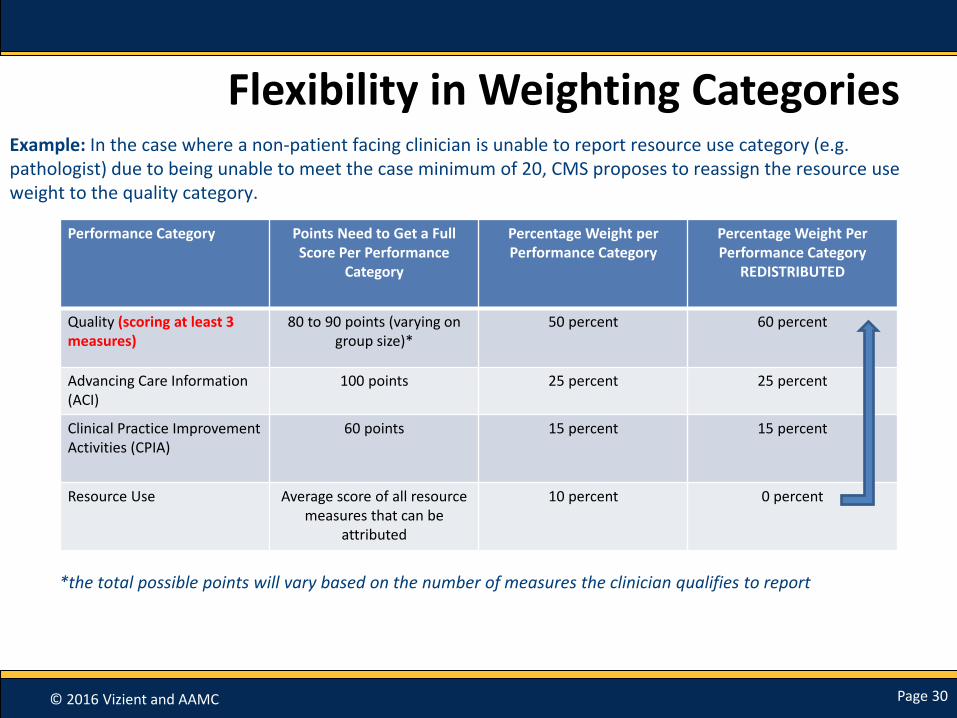
Flexibility in Weighting Categories
Performance Category Points Need to Get a Full Score Per Performance
Category
Percentage Weight per Performance Category
Percentage Weight Per Performance Category
REDISTRIBUTED
Quality (scoring at least 3 measures)
80 to 90 points (varying on group size)*
50 percent 60 percent
Advancing Care Information (ACI)
100 points 25 percent 25 percent
Clinical Practice Improvement Activities (CPIA)
60 points 15 percent 15 percent
Resource Use Average score of all resource measures that can be
attributed
10 percent 0 percent
Example: In the case where a non-patient facing clinician is unable to report resource use category (e.g. pathologist) due to being unable to meet the case minimum of 20, CMS proposes to reassign the resource use weight to the quality category.
*the total possible points will vary based on the number of measures the clinician qualifies to report
© 2016 Vizient and AAMC Page 31
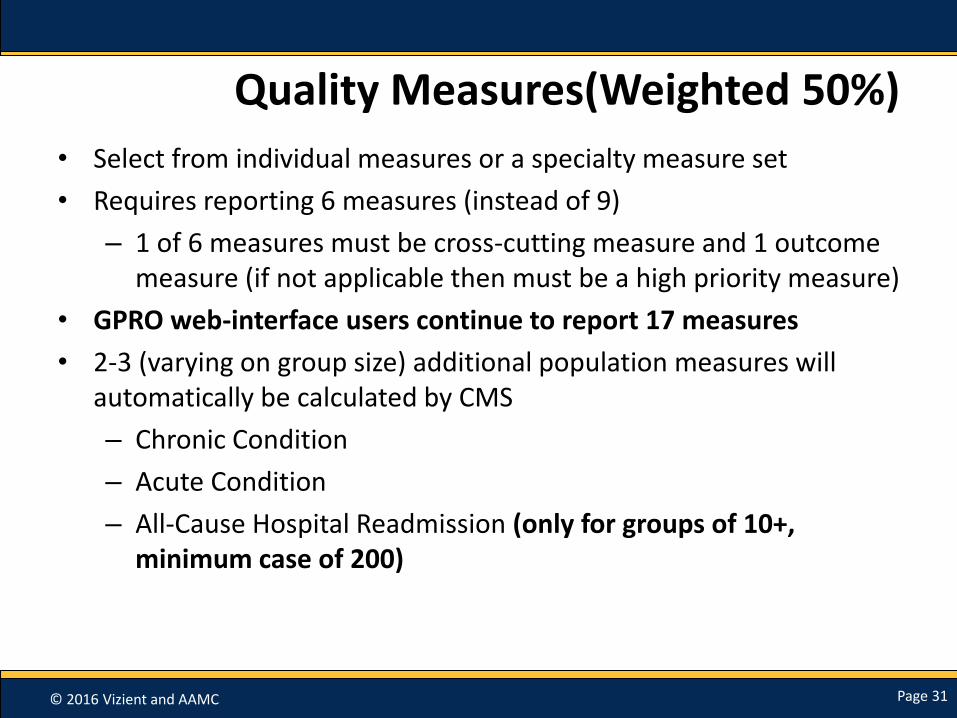
Quality Measures(Weighted 50%)
• Select from individual measures or a specialty measure set
• Requires reporting 6 measures (instead of 9)
– 1 of 6 measures must be cross-cutting measure and 1 outcome measure (if not applicable then must be a high priority measure)
• GPRO web-interface users continue to report 17 measures
• 2-3 (varying on group size) additional population measures will automatically be calculated by CMS
– Chronic Condition
– Acute Condition
– All-Cause Hospital Readmission (only for groups of 10+, minimum case of 200)

© 2016 Vizient and AAMC Page 32
Quality Scoring
Total points in quality category varies based on numerous factors including: case minimum, number of applicable measures, and group size.
• Each quality measure reported is worth 10 points
– Bonus points would be available for reporting high priority measures
• Example:
• Group of 10 or more (6 measures+3 population measures): (6x10)+(3x10)=90 points
• Group reporting via GPRO web+ 3 population measures: (17x10)+(3x10)=200 points

© 2016 Vizient and AAMC Page 33
Resource Use (Weighted 10%)
• Based on current two Value Modifier Program Measures
– Medicare Spending Per Beneficiary (MSPB)
– Total Per Capita Cost (includes Medicare Part A and B payments)
• Adds 40+ episode specific measures (for specialty groups)
• No additional reporting required; continues to be calculated on claims
• Excludes services billed under CPT codes 99304-99318 with the POS 31 modifier (SNF visits)

© 2016 Vizient and AAMC Page 34
Ambulatory Care Sensitive Conditions:Acute Conditions
0.00
2.00
4.00
6.00
8.00
10.00
12.00
Admissions per 1,000 Beneficiaries
Organization
Your TIN’s Performance Rate Benchmark Benchmark–1 Standard Deviation
80% of academic groups performed better than the national benchmark.
Note: lower rates indicate better performance

© 2016 Vizient and AAMC Page 35
Ambulatory Care Sensitive Conditions:Chronic Conditions
0.00
20.00
40.00
60.00
80.00
100.00
120.00
140.00
Admissions per 1,000 Beneficiaries
Organization
Your TIN’s Performance Rate Benchmark Benchmark–1 Standard Deviation
Note: lower rates indicate better performance
80% of academic groups performed worse than the national benchmark.
© 2016 Vizient and AAMC Page 36
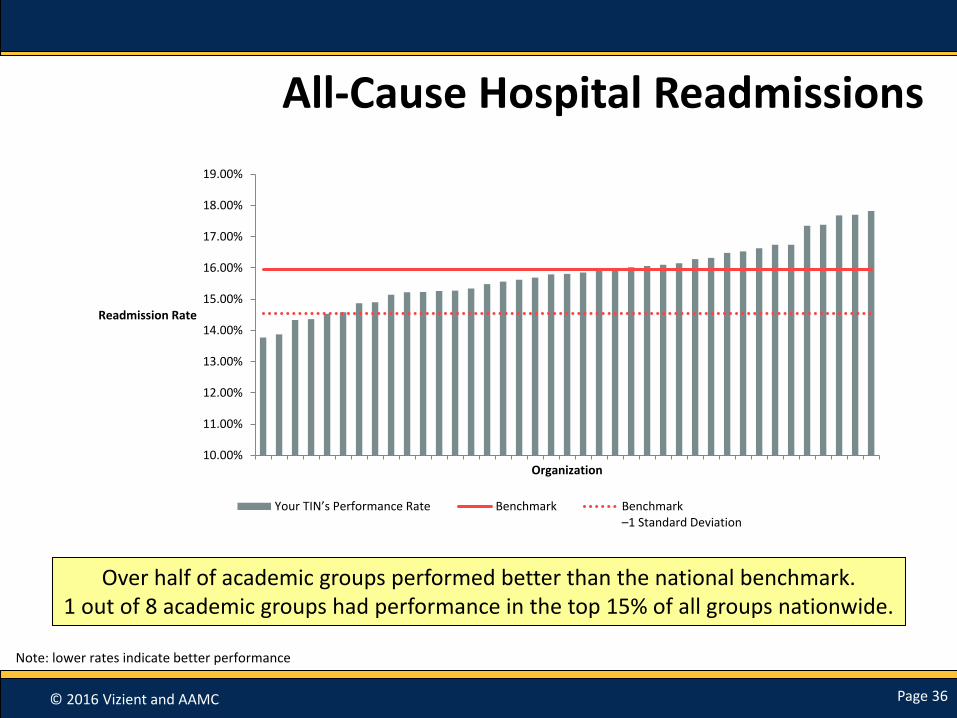
All-Cause Hospital Readmissions
10.00%
11.00%
12.00%
13.00%
14.00%
15.00%
16.00%
17.00%
18.00%
19.00%
Readmission Rate
Organization
Your TIN’s Performance Rate Benchmark Benchmark–1 Standard Deviation
Note: lower rates indicate better performance
Over half of academic groups performed better than the national benchmark.1 out of 8 academic groups had performance in the top 15% of all groups nationwide.

© 2016 Vizient and AAMC Page 37
PQRS Performance for GPRO Web Interface Users
0
5
10
15
20
25
30
35
Number ofOrganizations
Worse than benchmark Better than benchmark Better than 1 SD
Widespread achievement on many metrics, underperformance on others.

© 2016 Vizient and AAMC Page 38
Episode 60: Spinal Fusion (all)
$61,979
$50,462 $50,449
$41,952
$-
$10,000
$20,000
$30,000
$40,000
$50,000
$60,000
$70,000
Organization 1 Organization 2 Organization 3 Organization 4
Average Episode Cost
Episode Cost* National Benchmark
Note: lower cost indicates better performance

© 2016 Vizient and AAMC Page 39
Episode 31: Colonoscopy (all)
$1,442
$1,405
$1,296 $1,281
$1,100
$1,150
$1,200
$1,250
$1,300
$1,350
$1,400
$1,450
$1,500
Organization 1 Organization 2 Organization 3 Organization 4
Average Episode Cost
Episode Cost* National Benchmark
Note: lower cost indicates better performance
© 2016 Vizient and AAMC Page 40
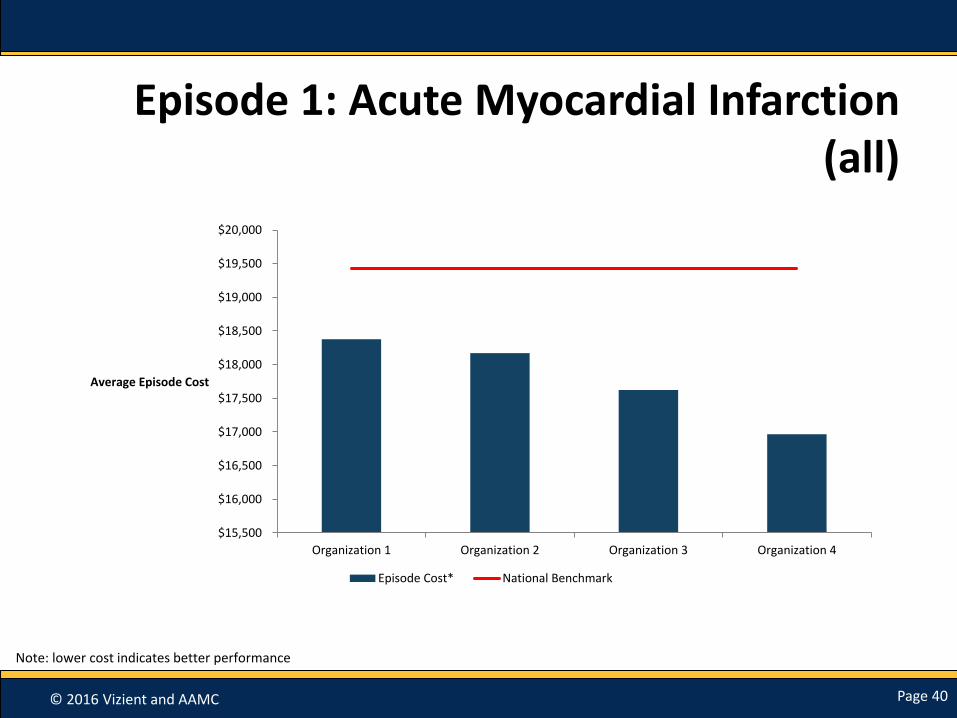
Episode 1: Acute Myocardial Infarction (all)
$15,500
$16,000
$16,500
$17,000
$17,500
$18,000
$18,500
$19,000
$19,500
$20,000
Organization 1 Organization 2 Organization 3 Organization 4
Average Episode Cost
Episode Cost* National Benchmark
Note: lower cost indicates better performance

© 2016 Vizient and AAMC Page 41
Medicare Spend per Beneficiary (MSPB)
$17,500
$18,000
$18,500
$19,000
$19,500
$20,000
$20,500
$21,000
$21,500
$22,000
Cost
Organization
Your TIN’s Per Capita or Per Episode Costs Benchmark Benchmark – 1 Standard Deviation
Note: lower cost indicates better performance
Half of all academic groups performed better than the national average.
© 2016 Vizient and AAMC Page 42
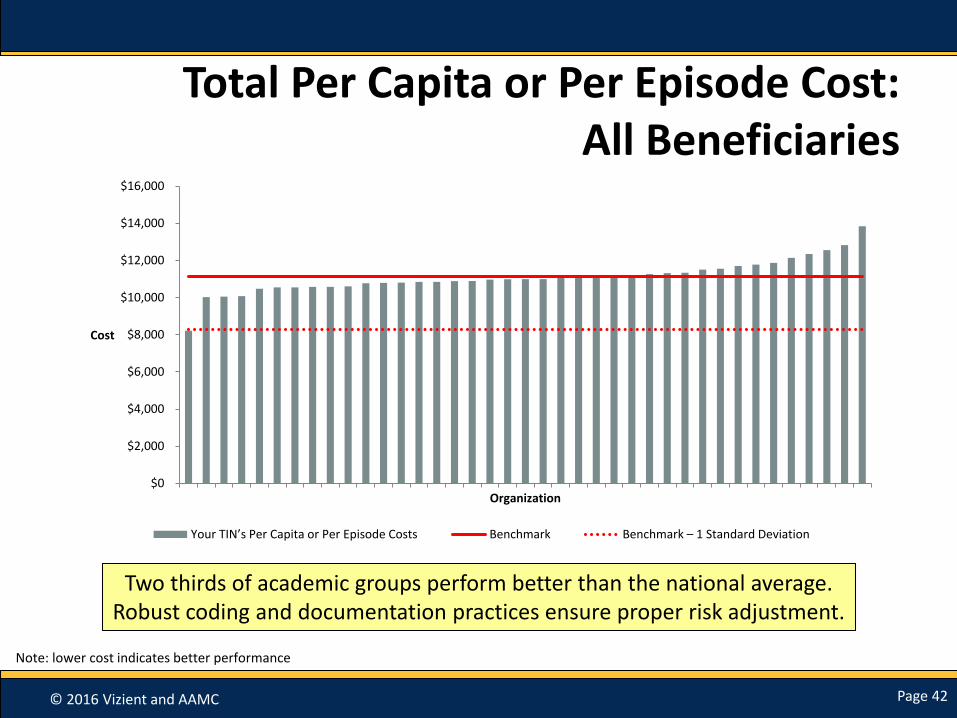
Total Per Capita or Per Episode Cost:All Beneficiaries
$0
$2,000
$4,000
$6,000
$8,000
$10,000
$12,000
$14,000
$16,000
Cost
Organization
Your TIN’s Per Capita or Per Episode Costs Benchmark Benchmark – 1 Standard Deviation
Two thirds of academic groups perform better than the national average.Robust coding and documentation practices ensure proper risk adjustment.
Note: lower cost indicates better performance

© 2016 Vizient and AAMC Page 43
Clinical Practice Improvement Activities (weighted 15%) (choose from a list of 94 activities)
The Secretary is required to specify clinical practice improvement activities. Subcategories of activities are also specified in the proposed rule, which are: Expanded Practice Access
• Same day appointments for urgent needs
• After hours clinician advice
Population Management
• Monitoring health conditions & providing timely intervention
• Participation in a QCDR
Care Coordination
• Timely communication of test results
• Timely exchange of clinical information with patients AND providers
• Use of remote monitoring and Telehealth
Beneficiary Engagement
• Establishing care for complex patients
• Patient self management & training
• Employing shared decision making
Patient Safety & Practice Assessment
• Use of clinical or surgical checklists
• Practice assessments related to maintain certification
Participation in an APM
• As defined in prior slide
• At a minimum receive ½ CPIA score for APM participation
© 2016 Vizient and AAMC Page 44
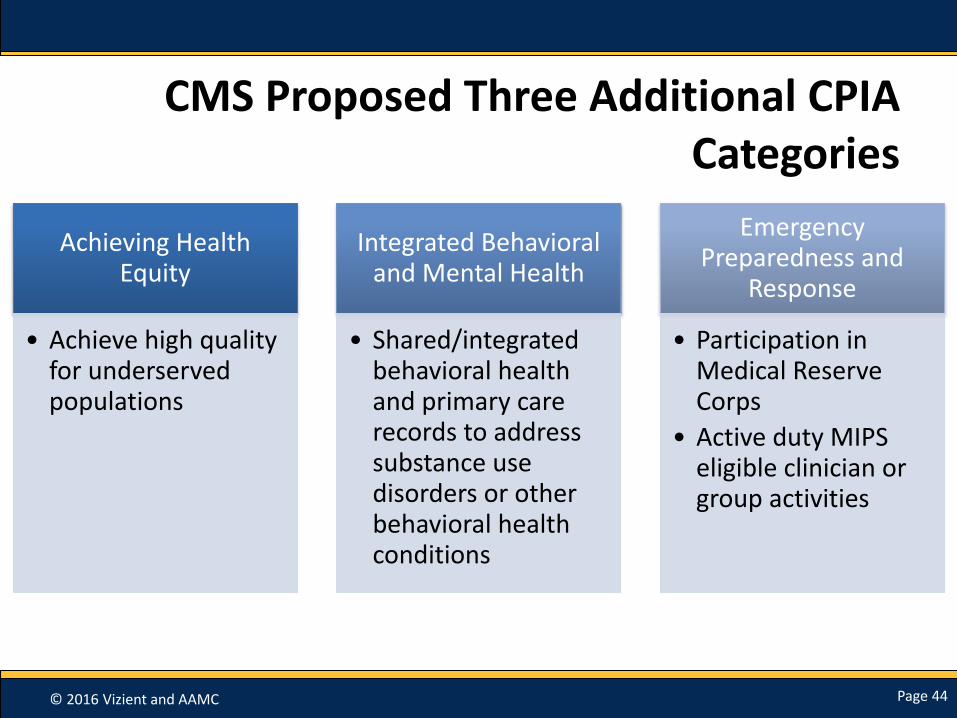
CMS Proposed Three Additional CPIA Categories
Achieving Health Equity
• Achieve high quality for underserved populations
Integrated Behavioral and Mental Health
• Shared/integrated behavioral health and primary care records to address substance use disorders or other behavioral health conditions
Emergency Preparedness and
Response
• Participation in Medical Reserve Corps
• Active duty MIPS eligible clinician or group activities
© 2016 Vizient and AAMC Page 45
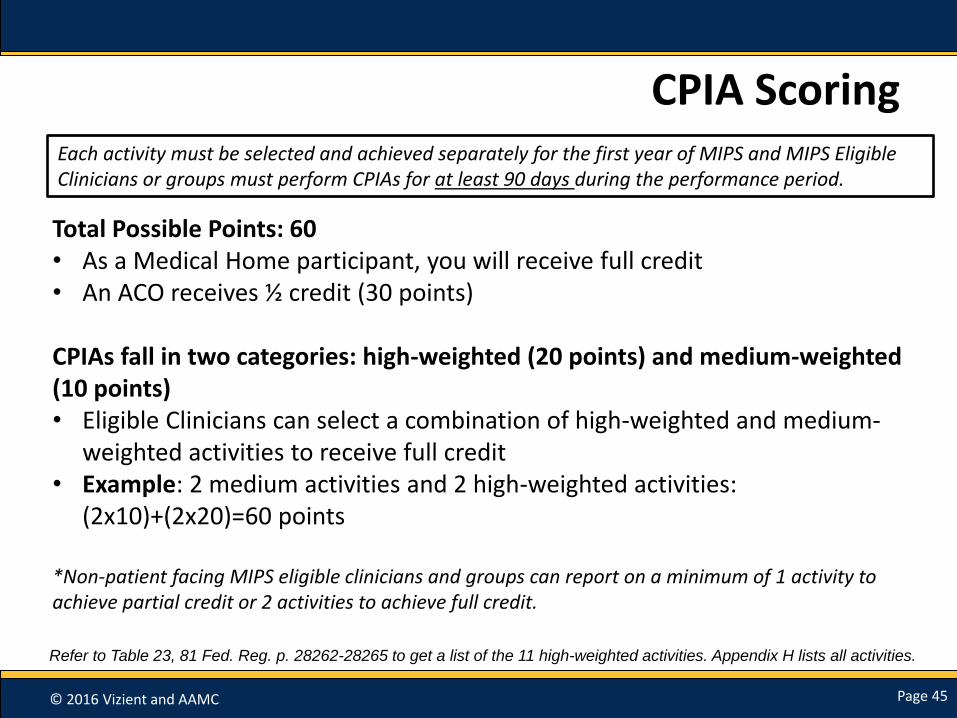
CPIA Scoring
Total Possible Points: 60• As a Medical Home participant, you will receive full credit• An ACO receives ½ credit (30 points)
CPIAs fall in two categories: high-weighted (20 points) and medium-weighted (10 points) • Eligible Clinicians can select a combination of high-weighted and medium-
weighted activities to receive full credit • Example: 2 medium activities and 2 high-weighted activities:
(2x10)+(2x20)=60 points
*Non-patient facing MIPS eligible clinicians and groups can report on a minimum of 1 activity to achieve partial credit or 2 activities to achieve full credit.
Refer to Table 23, 81 Fed. Reg. p. 28262-28265 to get a list of the 11 high-weighted activities. Appendix H lists all activities.
Each activity must be selected and achieved separately for the first year of MIPS and MIPS Eligible Clinicians or groups must perform CPIAs for at least 90 days during the performance period.

© 2016 Vizient and AAMC Page 46
Advancing Care Information (weighted 25%) (Replaces Meaningful Use Program)
Key Changes from Current EHR Program
Can report as Individuals and Groups
Scoring based on two categories: Base and Performance Scores
Failure to meet requirement to protect patient health information in EHR = 0 score for performance category
More flexibility in choosing measures to report for Performance Score
Removed Reporting Requirement for Clinical Provider Order Entry and Clinical Decision Support Objectives
Optional reporting for: NPs, PAs, CNS, CRNAs
© 2016 Vizient and AAMC Page 47
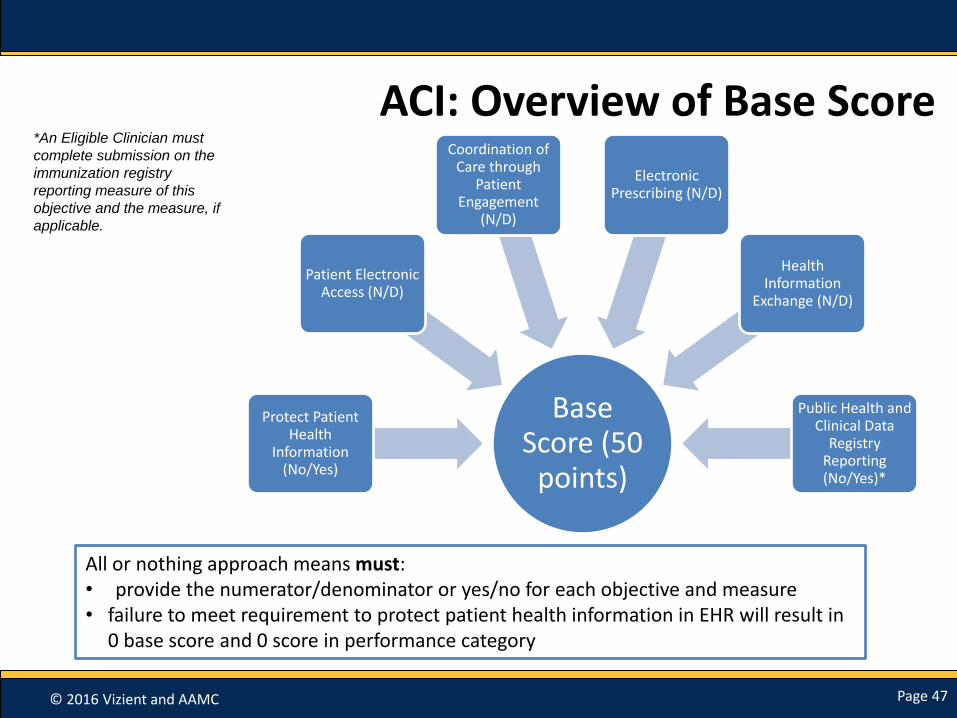
ACI: Overview of Base Score
Base Score (50
points)
Protect Patient Health
Information (No/Yes)
Patient Electronic Access (N/D)
Coordination of Care through
Patient Engagement
(N/D)
Electronic Prescribing (N/D)
Health Information
Exchange (N/D)
Public Health and Clinical Data
Registry Reporting (No/Yes)*
All or nothing approach means must: • provide the numerator/denominator or yes/no for each objective and measure• failure to meet requirement to protect patient health information in EHR will result in
0 base score and 0 score in performance category
*An Eligible Clinician must
complete submission on the
immunization registry
reporting measure of this
objective and the measure, if
applicable.

© 2016 Vizient and AAMC Page 48
ACI: Overview of Performance Score
Performance Score (up to 80 points)
Patient Electronic Access
•Patient Access
•Patient Specific Education
Coordination of Care through Patient Engagement
•VDT
•Secure Messaging
•Patient-Generated Health Data
Health Information Exchange
•Patient Care Record Exchange
•Request/Accept Patient Care Record
•Clinical Information Reconciliation
Clinicians can: • Select measures that best fit their practices from the 8 associated measures from the 3
objectives • For each measure reported under the Performance Score a clinician can receive up to 10 percent
of their Performance Score based on their performance rate for the given measure.

© 2016 Vizient and AAMC Page 49
ACI: Scoring
Base Score (full 50
points=50%)
Performance Score (36.5% with points
reweighted at 10%)
Bonus Point (0 points)
ACI Composite
Score Percentage:
86.5%
86.5% x 25=21.625 points for ACI Composite Score
Base Score
(0 OR 50 points)
Performance Score
(up to 80 points)
Bonus Point
(up to 1 point for reporting on
public health registry)
ACI Composite Score
(100 or more points=FULL 25
points)
Clinicians can receive up to 131 points. If they earn 100 points or more then they receive the full
25 points.
Example Calculation:
© 2016 Vizient and AAMC Page 50
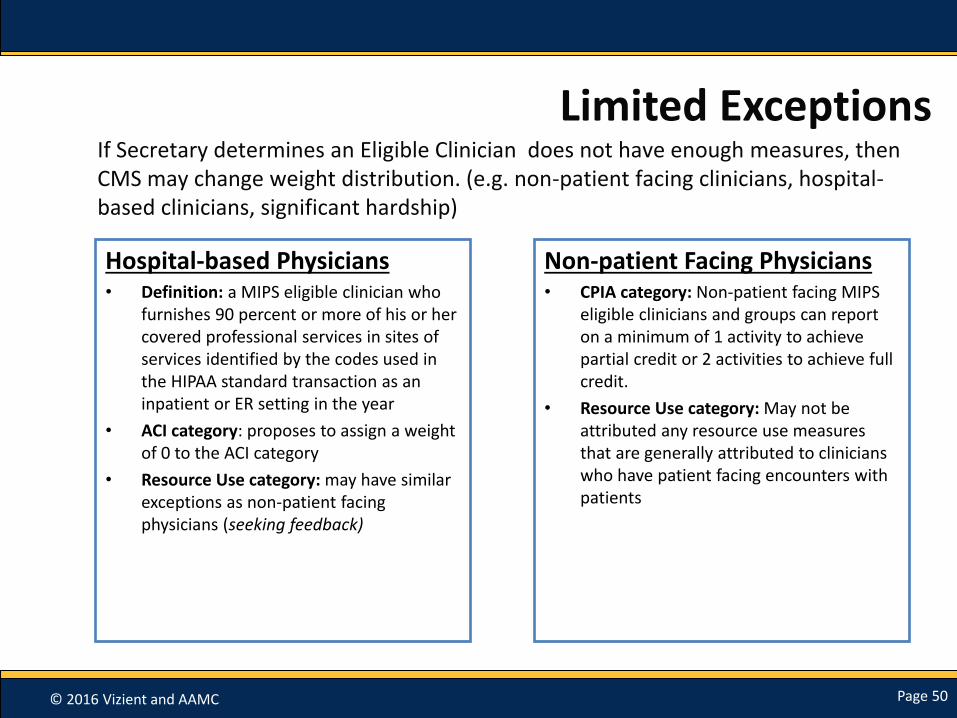
Limited Exceptions
Hospital-based Physicians• Definition: a MIPS eligible clinician who
furnishes 90 percent or more of his or her covered professional services in sites of services identified by the codes used in the HIPAA standard transaction as an inpatient or ER setting in the year
• ACI category: proposes to assign a weight of 0 to the ACI category
• Resource Use category: may have similar exceptions as non-patient facing physicians (seeking feedback)
Non-patient Facing Physicians• CPIA category: Non-patient facing MIPS
eligible clinicians and groups can report on a minimum of 1 activity to achieve partial credit or 2 activities to achieve full credit.
• Resource Use category: May not be attributed any resource use measures that are generally attributed to clinicians who have patient facing encounters with patients
If Secretary determines an Eligible Clinician does not have enough measures, then CMS may change weight distribution. (e.g. non-patient facing clinicians, hospital-based clinicians, significant hardship)

© 2016 Vizient and AAMC Page 51
MIPS/APM
© 2016 Vizient and AAMC Page 52
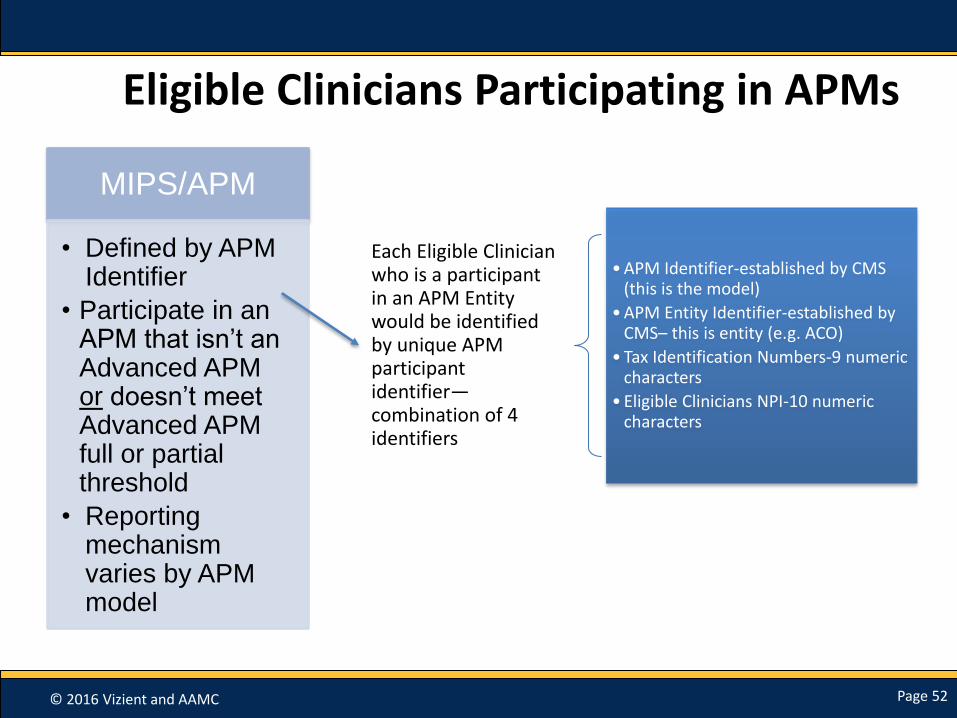
Eligible Clinicians Participating in APMs
MIPS/APM
• Defined by APM Identifier
• Participate in an APM that isn’t an Advanced APM or doesn’t meet Advanced APM full or partial threshold
• Reporting mechanism varies by APM model
Each Eligible Clinician who is a participant in an APM Entity would be identified by unique APM participant identifier—combination of 4 identifiers
• APM Identifier-established by CMS (this is the model)
• APM Entity Identifier-established by CMS– this is entity (e.g. ACO)
• Tax Identification Numbers-9 numeric characters
• Eligible Clinicians NPI-10 numeric characters
© 2016 Vizient and AAMC Page 53
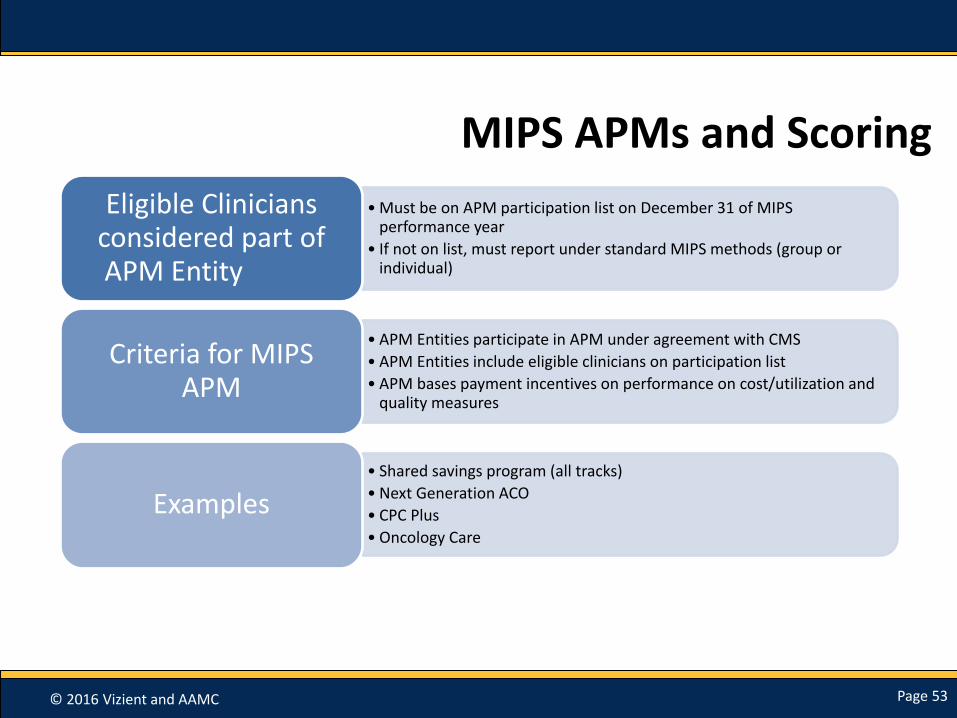
MIPS APMs and Scoring
• Must be on APM participation list on December 31 of MIPS performance year
• If not on list, must report under standard MIPS methods (group or individual)
Eligible Clinicians considered part of APM Entity
• APM Entities participate in APM under agreement with CMS
• APM Entities include eligible clinicians on participation list
• APM bases payment incentives on performance on cost/utilization and quality measures
Criteria for MIPS APM
• Shared savings program (all tracks)
• Next Generation ACO
• CPC Plus
• Oncology Care
Examples

© 2016 Vizient and AAMC Page 54
MIPS APM Scoring for Eligible Clinicians in Shared Savings Program
MIPS Performance Category
Data Submission Requirement Performance Score Weight
Quality Submit quality measures to CMS web Interface for participating eligible clinicians
MIPS quality performance category requirements and benchmarks will be used to determine category at ACO level
50%
Resource Use MIPS eligible clinicians not assessed Not applicable 0%
CPIA All MIPS eligible clinicians submit according to the MIPS requirements and have performance assessed as a group through billing TINs associated with ACO
All ACO participants group’s TINs will receive one half of the possible points at a minimum. If the TIN is a PCMH, it will receive the highest possible score. All scores for MIPS eligible clinicians (under the ACO TIN) in APM entity group will be aggregated, weighted and averaged to one score
20%
Advancing Care Information
All MIPS eligible clinicians submit according to MIPS requires and performance assessed as a group through their billing TINs associated with the ACO
All of ACO participant group billing scores aggregated, as a weighted to score to yield one group score
30%

© 2016 Vizient and AAMC Page 55
MIPS APM Scoring for Eligible Clinicians in Next Generation
MIPS Performance Category
Data Submission Requirement Performance Score Weight
Quality Submit quality measures to CMS web Interface for participating eligible clinicians
MIPS quality performance category requirements and benchmarks will be used to develop ACO MIPS quality score.
50%
Resource Use MIPS eligible clinicians not assessed Not applicable 0%
CPIA All MIPS eligible clinicians in the APM entity group submit individual level data.
All ACO eligible clinicians will receive one half of the possible points at a minimum. If eligible clinician is in a PCMH, will receive the highest possible score. All MIPS eligible clinician scores will be aggregated and averaged to one ACO score.
20%
Advancing Care Information
All MIPS eligible clinician's in APM Entity group submit individual level data.
All of MIPS eligible clinician scores will be aggregated and averaged to yield one ACO score. An ACO eligible clinician that does not report this performance category would contribute a score of zero.
30%
© 2016 Vizient and AAMC Page 56
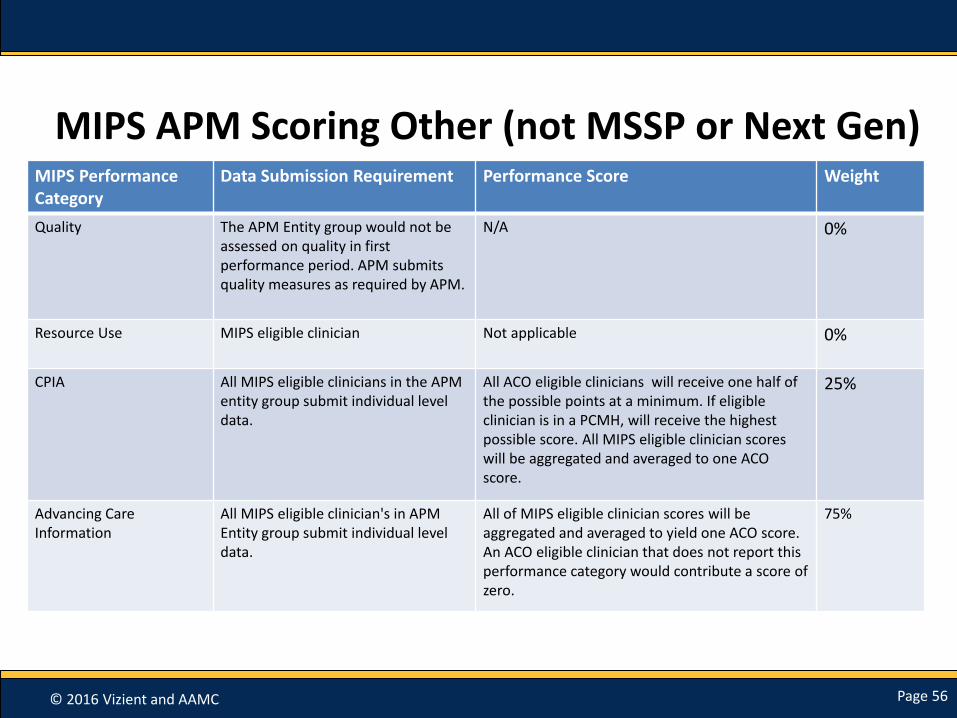
MIPS APM Scoring Other (not MSSP or Next Gen)MIPS Performance Category
Data Submission Requirement Performance Score Weight
Quality The APM Entity group would not be assessed on quality in first performance period. APM submits quality measures as required by APM.
N/A 0%
Resource Use MIPS eligible clinician Not applicable 0%
CPIA All MIPS eligible clinicians in the APM entity group submit individual level data.
All ACO eligible clinicians will receive one half of the possible points at a minimum. If eligible clinician is in a PCMH, will receive the highest possible score. All MIPS eligible clinician scores will be aggregated and averaged to one ACO score.
25%
Advancing Care Information
All MIPS eligible clinician's in APM Entity group submit individual level data.
All of MIPS eligible clinician scores will be aggregated and averaged to yield one ACO score. An ACO eligible clinician that does not report this performance category would contribute a score of zero.
75%

© 2016 Vizient and AAMC Page 57
Case ExampleREMEMBER—it is possible that parts of your TIN may be in different programs!
TIN XYZ
Eligible Clinicians in MIPS
Report under General MIPS
Eligible Clinicians in MIPS/APMs
Report with different performance category
weights depending on APM
© 2016 Vizient and AAMC Page 58
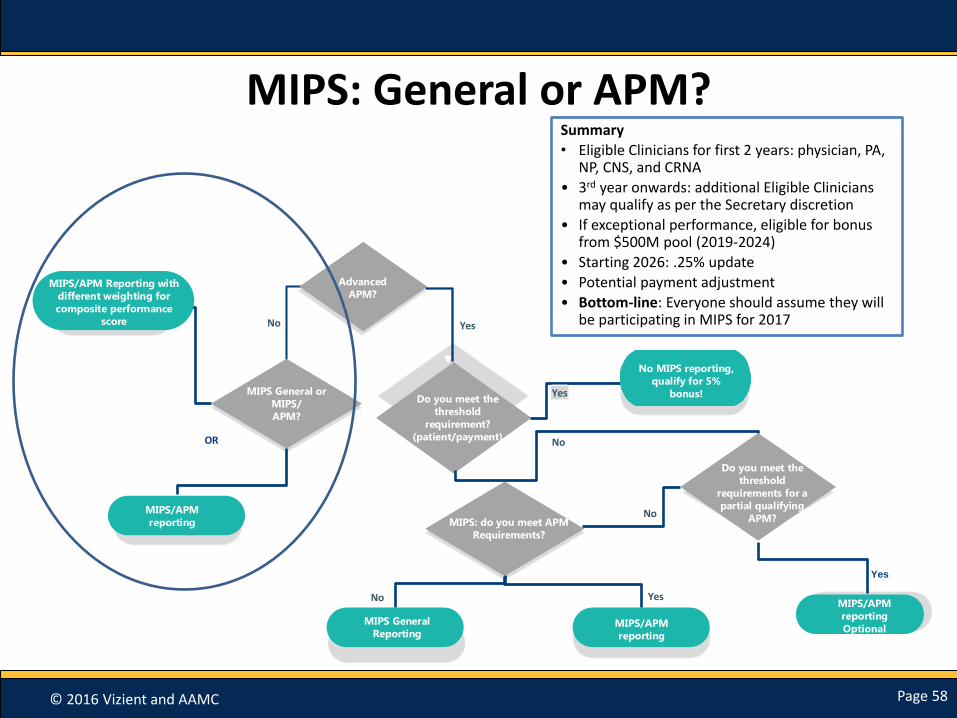
MIPS: General or APM?
AP
M
Advanced
APM?
Do you meet the
threshold
requirement?
(patient/payment) No
Yes
Yes
No MIPS reporting,
qualify for 5%
bonus!
MIPS/APM Reporting with
different weighting for
composite performance
score
Do you meet the
threshold
requirements for a
partial qualifying
APM?
MIPS General or
MIPS/
APM?
No
MIPS General
Reporting
MIPS: do you meet APM
Requirements?
MIPS/APM
reporting
MIPS/APM
reporting
MIPS/APM
reporting
Optional
YesNo
Yes
OR
No
Summary
• Eligible Clinicians for first 2 years: physician, PA, NP, CNS, and CRNA
• 3rd year onwards: additional Eligible Clinicians may qualify as per the Secretary discretion
• If exceptional performance, eligible for bonus from $500M pool (2019-2024)
• Starting 2026: .25% update
• Potential payment adjustment
• Bottom-line: Everyone should assume they will be participating in MIPS for 2017

© 2016 Vizient and AAMC Page 59
Payment Adjustments Under MIPS

© 2016 Vizient and AAMC Page 60
MIPS Timeline
2017
Performance Period (Jan. –Dec.)
July: 1st feedback report
2018
Reporting and Data Collection (analysis of
score)
July: 2nd feedback report
2019
MIPS payment adjustments
© 2016 Vizient and AAMC Page 61
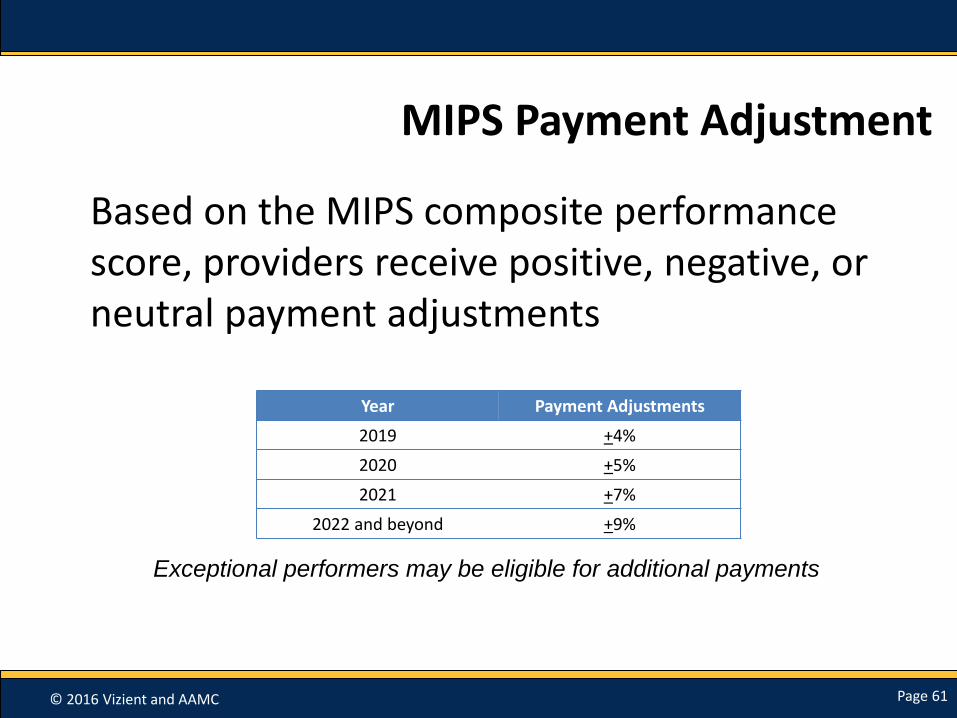
MIPS Payment Adjustment
Based on the MIPS composite performance score, providers receive positive, negative, or neutral payment adjustments
Year Payment Adjustments
2019 +4%
2020 +5%
2021 +7%
2022 and beyond +9%
Exceptional performers may be eligible for additional payments

© 2016 Vizient and AAMC Page 62
MIPS Payment Adjustment
Maximum
Negative
Adjustment
Sliding Scale
Negative
Adjustment
Sliding Scale
Positive Adjustment
0 25%
of performance
threshold
100
Performance Threshold
(mean or median- TBD by
CMS)
0 adjustment
Composite
Score
25% and above
get exceptional
performance
bonus.
© 2016 Vizient and AAMC Page 63
Performance Threshold
• Will use 2014-2015 Part B charges, PQRS data submissions, QRUR and sQRUR feedback data, and Medicare and Medicaid MU data
• Approximately half of eligible clinicians will be above threshold and half below
• Budget neutrality required
© 2016 Vizient and AAMC Page 64
Additional Payments for Exceptional Performers
Eligible Clinicians with scores above performance threshold, can have adjustment increased or decreased by a scaling factor of up to 3, BUT must maintain budget neutrality
• EX: for 2019 could be 3 x 4% = 12%
2019-2024 additional incentive payment: up to $500m pool each year for exceptional performance
• Maximum adjustment cannot be more than 10% of Eligible Clinicians’ Medicare payments
• Exceptional performance: 25th percentile of CPS for MIPS eligible clinicians at or above the performance threshold

© 2016 Vizient and AAMC Page 65
Other Topics Related to MIPS

© 2016 Vizient and AAMC Page 66
MIPS Public Reporting
Information about the performance of MIPS Eligible Clinicians must be made available on Physician Compare:
• Composite score for each Eligible Clinician and performance in each category
• Names of Eligible Clinicians in APMs
• May include performance regarding each measure or activity in resource use
© 2016 Vizient and AAMC Page 67
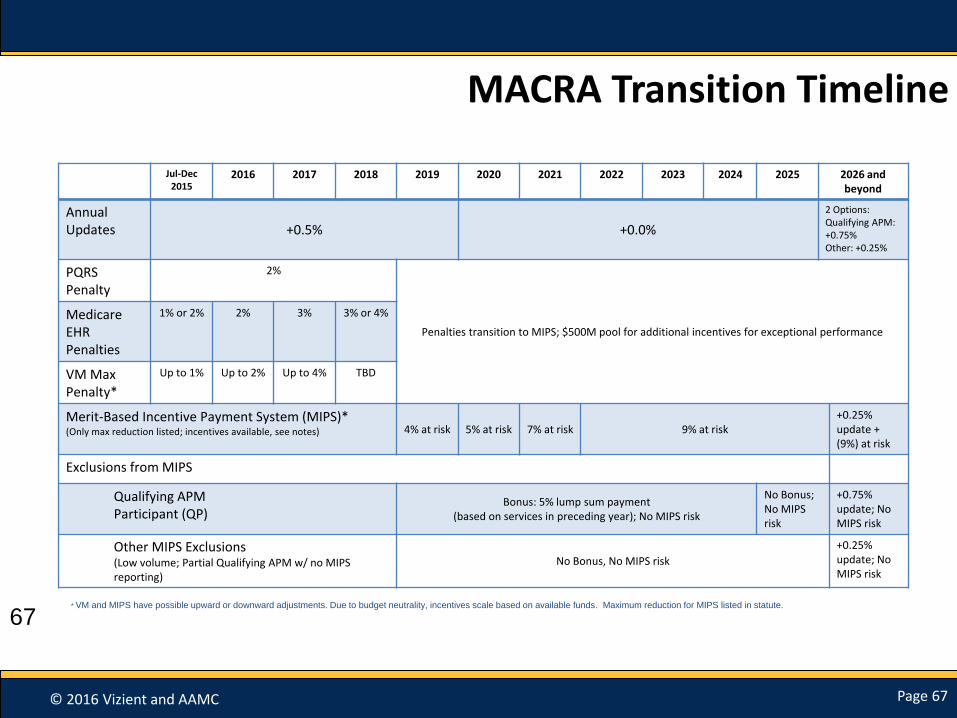
MACRA Transition Timeline
Jul-Dec2015
2016 2017 2018 2019 2020 2021 2022 2023 2024 2025 2026 andbeyond
AnnualUpdates +0.5% +0.0%
2 Options:Qualifying APM: +0.75%Other: +0.25%
PQRS Penalty
2%
Penalties transition to MIPS; $500M pool for additional incentives for exceptional performance
Medicare EHR Penalties
1% or 2% 2% 3% 3% or 4%
VM Max Penalty*
Up to 1% Up to 2% Up to 4% TBD
Merit-Based Incentive Payment System (MIPS)*(Only max reduction listed; incentives available, see notes) 4% at risk 5% at risk 7% at risk 9% at risk
+0.25% update + (9%) at risk
Exclusions from MIPS
Qualifying APMParticipant (QP)
Bonus: 5% lump sum payment(based on services in preceding year); No MIPS risk
No Bonus; No MIPS risk
+0.75% update; No MIPS risk
Other MIPS Exclusions(Low volume; Partial Qualifying APM w/ no MIPS reporting)
No Bonus, No MIPS risk
+0.25%update; No MIPS risk
67* VM and MIPS have possible upward or downward adjustments. Due to budget neutrality, incentives scale based on available funds. Maximum reduction for MIPS listed in statute.

© 2016 Vizient and AAMC Page 68
Regulatory Timeline
CMS Released Proposed Rule on
April 27, 2016
Comments Due June 27, 2016
Final Rule Expected Fall
2016
Performance Year Begins 2017 (determines
payment in 2019)

© 2016 Vizient and AAMC Page 69
References to Additional Tables
• The proposed rule’s link : https://www.gpo.gov/fdsys/pkg/FR-2016-05-09/pdf/2016-10032.pdf
• Proposed Clinical Condition and Treatment Episode-Based Measures: Table 4, 81 Fed Reg. p. 28202-28206
• High Weight CPIAs: Table 23, 81 Fed. Reg. p. 28262-28265
• List of Advanced APMs: Table 32, 81 Fed. Reg. p. 28312-28313
• 2017 Proposed MIPS specialty Measure sets: Table E• Proposed Individual Quality Measures Available for
MIPS reporting in 2017: Table A

© 2016 Vizient and AAMC Page 70
Questions?
Part 2 Webinar TOMORROW!
FPSC FY 2017 MACRA Provisions Focusing on APMsDate and Time: Thursday, June 2, 2016 12:00pm – 1:00pm EST Registration Link /Event address for attendees: https://uhcevents.webex.com/uhcevents/onstage/g.php?MTID=e714728598a779b0cc7db90e51c78e7e8
Duration: 1 hour
Email: [email protected] for any additional questions.


