Quotas set on gender, ethnic origin, age, working status of women and housing tenure, set to 2001 Census
88 sampling points across the borough
METHODOLOGY
Merton Residents Survey 2008/09
Men
Women
18-34
35-59
60+
Owner Occupier
/Other
Council Rented
SET ACHIEVED Number
% %
49 42 476
51 58 645
37 29 330
42 50 562
21 20 229
91 1,01290
9 9 106
}
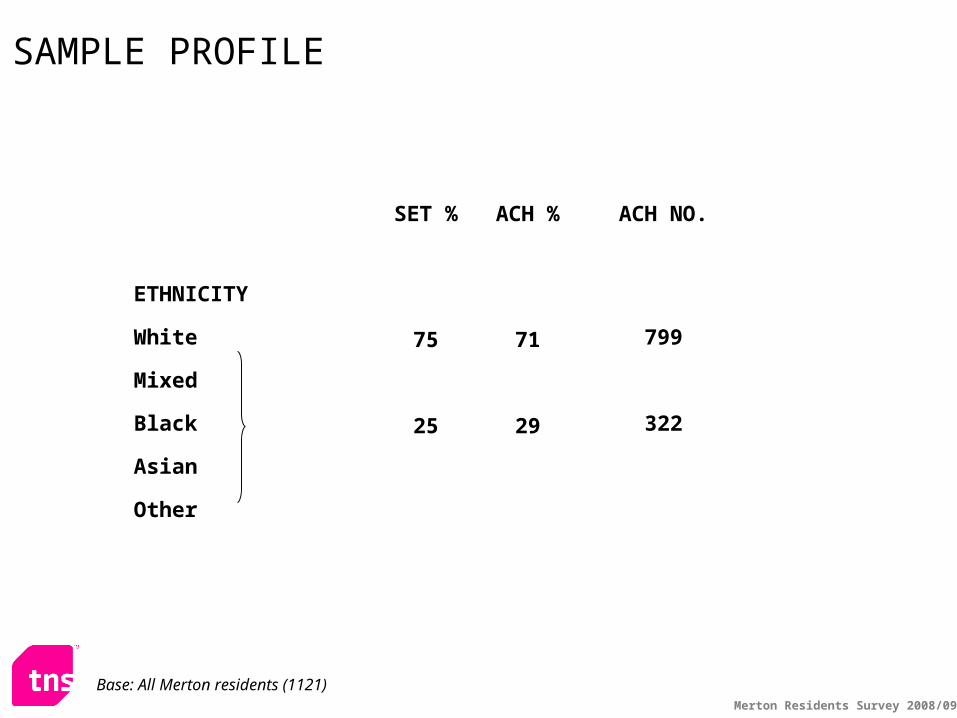
SAMPLE PROFILE
Base: All Merton residents (1121)
Merton Residents Survey 2008/09
SET % ACH % ACH NO.
ETHNICITY
White 75 71 799
Mixed
Black 25 29 322
Asian
Other
SAMPLE PROFILE
Base: All Merton residents (1121)
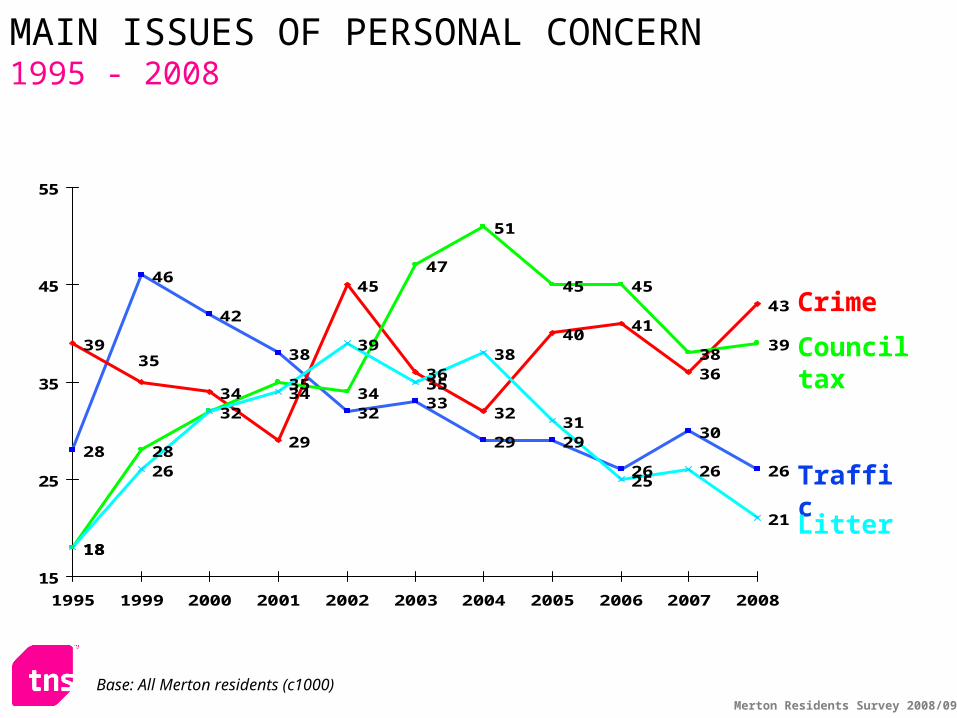
Areas of Personal Concern
Merton Residents Survey 2008/09
43
39
26
24
21
19
18
16
15
14
12
11
11
9
4
Crime
Level of council tax
Traffic congestion
Rising prices / interest rates**
Litter / dirt in the street
Not enough for young**
Education standards
Quality of health service
Pollution
Lack of affordable housing
Not enough for elderly
Lack of jobs
Lack of recreational facilities
Poor public transport
Number of homeless people
% mentioning
Base: All Merton residents (1121)
Change from 2007
*Sig
+7*
+1
- 4*
+9*
-5*
-4*
-4*
-3*
-2
-5*
-2
0
-1
-1
-1
AREAS OF PERSONAL CONCERNMerton 2008
**Split Sample: Rising prices (574);not enough for young people (547)
Merton Residents Survey 2008/09
UPRising prices +9Crime +7
DOWNLitter/dirt in the street -5Lack of affordable housing -5Not enough being done for young -4Traffic congestion -4Standard of education -4Quality of health service -3
SIGNIFICANT CHANGES IN CONCERN SINCE 2007
Base: All Merton residents (2007: 1088, 2008: 1121)
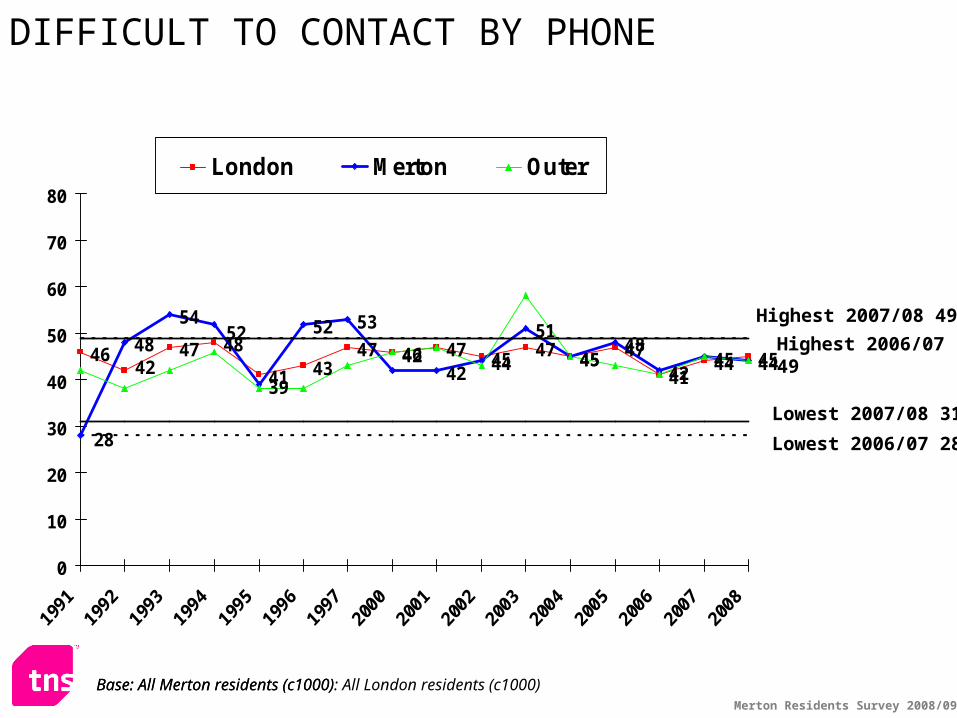
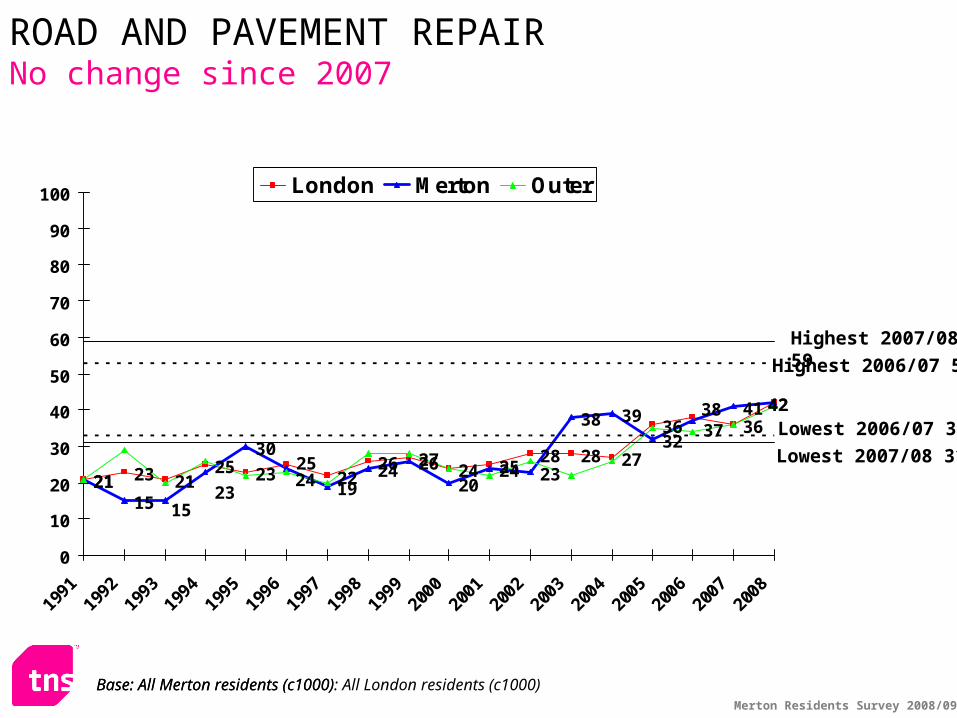
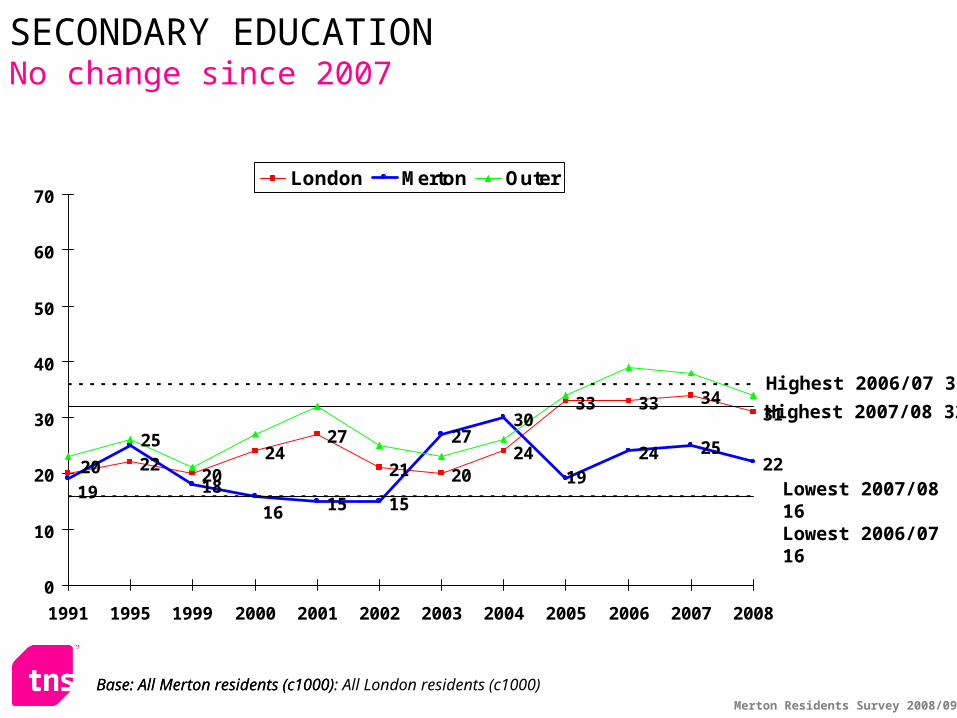
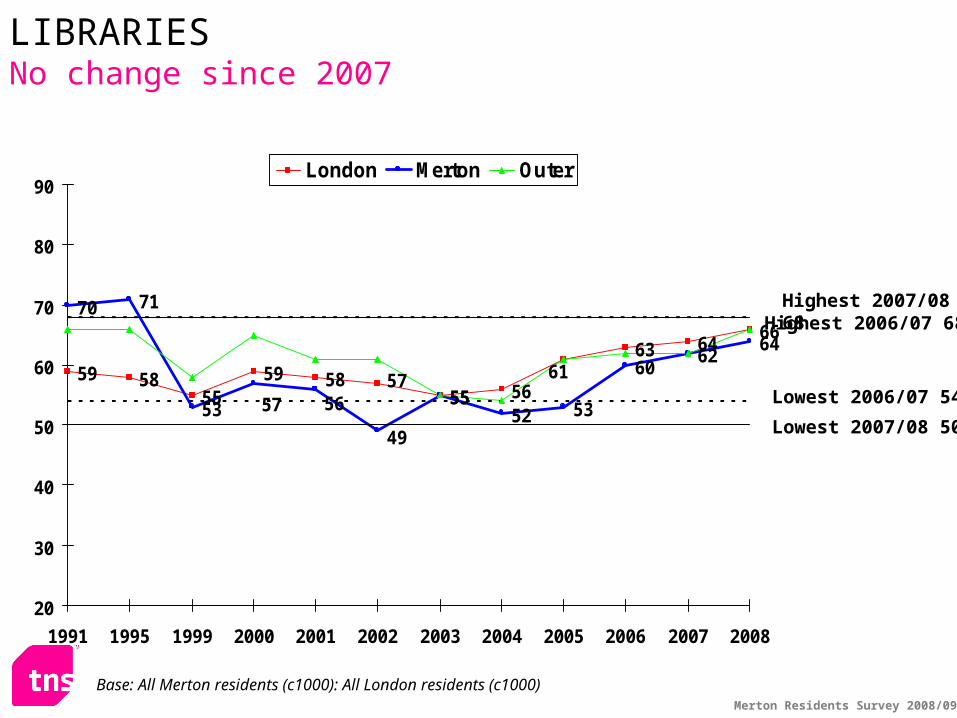
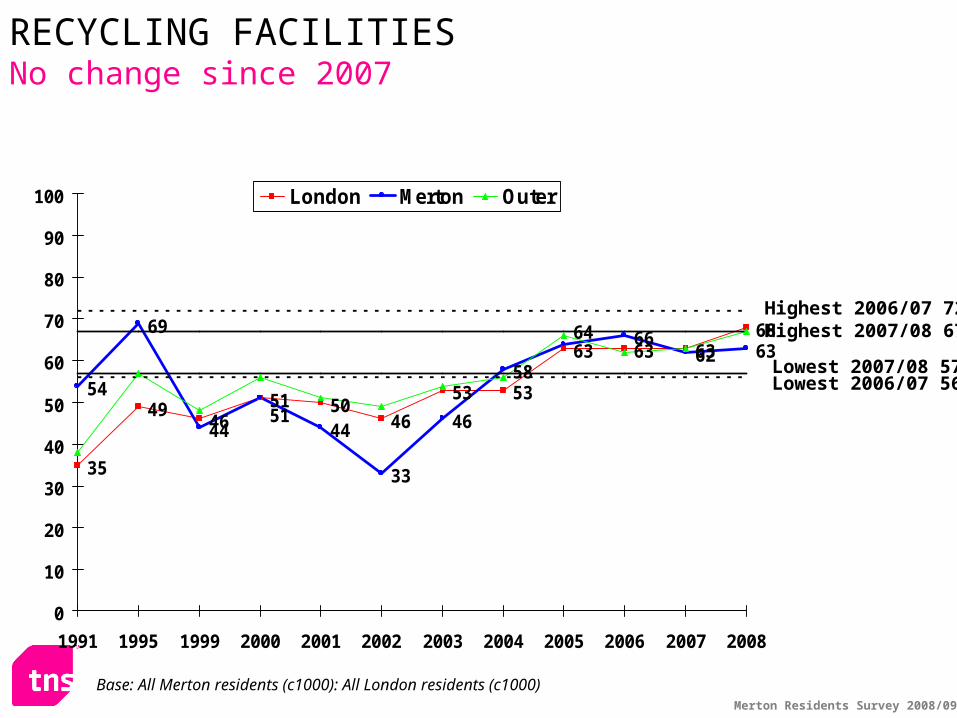
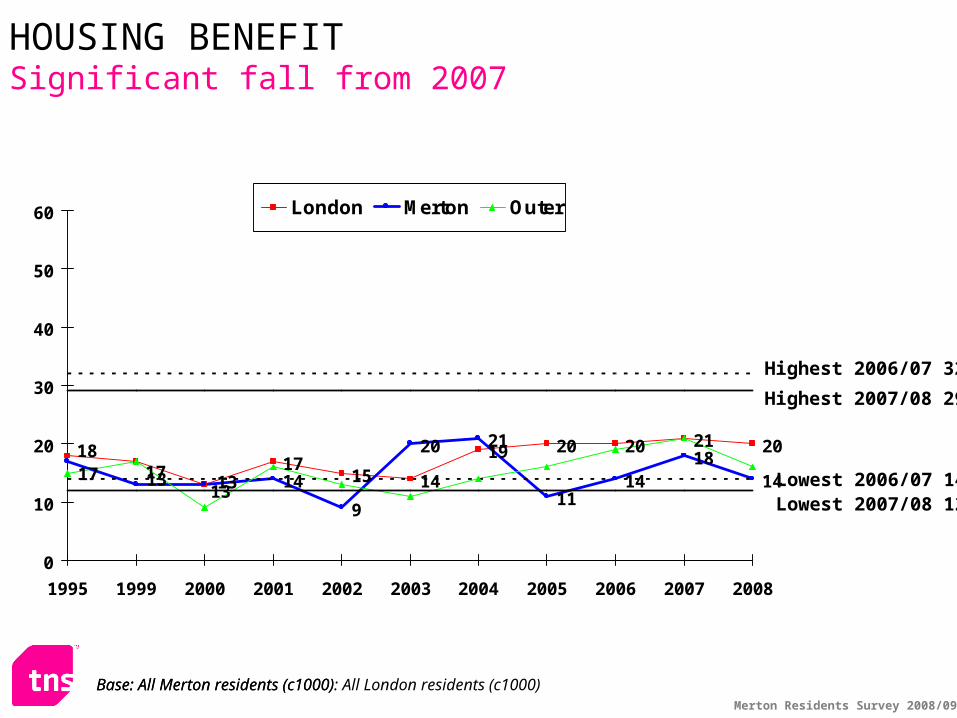
Base: All Merton residents (c1000): All London residents (c1000)
Merton Residents Survey 2008/09
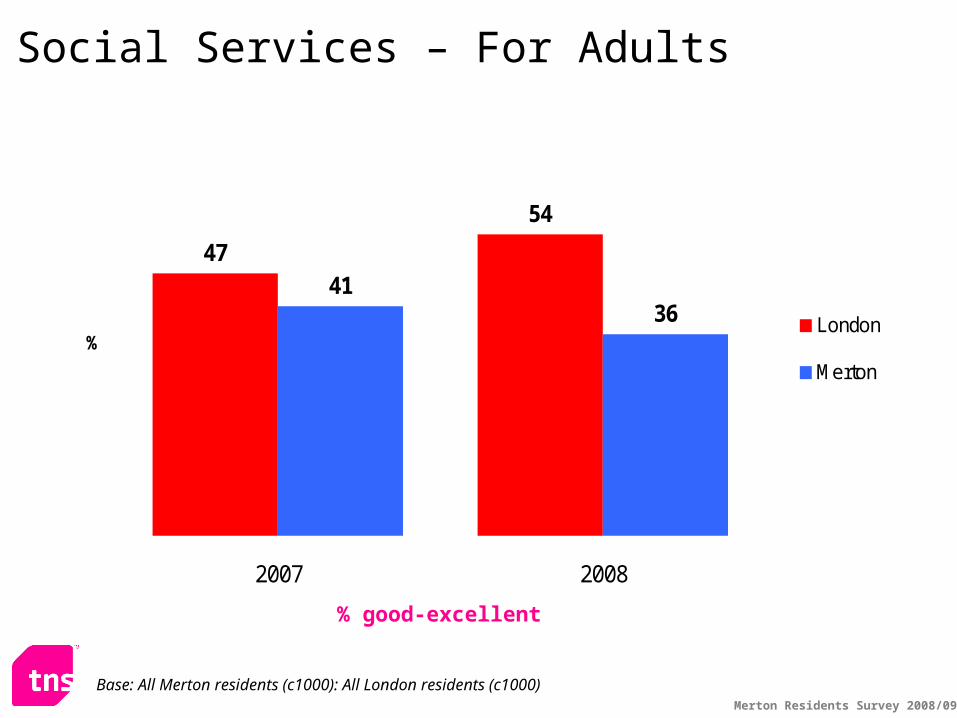
Social Services – For Adults
47
54
4136
2007 2008
%London
Merton
% good-excellent
Base: All Merton residents (c1000): All London residents (c1000)
Merton Residents Survey 2008/09
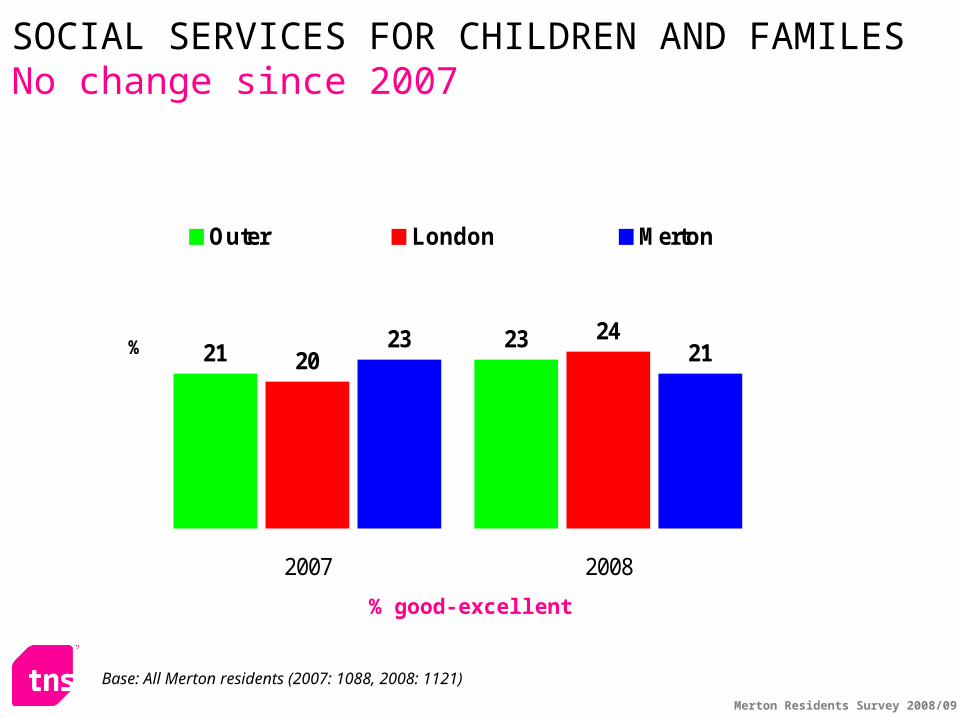
Social Services – For Children and Families
47
53
62
48
2007 2008
%London
Merton
% good-excellent
Base: All Merton residents (c1000): All London residents (c1000)
Merton Residents Survey 2008/09
Total
Users
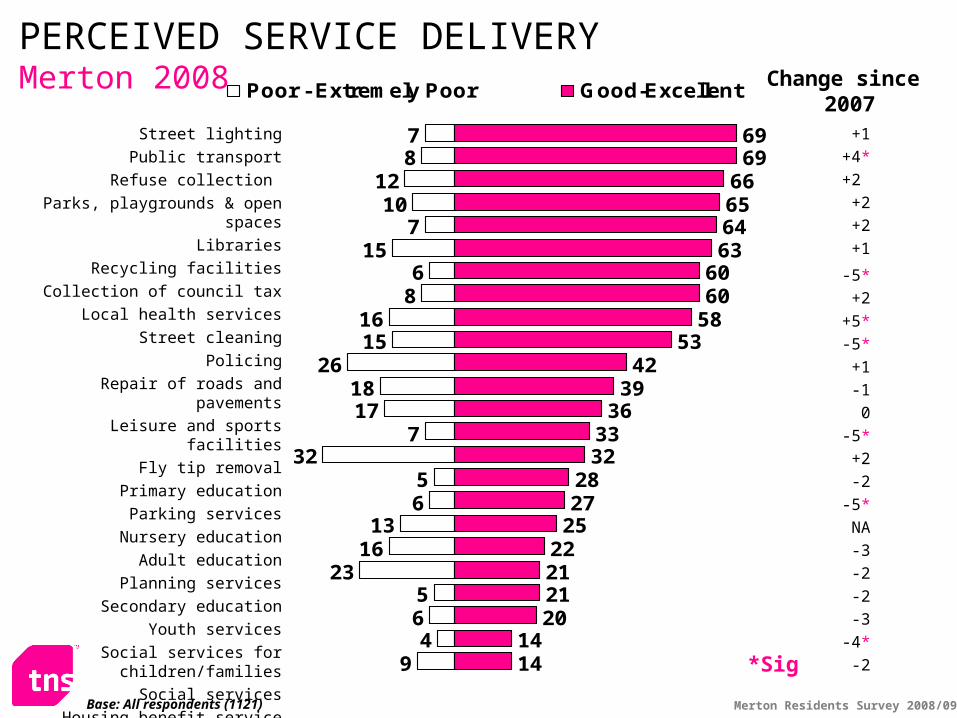
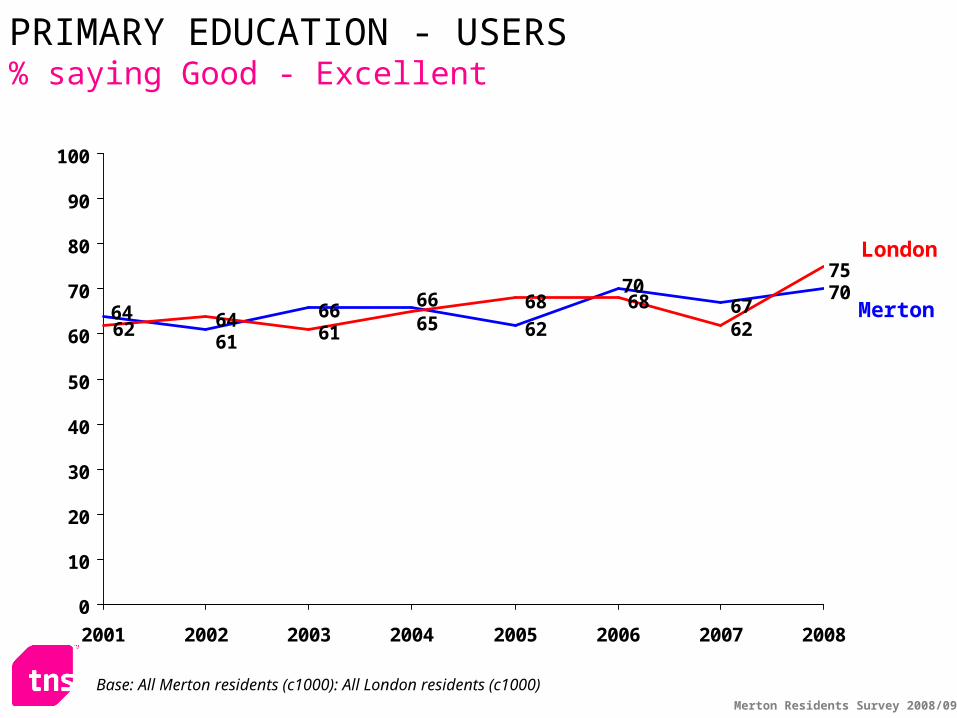
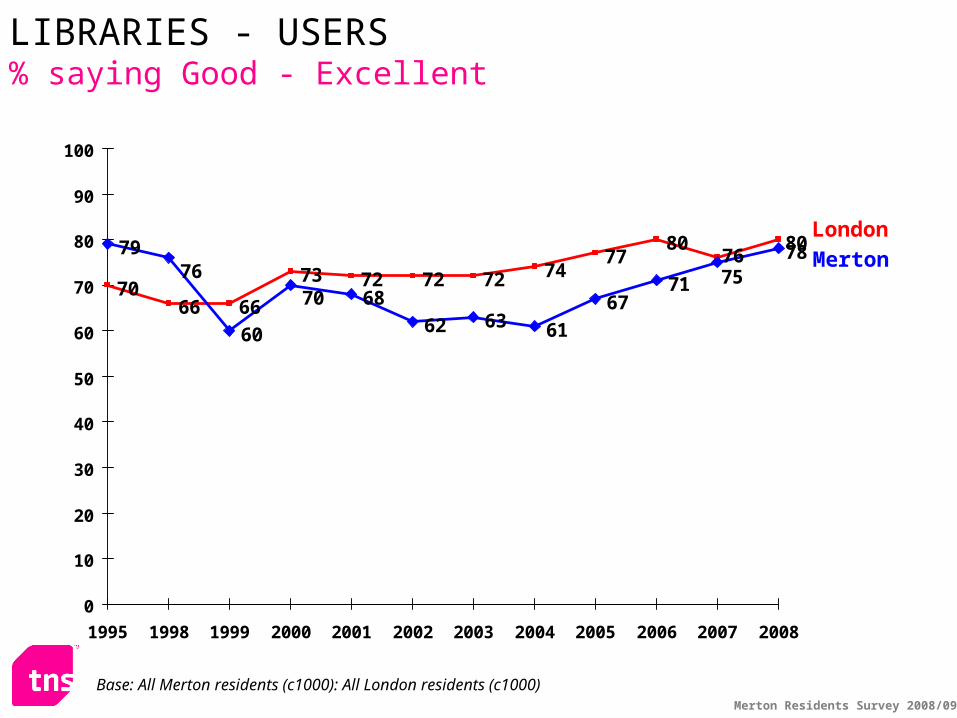
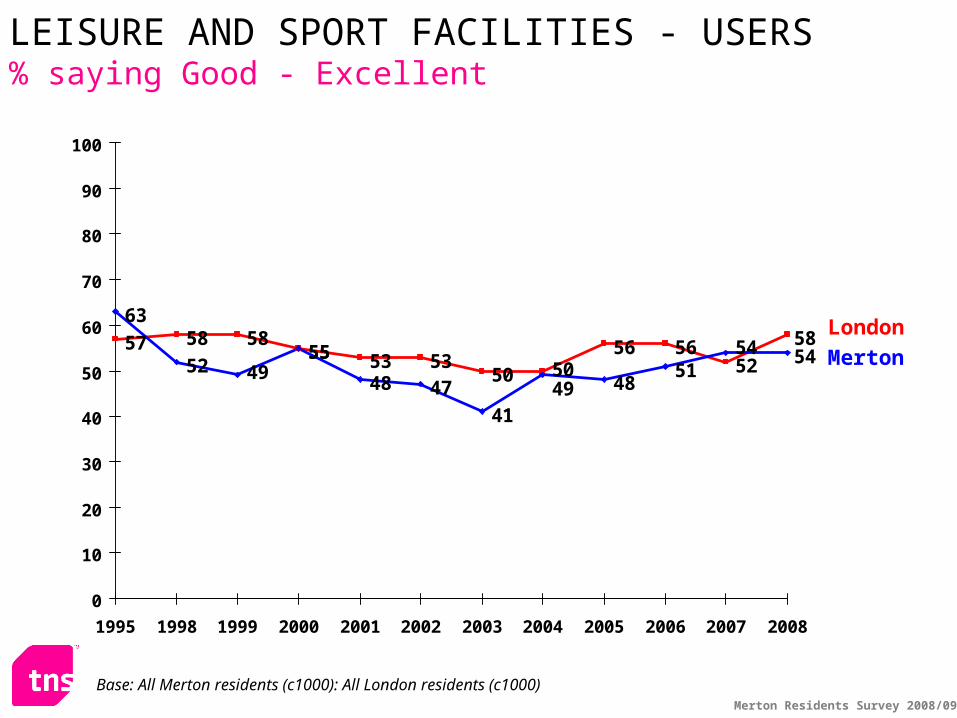
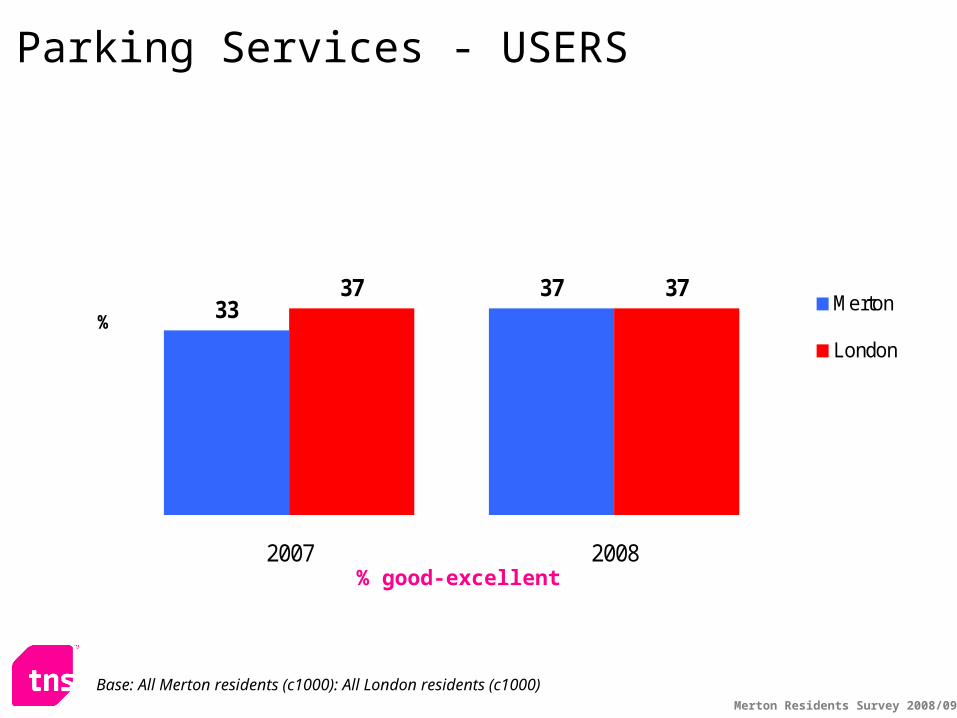
Recycling facilities +1 +3 Parks, playgrounds, open spaces +2 +3 Libraries +2 +3 Leisure & sports facilities -1 0 Nursery education -2 -6 Primary education -5* +3 Secondary education -3 -1 Adult education -5* -6 Social services -3 -5 Social services for family -2 -14* Parking services +2 +4 Housing Benefit -4* +1 Council housing -2 -3
*Sig
CHANGES SINCE 2007% saying Good - Excellent
Merton Residents Survey 2008/09
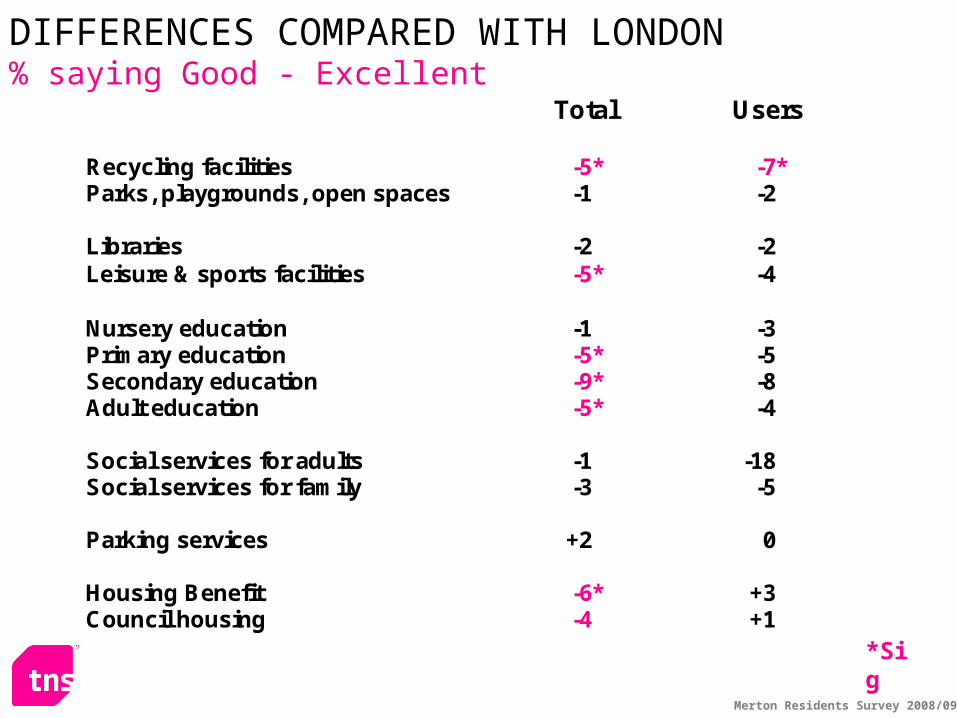
Total
Users
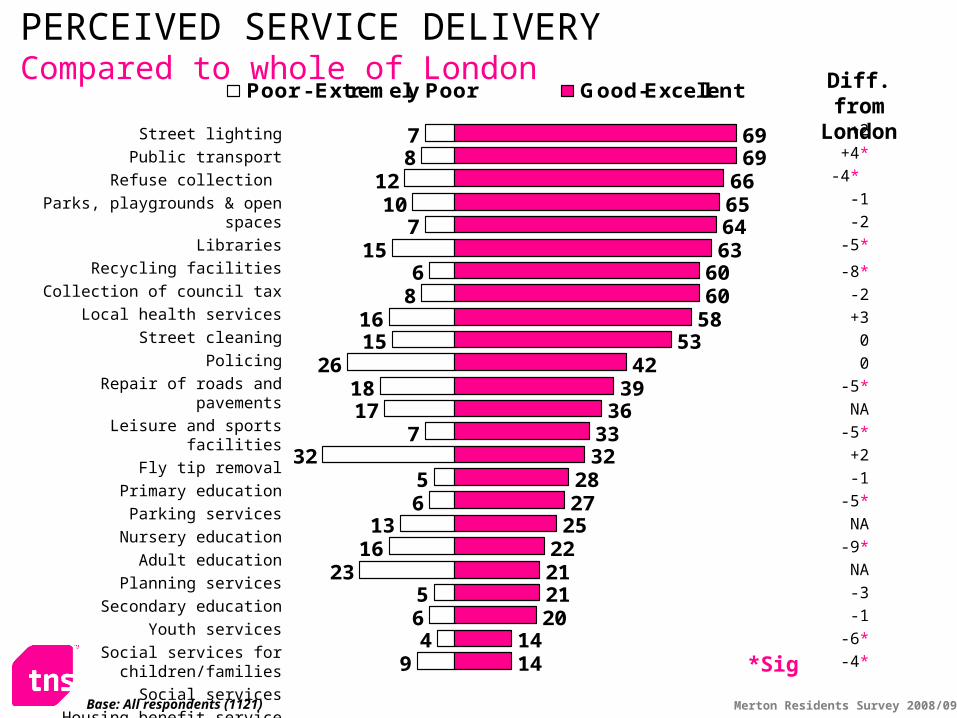
Recycling facilities -5* -7* Parks, playgrounds, open spaces -1 -2 Libraries -2 -2 Leisure & sports facilities -5* -4 Nursery education -1 -3 Primary education -5* -5 Secondary education -9* -8 Adult education -5* -4 Social services for adults -1 -18 Social services for family -3 -5 Parking services +2 0 Housing Benefit -6* +3 Council housing -4 +1
*Sig
DIFFERENCES COMPARED WITH LONDON % saying Good - Excellent
Merton Extra QuestionsMerton Extra Questions
The local area
Merton Residents Survey 2008/09
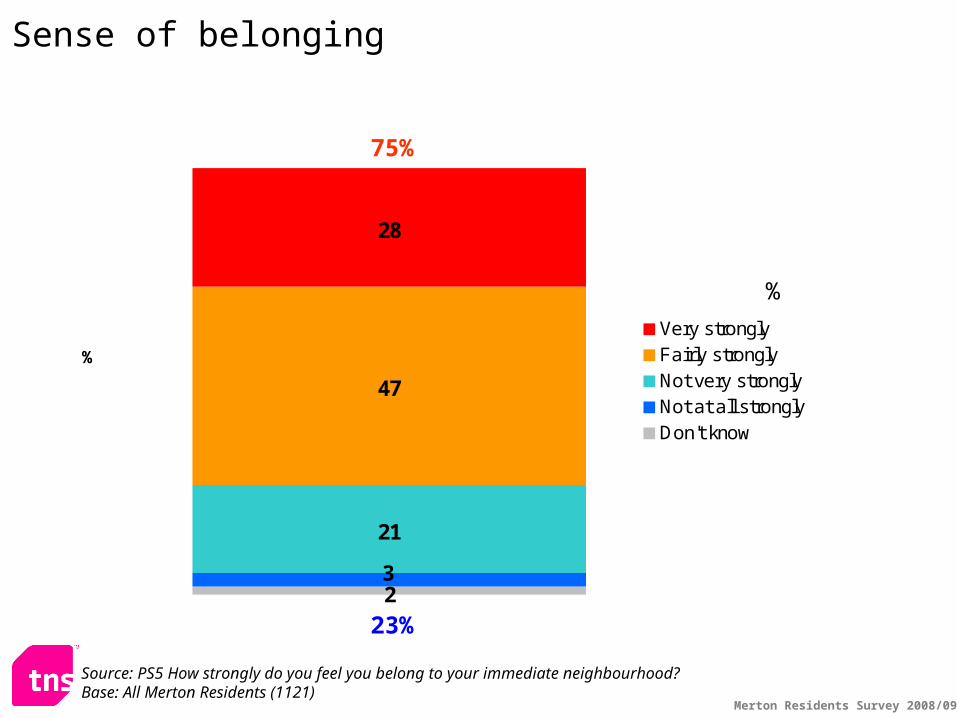
Sense of belonging
21
47
28
23
%
Very stronglyFairly stronglyNot very stronglyNot at all stronglyDon't know
Source: PS5 How strongly do you feel you belong to your immediate neighbourhood?Base: All Merton Residents (1121)
%
75%
23%
Merton Residents Survey 2008/09
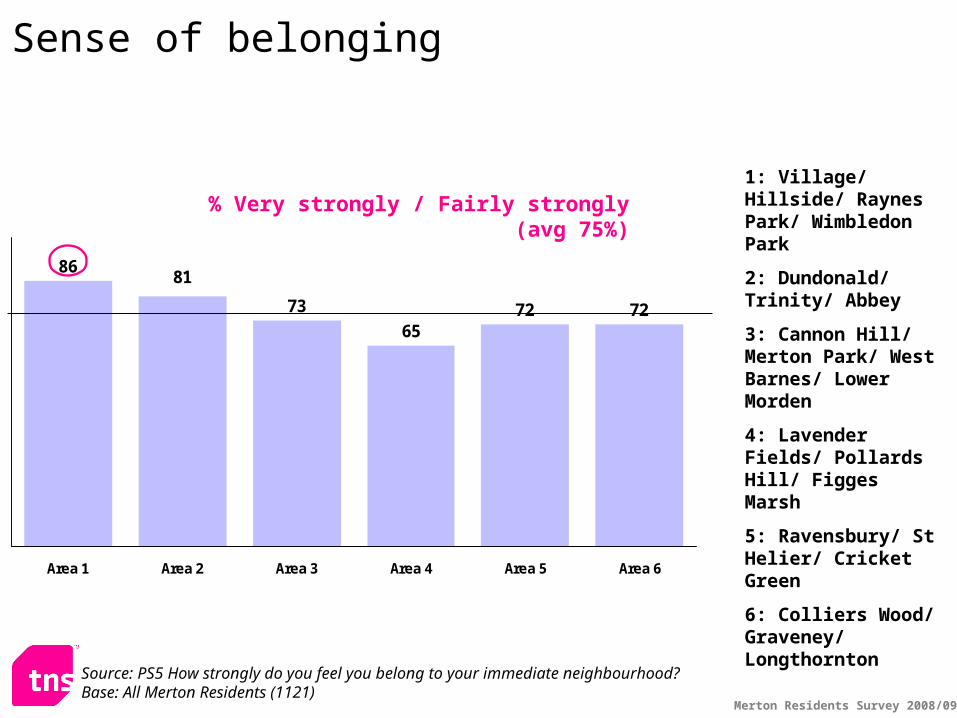
86
73
6572 72
81
Area 1 Area 2 Area 3 Area 4 Area 5 Area 6
% Very strongly / Fairly strongly (avg 75%)1: Village/ Hillside/ Raynes Park/ Wimbledon Park
2: Dundonald/ Trinity/ Abbey
3: Cannon Hill/ Merton Park/ West Barnes/ Lower Morden
4: Lavender Fields/ Pollards Hill/ Figges Marsh
5: Ravensbury/ St Helier/ Cricket Green
6: Colliers Wood/ Graveney/ Longthornton
Sense of belonging
Source: PS5 How strongly do you feel you belong to your immediate neighbourhood?Base: All Merton Residents (1121)
Merton Residents Survey 2008/09
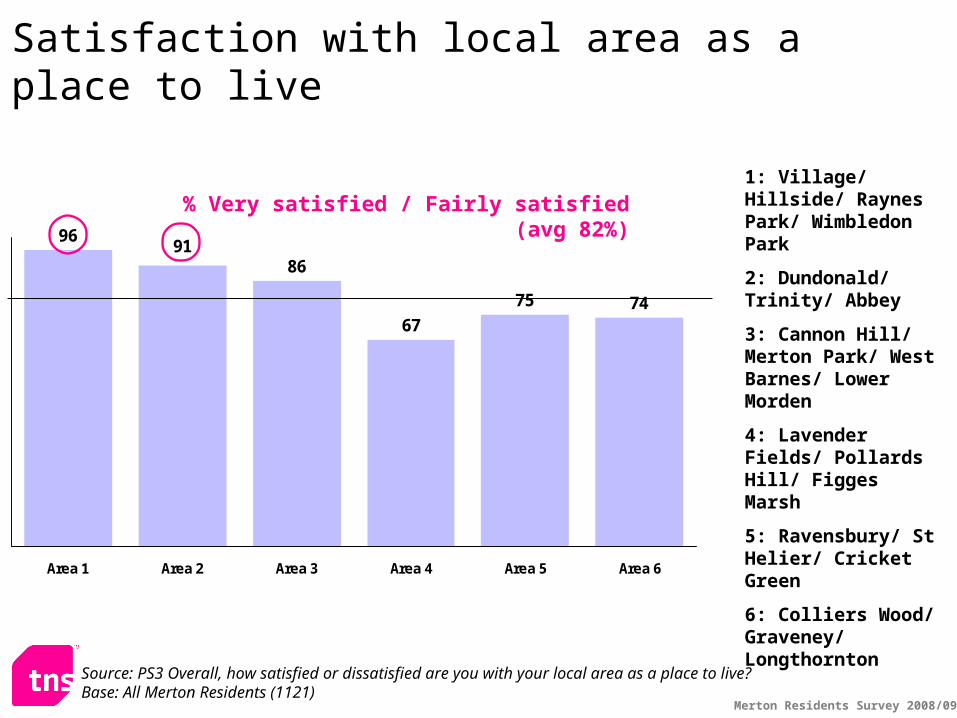
Satisfaction with local area as a place to live
6
9
56
26
4
%Very satisfied
Fairly satisfied
Neither
Fairly dissatisfied
Very dissatisfied
%
82%
8%
Source: PS3 Overall, how satisfied or dissatisfied are you with your local area as a place to live?Base: All Merton Residents (1121)
Significant differences
Black residents (91%)
Merton Residents Survey 2008/09
96
86
67
75 74
91
Area 1 Area 2 Area 3 Area 4 Area 5 Area 6
% Very satisfied / Fairly satisfied (avg 82%)1: Village/ Hillside/ Raynes Park/ Wimbledon Park
2: Dundonald/ Trinity/ Abbey
3: Cannon Hill/ Merton Park/ West Barnes/ Lower Morden
4: Lavender Fields/ Pollards Hill/ Figges Marsh
5: Ravensbury/ St Helier/ Cricket Green
6: Colliers Wood/ Graveney/ Longthornton
Satisfaction with local area as a place to live
Source: PS3 Overall, how satisfied or dissatisfied are you with your local area as a place to live?Base: All Merton Residents (1121)
Merton Residents Survey 2008/09
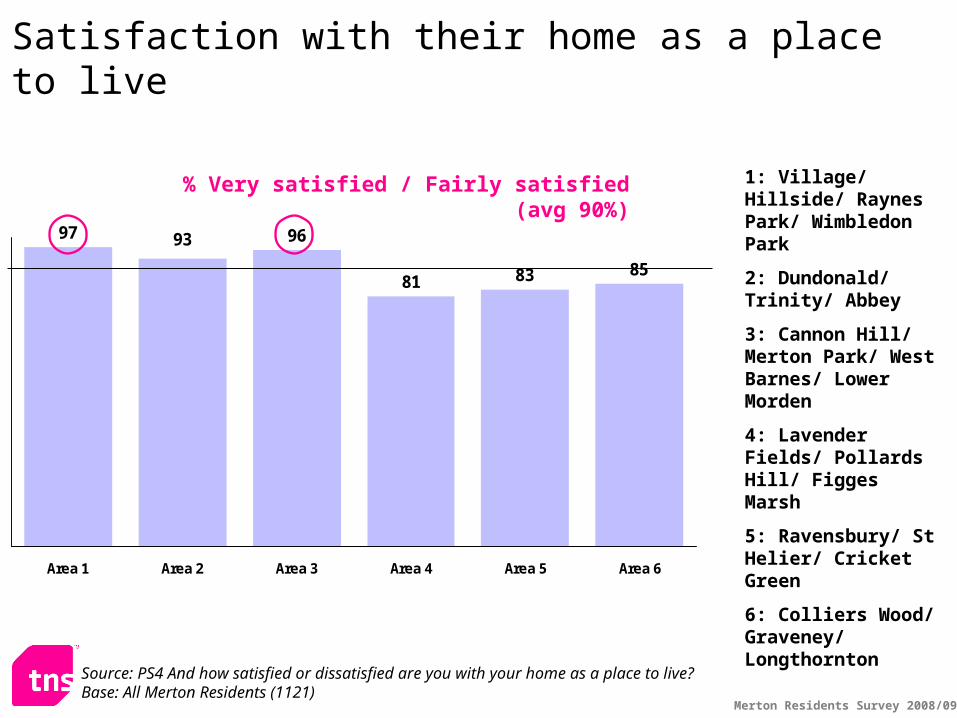
Satisfaction with their home as a place to live
45
45
435
%
Very satisfiedFairly satisfiedNeitherFairly dissatisfiedVery dissatisfied
%
90%
5%
Source: PS4 And how satisfied or dissatisfied are you with your home as a place to live?Base: All Merton Residents (1121)
Significant differences
AB residents (95%)
Council tenants (74%)
Merton Residents Survey 2008/09
97 96
81 83 85
93
Area 1 Area 2 Area 3 Area 4 Area 5 Area 6
% Very satisfied / Fairly satisfied (avg 90%) 1: Village/ Hillside/ Raynes Park/ Wimbledon Park
2: Dundonald/ Trinity/ Abbey
3: Cannon Hill/ Merton Park/ West Barnes/ Lower Morden
4: Lavender Fields/ Pollards Hill/ Figges Marsh
5: Ravensbury/ St Helier/ Cricket Green
6: Colliers Wood/ Graveney/ Longthornton
Satisfaction with their home as a place to live
Source: PS4 And how satisfied or dissatisfied are you with your home as a place to live?Base: All Merton Residents (1121)
Merton Residents Survey 2008/09
Yes43%
No18%
DK39%
Whether older people able to get services & support to continue living at home
Source: PS21 In your opinion, are older people in your local area able to get the services and support they need to continue to live at home for as long as they want to?
Base: All Merton Residents (1121)
Merton Residents Survey 2008/09
How well informed do you feel about what to do in the event of a large scale emergency?
38
32
5
3
21
%
Very well informedFairly well informedNot very well informedNot well informed at allDon't know
%
38%
59%
Falls among ABs (30%)
Source: PS12g How well informed do you feel about what to do in the event of a large-scale emergency e.g. flooding or human pandemic flu?
Base: All Merton residents (1121)
Crime and anti-social behaviour
Merton Residents Survey 2008/09
Worry about crime
21
19
24
21
38
38
41
46
13
14
13
12
23
26
18
18
3
4
31
42008
2007
2006
2005
%
Very worried Fairly worried Neither
Not very worried Not at worried DK
57%
65%
67%
Source: Q6 How worried are you about each of the following in Merton? …CrimeBase: All Merton residents (c1000)
59%
Merton Residents Survey 2008/09
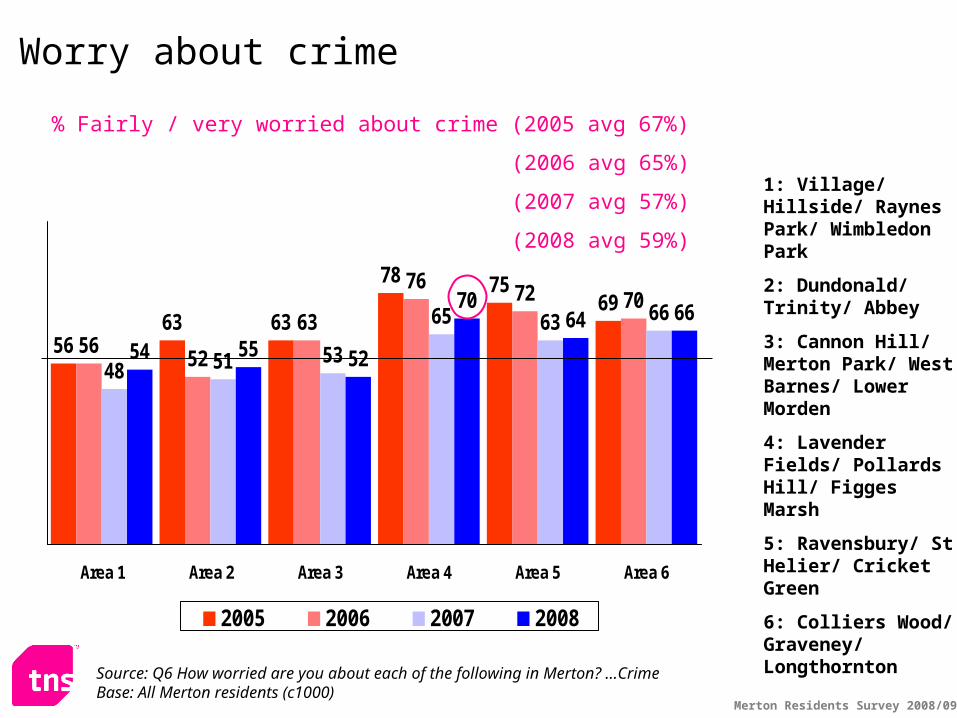
5663 63
78 7569
5652
63
76 72 70
48 51 53
65 63 66
54 55 52
7064 66
Area 1 Area 2 Area 3 Area 4 Area 5 Area 6
2005 2006 2007 2008
1: Village/ Hillside/ Raynes Park/ Wimbledon Park
2: Dundonald/ Trinity/ Abbey
3: Cannon Hill/ Merton Park/ West Barnes/ Lower Morden
4: Lavender Fields/ Pollards Hill/ Figges Marsh
5: Ravensbury/ St Helier/ Cricket Green
6: Colliers Wood/ Graveney/ Longthornton
% Fairly / very worried about crime (2005 avg 67%)
(2006 avg 65%)
(2007 avg 57%)
(2008 avg 59%)
Worry about crime
Source: Q6 How worried are you about each of the following in Merton? …CrimeBase: All Merton residents (c1000)
Merton Residents Survey 2008/09
21
20
26
21
38
42
40
45
14
12
11
11
23
25
19
18
2
4
3
1
1
1
1
32008
2007
2006
2005
%
Very worried Fairly worried Neither
Not very worried Not at worried DK
61%
65%
66%
Worry about anti-social behaviour
Source: Q6 How worried are you about each of the following in Merton? …Anti-social behaviourBase: All Merton residents (c1000)
59%
Merton Residents Survey 2008/09
5967
62
73 7365
54 54
6975 73
67
51
63
53
67 6571
5357 56
6762 62
Area 1 Area 2 Area 3 Area 4 Area 5 Area 6
2005 2006 2007 2008
% Fairly / very worried about anti-social behaviour (2005 avg 66%)
(2006 avg 65%)
(2007 avg 61%)
(2008 avg 59%)
1: Village/ Hillside/ Raynes Park/ Wimbledon Park
2: Dundonald/ Trinity/ Abbey
3: Cannon Hill/ Merton Park/ West Barnes/ Lower Morden
4: Lavender Fields/ Pollards Hill/ Figges Marsh
5: Ravensbury/ St Helier/ Cricket Green
6: Colliers Wood/ Graveney/ Longthornton
Worry about anti-social behaviour
Source: Q6 How worried are you about each of the following in Merton? …Anti-social behaviourBase: All Merton residents (c1000)
Merton Residents Survey 2008/09
15
14
18
16
23
22
27
27
18
18
18
15
30
32
24
28
6
10
8
6
8
3
5
82008
2007
2006
2005
%
Very worried Fairly worried Neither
Not very worried Not at worried DK
36%
45%
43%
Worry about drug users
Source: Q6 How worried are you about each of the following in Merton? …Drug usersBase: All Merton residents (c1000)
38%
Merton Residents Survey 2008/09
3038
42
54 52 50
3139 41
5853 52
2530 29
45 4247
29 2835
4943 46
Area 1 Area 2 Area 3 Area 4 Area 5 Area 6
2005 2006 2007 2008
% Fairly / very worried about drug users (2005 avg 43%)
(2006 avg 45%)
(2007 avg 36%)
(2008 avg 38%)
1: Village/ Hillside/ Raynes Park/ Wimbledon Park
2: Dundonald/ Trinity/ Abbey
3: Cannon Hill/ Merton Park/ West Barnes/ Lower Morden
4: Lavender Fields/ Pollards Hill/ Figges Marsh
5: Ravensbury/ St Helier/ Cricket Green
6: Colliers Wood/ Graveney/ Longthornton
Source: Q6 How worried are you about each of the following in Merton? …Drug usersBase: All Merton residents (c1000)
Worry about drug users
Merton Residents Survey 2008/09
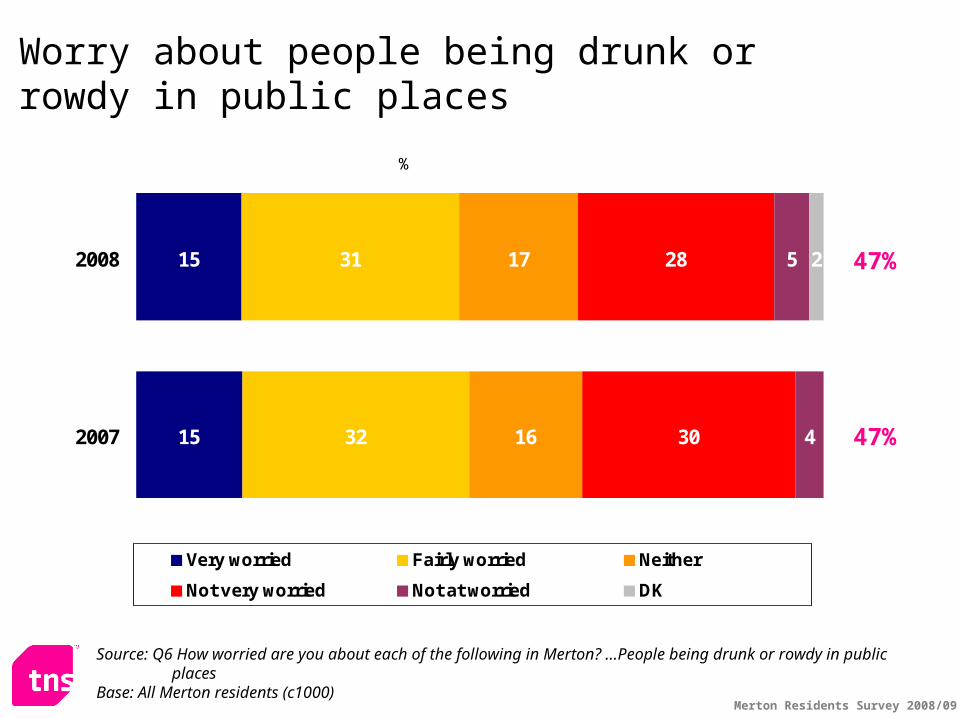
15
15
31
32
17
16
28
30 4
252008
2007
%
Very worried Fairly worried Neither
Not very worried Not at worried DK
47%
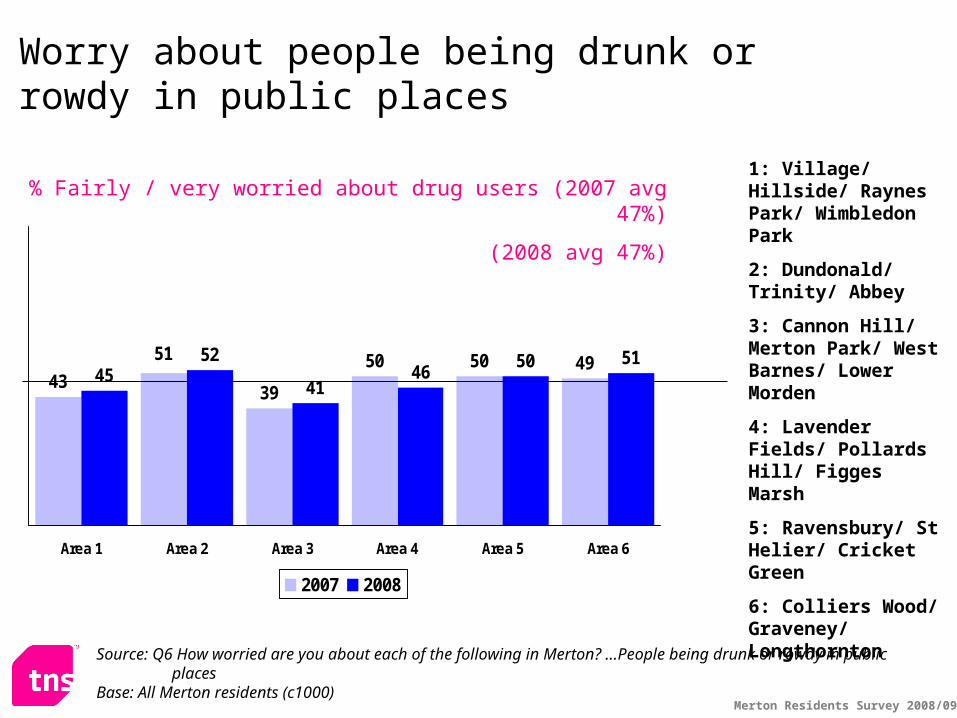
Worry about people being drunk or rowdy in public places
Source: Q6 How worried are you about each of the following in Merton? …People being drunk or rowdy in public places
Base: All Merton residents (c1000)
47%
Merton Residents Survey 2008/09
4339
50 50 4945
52
4146
50 5151
Area 1 Area 2 Area 3 Area 4 Area 5 Area 6
2007 2008
1: Village/ Hillside/ Raynes Park/ Wimbledon Park
2: Dundonald/ Trinity/ Abbey
3: Cannon Hill/ Merton Park/ West Barnes/ Lower Morden
4: Lavender Fields/ Pollards Hill/ Figges Marsh
5: Ravensbury/ St Helier/ Cricket Green
6: Colliers Wood/ Graveney/ Longthornton
Source: Q6 How worried are you about each of the following in Merton? …People being drunk or rowdy in public places
Base: All Merton residents (c1000)
Worry about people being drunk or rowdy in public places
% Fairly / very worried about drug users (2007 avg 47%)
(2008 avg 47%)
Merton Residents Survey 2008/09
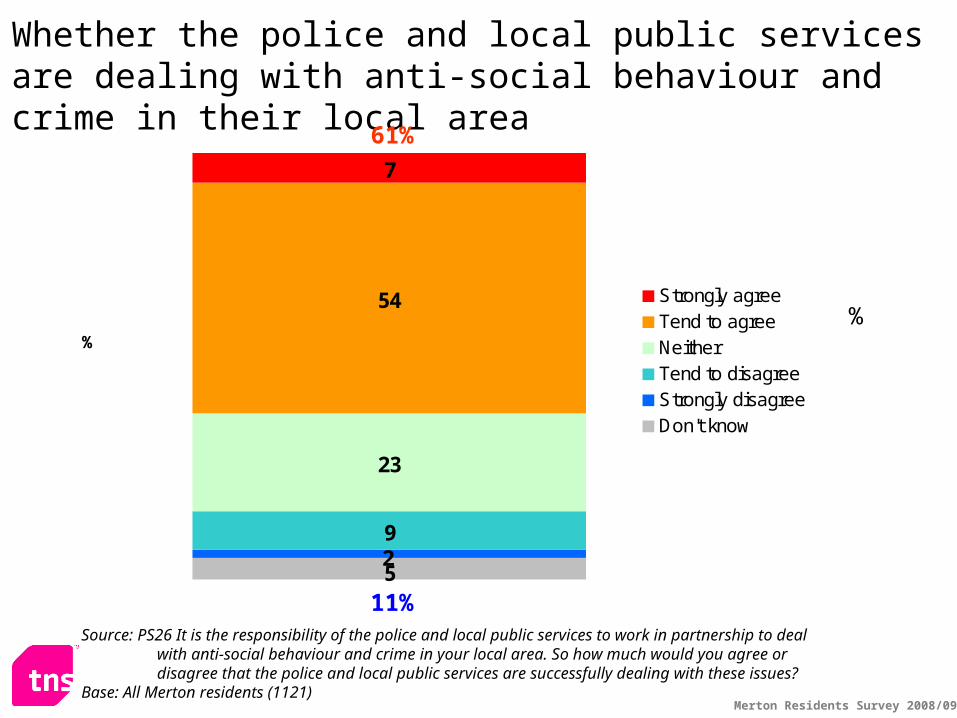
Whether the police and local public services are dealing with anti-social behaviour and crime in their local area
9
23
54
7
52
%
Strongly agreeTend to agreeNeitherTend to disagreeStrongly disagreeDon't know
Source: PS26 It is the responsibility of the police and local public services to work in partnership to deal with anti-social behaviour and crime in your local area. So how much would you agree or disagree that the police and local public services are successfully dealing with these issues?
Base: All Merton residents (1121)
%
61%
11%
Merton Residents Survey 2008/09
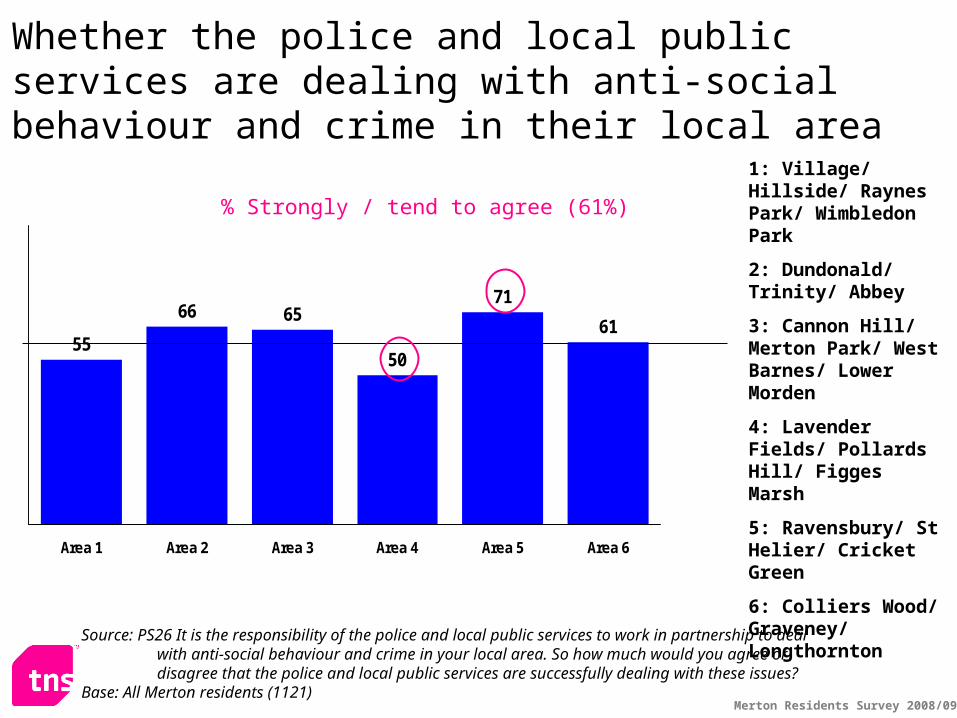
55
66 65
50
71
61
Area 1 Area 2 Area 3 Area 4 Area 5 Area 6
1: Village/ Hillside/ Raynes Park/ Wimbledon Park
2: Dundonald/ Trinity/ Abbey
3: Cannon Hill/ Merton Park/ West Barnes/ Lower Morden
4: Lavender Fields/ Pollards Hill/ Figges Marsh
5: Ravensbury/ St Helier/ Cricket Green
6: Colliers Wood/ Graveney/ Longthornton
% Strongly / tend to agree (61%)
Source: PS26 It is the responsibility of the police and local public services to work in partnership to deal with anti-social behaviour and crime in your local area. So how much would you agree or disagree that the police and local public services are successfully dealing with these issues?
Base: All Merton residents (1121)
Whether the police and local public services are dealing with anti-social behaviour and crime in their local area
Merton Residents Survey 2008/09
4
7
4
29
29
26
19
18
20
31
28
30
13
18
4
5
3
132008
2007
2006
%
Very informed Fairly informed Neither
Not very informed Not at all informed DK
37%
30%
How informed residents feel about what is being done to tackle anti-social behaviourSignificant fall from 2007
Source: Q7 How well informed do you feel about what is being done to tackle anti-social behaviour in your area?Base: All Merton residents (c1000)
33%
Merton Residents Survey 2008/09
32 29 29 28 3127
3631
47
28
4036
2834
3034
39 37
Area 1 Area 2 Area 3 Area 4 Area 5 Area 6
2006 2007 2008
% Fairly / very informed (2006 avg 30%)
(2007 avg 37%)
(2008 avg 33%)
1: Village/ Hillside/ Raynes Park/ Wimbledon Park
2: Dundonald/ Trinity/ Abbey
3: Cannon Hill/ Merton Park/ West Barnes/ Lower Morden
4: Lavender Fields/ Pollards Hill/ Figges Marsh
5: Ravensbury/ St Helier/ Cricket Green
6: Colliers Wood/ Graveney/ Longthornton
Source: Q7 How well informed do you feel about what is being done to tackle anti-social behaviour in your area?Base: All Merton residents (c1000)
How informed residents feel about what is being done to tackle anti-social behaviour
Tackling racism, social cohesion and respect
Merton Residents Survey 2007/08
Whether the council treats people in a fair and non-discriminatory way
Source: Q8 Do you agree that Merton Council treats people in a fair and non-discriminatory way?Base: All Merton residents (1121)
%
57%
8%
Merton Residents Survey 2007/08
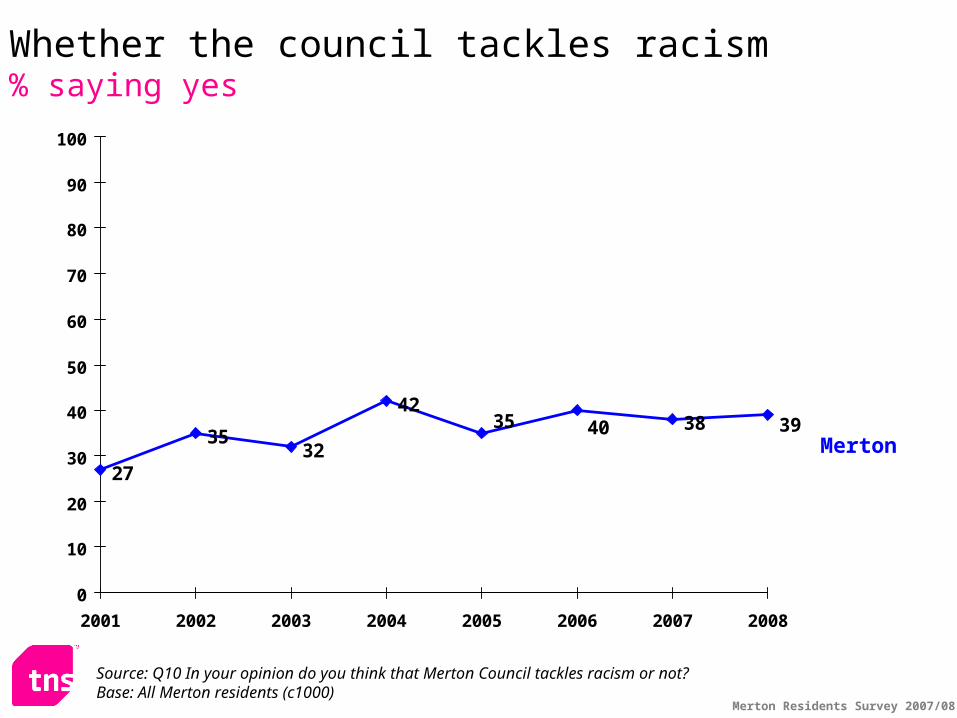
27
3532
4238 3935 40
0
10
20
30
40
50
60
70
80
90
100
2001 2002 2003 2004 2005 2006 2007 2008
Merton
Whether the council tackles racism% saying yes
Source: Q10 In your opinion do you think that Merton Council tackles racism or not?Base: All Merton residents (c1000)
Merton Residents Survey 2007/08
44 4129 24
16 1932
55
39 40 4022
WhiteBlack / Black-
BritishAsian / Asian-
British Mixed
%Yes
No
DK
Source: Q10 In your opinion do you think that Merton Council tackles racism or not?Base: All Merton residents (1121)
Whether the council tackles racism
Merton Residents Survey 2007/08
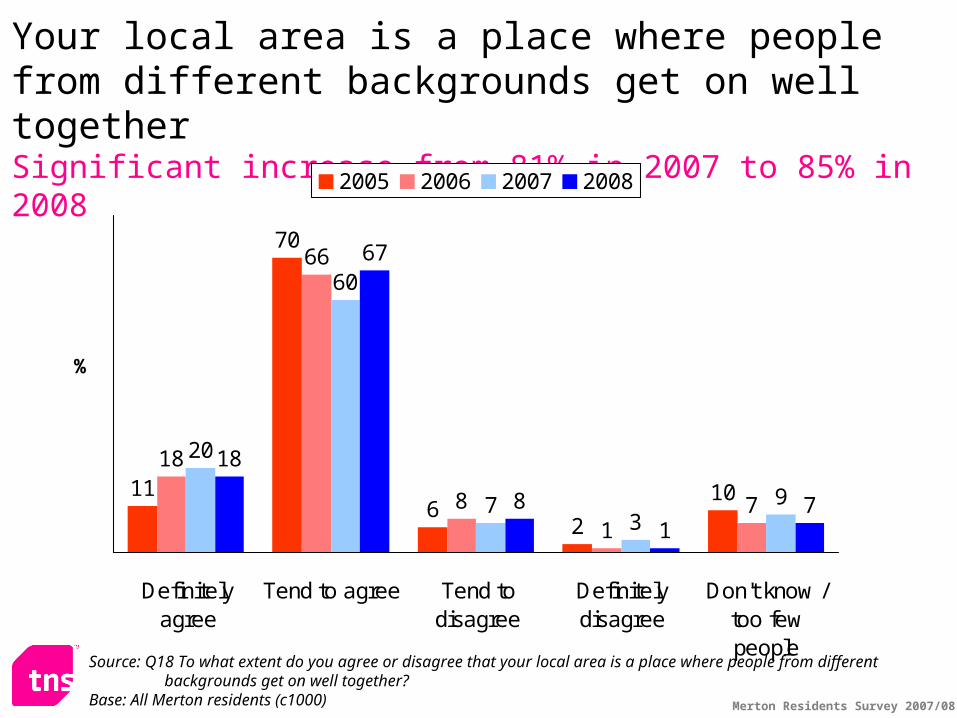
Your local area is a place where people from different backgrounds get on well togetherSignificant increase from 81% in 2007 to 85% in 2008
11
70
62
10
18
66
81
7
20
60
73
9
18
67
81
7
Definitelyagree
Tend to agree Tend todisagree
Definitelydisagree
Don't know /too fewpeople
%
2005 2006 2007 2008
Source: Q18 To what extent do you agree or disagree that your local area is a place where people from different backgrounds get on well together?
Base: All Merton residents (c1000)
Merton Residents Survey 2007/08
Your local area is a place where people from different backgrounds get on well together By ethnicity
2 17
66 72 6575
18 13 199
7 61 27 12 7
WhiteBlack / Black-
BritishAsian / Asian-
British Mixed
%Definitely agree
Tend to agree
Tend to disagree
Definitely disagree
DK / too few people
Source: Q18 To what extent do you agree or disagree that your local area is a place where people from different backgrounds get on well together?
Base: All Merton residents (1121)
85% 86% 85% 83%
Merton Residents Survey 2008/09
Whether treated with respect and consideration by local public servicesAll / most of the time = 68%
5
19
49
19
72
%
All of the timeMost of the timeSome of the timeRarelyNeverDon't know
Source: PS20 In the last year, would you say that you have been treated with respect and consideration by your local public services?
Base: All Merton residents (1121)
%
Merton Residents Survey 2008/09
22
57
10
5
6
%
Not a problem at allNot a very big problemA fairly big problemA very big problemDon't know
Source: PS19 In your local area, how much of a problem do you think there is with people not treating each other with respect and consideration?
Base: All Merton Residents (1121)
%
68%
28%
How much of a problem is people not treating each other with respect and consideration in local area
Merton Residents Survey 2008/09
81
6973
5664
56
Area 1 Area 2 Area 3 Area 4 Area 5 Area 6
% Not / not a very big problem (68%)1: Village/ Hillside/ Raynes Park/ Wimbledon Park
2: Dundonald/ Trinity/ Abbey
3: Cannon Hill/ Merton Park/ West Barnes/ Lower Morden
4: Lavender Fields/ Pollards Hill/ Figges Marsh
5: Ravensbury/ St Helier/ Cricket Green
6: Colliers Wood/ Graveney/ Longthornton
Source: PS19 In your local area, how much of a problem do you think there is with people not treating each other with respect and consideration?
Base: All Merton Residents (1121)
How much of a problem is people not treating each other with respect and consideration in local area
Community activity
Merton Residents Survey 2008/09
Whether can influence decisions affecting their local area
53
42
65
43
53
61
4854 51 50 4745
6257
49
58
4948
Area 1 Area 2 Area 3 Area 4 Area 5 Area 6
2006 2007 2008
1: Village/ Hillside/ Raynes Park/ Wimbledon Park
2: Dundonald/ Trinity/ Abbey
3: Cannon Hill/ Merton Park/ West Barnes/ Lower Morden
4: Lavender Fields/ Pollards Hill/ Figges Marsh
5: Ravensbury/ St Helier/ Cricket Green
6: Colliers Wood/ Graveney/ Longthornton
% Definitely / tend to agree (2007 avg 52%)
(2006 avg 51%)
(2008 avg 53%)
Source: PS13 Do you agree or disagree that you can influence decisions affecting your local area?Base: All Merton residents (c1000)
Merton Residents Survey 2008/09
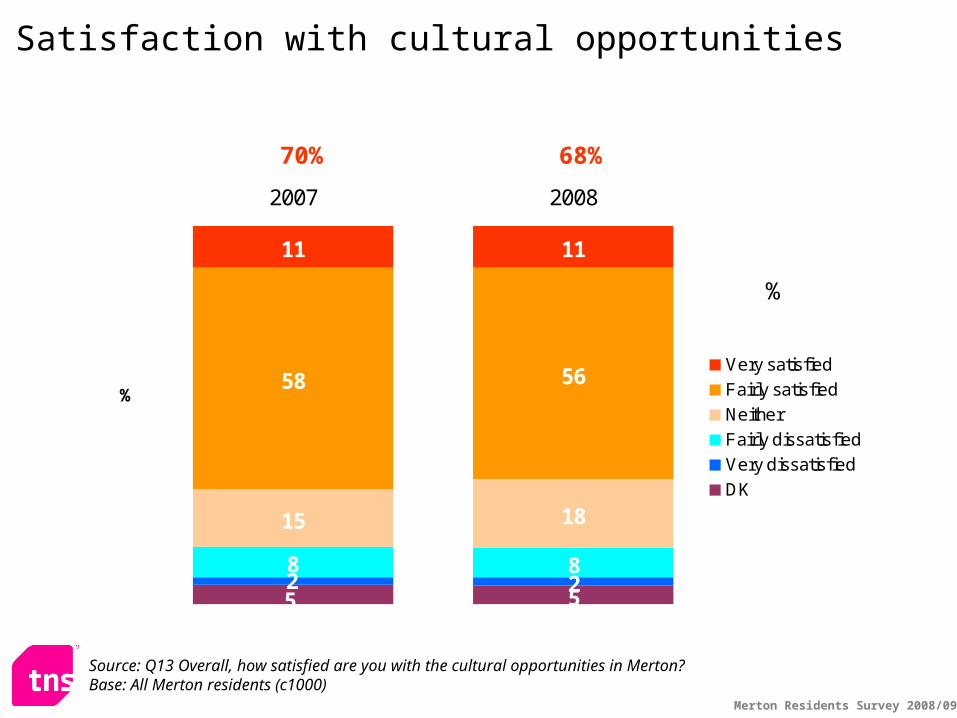
Satisfaction with cultural opportunities
528
15 18
58 56
11 11
528
2007 2008
%
Very satisfied
Fairly satisfied
Neither
Fairly dissatisfied
Very dissatisfied
DK
%
70%
Source: Q13 Overall, how satisfied are you with the cultural opportunities in Merton?Base: All Merton residents (c1000)
68%
Merton Residents Survey 2008/09
78 77
6169 67
75
59
71
59
726765
Area 1 Area 2 Area 3 Area 4 Area 5 Area 6
2007 2008
% Very / fairly satisfied (2007 avg 70%)
(2008 avg 68%)
1: Village/ Hillside/ Raynes Park/ Wimbledon Park
2: Dundonald/ Trinity/ Abbey
3: Cannon Hill/ Merton Park/ West Barnes/ Lower Morden
4: Lavender Fields/ Pollards Hill/ Figges Marsh
5: Ravensbury/ St Helier/ Cricket Green
6: Colliers Wood/ Graveney/ Longthornton
Source: Q13 Overall, how satisfied are you with the cultural opportunities in Merton?Base: All Merton residents (c1000)
Satisfaction with cultural opportunities
Merton Residents Survey 2008/09
3
2
2
2
2
1
1
Services in the local community
Local services for young people
Tenants' group decision makingcommittee
Tackling local crime problems
Regenerating the local area
Local health/education services
Been a local councillor
%
Source: PS16 In the past 12 months have you …?Base: All Merton residents (1121)
Involvement with groups that can make decisions affecting ….
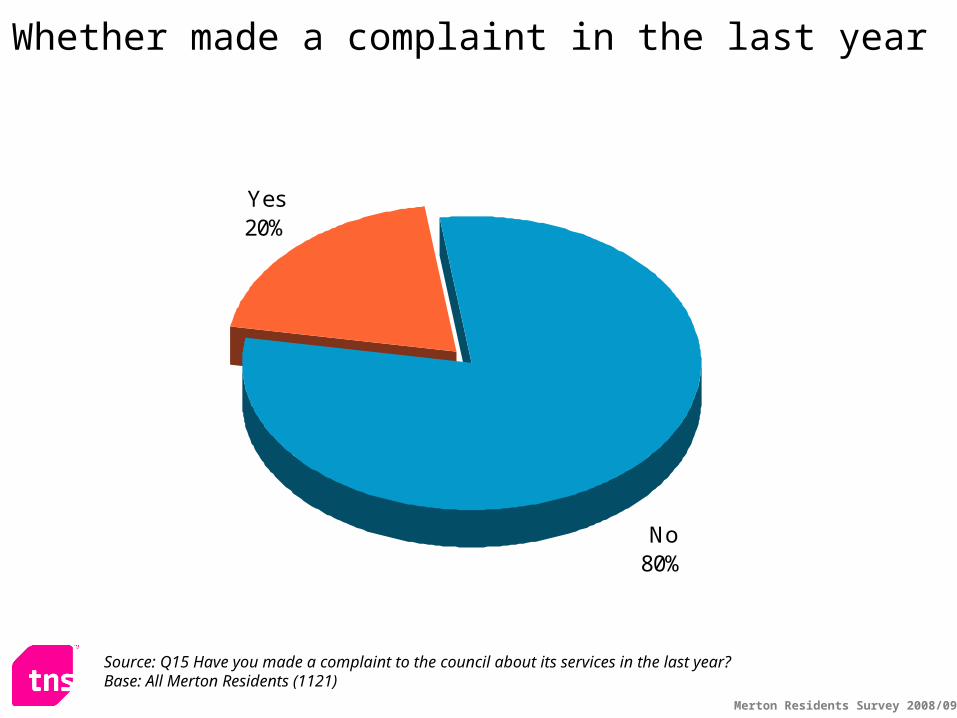
Complaints
Merton Residents Survey 2008/09
Yes20%
No80%
Whether made a complaint in the last year
Source: Q15 Have you made a complaint to the council about its services in the last year?Base: All Merton Residents (1121)
Merton Residents Survey 2008/09
Satisfaction with the way complaint was handled
33
10
20
10
1
26
%
Very satisfiedSatisfiedNeitherDissatisfiedVery dissatisfiedDon't know
Source: Q16 How satisfied were you with the way in which your complaint was handled?Base: All Merton residents who have made a complaint in the last year (226)
%
30%
59%
Sources of information
Merton Residents Survey 2008/09
Sources of information
53
36
34
32
31
27
19
17
17
16
15
15
11
5
5
4
3
2
My Merton - the Council magazine
BBC London television
www.merton.gov.uk
Metro
The South London Guardian
ITV London Tonight
The Post
London Paper
BBC London radio
Wimbledon Time and Leisure magazine
BBC London website
London Lite
Evening Standard
South London Press
LBC Radio
Radio Jackie
Choice FM
Grapevine
% mentioning
Source: Q14 Which, if any, of the following do you use to access information?Base: All Merton residents (1121)
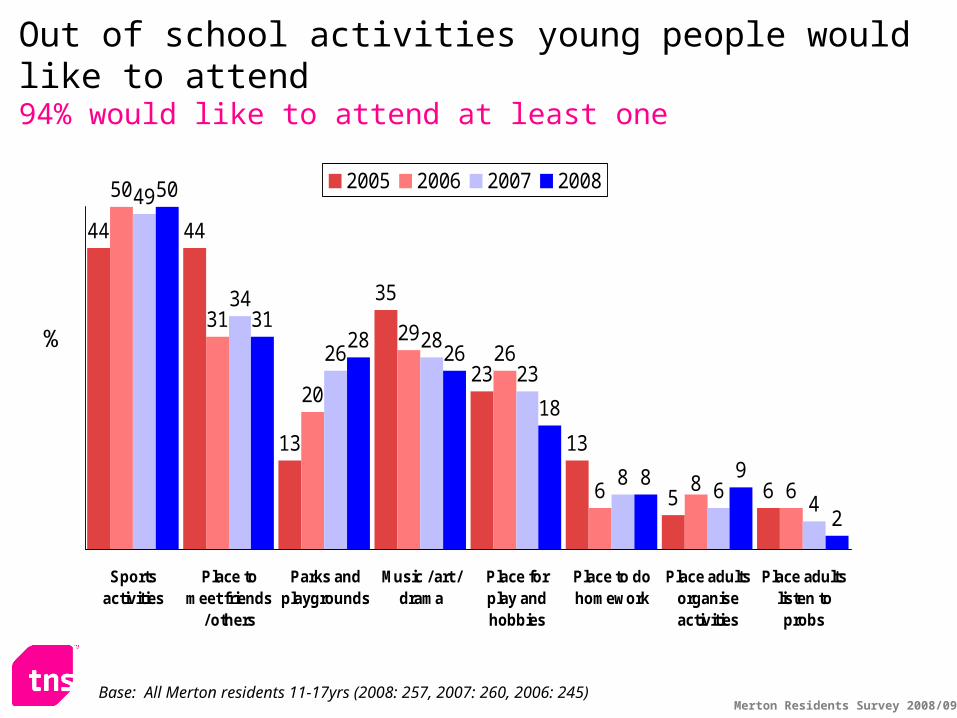
Young Persons Survey
Merton Residents Survey 2008/09
54
35
30
24
23
21
19
17
16
14
12
13
10
46
36
43
19
21
19
22
18
18
18
13
11
11
46
28
31
24
32
20
23
16
13
17
15
9
12
45
34
35
26
29
13
30
18
13
16
18
8
Crime
Bad behaviour
Bullying
Litter
Not enough done for youth
Pollution
Drug use / pushers
Education
Traffic
Public transport
Lack of recreational facilities
Lack of jobs
Health
2008200720062005
Areas of personal concern – Young peopleSignificant fall for bullying from 2007
Areas of personal concern 2008Young Merton residents Vs young Londoners
Base: All Merton residents 11-17yrs 257, London residents 11-17 yrs 254
%
Merton Residents Survey 2008/09
Areas of personal concern – social grade
Base: All Merton residents 11-17yrs (257)
%
23
23
25
24
41
18
35
15
Bullying
Pollution
AB
C1
C2
DE
Merton Residents Survey 2008/09
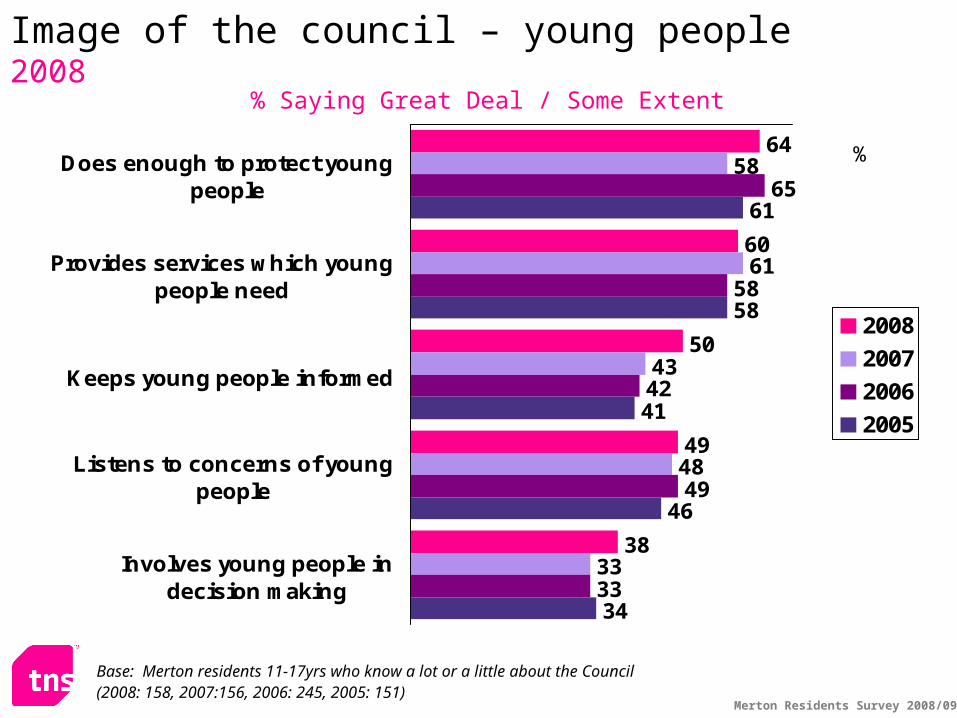
Image of the council – young people2008
% Saying Great Deal / Some Extent
64
60
50
49
38
58
61
43
48
33
65
58
42
49
33
61
58
41
46
34
Does enough to protect youngpeople
Provides services which youngpeople need
Keeps young people informed
Listens to concerns of youngpeople
Involves young people indecision making
2008
2007
2006
2005
%
Base: Merton residents 11-17yrs who know a lot or a little about the Council (2008: 158, 2007:156, 2006: 245, 2005: 151)
Merton Residents Survey 2008/09
Image of the council 2008 Merton Vs London
% Saying Great Deal / Some Extent
64
60
50
49
38
38
50
35
40
27
Does enough to protect youngpeople
Provides services which youngpeople need
Keeps young people informed
Listens to concerns of youngpeople
Involves young people indecision making
Merton
London
%
Base: Merton residents 11-17yrs who know a lot or a little about the Council 158; London residents 11-17yrs who know a lot or a little about the Council 139
Merton Residents Survey 2008/09
Perceived Service Delivery 2008 – Young people
10
7
5
9
9
12
14
15
18
4
19
15
24
11
6
72
72
63
63
62
58
56
56
55
54
50
42
41
39
27
Poor - Extremely Poor Good-Excellent
Difference from 2007
Primary schools
The police
Libraries
Public transport
Parks, playgrounds and open spaces
Local health services
Recycling facilities
Secondary schools
Leisure / sports facilities
Repair of roads/pavements/cycle paths
Street cleaning
Sixth form colleges
Arts and culture
Activities for young people
Social services for children and families
Base: All Merton residents 11-17yrs (2008: 257, 2007: 260)
0
+3
-4
-2
-1
0
-2
-1
-1
-4
-1
-7
-2
-3
-9**Sig
Merton Residents Survey 2008/09
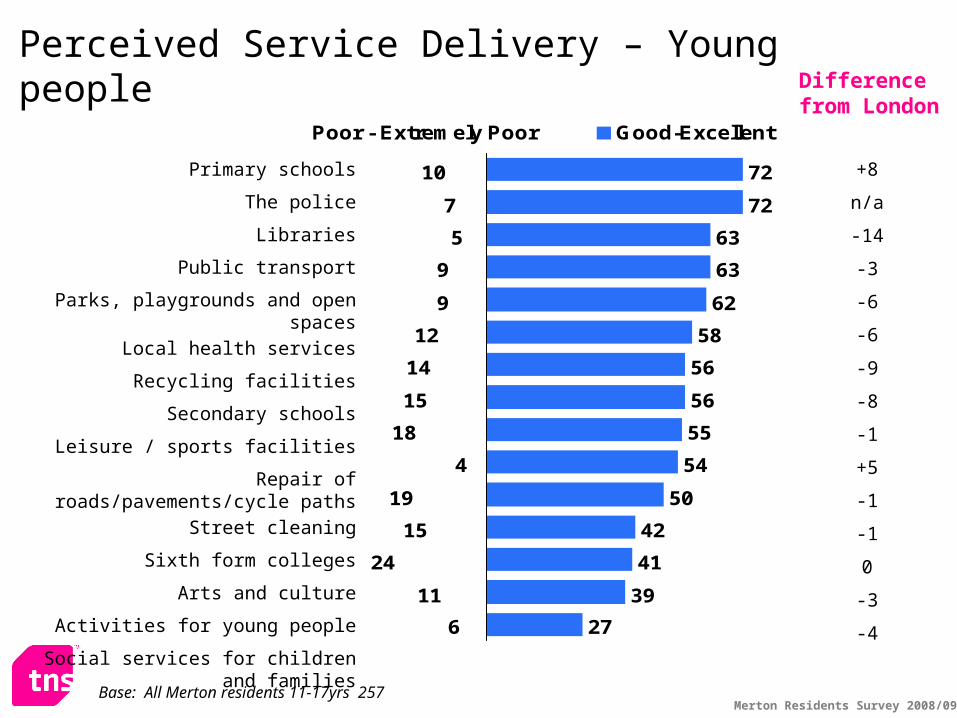
Perceived Service Delivery – Young people
10
7
5
9
9
12
14
15
18
4
19
15
24
11
6
72
72
63
63
62
58
56
56
55
54
50
42
41
39
27
Poor - Extremely Poor Good-Excellent
Difference from London
Primary schools
The police
Libraries
Public transport
Parks, playgrounds and open spaces
Local health services
Recycling facilities
Secondary schools
Leisure / sports facilities
Repair of roads/pavements/cycle paths
Street cleaning
Sixth form colleges
Arts and culture
Activities for young people
Social services for children and families
Base: All Merton residents 11-17yrs 257
+8
n/a
-14
-3
-6
-6
-9
-8
-1
+5
-1
-1
0
-3
-4
Merton Residents Survey 2008/09
Young people and political involvement
5
23
6
7
69
77
46
55
47
12
15
29
37
42
2
3
2
3
4
18Doing voluntary work
Voting in an election
Being a member of aschool council
Write to localcouncillor
Campaiging (march,protest, sign petition)
%Am doing/have done Might do in future Would never do this DK