1 San Diego State University, San Diego, California 2 California Polytechnic State University, Pomona, California 3 Pollution Research Group, University of KwaZulu-Natal, Durban, South Africa MeSai Loffe Submitted 08/01/2015 Solids Movement within the ABR system Mesai Loffe IRES Summer 2015 Durban, South Africa
Transcript
1San Diego State University, San Diego, California 2California Polytechnic State University, Pomona, California
3Pollution Research Group, University of KwaZulu-Natal, Durban, South Africa
Solids are settled, suspended, and dissolved matters in the ABR system. Solids can be
organic or inorganic matter. Analysing solids movement in the ABR system requires the
classifications of solids into four groups. . 1 Total Solids (TS) – It is the sum of settled,
suspended and dissolved solids. 2 Volatile solids (VS) is organic portion of the total solid that is
lost during ignition. 3 Total Suspended solids (TSS) – is the sum of dissolved and suspended
particles in the liquid portion of wastewater and 4 Volatile Suspended Solids (VSS) – is the
organic portion of the Total Suspended Solids (TSS) lost during ignition. TS, VS, TSS, and VSS
were analysed in all the three trains with respect to time, hydraulic loading and chamber size.
according to the data there is a strong relation between TS and VS in all the three trains with
strong correlation coefficient that are close to 0.98 for all three trains with statistical confidence
interval test of p-value of ≤ 0.05 which suggests a valid and stronger correlation between TS and
VS. TSS and VSS were analysed using two different methods: crucible and centrifuge. The result
shows higher dissolved solids in the ABR system and the TSS value goes up at higher flow rate.
Turbidity test also shows a high reading in turbidity in NTUs at high flow rate.
3
Introduction
According the pollution research group at the University of KwaZulu Natal, Anaerobic
Baffled Reactors (ABR) have been implemented by the German NGO BORDA as a standard
component of Decentralized Wastewater Treatment Plants (DEWATS) in Durban, South Africa
to treat wastewater in a highly dense areas that are not close to the centralized network.
According to SSWM, Anaerobic Baffled Reactors Is an improved septic tank with a series of
baffles under which the grey, black and industrial wastewater is forced to flow under and offer
the baffles from the inlet to the outlet. The increased contact time with the active microbial
sludge slayer results in an improved treatment. ABRs are robust(strong and safe) and can treat a
wide range of wastewater, but both remaining sludge and effluents still need further treatment in
order to be reused or discharged properly.
Figure 1-Newlands Mashu DEWATS Plant in Durban, South Africa
IRES summer research project was designed to analyse different parameters that affect
the operation of ABRs such as flowrate, Solid movement, Chemical Oxygen Demand, and
Volatile fatty Acid as a function of hydraulic loading and ABR size to determine the wastewater
Settler-2
Anaerobic Baffled Reactors
Train-3
Settlers-1
1
Train-1
Train-2
Anaerobic Filter
4
treatment quality and efficiency. The DEWAT plant was designed according to BORDA
guidelines (Sasse, 1998) to treat domestic wastewater from around 80 households. THE
Newlands Mashu DEWATS plant shown in figure-1 above consists of a settling Chamber/biogas
collector, 3 parallel ABR trains and 2 anaerobic filter (AF) modules. ABR train 1 and 2 have
seven identical chambers while ABR train 3 have 4 chambers shown below in figure 2 and 3.
In this project, the movement of solids within the ABR system was analysed with respect
to flowrate, hydraulic loading and chamber size. Solids are suspended, dissolved and settled
matters within the ABR system. We can divided solids into two groups depending on their
chemical properties: Organic and Inorganic solids. Organic solids are solids that made up of
Carbon, hydrogen, oxygen, nitrogen, phosphorous and few other elements. The inert compounds
Settlers Chamber Settlers Chamber
Figure 2 - Schematic representation of the seven Chambered ABR used in train 1 and 2.
Figure 3 - Schematic representation of the Four Chambered ABR used in Train 3.
5
that are not subjected to decaying are called inorganic. For this project, solids were classified
into four to simplify scientific investigation on the movement of solids within the ABR system. 1
Total Solids (TS) – It is the sum of settled, suspended and dissolved solids. 2 Volatile solids
(VS) is organic portion of the total solid that is lost during ignition. 3 Total Suspended solids
(TSS) – is the sum of dissolved and suspended particles in the liquid portion of wastewater and 4
Volatile Suspended Solids (VSS) – is the organic portion of the Total Suspended Solids (TSS)
lost during ignition.
Methodology
Solids movement within the ABR system involves analysis on total solids, volatile solids,
total suspended solids, volatile suspended solids and turbidity testing. In order to meet our goals
in a scientific manner, a control volume method was used to determine the gross characteristics
of solids within and across the boundary layers. Two meter long tube (Di of 10cm) with a
stainless steel hook was used to collect a total sample from Each ABR chambers. The sample
height within the column was measured and 20ml of the sample from each ABR was transferred
into a pre-dried and pre-weighted crucible and placed into an oven for 24 hours after the mass of
the sample was recorded. The crucible with the sample was removed from the oven after the 24
hours period and the weight was recorded prior to igniting it in a furnace for 2 hours. The weight
difference before and after the oven and furnace time was used to calculate the total and volatile
solids with respect to each ABR chambers.
6
Figure 4 - Schematic Representation on Total and Volatile Solids experiment
Total suspended solids and volatile suspended solid was analysed using two different
methods: centrifuge and Crucible. Sample was collected from each ABR at two different time in
a single day using 1-litter bottle attached to an end of 1.5m long wood stick. Sample from each
ABR chambers collected using 1-litter bottle attached to an end of stick was transferred into
1000 ml beakers. 30ml of the sample from each beakers was measured out using micro-pipet and
transferred into a pre-dried and pre-weighted crucible. The crucible with sample was oven dried
for 24 hours period and the mass difference before and after the oven time was used to calculate
the total suspended solids in each ABR system and this method was named the Crucible method.
7
Figure - 5 - Schematic Representation on Total Suspend Solids (Crucible Method)
The exact same sample used to determine total suspended solids using the crucible
method was used to analyse total suspended solids and suspended volatile solids in each ABR
using centrifuge method. 180ml of sample from each beakers was transferred into equal amount
of four separate 45ml centrifuge tubes. Each tube with the sample was centrifuged for 10
minutes at 10,000 relative centrifugal force (RCF) and the pellet that accumulate on the side of
the tubes was carefully washed out of the tubes with about 5-7ml of the sample in each
centrifuge tube and transferred into a pre-dried and pre-weighted crucibles. The weight before
and after the 24 hour oven time and 2 hours furnace time was used to determine total suspended
solids, and volatile suspended solids. Comparison used to analyse total suspend solids using the
centrifuge and crucible method gives us an insight view of the amount of dissolved solids in our
sample.
8
Figure - 6 - Schematic Representation on TSS and VSS (Centrifuge Method)
Finally, turbidity tube was used to measure the cloudiness of the sample. The quality of
the treatment depend on the turbidity of the effluent. Sample was collected from each ABR
chambers using 1-litter bottle attached to an end of 1.5m long wood stick and transferred into
1000ml beakers. These samples was pour into the turbidity tube in shaded area until the black
and white triangle at the bottom of the turbidity tube is no longer seen by the individual taking
the turbidity measurement. The height of sample is at this point is measured and used to calculate
the turbidity of the sample in NTUs.
Figure - 7 – Turbidity testing
9
Results
Total and Volatile Solids on Train-1 (experiment date 07/15/15)
Figure 8 – TS - VS – TS/VS with Respect to Chambers-Train-1
Figure 9 – VS with Respect to TS-Train-1
0
5
10
15
20
25
30
ABR1 ABR2 ABR3 ABR4 ABR5 ABR6 ABR7
Kg
Chambers
TS-VS-TS/VSwithRespecttoChambersTSVSTS/VS
y=1.7225xR²=0.9703
0
5
10
15
0 10 20 30
VS(K
g/Ch
ambe
r)
TS(Kg/Chamber)
VSwithRespecttoTS
𝑇𝑆!! = 93.7 Kg
𝑉𝑆!! = 55.4 Kg
TS/VS = 1.7
(TS/VS)-1 = 0.59
Correlation coefficient value of 0.9703. Confidence interval test gives p-value of 0.00002; therefore, the equation in relation to TS and VS is reliable to be used.
VSwithRespecttoTSCorrelation coefficient value of 0.9848. Confidence interval test gives p-value of 0.0002; therefore, the equation in relation to TS and VS is reliable to be used.
12
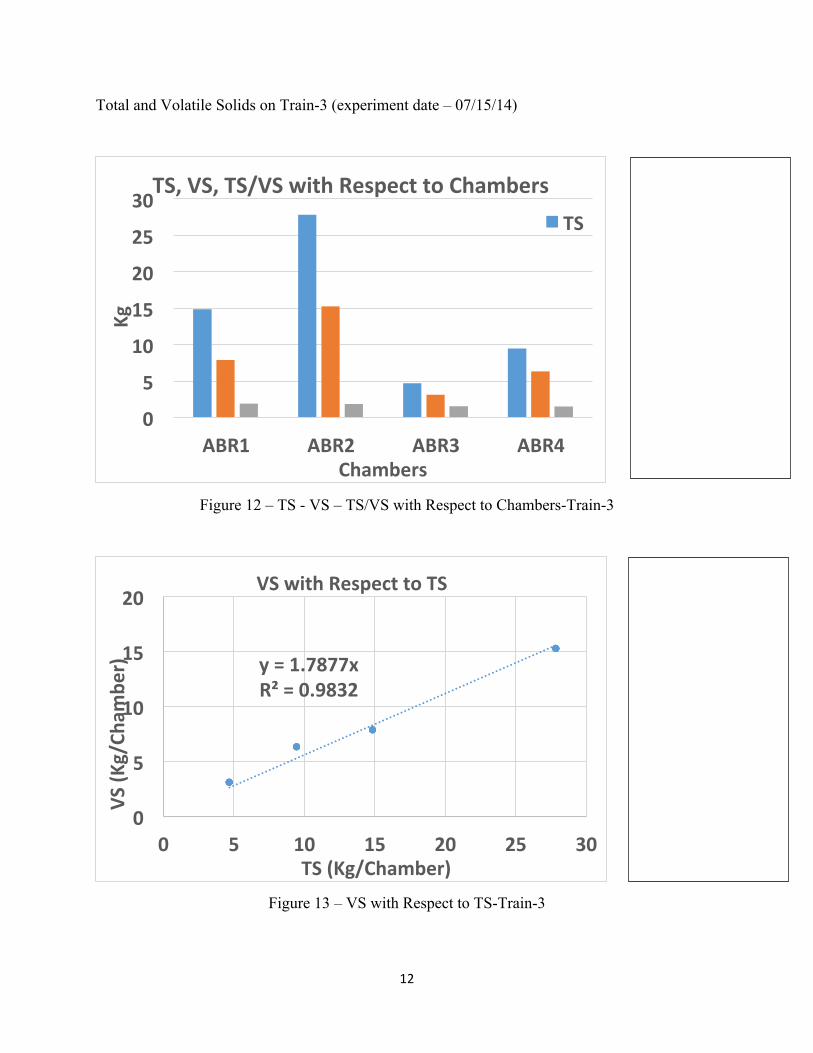
Total and Volatile Solids on Train-3 (experiment date – 07/15/14)
Figure 12 – TS - VS – TS/VS with Respect to Chambers-Train-3
Figure 13 – VS with Respect to TS-Train-3
0
5
10
15
20
25
30
ABR1 ABR2 ABR3 ABR4
Kg
Chambers
TS,VS,TS/VSwithRespecttoChambersTS
y=1.7877xR²=0.9832
0
5
10
15
20
0 5 10 15 20 25 30
VS(K
g/Ch
ambe
r)
TS(Kg/Chamber)
VSwithRespecttoTS
𝑇𝑆!! = 56.8 Kg
𝑉𝑆!! = 32.5 Kg
TS/VS = 1.74
(TS/VS)-1 = 0.57
Correlation coefficient value of 0.9703. Confidence interval test gives p-value of 0.0049; therefore, the equation in relation to TS and VS is reliable to be used.
correlation observed was valid and can be used to calculate volatile solids theoretically if total solids is determined
experimentally.
In train-2, the sum of the total and volatile solids is 102.4 kg and 60.2 kg respectively. The ratio of the two
is 1.7 which is similar to the value observed in train-1. Graphed Vs with Respect to TS shows a strong relation with
correlation coefficient of 0.9848. Ninety-five percent statistical confident interval test yield a p-value of 0.0002 that
is ≤ 0.05 which suggests that the relation observed between VS and TS is strong and can be used to determine VS
mathematically if TS is determined experimentally.
In Train -3, the sum of the total and volatile solids is 56.8 Kg and 32.5 kg respectively. The ration of TS/VS
is 1.74 and when it is rounded up to the same significant figure as the rest of the trains, it will end up 1.7. In all the
three trains, the TS/VS ratio stays constant at 1.7. When VS was plotted with respect to TS, strong relation was once
again observed with correlation coefficient of 0.9832. Ninety-five percent statistical confident interval test gives a p-
value of 0.0049 which is ≤ 0.05 and it confirms that the relation between VS and TS is valid and strong. VS can be
calculated if TS is known.
Train 1 and Train 2 are identical except train 2 has twice the hydraulic loading compare to train -1 and the
chambers in train 3 are twice as much as the chambers in trains 1 and 2. According to the data, chamber size and
hydraulic loading does not affect TS/VS ratio. In all the three trains, strong relation was observed between VS and
TS. VS can be calculated with fair accuracy from known TS value.
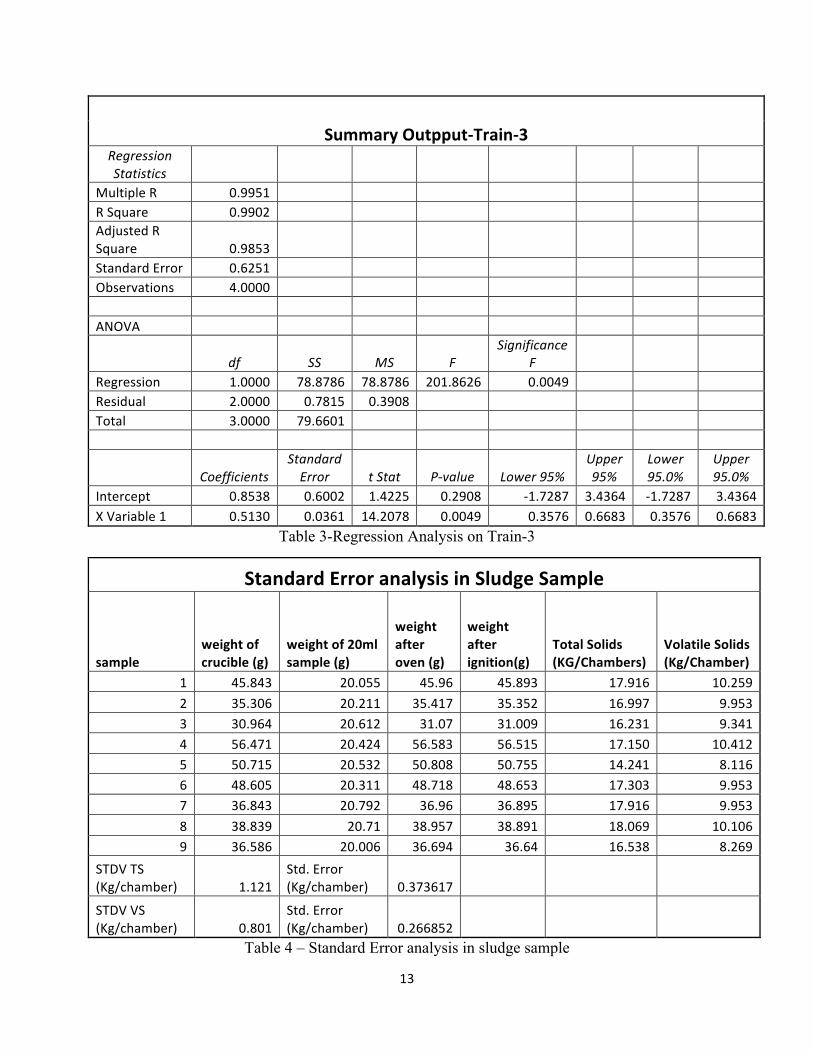
Sludge sample was obtained from train-1, chamber 4. Nine replicate from the same sample was analysed to
determine stand error and the variation in the sludge study. The results gives a standard deviation of 1.11
kg/chamber in TS and 0.801 Kg/chamber in VS. Stand error was calculated to be 0.374 in TS and 0.267 in VS.
Total Suspended solids and volatile suspended solids
Total Suspended solids were analysed using two different methods: crucible and centrifuge method.
Crucible method allows to obtain both suspended and dissolved solids in the ABR system using small amount of the
wastewater; however, the amount of solids obtain from this method is not enough to ignite. On the other hand, the
centrifuge method captures all the suspended solids in the sample from a large amount of wastewater. This method
generates enough solids and it allows to investigate the behaviour of volatile suspended solids in the system.
24
Centrifuge method does not precipitate out the dissolved solids in the sample, so the compares between the two
methods in terms of total suspended solids gives an idea on the amount of solids that are dissolved and suspended in
the wastewater. In train-1, there isn’t any significant change in total suspended solids obtained using both methods at
10:00 AM and 1:00PM. TSS and VSS also seem constant with respect to time. The flow rate of the system during
the sampling frame of time was in fact the same right around 10:00AM and 1:00PM which explains why no change
was observed In TSS and VSS using both method of analysis. Comparison between figure 14 and 15 gives an idea
on how much dissolved solids are present in the system. Figure 15 is a representation of total suspended solids
obtained using centrifuge method and the numerical value of TSS is around 100 mg/L in all chambers. Figure 14
shows TSS with respect to chambers obtained using the crucible method and the numerical values of TSS is around
400 mg/L in all the chambers. The concentration difference seen in these two methods is a result of total dissolved
solids in the system. High amount of dissolved solids was present throughout the system which contributes to the
turbidity of the wastewater in the system.
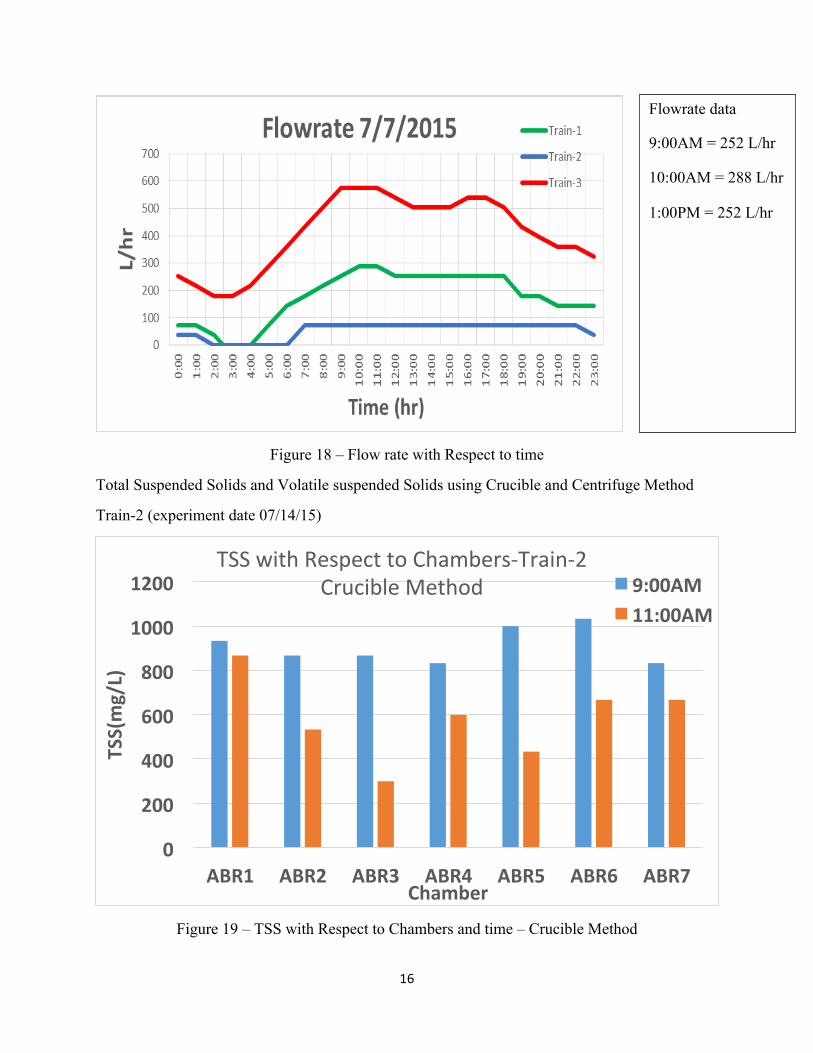
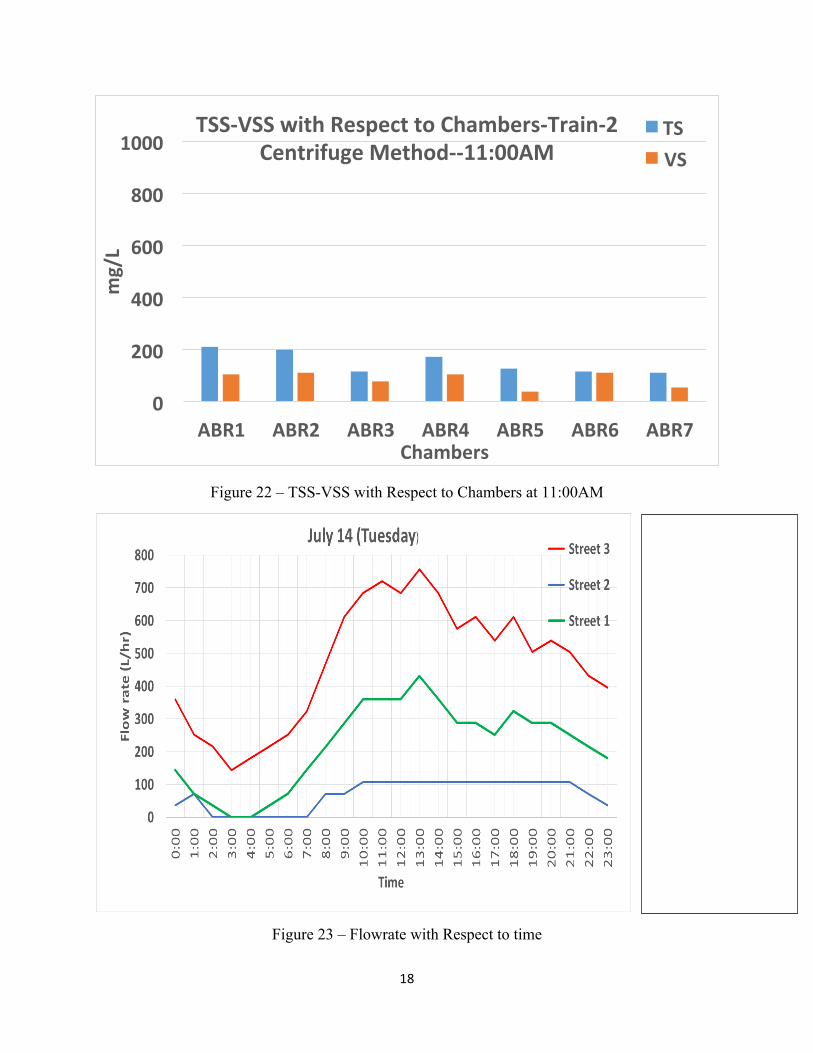
Figure 19 and 20 shows the profile of TSS in train-2. Notable change was observed in TSS using both
methods at 9:00AM and 11:00AM. High amount of TSS was seen at 9:00AM in both centrifuge and crucible
method. The flow rate at 9:00AM is 72L/HR meanwhile the flow rate at 11:00AM is 108 L/HR. At lower flow rate,
the contact time of the solids with the microbial layer is higher and as a result more solids are break down and
suspended in the wastewater. Once again, high amount of dissolved solids were seen in the system. There are more
dissolved solids at high flow rate. TS and VS obtained using centrifuge method were higher at lower flow rate and
lower at higher flow rate as represented in figure 21 and 22.
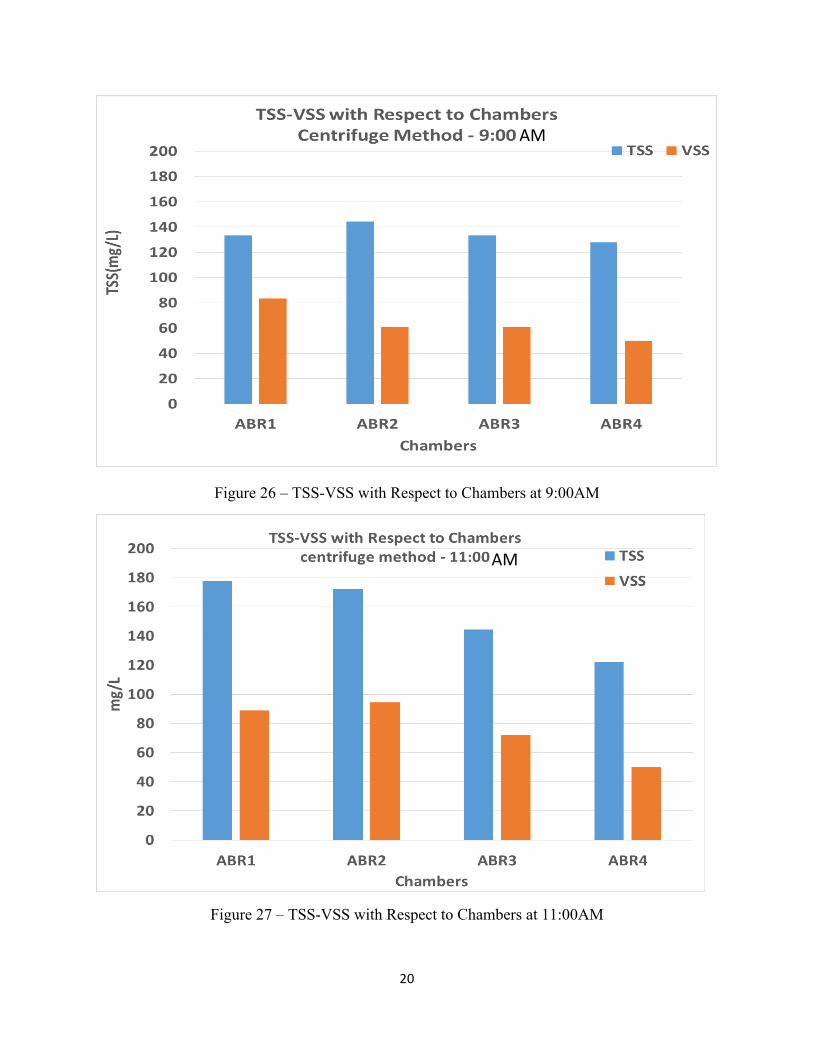
Train-3 shows the exact same behaviours seen in train 2. Figure 24 and 25 is a representation of the profile
of TSS with respect to time using crucible and centrifuge method. Figure 24 shows a higher TSS concentration at
lower flow rate. Figure 25 shows a constant TSS concentration with respect to flow rate using the centrifuge
method. Higher TSS and VSS concentration was observed at higher flow rate in figure 26 and 27.
25
Conclusion
In all three trains, there is a strong relation between volatile solids and total solids with
correlation coefficient of around 0.98. This value is tested for its validity using ninety five
percent statistical confidence interval test, it yield p-value ≤ 0.05 for all the three trains which
confirms the reliability of the result. If total solids are experimentally determined, volatile solids
can be calculated mathematically with precision. According to data, Hydraulic loading, and
chamber size does not any effect on the total and volatile solids in the ABR system. Total
suspend solids and volatile suspended solids stays roughly constant at constant flow rate. At
higher flow rate, Both TSS and VSS go up as a result of it. The difference between the crucible
and centrifuge method used to study the profile of TSS and VSS give insight view of the
distribution of dissolved solids with the ABR system. According to data, there is high amount of
dissolved solids in the ABR system which contributes to the turbidity of the fluid. Turbidity of
the wastewater go up at high flow rate.
26
References
1. Buckley, c; Pietruschka, B; Pillay, S. Evaluation of the DEWATS process for decentralised wastewater treatment. WRC Rsearch Report No. K5/2002, 2-11, 2002


![International Recommendations for Energy Statistics (IRES) · 2017. 10. 6. · Energy Statistics (IRES) United Nations. New York, 2016 [final edited version prior to typesetting]](https://static.documents.pub/doc/80x56/6003afa323ef2f357e64a90b/international-recommendations-for-energy-statistics-ires-2017-10-6-energy.jpg)
